Article

Drying of Food Waste for Potential Use as Animal Feed

by
Abdul Wasim Noori
1,2,
Mohammad Jafar Royen
1,2,
Alžbeta Medveďová
3 and
Juma Haydary
1,*
1
Institute of Chemical and Environmental Engineering, Slovak University of Technology in Bratislava, Radlinského 9, 81237 Bratislava, Slovakia
2
Faculty of Chemical Technology, Kabul Polytechnic University, Kart-e Mamoorin, Kabul 1001, Afghanistan
3
Institute of Food and Nutrition, Slovak University of Technology in Bratislava, Radlinského 9, 81237 Bratislava, Slovakia
*
Author to whom correspondence should be addressed.
Sustainability 2022, 14(10), 5849; https://doi.org/10.3390/su14105849
Submission received: 14 April 2022 / Revised: 9 May 2022 / Accepted: 11 May 2022 / Published: 11 May 2022

Abstract

:
A considerable part of food is wasted, causing investment capital loss as well as environmental pollution and health problems in humans. Indirect solar drying was applied to test the potential of drying and reusing this waste as a component of animal feed. The effect of weather changes on drying kinetics and the effective diffusion coefficient, dried feed nutritional composition, and microbiological analysis of the dried product were investigated. A convective laboratory dryer was used as a reference method. Weather conditions have a crucial effect on the use of solar drying; one sunny day with appropriate conditions can reduce the water activity of food waste to below 0.3 and moisture content to below 6%. Much better fitting of experimental and model drying curves was achieved considering sample shrinkage, applying a more complex solution of Fick’s second law combined with an optimization procedure. The studied food waste had a good combination of nutrients, such as protein, fat, and carbohydrates; however, the amount of protein in the dried food waste was found to be lower than that in regular feed, and therefore, adding a protein source is recommended. Autoclaving of fresh samples reduced the total microbial counts of dried samples by more than 50%.

1. Introduction

Generation and disposal of food waste (FW) is one of the most severe environmental problems around the world [1]. The increase in FW production is directly related to the improved living standards and population growth [2]. However, as the world’s population grows, the need for natural food sources increases. According to the World Food and Agriculture Organization (FAO) of the United Nations, one-third of the world’s food production, which is equivalent to 1.3 billion metric tons of these products, ends up as solid waste [3,4]. FW is a major cause of social, health, environmental, and economic problems worldwide [5,6]. It also presents investment capital loss in the cultivation, production, and processing stages. In many countries, FW is collected as a part of municipal solid waste (MSW), and it is then landfilled, producing large amounts of greenhouse gases, thus increasing the environmental impact associated with food production. However, due to its proteins, fats, vitamins, minerals, fiber, and carbohydrates content, it is a valuable source of these components. To avoid wasting these valuable products, and to create a healthy environment while reducing greenhouse gases, reuse and recycling of FW are matters of high importance [7]. Additionally, any reuse or recycling technology applied has to meet the criteria of sustainability and the circular economy to prevent further environmental damage.
Many studies on FW reuse have been published in recent years, presenting various methods of effective use of FW to produce useful products, including direct use of these raw materials in an unprocessed form as animals feed [8], biogas and biofuels [9,10,11], biomethane [12], solid fuel [13], biohythane [14], bioplastics [15], biohydrogen [16], etc. According to the Environmental Protection Agency (EPA) food recovery hierarchy [17], using food waste for feeding animals is recommended right after reducing sources and feeding people.
The shelf life of FW, similarly to that of food products, is very short. All processed (cooked) or unprocessed (fresh fruits and vegetables) FWs have a high moisture content, resulting in high water activity. Water activity is the ratio of the vapor pressure of water in the food in equilibrium with surrounding air media to the vapor pressure of distilled water under identical conditions. Higher water activity favors higher activity of microorganisms. Water activity values of 0.8–0.9 are suitable for bacteria growth; however, fungi can grow at lower water activities of 0.5–0.6 [18]; therefore, the critical water activity value is 0.5 as the activity of microorganisms is negligible below this value. FW contains not only non-pathogenic but also pathogenic microorganisms, causing problems during its harvesting, processing, transmission, and storage [19]. Therefore, to increase the shelf life of these valuable materials and their reuse as animal feed, they have to be processed by freezing, canning, or drying; however, freezing and canning are expensive methods [20].
The drying of FW is a suitable method for storing and prolonging its shelf life. Other advantages of drying include: easy and cheap transportation and packaging of dried FW, smaller storage space than for other processed FW, lower environmental load, and greenhouse gas reduction [21]. The relative humidity of ambient air plays an essential role in the shelf life of processed and unprocessed food products and FW. High ambient relative humidity causes early spoilage of crops [20]; low ambient relative humidity in geographical locations with dry climates ensures a longer shelf life of food waste, providing more time for FW processing before its spoilage.
Water content is the most important parameter as it causes food and agricultural product to spoil. Most of these products are seasonal, and thus they must be processed to be stored and to meet the needs of consumers during other seasons of the year. By drying, the amount of water in the products is reduced by the evaporation process and the water activity of the products decreases, thereby reducing spoilage [22].
Various drying methods, such as solar drying [23], convection drying [24], microwave drying [25], spray drying [26], vacuum drying [27], ultrasound drying [28], and fluidized bed drying [29], are used for agricultural products [30], medicinal plants [31], meat products [32], and FW [33]. However, some drying techniques are not suitable or economically beneficial for food waste drying. Among the drying methods, radiative–convective drying seems to be the most effective method for food waste drying, but because of their high energy requirements, convective dryers have to be connected to a cheap energy source, such as solar energy, for the drying process to be economically and environmentally acceptable and to meet the criteria of sustainability.
Research in the field of FW drying has mostly focused on the drying of single-source wastes, for example, treated sardine waste [34], tomato pomace waste [35], mango waste [36], olive pomace waste [37], etc. Research on mixed FW drying and evaluation of dried products as potential animal feed are limited. In [36], a solar boiler dryer and a radiative–convective solar dryer for FW drying were designed and tested. The effect of temperature on the nutritional value reduction of dried FW was also evaluated, showing that products dried by the solar boiler dryer have a better quality than those produced by the radiative–convective dryer. No research data on the effect of weather conditions, such as air relative humidity and solar drying process conditions, on the nutritional and microbial characteristics of dried FW are available. However, the efficiency of active (forced) indirect solar dryers (AISD) in reducing the microbial load of dried crops and nutritional value preservation in agricultural and food products has already been studied [38,39,40,41,42,43]. The AISD system was tested in our previous works on drying tomato slices and mint leaves [44,45].
Ambient air relative humidity is one of the most important parameters affecting the survival of pathogenic microorganisms in FW during transportation and processing. Air relative humidity affects the FW water activity. The time between waste generation and its processing is another important parameter affecting waste contamination. Waste can also be spoiled during the drying process if the drying time is too long and/or if the drying conditions are not appropriate. Therefore, information on drying kinetics is crucial. Effective moisture diffusivity is a parameter enabling the calculation of drying time. In the case of solar drying, its value can be affected by the weather conditions. The local climate of the FW solar drying installation is very important; in locations with non-appropriate climate conditions, FW can be spoiled before drying and cause health and odor problems. The location where this research was carried out (Kabul, Afghanistan) is characterized by low air relative humidity (10–30% in summer, 20–50% in winter) and many sunny days per year (300 days/year). Large amounts of FW, not mixed with other waste, is generated by a high number of wedding halls, providing ideal conditions for FW reuse as animal food components using solar energy.
The objective of this work was to determine (i) the potential of food waste from Kabul wedding halls to be processed by a sustainable method to animal feed using solar energy in a convective solar drying system, (ii) the effect of changes in weather conditions on the process kinetics and product water activity, and (iii) the nutritional value and microbiological safety of the dried food waste.

2. Materials and Methods

2.1. Food Waste Source Identification

Wedding halls are the biggest source of FW produced in Afghanistan. According to our survey carried out in September 2020 and the information provided by the Kabul municipality and the Kabul association of hoteliers, there are 121 registered wedding halls in Kabul alone (capital of Afghanistan). All surveyed halls have different capacities, from 500 to 6000 people. On average, each hall hosts 120 weddings, engagements, Quran recitations, circumcisions, and birthday parties per year. The average number of participants (guests) in each party is 1000 persons. For medium food menus, 1.5 kg of food (appetizer, complimentary food, salad, fruit, and dessert) for each person is considered. On average, 33% of the total amount of food is wasted, which includes 4% raw (unprocessed) FW and 29% cooked FW (leftover after food consumption). Around 5% of the total FW is re-used as food by hall staff. Thus, around 18.7 metric tons of food is wasted by all 121 wedding halls every night, which sums up to more than 6825 metric tons per year of FW. Since there is no standard waste management, this waste is not disposed of by standard disposal methods but is dumped in wild landfills and can cause health, environmental, and economic problems for the society. A sustainable recycling method for this waste could prevent environmental and health damage as well as resource loss.

2.2. Sample Preparation

First, all kinds of FW from plate leftovers, tablecloths, and kitchen waste, including cooked food (rice, bread, noodles, meat, spaghetti, beans, mung bean, and peas), vegetables or uncooked FW (onion peels, potato peels, coriander stems, mint stems, green peppers, tomatoes, eggplant peels, cucumber peels), and fruit waste (melon peel, watermelon peel, apples, apricots, etc.) were collected. The waste was collected from three different halls, and it included the main parts of the food menus from all wedding halls. Since menus of all events organized in the wedding halls are very similar, the mixed collected sample was considered as a representative sample of FW produced by wedding halls. During the collection, the materials were kept in a refrigerator to prevent them from spoiling. Then, the waste was ground with an ordinary meat grinder and homogenized by mixing. For the first series of experiments, the waste was not autoclaved; for the second series of experiments, the samples were autoclaved for 20 min using an autoclave LABOKLAV 55-195 (SHP Scientific Ltd., Cambridge, UK) at 121 °C and 120 kPa. Non-autoclaved and autoclaved samples were extruded using a hand-operated extruder with holes with a diameter of 5 mm. Finally, the samples were weighed on a digital balance with the capacity ranging from 0.01 up to 500 g and ±0.01 g precision.

2.3. Solar Drying System

An energy-independent active indirect solar drying (AISD) system was used for FW drying. The drying system consisted of three basic parts (Figure 1): rectangular drying chamber, flat solar collector, and photovoltaic (PV) solar system for air blower and exhaust fan power supply. Dimensions of the drying chamber were 1200 × 600 × 400 mm; for the flat solar collector, they were 1500 × 600 × 100 mm; and surface area was 0.9 m2. A 240-watt photovoltaic (PV) solar panel provided power for collector inlet direct current (DC) centrifugal air blower, and chamber outlet DC exhaust fan. The drying chamber included four metal mesh wooden framed trays placed 15 cm from each other. The chamber had a capacity of 500 g of ground FW in each run. A 10.5 m-long aluminum pipe with a rectangular cross-section of 55 × 35 mm constituted the main part of the flat solar collector. The pipe surface was coated with a sun-absorbing layer. Air flow rate into the dryer was obtained and controlled by a DC centrifugal air blower and a DC exhaust fan. The air flow rate was estimated based on air velocity measured inside the aluminum pipe. Air flow in the chamber due to leakage was not considered. Temperatures at the collector inlet and outlet and chamber inlet and outlet were measured using J-type thermocouples. Air relative humidity was measured by psychrometric measurement of dry- and wet-bulb temperatures.

2.4. Convective Batch Drying System

The conventional convective batch laboratory tray dryer (Figure 2) consisted of a horizontal rectangular stainless-steel tunnel (2000 × 450 × 400 mm), four drying trays, axial fan with maximum frequency of 2500 rpm, airflow sensor range of up to 150 L s−1, continuous weight balance with the maximum range of 5 kg, 3 kW heating elements, controlling system, and temperature and pressure monitoring system. The drying chamber was made of a stainless-steel layer covered with aluminum sheets. To obtain the required air velocity, an axial-flow fan was installed in the inlet of the drying tunnel. The dryer was equipped with pressure, temperature, air humidity, air velocity, and fan frequency sensors. Temperature was measured in different positions (tunnel inlet, behind the heater, in front of the drying chamber, behind the drying chamber). All sensors were connected to a computer, and the data were recorded for each time interval.

2.5. Experimental Procedure

At the beginning of each experiment, the devices were thoroughly cleaned. Solar dryer chamber, trays, collector surface, and photovoltaic solar panel surface were washed with tap water. Drying chamber and trays of the convective batch dryer were cleaned and prepared for loading. The initial moisture content and water activity (aw) of ground samples of FW were also measured using an analytical moisture analyzer (capacity: 0.001–160 g, VWR, Milan, Italy) and an aw analyzer (LABTOUCH-aw SET ADVANCED, Novasina AG, Lachen, Switzerland), respectively.
The first sample was weighed and placed in the AISD system while the second sample was placed in the laboratory batch convective dryer. By turning on the devices, the drying process started.
For the solar dryer: Experiments were carried out on three consecutive days from September 9 to 12, 2020, in Kabul, Afghanistan, from 09:00 AM to 03 or 05 PM when equilibrium moisture content of dried FW was reached. Ambient temperature varied between 28 and 37 °C, atmospheric pressure was around 82 kPa, air relative humidity varied from 12 to 35%, and sun radiation from 50 to 1100 W·m−2. All parameters, such as temperature (ambient, collector outlet, chamber outlet), pressure (ambient), air humidity (ambient, collector outlet, chamber outlet), air flow rate, sample weight, aw, and moisture content, were recorded every hour from the beginning to the end of the drying process. For the second series of experiments (autoclaved samples), to save time, these parameters were not monitored every hour. Dried autoclaved samples were used for microbial analysis only.
To test the reproducibility of solar drying experiments, one more experiment was performed for a different time period and under similar weather conditions as in the second experiment using a similar waste mix with the same initial moisture content. Differences in air temperature, air relative humidity, final product moisture content, and final product activity were analyzed, and relative standard deviations (RSD) were calculated using Equations (1) and (2):
S = 1 n 1         i = 1 n ( x i x m e a n ) 2
RSD = S x m e a n   100
where n is the number of experimental points, S is standard deviation, xi is the value of measured parameter for experiment i, and xmean is the arithmetic mean of all experimental points.
For the batch convective dryer: A reference experiment was carried out at the same time in a conventional convective batch laboratory tray dryer. The dryer temperature was set to 55 °C, air flow rate was 25 L s−1, and initial material layer thickness was the same as in the solar dryer (5 mm). The dryer was first run without the sample for about 10–15 min to set the desired conditions. After achieving optimum drying conditions, the sample was placed inside the tunnel of the dryer, and the drying process was started. During the drying process, temperature at different positions of the tunnel, air flow rate, air relative humidity, sample weight, and ambient parameters such as temperature, pressure, and air humidity were recorded every 2 min. Water activity and moisture content of dried product were not determined during the experiment.

2.6. Dried Product Analysis

2.6.1. Protein Determination

Protein determination was carried out using the Kjeldahl method. In the first step, the amount of nitrogen in the sample was determined with 0.5 g of powdered dry food waste digested in a Kjeldahl flask in the presence of 20 mL of concentrated H2SO4 and 0.2 g of catalyst (CuSO4). By placing the digester tube in the VELP Scientifica™ DK Series Kjeldahl Digestion Unit (Velp Scientifica™ F30100188, Usmate Velate, Italy), the digestion process was started. Digestion temperature was set to 420 °C, and the samples were boiled for 220 min until a clear light-green solution was obtained. After the digestion, the digested sample was cooled at room temperature and distilled in the VELP Scientifica™ UDK 149 Automatic Kjeldahl Distillation Unit (Velp Scientifica™ F30200140, Italy). The distillate solution containing Tashiro’s PH indicator was titrated with 0.1 mol L−1 HCl, and the titration volume was corrected by back titration using a 0.1 mol L−1 solution.
Using the Kjeldahl method, nitrogen content was determined primarily, and then it was multiplied by a conversion factor that showed the ratio of protein to nitrogen in the food. For mixed food, the value of conversion factor was 6.25 [46].

2.6.2. Fat Determination

Fat (lipid) content of dry FW was determined by the Twisselmann extraction method [46], which is a continuous method that uses extraction of food lipids from the food to an organic solvent at high temperatures. Here, 3 g of each powdered dry sample was weighed on an analytical digital balance and put into fat-free thimbles. The thimbles were plugged with cotton wool, and the samples were placed inside the extractor thimble flask of the serial extraction apparatus behrotest® for Soxhlet-Fat-Extraction (Model: 804880034, R 256 S, extraction unit with six in-line sample positions, 250 mL, Behr Labor-Technik GmbH, Düsseldorf, Germany) extraction systems with linear sample configuration. Petroleum ether with a boiling point of 60–80 °C was used as an extractor solvent, and it was poured into the oil flasks. The extractor temperature was set to 70 °C for the whole 7 h of extraction. At the end of the experiment, petroleum ether was collected in the upper condenser chamber of the extractor. Subsequently, the oil flasks with extracted fat were transferred to a specific conical heater (100 °C) for residual ether evaporation. After the oil flasks were cooled in desiccators, they were weighed, and the percentage of fat was calculated.

2.6.3. Ash Determination

To determine the ash content of FW, 4 g of each dried sample was weighed in a metal crucible and made smoke-free and charred using a gas burner in a ventilated chamber. The crucibles were then placed in a muffle furnace (Nabertherm LE 1/11 Muffle furnace, Model: 04747, Lilienthal, Germany) and heated at 550 °C for 7 h until the sample was converted into light-gray ash. After burning of the samples, the crucibles were transferred to desiccators for cooling to room temperature. Subsequently, the weight of the cooled crucibles containing ash was recorded, and the percentage of ash based on original sample was calculated.

2.6.4. Moisture Determination

Moisture content of dry FW was determined using an analytical moisture analyzer (VWR MBT160 moisture analyzer, VWR International, Italy, capacity: 0.001–160 g), weighting 3 g of each sample in a disposable aluminum weighing pan. The analyzer temperature was set to 130 °C for 2 h for moisture analysis, and the moisture content was determined as a ratio of the weight of evaporated water to that of the original sample.

2.6.5. Carbohydrate Determination

Carbohydrate content was estimated by the difference using Equation (3):
Carbohydrate   ( % ) = 100 ( moisture   ( % ) + protein   ( % ) +   fat   ( % ) + ash   ( % )
All composition analyses were carried out at least three times to ensure the repeatability of the measurement and to estimate the measurement error.

2.7. Microbial Analysis

From each series of experiments (non-autoclaved and autoclaved), two samples were taken for microbial analysis. The samples were placed in sterilized bottles, which were hermetically sealed and kept in dark and dry environment until the microbiological determination. From each sample, 5 g was aseptically taken and examined by the microbiological cultivation method using ten-fold dilution in peptone saline solution according to [47]. Counts of selected microbial groups were determined on specific media and at defined incubation conditions. The total microbial counts (TMC) were determined on Total Counts Agar (TCA; Merck, Darmstadt, Germany) with incubation at 30 ± 1 °C for 72 h according to [48]. Counts of total coliforms and E. coli were determined on Chromogenic Chromocult coliform agar (Merck, Darmstadt, Germany) with aerobic incubation at 37 ± 1 °C for 24 h according to [49]. Presumptive counts of S. aureus were determined on Baird-Parker medium (Merck, Darmstadt, Germany) incubated aerobically at 37 ± 1 °C for 48 h according to [50]. Numbers of microscopic fungi (Yeasts and molds) were determined on Yeast Glucose Chloramphenicol (YGC) agar (Merck, Darmstadt, Germany), and the incubation was carried out aerobically at 25 ± 1 °C for 72–120 h according to [51]. Total counts of spores were determined after deactivation of vegetative microbial cells at 80 °C for 10 min, and the counts of spores were determined on TCA agar with incubation at 30 ± 1 °C for 72–96 h according to [48].
The analyses were performed in duplicate, and the results are expressed as colony-forming units (CFU) per gram of sample.

2.8. Effective Diffusion Coefficient Determination

A simplification of Fick’s second law equation to a one-dimensional moisture diffusion equation in a thin layer of material with initial and boundary conditions, as follows:
X t ( t = 0 ,   0 l l 0 ) = X 0   ;   X t ( t > 0 ,   l = l 0 ) = X e q   ;   ( t > 0 ,   l = 0 )   X l = 0
can be applied to determine the effective diffusion coefficient (Deff) of water in this layer [52,53,54], as in Equation (4).
M R = n = 0 8 ( 2 n + 1 ) 2 π 2   E x p   ( ( 2 n + 1 ) 2 π 2 D e f f t 4   l 2 )
where MR is the moisture ratio defined by Equation (5), t is time, and l is half of the layer thickness; Xt, X0, and Xeq represent the dry basis moisture content (kg water/kg dry solid) at any time, initial and equilibrium, respectively.
M R = ( X t X e q ) ( X 0 X e q )
For a long drying time, only one term of Equation (4) can be considered:
M R = 8 π 2   E x p   ( π 2 D e f f t 4   l 2 )
After linearization of Equation (6), the effective diffusion coefficient (Deff) can be determined from the slope of the linear dependence of ln(MR) versus time, as seen in Equation (7), using experimental data.
ln ( M R ) = l n 8 π 2 + ( π 2 D e f f   4   l 2 ) t

3. Results

3.1. Effect of Drying Conditions on Drying Rate and Product Water Activity

Time between waste generation and decrease in FW aw to an acceptable level (below 0.5) by drying is a crucial parameter for FW’s use as a potential component of animal feed, drying time being the most important parameter. In the case that solar drying systems are used, the process conditions, such as temperature, pressure, air relative humidity, and flow rate, are affected by weather. Therefore, solar experiments were carried out over three consecutive days with different weather. The reference convective dryer experiment was performed at constant process conditions.
Figure 3 shows the rate of the sample mass loss in all three solar experiments compared to the reference laboratory batch experiment, as well as the sample moisture content and aw behavior during the solar drying process. This analysis was carried out with non-autoclaved samples. Compared to the laboratory batch dryer, the mass loss curves (Figure 3a) in the solar dryer were not smooth as they showed fluctuations caused by the change in weather during the day. In solar dryer experiments, the initial drying rate was higher than in the laboratory batch experiment; however, it dropped more rapidly and reached lower values after 2 h (Figure 3b). Differences were also visible between the experimental days. The slowest mass loss and highest equilibrium moisture content were recorded on the first experimental day, while the most rapid mass loss and lowest equilibrium moisture content were measured on the third experimental day. The effect of weather changes during the day and between the experimental days is easily visible in Figure 3c, where the product moisture content is presented, and in Figure 3d, which shows product aw. On the first experimental day (Day 1), the final aw and final moisture content were reached ca 2 h later than on the last experimental day (Day 3). Unfortunately, the convective laboratory batch experimental device did not enable sampling for moisture content and aw measurement during the experimental run. However, measured aw at the end of the experiment was in the same range as that for solar drying experiments.
The decrease in sun radiation (Figure 4c) caused a rapid decrease in the ambient air temperature (Figure 4b), collector outlet temperature (Figure 4e), and air flow rate (Figure 4g). Consequently, the drying chamber outlet temperature (Figure 4f) decreased, and ambient air humidity (Figure 4a) and chamber outlet air humidity (Figure 4h) increased. A similar scenario with smaller fluctuations was repeated on Day 2. However, no clouds appeared, and the sunshine reached its maximum at 2 PM on Day 3. The air relative humidity was the lowest and the ambient air temperature, collector outlet temperature, chamber outlet temperature, and air flow rate were the highest of all three days. These favorable conditions led to drying time shortening by 2 h. As seen in Figure 4d, changes in ambient pressure during the experimental day were not significant; however, due to the high altitude of the geographical location, the atmospheric pressure was between 81 and 82 kPa.
The results of this work show that at similar climate conditions, one sunny day is enough to produce a dried product from FW with an aw below 0.3, which is completely safe considering microbial growth. This claim was also confirmed by measuring the final product water activity of autoclaved samples.

Reproducibility Test (R-Test) of Solar Drying Experiments

Generally, reproducibility of the results of solar drying experiments is a challenge. Process conditions are dependent on weather conditions; changes in weather conditions such as sun radiation, ambient temperature, and air relative humidity influence the drying process behavior. To estimate the level of reproducibility of results achieved by solar drying experiments in this work, an additional experiment under weather conditions similar to those of Day 2 but at a different time of the day and for a different waste mix with the same initial moisture content was performed. In Table 1, the most important process conditions are listed; ambient temperature, collector outlet temperature, ambient air relative humidity, and chamber outlet air relative humidity for both experimental runs were compared, and differences between them were calculated. In the same table, differences in the final product moisture content and product water activity between both experimental runs are shown. All parameters, as well as relative standard deviation (RSD), for all experimental points and their average values were calculated. As seen in Table 1, for process conditions, the average ambient temperature was 3.23 °C higher for the R-test than for the Day 2 experiment (average RSD 5.43%); this resulted in an average collector outlet temperature increase of 4.08 °C (average RDS 5.0%). The average air relative humidity for the R-test was 4.05% lower (average RSD 5.53%), and the average difference in chamber outlet air relative humidity was −2.43% (average RDS 8.37%) between the R-test and Day 2 experiment. Considering the product properties, the average difference between the R-test and Day 2 measurements in product moisture content was −2.16% (average RDS 1.24%). However, the final product moisture content was slightly higher for the R-test than for the Day 2 experiment. The average difference in water activity between the R-test and Day 2 experiment was 0.06 (average RDS 9.04%). The final product water activity was significantly higher for the R-test than for the Day 2 experiment, probably due to the more intensive rehydration of the R-test sample before aw measurement. However, the value of the reached water activity was below 0.21 in both cases, which is significantly lower than the critical value (0.5). Based on the reproducibility test results, it can be concluded that solar drying experiments are reproducible under similar weather conditions.

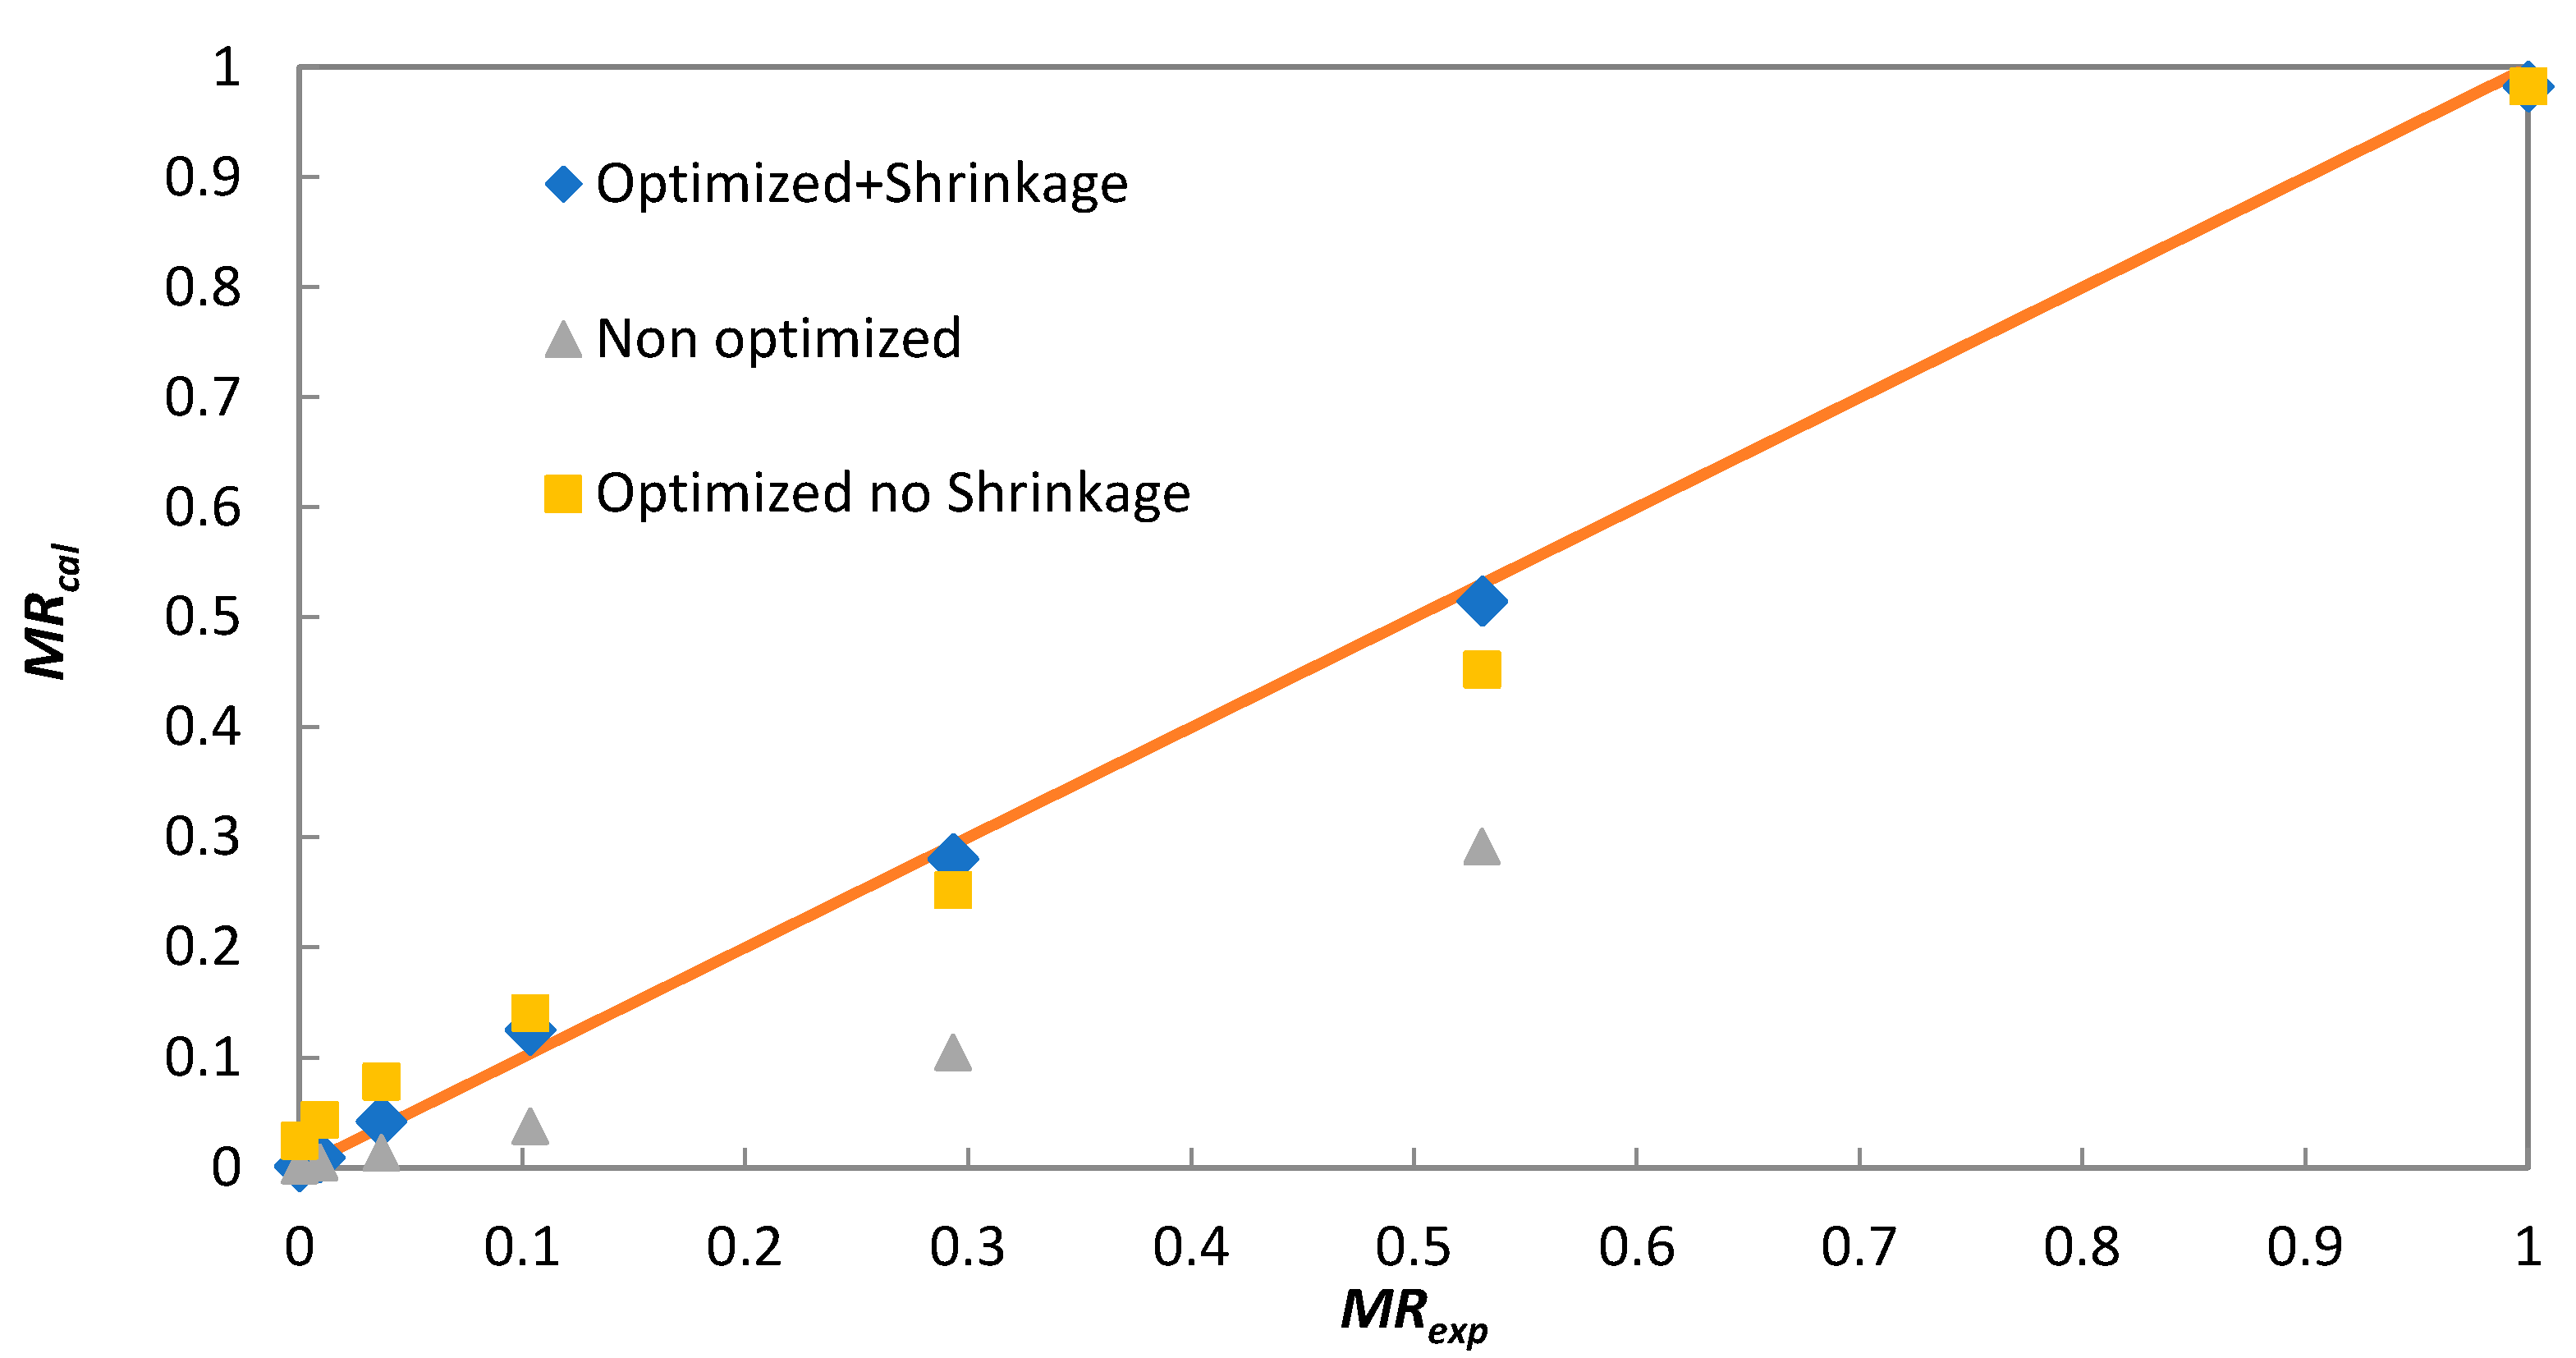
3.2. Effective Diffusion Coefficient

The kinetics of drying is often limited by moisture diffusion to the material’s surface. The effective diffusion coefficient estimated using the simplified Fick’s second law equation (Equation (4)) provides a general overview of process kinetics, and it can be used to predict the required drying time. However, the value of Deff also depends on process conditions and can be influenced by weather changes during the day.
As a first estimate, the effective diffusion coefficient was determined from the slope of the linear equation (Equation (6)) for both solar and laboratory batch experiments. These values are marked in Table 2 as non-optimized. In the case of the solar dryer, the values of Deff varied between 6.1 × 10⁻¹⁰ and 8.9 × 10⁻¹⁰ m2 s−1, while for laboratory convective batch dryer, it was 3.1 × 10⁻¹⁰ m2 s−1. The determined values of Deff were used in Equation (4), applying n = 10 to calculate moisture ratio (MRcal). Significant differences were found when comparing MRcal with experimental moisture ratios (MRexp) (Figure 5) for non-optimized Deff due to the use of only one member of the infinite series (n = 0) in Equation (4) for Deff estimation. To obtain a better fit of the calculated MRcal to MRexp, Deff was optimized by minimizing the sum of deviation squares between experimental and calculated values using Equation (4). The obtained results are shown in Table 1 as “Optimized shrinkage not considered”. As shown in Figure 5, these values provide a much better description of the experimental data; however, the deviation between MRcal and MRexp is not negligible.
Another factor affecting the calculated Deff is the assumption of constant layer thickness in Equation (4). As the initial layer thickness, the diameter of cylindrical particles of extruded FW put next to each other on the dryer tray was considered. However, layer shrinkage occurred during drying, and the layer thickness decreased from the initial 5 mm to a final 3 mm. The linear decrease of half of the layer thickness (l(mm) = 2.5 − 3.47 × 10⁻⁵ t(s)) was considered, and it was incorporated into Equation (4). After applying the same optimization procedure as in the previous case, the new values of Deff were estimated and are provided in Table 1 as “Optimized shrinkage considered”. As seen in Figure 5, these Deff values provide the best fit between experimental and calculated moisture ratios.
The optimized values of Deff are in agreement with the drying rate curves shown in Figure 3b, while non-optimized Deff values do not follow the same trend. In the case of solar dryer experiments, the highest Deff was determined for Day 3, when the most rapid drying was recorded, while the lowest Deff was determined for Day 1, which is in agreement with the slowest drying behavior. Similar values of Deff were reported for different fruit and vegetable products [29,30,55]. The effective diffusion coefficient is not only a material property parameter, it is affected also by process conditions; this is the reason why different values of Deff were determined for the same material. At higher temperatures, lower air relative humidity and a higher air flow rate as well as more intensive water diffusion occurred, and the Deff value increased.
Using Equation (4) with n = 10 and “optimized shrinkage considered” Deff from Table 1, the moisture ratio (MR) was calculated for all solar and laboratory convective batch experiments. As seen in Figure 6, the decrease in Deff from 2.81 × 10⁻¹⁰ m2 s−1 to 2.33 × 10⁻¹⁰ m2 s−1 in the solar dryer led to the prolongation of drying time by more than one hour. The decrease in Deff was caused by the change in ambient conditions (increased air relative humidity, decreased temperature and air flow rate).

3.3. Nutritional and Microbial Analysis

Sources of fat, protein, and carbohydrates supply animals and humans with required energy [56,57,58]. The average content of nutrients in dried FW measured in this work is provided in Table 3. Protein content was 5.18 ± 0.60 wt%, which is lower than values reported in [59] for different animal and bird feeds (10–20 wt%). The lower protein content of studied samples indicates that at least this studied mixed FW product alone cannot provide the dietary protein required by animals and birds, and a protein source, e.g., soybean meal [60,61,62], corn [63], or insects [64,65,66], must be added. The fat and ash content in FW are comparable with that in animal feed reported in the literature.
Microbiological safety is one of the most important concerns not only in food but also in food by-products; however, it has rarely been studied in valorized by-products and FW. One of the main problems is finding reference values that allow for determining the suitability of the obtained by-products since no legislation has been specifically established in this regard [67].
In our case, the total microbial count was significantly higher in non-autoclaved samples, and their aw values were lower compared to the autoclaved ones (Table 4). Interestingly, the highest aw value of 0.428 together with one of the lowest total microbial counts of 2.3 × 10⁴ CFU g−1 were detected in the solar-dried autoclaved sample, which is in contrast with our presumption of microbial inhibition by an aw of <0.3. However, in both cases, autoclaved and non-autoclaved, in both drying systems, the solar and convective batch, the used air was unfiltered. The autoclaving process was supposed to ensure total microbial inhibition, but subsequent technological treatment of the samples probably resulted in their recontamination. This fact emphasized the need to ensure high-quality air conditioning to minimize product recontamination. Moreover, spore-forming bacteria dominated in all samples, with higher counts in solar-dried samples. As their reservoir in the environment includes dust, water, soil, etc., it is not surprising that their higher numbers were detected in solar-dried samples. It is also consistent with the results presented in [68,69], where phylum Firmicutes (including spore-forming classes) was detected as dominant, and a change in microbial composition due to the change in operating conditions was indicated. A standard commercially available air-filtering device installed at the collector outlet (chamber inlet) was used to remove solid particles carrying spore-forming microorganisms.
Autoclaving led to total inhibition of E. coli, S. aureus, yeasts, and molds in solar-dried samples. Considering their possible pathogenic properties, these results are promising and consistent with the results of [70]. The presence of mycobiota was eliminated in laboratory-dried autoclaved samples, while E. coli and S. aureus were not detected in solar-dried non-autoclaved samples. The concentration of E. coli and S. aureus below 10 CFU g−1 complies with the guidelines for dried foodstuff in Canada (2021).

3.4. Potential Impact of the Study Results on Sustainable Food Waste Management and Circular Economy in the Region

This work has proven that the climate conditions of the region where the experiments were carried out are suitable for reprocessing food waste to animal feed using solar energy. A detailed assessment of the sustainability of this process requires a life cycle assessment, which is out of the scope of this work; however, an LCA carried out by other researchers determined the high environmental, economic, and social sustainability of reusing food waste as animal feed. San Martin, et al. [71] provided an LCA of different FW management methods and reported a significant reduction in the environmental impact of reusing vegetable FW as animal feed compared to anerobic digestion, landfilling, incineration, and composting. The largest share of the environmental impact (80%) was due to FW drying, but no solar energy was used. The use of solar energy can significantly reduce the environmental impact of reprocessing FW to animal feed by drying. Kim and Kim [72] reported emissions of 200 kg of CO2-eq per ton of food waste with dry-based treatment and 61 kg of CO2-eq with wet-based treatment as animal feed compared to 1010 kg of CO2-eq with composting. When a solar dryer is used, a similar amount of greenhouse gas emissions for dry-based treatment and wet-based treatment can be expected. In general, LCA analysis of FW disposal methods resulted in food waste hierarchy [17,73], where reuse of FW as animal feed is listed immediately after its reduction and reuse as human food.
Around 6.8 thousand metric tons of FW produced by the studied wedding halls could be reprocessed to 2.0 thousand metric tons of animal feed. This amount of food waste would be returned back to the food chain, saving a significant amount of food. Considering the dryer efficiency of 30%, drying this amount of FW requires 10.5 GWh of energy (energy for transportation of FW is not included). By generating this amount of energy from a solar source, more than 7.0 thousand tons of CO (eq) emissions per year can be saved compared to its generation from coal. A detailed study of environmental, economic, and social impacts of the process and its extrapolation to the regional and national levels will be carried out in the future to assess all aspects of the process’s sustainability.

4. Conclusions

FW produced in 121 wedding halls in Kabul, which amounts to approximately 7000 tons/year, has a huge potential to be processed by drying and reused as an animal feed component. Weather conditions have a crucial effect on the use of solar drying before the material spoils. Ambient air relative humidity, temperature, and sun radiation intensity significantly affect drying kinetics. According to the solar drying results, one sunny day with an ambient relative humidity of 15–30%, temperature of 30–36 °C, and sun radiation intensity of 500–1100 w m−2 is enough to dry a 5 mm layer of ground FW, decreasing its aw below 0.3 and moisture content below 8%.
Using simplified Fick’s second law, the effective diffusion coefficient of water in FW was determined. The improvement in the simple one-member (of the infinite series) solution to a ten-member solution accompanied with optimization (rather with shrinkage) resulted in a much better estimation of Deff with a better fit of experimental data.
The studied FW had a good combination of nutrients, such as proteins, fat, carbohydrates, and ash; however, the amount of protein in the dried FW was lower than in regular feed. This deficiency can be eliminated by adding protein materials such as soybean meal.
Microbiological analysis of non-autoclaved dried samples showed a total microbial count of 4.4 × 10⁵ CFU g−1 for laboratory batch experiments and 2.1 × 10⁷ CFU g−1 for solar drying experiments. Significant counts of aerobic scores, coliforms, E. coli, S. aureus, yeast, and molds were found in non-autoclaved dried samples. The autoclaving of fresh samples reduced the total microbial count of dried samples to 1.2 × 10⁴ CFU g−1 and 2.3 × 10⁴ CFU g−1 for the laboratory batch and solar drying experiments, respectively. E. coli and S. aureus were not detected in solar-dried samples. To minimize product recontamination, high-quality air conditioning is required.
Based on results found in this work, it can be concluded that solar drying as a sustainable technology has significant potential use in converting food waste to animal feed, especially in geographical locations with a dry climate. However, further research is required to solve all technical, logistic, and social aspects of this problem and reach full commercialization of reusing dried FW as animal feed. The effect of air filtration on microbial counts, influence of adding specific ingredients on product nutritional composition, and feeding animals with the resulting product create a subject for future research.

Author Contributions

Conceptualization, A.W.N. and J.H.; methodology, A.W.N. and A.M.; validation, J.H., M.J.R. and A.M.; formal analysis, M.J.R. and J.H.; investigation, A.W.N. and A.M.; resources, J.H.; data curation, A.W.N. and M.J.R.; writing—original draft preparation, A.W.N.; writing—review and editing, J.H. and A.M.; visualization, M.J.R.; supervision, J.H.; project administration, J.H.; funding acquisition, J.H. All authors have read and agreed to the published version of the manuscript.

Funding

This research was funded by the Slovak Research and Development Agency, APVV 19-0170.

Informed Consent Statement

Not applicable.

Data Availability Statement

All data that study reports are included in the paper, no additional data are available.

Acknowledgments

This work was carried out thanks to the project APVV-19-0170 provided by the Slovak Research and Development Agency and the support of the SlovakAid projects SAMRS/AFG/2013/01/04 and SAMRS/AFG/2016/01/01. The authors would like to thank the Kabul Polytechnic University, Faculty of Chemical Technology, Department of Food Technology, for creating a suitable environment in which this research could be realized.

Conflicts of Interest

The authors declare no conflict of interest.

References

  1. Sheppard, P.; Rahimifard, S. Embodied energy in preventable food manufacturing waste in the United Kingdom. Resour. Conserv. Recycl. 2019, 146, 549–559. [Google Scholar] [CrossRef]
  2. Zheng, G.; Liu, J.; Shao, Z.; Chen, T. Emission characteristics and health risk assessment of VOCs from a food waste anaerobic digestion plant: A case study of Suzhou, China. Environ. Pollut. 2020, 257, 113546. [Google Scholar] [CrossRef]
  3. Morone, P.; Koutinas, A.; Gathergood, N.; Arshadi, M.; Matharu, A. Food waste: Challenges and opportunities for enhancing the emerging bio-economy. J. Clean. Prod. 2019, 221, 10–16. [Google Scholar] [CrossRef]
  4. Urrutia, I.; Dias, G.M.; Clapp, J. Material and visceral engagements with household food waste: Towards opportunities for policy interventions. Resour. Conserv. Recycl. 2019, 150, 104435. [Google Scholar] [CrossRef]
  5. Filimonau, V.; Delysia, A. Food waste management in hospitality operations: A critical review. Tour. Manag. 2019, 71, 234–245. [Google Scholar] [CrossRef]
  6. Teigiserova, D.A.; Hamelin, L.; Thomsen, M. Towards transparent valorization of food surplus, waste and loss: Clarifying definitions, food waste hierarchy, and role in the circular economy. Sci. Total Environ. 2020, 706, 136033. [Google Scholar] [CrossRef]
  7. Bravi, L.; Francioni, B.; Murmura, F.; Savelli, E. Factors affecting household food waste among young consumers and actions to prevent it. A comparison among UK, Spain and Italy. Resour. Conserv. Recycl. 2020, 153, 104586. [Google Scholar] [CrossRef]
  8. Girotto, F.; Cossu, R. Role of animals in waste management with a focus on invertebrates′ biorefinery: An overview. Environ. Dev. 2019, 32, 100454. [Google Scholar] [CrossRef]
  9. Florkowski, W.J.; Us, A.; Klepacka, A.M. Food waste in rural households support for local biogas production in Lubelskie Voivodship (Poland). Resour. Conserv. Recycl. 2018, 136, 46–52. [Google Scholar] [CrossRef]
  10. Maragkaki, A.E.; Vasileiadis, I.; Fountoulakis, M.; Kyriakou, A.; Lasaridi, K.; Manios, T. Improving biogas production from anaerobic co-digestion of sewage sludge with a thermal dried mixture of food waste, cheese whey and olive mill wastewater. Waste Manag. 2018, 71, 644–651. [Google Scholar] [CrossRef]
  11. Patel, A.; Hrůzová, K.; Rova, U.; Christakopoulos, P.; Matsakas, L. Sustainable biorefinery concept for biofuel production through holistic volarization of food waste. Bioresour. Technol. 2019, 294, 122247. [Google Scholar] [CrossRef]
  12. Okoro-Shekwaga, C.K.; Ross, A.B.; Camargo-Valero, M.A. Improving the biomethane yield from food waste by boosting hydrogenotrophic methanogenesis. Appl. Energy 2019, 254, 113629. [Google Scholar] [CrossRef]
  13. Akarsu, K.; Duman, G.; Yilmazer, A.; Keskin, T.; Azbar, N.; Yanik, J. Sustainable valorization of food wastes into solid fuel by hydrothermal carbonization. Bioresour. Technol. 2019, 292, 121959. [Google Scholar] [CrossRef]
  14. Meena, R.A.A.; Banu, J.R.; Kannah, R.Y.; Yogalakshmi, K.N.; Kumar, G. Biohythane production from food processing wastes: Challenges and perspectives. Bioresour. Technol. 2020, 298, 122449. [Google Scholar] [CrossRef]
  15. Tsang, Y.F.; Kumar, V.; Samadar, P.; Yang, Y.; Lee, J.; Ok, Y.S.; Jeon, Y.J. Production of bioplastic through food waste valorization. Environ. Int. 2019, 127, 625–644. [Google Scholar] [CrossRef]
  16. Yan, B.H.; Selvam, A.; Wong, J.W. Bio-hydrogen and methane production from two-phase anaerobic digestion of food waste under the scheme of acidogenic off-gas reuse. Bioresour. Technol. 2020, 297, 122400. [Google Scholar] [CrossRef]
  17. EPA. Food Recovery Hierarchy. 2017. Available online: https://www.epa.gov/reducefoodwaste/food-recovery-hierarchy (accessed on 13 January 2021).
  18. Carmona-Cabello, M.; Garcia, I.L.; Leiva-Candia, D.; Dorado, M.P. Valorization of food waste based on its composition through the concept of biorefinery. Curr. Opin. Green Sustain. Chem. 2018, 14, 67–79. [Google Scholar] [CrossRef]
  19. Victor, N.; Peter, C.; Raphael, K.; Tendekayi, G.H.; Jephris, G.; Taole, M.; Portia, P.R. Microbiological quality of selected dried fruits and vegetables in Maseru, Lesotho. Afr. J. Microbiol. Res. 2017, 11, 185–193. [Google Scholar] [CrossRef] [Green Version]
  20. do Nascimento Nunes, M.C. Impact of environmental conditions on fruit and vegetable quality. Stewart Postharvest Rev. 2008, 4, 1–14. [Google Scholar] [CrossRef]
  21. Amit, S.K.; Uddin, M.M.; Rahman, R.; Islam, S.R.; Khan, M.S. A review on mechanisms and commercial aspects of food preservation and processing. Agric. Food Secur. 2017, 6, 1–22. [Google Scholar] [CrossRef]
  22. Karam, M.C.; Petit, J.; Zimmer, D.; Djantou, E.B.; Scher, J. Effects of drying and grinding in production of fruit and vegetable powders: A review. J. Food Eng. 2016, 188, 32–49. [Google Scholar] [CrossRef]
  23. Dou, Z.; Toth, J.D.; Westendorf, M.L. Food waste for livestock feeding: Feasibility, safety, and sustainability implications. Glob. Food Secur. 2018, 17, 154–161. [Google Scholar] [CrossRef]
  24. Musembi, M.N.; Kiptoo, K.S.; Yuichi, N. Design and analysis of solar dryer for mid-latitude region. Energy Procedia 2016, 100, 98–110. [Google Scholar] [CrossRef] [Green Version]
  25. Akpinar, E.K. Drying of mint leaves in a solar dryer and under open sun: Modelling, performance analyses. Energy Convers. Manag. 2010, 51, 2407–2418. [Google Scholar] [CrossRef]
  26. Defraeye, T.; Radu, A. Convective drying of fruit: A deeper look at the air-material interface by conjugate modeling. Int. J. Heat Mass Transf. 2017, 108, 1610–1622. [Google Scholar] [CrossRef] [Green Version]
  27. Pu, H.; Li, Z.; Hui, J.; Raghavan, G.V. Effect of relative humidity on microwave drying of carrot. J. Food Eng. 2016, 190, 167–175. [Google Scholar] [CrossRef]
  28. Sormoli, M.E.; Langrish, T.A. Spray drying bioactive orange-peel extracts produced by Soxhlet extraction: Use of WPI, antioxidant activity and moisture sorption isotherms. LWT Food Sci. Technol. 2016, 72, 1–8. [Google Scholar] [CrossRef]
  29. Zhou, M.; Chen, Q.; Bi, J.; Wang, Y.; Wu, X. Degradation kinetics of cyanidin 3-O-glucoside and cyanidin 3-O-rutinoside during hot air and vacuum drying in mulberry (Morus alba L.) fruit: A comparative study based on solid food system. Food Chem. 2017, 229, 574–579. [Google Scholar] [CrossRef]
  30. Musielak, G.; Mierzwa, D.; Kroehnke, J. Food drying enhancement by ultrasound—A review. Trends Food Sci. Technol. 2016, 56, 126–141. [Google Scholar] [CrossRef]
  31. Senadeera, W.; Alves-Filho, O.; Eikevik, T. Influence of drying conditions on the moisture diffusion and fluidization quality during multi-stage fluidized bed drying of bovine intestine for pet food. Food Bioprod. Process. 2013, 91, 549–557. [Google Scholar] [CrossRef] [Green Version]
  32. Sreekumar, A. Techno-economic analysis of a roof-integrated solar air heating system for drying fruit and vegetables. Energy Convers. Manag. 2010, 51, 2230–2238. [Google Scholar] [CrossRef]
  33. Bahammou, Y.; Tagnamas, Z.; Lamharrar, A.; Idlimam, A. Thin-layer solar drying characteristics of Moroccan horehound leaves (Marrubium vulgare L.) under natural and forced convection solar drying. Sol. Energy 2019, 188, 958–969. [Google Scholar] [CrossRef]
  34. Kilic, A. Low temperature and high velocity (LTHV) application in drying: Characteristics and effects on the fish quality. J. Food Eng. 2009, 91, 173–182. [Google Scholar] [CrossRef]
  35. Ma, J.; Zhang, L.; Mu, L.; Zhu, K.; Li, A. Thermally assisted bio-drying of food waste: Synergistic enhancement and energetic evaluation. Waste Manag. 2018, 80, 327–338. [Google Scholar] [CrossRef]
  36. Wilkins, R.; Brusey, J.; Gaura, E. Modelling uncontrolled solar drying of mango waste. J. Food Eng. 2018, 237, 44–51. [Google Scholar] [CrossRef]
  37. Badaoui, O.; Hanini, S.; Djebli, A.; Haddad, B.; Benhamou, A. Experimental and modelling study of tomato pomace waste drying in a new solar greenhouse: Evaluation of new drying models. Renew. Energy 2019, 133, 144–155. [Google Scholar] [CrossRef]
  38. Bhila, T.E.; Ratsaka, M.M.; Kanengoni, A.; Siebrits, F.K. Effect of sun drying on microbes in non-conventional agricultural by-products. S. Afr. J. Anim. Sci. 2012, 40, 484–487. [Google Scholar]
  39. Bisamaza, M.; Banadda, N. Solar drying and sun drying as processing techniques to enhance the availability of selected African indigenous vegetables, Solanum aethiopicum and Amaranthus lividus for nutrition and food security in Uganda. Afr. J. Food Sci. Technol. 2017, 8, 1–6. [Google Scholar] [CrossRef]
  40. Guiné, R. The drying of foods and its effect on the physical-chemical, sensorial and nutritional properties. Int. J. Food Eng. 2018, 2, 93–100. [Google Scholar] [CrossRef]
  41. Mohammed, S.; Edna, M.; Siraj, K. The effect of traditional and improved solar drying methods on the sensory quality and nutritional composition of fruits: A case of mangoes and pineapples. Heliyon 2020, 6, e04163. [Google Scholar] [CrossRef]
  42. Tașeri, L.; Gülcü, M.; Palabiyik, I.; Seçkin, G.U.; Aktas, T.; Gecgel, U. Effects of open air and solar drying on the nutritional quality of seed oil, seeds and skins from Muscat Hamburg grapes. Grasas Y Aceites 2018, 69, 277. [Google Scholar] [CrossRef] [Green Version]
  43. Ukegbu, P.O.; Okereke, C.J. Effect of solar and sun drying methods on the nutrient composition and microbial load in selected vegetables, African spinach (Amaranthus hybridus), fluted pumpkin (Telferia occidentalis), and okra (Hibiscus esculentus). Sky J. Food Sci. 2013, 2, 35–40. [Google Scholar] [CrossRef]
  44. Noori, A.W.; Royen, M.J.; Haydary, J. An active indirect solar system for food products drying. Acta Chim. Slovaca 2019, 12, 142–149. [Google Scholar] [CrossRef]
  45. Noori, A.W.; Royen, M.J.; Haydary, J. Effect of ambient parameters change on mint leaves solar drying. Acta Chim. Slovaca 2021, 14, 14–24. [Google Scholar] [CrossRef]
  46. Nielsen, S.S. Determination of moisture content. In Food Analysis Laboratory Manual; Springer: Boston, MA, USA, 2017. [Google Scholar] [CrossRef]
  47. EN ISO 6887-5; Microbiology of the Food Chain—Preparation of Test Samples, Initial Suspension and Decimal Dilutions for Microbiological Examination—Part 1: General Rules for the Preparation of the Initial Suspension and Decimal Dilutions. International Organization of Standardization (ISO): Geneva, Switzerland, 2010; 26p.
  48. EN ISO 4833-1; Microbiology of the Food Chain—Horizontal Method for the Enumeration of Microorganisms—Part 1: Colony Count at 30 °C by the Pour Plate Technique. International Organization of Standardization (ISO): Geneva, Switzerland, 2013; 9p.
  49. National Standard Method F23; Enumeration of Enterobacteriaceae by the Colony Count Technique. National Public Health Service for Wales: Cardif, UK, 2005; 11p.
  50. EN ISO 6888-1; Microbiology of Food and Animal Feeding Stuffs—Horizontal Method for the Enumeration of Coagulase-Positive Staphylococci (Staphylococcus aureus and Other Species)—Part 1: Technique Using Baird-Parker Agar Medium. International Organization of Standardization (ISO): Geneva, Switzerland, 2001; 22p.
  51. EN ISO 21527-2; Microbiology of Food and Animal Feeding Stuffs—Horizontal Method for the Enumeration of Yeasts and Moulds—Part 2: Colony Count Technique in Products with Water Activity Less than or Equal to 0.95. International Organization of Standardization (ISO): Geneva, Switzerland, 2008; 9p.
  52. Corzo, O.; Bracho, N.; Alvarez, C. Water effective diffusion coefficient of mango slices at different maturity stages during air drying. J. Food Eng. 2008, 87, 479–484. [Google Scholar] [CrossRef]
  53. Fernando, W.J.N.; Low, H.C.; Ahmad, A.L. Dependence of the effective diffusion coefficient of moisture with thickness and temperature in convective drying of sliced materials. A study on slices of banana, cassava and pumpkin. J. Food Eng. 2011, 102, 310–316. [Google Scholar] [CrossRef]
  54. Kaya, A.; Aydın, O.; Demirtaş, C. Drying kinetics of red delicious apple. Biosyst. Eng. 2007, 96, 517–524. [Google Scholar] [CrossRef]
  55. Sacilik, K.; Elicin, A.K. The thin layer drying characteristics of organic apple slices. J. Food Eng. 2006, 73, 281–289. [Google Scholar] [CrossRef]
  56. Barzegar, S.; Wu, S.B.; Choct, M.; Swick, R.A. Factors affecting energy metabolism and evaluating net energy of poultry feed. Poult. Sci. 2020, 99, 487–498. [Google Scholar] [CrossRef]
  57. Cerrate, S.; Ekmay, R.; England, J.A.; Coon, C. Predicting nutrient digestibility and energy value for broilers. Poult. Sci. 2019, 98, 3994–4007. [Google Scholar] [CrossRef]
  58. Zhang, D.Y.; Zhang, X.X.; Li, G.Z.; Li, X.L.; Zhang, Y.K.; Zhao, Y.; Wang, W.M. Transcriptome analysis of long noncoding RNAs ribonucleic acids from the livers of Hu sheep with different residual feed intake. Animal 2021, 15, 100098. [Google Scholar] [CrossRef]
  59. Muñoz-Solano, B.; González-Peñas, E. Mycotoxin determination in animal feed: An LC-FLD method for simultaneous quantification of aflatoxins, ochratoxins and zearelanone in this matrix. Toxins 2020, 12, 374. [Google Scholar] [CrossRef]
  60. Upadhyaya, I.; Arsi, K.; Fanatico, A.; Wagle, B.R.; Shrestha, S.; Upadhyay, A.; Donoghue, A.M. Bigheaded carp-based meal as a sustainable and natural source of methionine in feed for ecological and organic poultry production. J. Appl. Poult. Res. 2019, 28, 1131–1142. [Google Scholar] [CrossRef]
  61. Wu, S.B.; Choct, M.; Pesti, G. Historical flaws in bioassays used to generate metabolizable energy values for poultry feed formulation: A critical review. Poult. Sci. 2020, 99, 385–406. [Google Scholar] [CrossRef]
  62. Zaefarian, F.; Cowieson, A.J.; Pontoppidan, K.; Abdollahi, M.R.; Ravindran, V. Trends in feed evaluation for poultry with emphasis on in vitro techniques. Animal Nutr. 2021, 7, 268–281. [Google Scholar] [CrossRef]
  63. Kim, J.H.; Park, G.H.; Han, G.P.; Kil, D.Y. Effect of feeding corn distillers dried grains with solubles naturally contaminated with deoxynivalenol on growth performance, meat quality, intestinal permeability, and utilization of energy and nutrients in broiler chickens. Poult. Sci. 2021, 100, 101215. [Google Scholar] [CrossRef]
  64. Abro, Z.; Kassie, M.; Tanga, C.; Beesigamukama, D.; Giiro, G. Socio-economic and environmental implications of replacing conventional poultry feed with insect-based feed in Kenya. J. Clean. Product. 2020, 265, 121871. [Google Scholar] [CrossRef]
  65. Bulak, P.; Wiącek, D.; Bieganowski, A. Hermetia illucens exhibits bioaccumulative potential for 15 different elements-Implications for feed and food production. Sci. Total Environ. 2020, 723, 138125. [Google Scholar] [CrossRef]
  66. Smetana, S.; Schmitt, E.; Mathys, A. Sustainable use of Hermetia illucens insect biomass for feed and food: Attributional and consequential life cycle assessment. Resour. Conserv. Recycl. 2019, 144, 285–296. [Google Scholar] [CrossRef]
  67. Socas-Rodríguez, B.; Álvarez-Rivera, G.; Valdés, A.; Ibáñez, E.; Cifuentes, A. Food by-products and food wastes: Are they safe enough for their valorization? Trends Food Sci. Technol. 2021, 114, 133–147. [Google Scholar] [CrossRef]
  68. Westerholm, M.; Liu, T.; Schnürer, A. Comparative study of industrial-scale high-solid biogas production from food waste: Process operation and microbiology. Bioresour. Technol. 2020, 304, 122981. [Google Scholar] [CrossRef]
  69. Zamanzadeh, M.; Hagen, L.H.; Svensson, K.; Linjordet, R.; Horn, S.J. Anaerobic digestion of food waste–effect of recirculation and temperature on performance and microbiology. Water Res. 2016, 96, 246–254. [Google Scholar] [CrossRef]
  70. Beltrán-Medina, E.A.; Guatemala-Morales, G.M.; Padilla-Camberos, E.; Corona-González, R.I.; Mondragón-Cortez, P.M.; Arriola-Guevara, E. Evaluation of the use of a coffee industry by-product in a cereal-based extruded food product. Foods 2020, 9, 1008. [Google Scholar] [CrossRef]
  71. San Martin, D.; Ramos, S.; Zufía, J. Valorisation of food waste to produce new raw materials for animal feed. Food Chem. 2016, 198, 68–74. [Google Scholar] [CrossRef]
  72. Kim, M.H.; Kim, J.W. Comparison through a LCA evaluation analysis of food waste disposal options from the perspective of global warming and resource recovery. Sci. Total Environ. 2010, 408, 3998–4006. [Google Scholar] [CrossRef]
  73. Giordano, C.; Falasconi, L.; Cicatiello, C.; Pancino, B. The role of food waste hierarchy in addressing policy and research: A comparative analysis. J. Clean. Prod. 2020, 252, 119617. [Google Scholar] [CrossRef]
Figure 1. Schematic description of solar dryer: 1—drying chamber, 2—drying trays, 3—air distributor, 4—DC exhaust fan, 5—collector, 6—DC centrifugal blower, and 7—PV solar panel.
Sustainability 14 05849 g001
Figure 2. Convective batch laboratory tray dryer scheme: 1—air inlet, 2—centrifugal blower, 3—heater, 4—drying trays, 5—sensors, 6—air outlet, 7—balance load cell force, and 8—drying chamber.
Sustainability 14 05849 g002
Figure 3. Drying curves, product moisture content, and aw behavior: (a) sample mass loss, (b) drying rate in (% of mass h−1), (c) product moisture content, (d) aw of the product.
Sustainability 14 05849 g003
Figure 4. Ambient and dryer conditions during the drying process: (a) ambient air humidity, (b) ambient air temperature, (c) sun radiation, (d) ambient air pressure, (e) collector outlet temperature, (f) chamber outlet temperature, (g) air velocity in the collector, (h) chamber outlet air humidity.
Sustainability 14 05849 g004
Figure 5. Comparison of experimental (MRexp) and calculated (MRcal) moisture ratios for solar dryer experiment (Day 3).
Sustainability 14 05849 g005
Figure 6. Moisture ratios calculated by Equation (6) with n = 10 and “optimized shrinkage considered” Deff.
Sustainability 14 05849 g006
Table 1. Reproducibility test of solar drying experiments.
Time/hAmbient Temperature (°C)Collector Outlet Temperature (°C)
R-testDay 2DifferenceRSD
(%)
R-testDay 2DifferenceRSD
(%)
035.532.53.004.4152.250.41.801.75
137.532.84.706.6960.959.21.701.42
237.134.72.403.3461.163.7−2.602.08
334.236.2−2.002.8463.266.5−3.302.54
437.233.24.005.6869.859.210.608.22
538.437.41.001.3266.961.95.003.88
637.730.86.9010.0762.459.62.802.30
734.8295.809.0953.837.216.6018.24
Average 3.235.43 4.085.05
Time/hAmbient Air Relative Humidity (%)Chamber Outlet Air Relative Humidity (%)
R-testDay2DifferenceRSD
(%)
R-testDay2DifferenceRSD
(%)
022.526.6−4.104.1826.829.8−3.005.30
119.126.5−7.408.1120.522.7−2.205.09
215.420.4−5.006.9815.616.8−1.203.70
314.519.1−4.606.8510.714.2−3.5014.06
412.917.4−4.507.439.411.7−2.3010.90
513.415.8−2.404.1110.111.2−1.105.16
613.814.9−1.101.9210.411.5−1.105.02
71619.3−3.304.6711.616.6−5.0017.73
Average −4.055.53 −2.438.37
Time/hMoisture Content (%)Product Water Activity (aw)
R-testDay 2DifferenceRSD
(%)
R-testDay 2DifferenceRSD
(%)
068.1168.94−0.830.300.9510.96−0.010.47
154.3759.3−4.932.170.9350.944−0.010.48
242.9349.26−6.333.430.9110.916−0.010.27
324.4528.74−4.294.030.8770.780.105.85
413.215.27−2.073.640.7970.5990.2014.18
58.868.680.18−0.510.2250.2260.000.22
68.297.640.65−2.040.2160.1290.0925.22
77.857.520.33−1.070.2080.1230.0925.68
Average −2.161.24 0.069.04
Table 2. Effective diffusion coefficient.
Deff (m2 s−1)Non-OptimizedOptimized Shrinkage Not ConsideredOptimized Shrinkage Considered
Day 16.10 × 10−103.30 × 10−102.33 × 10⁻¹⁰
Day 28.92 × 10−103.75 × 10−102.56 × 10⁻¹⁰
Day 37.20 × 10−104.12 × 10−102.81 × 10⁻¹⁰
Lab. Batch5.69 × 10−102.93 × 10−101.88 × 10⁻¹⁰
Table 3. Nutritional compound analysis of dry FW.
ComponentsResearch DataLiterature Data
(for Poultry)
Reference
Value [g/kg]Value [g/kg]
Protein51.76 ± 6.0153.4[59]
Fat45.26 ± 0.950.09
Ash39.90 ± 0.646.5
Moisture81.15 ± 5.9-
Carbohydrates781.19 ± 13.14668.86
Table 4. Microbial composition of FW samples in relation to the method of preparation and drying.
Non-AutoclavedAutoclaved
Lab. BatchSolarLab. Batch Solar
CFU g−1CFU g−1CFU g−1CFU g−1
Total counts 4.40 × 1052.10 × 1071.20 × 1042.30 × 104
Total aerobic spores1.40 × 1051.90 × 1069.50 × 1032.20 × 104
Coliforms 8.00 × 1022.60 × 1032.50 × 1011.00 × 101
E. coli7.50 × 102<102.50 × 101<10
S. aureus3.00 × 102<107.50 × 10²<10
Yeast3.50 × 1011.50 × 101<10<10
Molds7.50 × 1011.30 × 102<10<10
Water activity 0.3030.3360.3140.428
Publisher’s Note: MDPI stays neutral with regard to jurisdictional claims in published maps and institutional affiliations.

