Article

Can Green Innovation and New Urbanization Be Synergistic Development? Empirical Evidence from Yangtze River Delta City Group in China

1
School of Management, Zhejiang University of Technology, Hangzhou 310023, China
2
Xingzhi College, Zhejiang Normal University, Jinhua 321004, China
*
Authors to whom correspondence should be addressed.
Sustainability 2022, 14(10), 5765; https://doi.org/10.3390/su14105765
Submission received: 19 March 2022 / Revised: 26 April 2022 / Accepted: 5 May 2022 / Published: 10 May 2022
(This article belongs to the Collection Technological Innovation and Economic Growth)

Abstract

:
Green innovation has become the mainstream of the era, and new urbanization is an inevitable choice in China’s urbanization development. Focusing on the topics of green innovation and new urbanization, much work has been done to analyze their influencing factors separately, while the relationship between the two remains to be explored. This paper selects the representative indicators to study the new urbanization and green innovation of the Yangtze River Delta city group from the perspective of the whole and individual cities, in terms of spatiotemporal evolution traits, by using the SBM, entropy method, coupling model, spatial econometric and geographical detector. The results reveal the following: (1) there is a synergistic effect between green innovation and new urbanization development, and the role has been increasing; (2) green innovation and new urbanization present positive spatial autocorrelation and regional agglomeration; (3) in the detection of driving factors, economic development > social conditions > natural resources; most groups (40/66) of factor interactions present nonlinear enhancement, and the digital economy factor accounts for the largest proportion. Finally, according to the findings, we offer a suggestion and a conclusion.

1. Introduction

Since the reform and opening up, China’s economy has been on an upward trend of rapid growth, but it is unsustainable with the extensive economic growth model, which relies on inputting production factors like labor and energies and comes at the expense of the environment. This has caused the abuse of environmental resources and non-renewable energy and the arbitrary discharge of wastewater and waste gas, resulting in environmental damage and a serious waste of resources and energy [1]. It has prompted the Chinese government and people to explore a more sustainable economic and social development model. So, the economic conference held by the CPC Central Committee at the end of 2013 clarified that green ecological development is the core measure of China’s new urbanization strategy. The “19th National Congress” of the party further put forward the concept of comprehensive green development and pointed out that it is necessary to build a new urbanization pattern taking urban agglomeration as the main body coordinated with the development of large, medium, and small cities [2]; implement the regional coordinated development strategy; and integrate the concept of green development with its methods and daily lifestyle organically. For this reason, the topics of green development, green economy, and green innovation development have been discussed intensively in the academic field [3]. Among them, the new urbanization (green urbanization), which pays more attention to aspects such as the level of urban public services, the quality of the ecological environment [4], and people-orientation [5], has become the guiding principle in China [6]. Green innovation, which measures the quality of green development and innovation capabilities, has been rapidly developed, enriched, and studied in-depth in multiple dimensions [7,8]. However, few scholars discuss the relationship between regional green innovation and new urbanization. Especially nowadays, carbon emission reduction and neutrality have become the mainly concerned topics [9,10]; urbanization is a process of social and economic transformation that also affects CO2 emissions [11]. Green innovation and the integration of economy and ecology [12] involve environmental innovation, which is crucial to domestic energy resilience turns and low-carbon energy consumption [13], but, in fact, the study of the relationship between the two is not only conducive to enriching the original theories but also has great guiding significance for the specific practice in China. At the same time, it also has an important theoretical and practical reference for the environment-friendly sustainable development of other similar countries. Therefore, this paper attempts to explore whether and how green innovation and new urbanization can be synergistic development and the influencing factors.
Judging from the existing literature, the new urbanization mainly focuses on the following aspects. Economic development is important to all societies; it is important to explore the impact of new urbanization development on economic growth [14,15,16]. As is well known, traditional urbanization is formed with the development of industrialization and the industry’s agglomeration. Therefore, some articles [17,18] try to explore its relationship with new urbanization. The process of urbanization requires energy consumption, and the new urbanization is no exception, so many scholars have discussed this topic [16,19,20]. With the advancement of urbanization and the sharp increase in energy consumption, environmental protection has become more and more important, so many scholars have begun to study the relationship between new urbanization and environmental regulations as well as environmental pollution [21,22]. Especially with global warming, the study of CO2 emissions with new urbanization has become a hot topic [23,24,25]. In recent years, with the further attention on the ecological environment, “greener” has become the main theme of the times [26]; there is already some literature exploring the relationship between new urbanization and green topics, for example, with the ecological environment [27,28], green economy [29], green growth [30], and green agriculture [31]. However, the research on the relationship between new urbanization and green innovation has not yet been explored. In addition, some articles reveal the relationships with others, such as the well-being of urban [32], individual development [33], and so on. Innovation is the inexhaustible driving force for regional progress, and green innovation is the locomotive of future development. At present, regional green innovation is mainly divided into three aspects, first of all, the evaluation of regional green innovation. It is mainly from the perspective of green innovation efficiency [8,26], and so this paper also evaluates 26 cities from the perspective of efficiency. Second is analysis of the factors [34,35,36,37] which affect its development. Third is the relationship with other aspects, such as environmental regulations [38,39]. In addition, there are also options for more concrete research from the perspective of enterprise [40,41]. The existing research provides a solid foundation for further expansion and improvement of related research. Although so far there has been no research on the direct study between new urbanization and green innovation, there was a certain basis in this aspect. The studies based on innovation and traditional urbanization have drawn some useful conclusions. Chen believed that urbanization should rely on technological progress to promote economic growth [42]. Wilson analyzed and concluded that scientific and technological innovation is the driving force for urbanization development [43]. Liu Shunfei [44] believed that scientific and technological input can effectively promote the development of urbanization, and it varies from region to region. In turn, Jacobs [45] believed that urban development promoted the formation of the competitive market, accelerated the accumulation and diffusion of knowledge, and played a positive role in promoting scientific and technological innovation. The study of Rosenthal and Tappeiner showed that urbanization leads to the expansion of city scale, enhances the agglomeration degree of industry and knowledge, and provides a favorable environment for scientific and technological innovation [46]. Summarizing the existing studies, scholars have discussed the interactive relationship between innovation and new urbanization to some extent, but they mainly focus on the qualitative analysis of the one-way influence between the two and show a lack of targeted quantitative analysis. There has not been a comprehensive and systematic study on the mutual coordination relationship between the two, and its development trend and green innovation are fundamental for the transition from city towards eco-city. It enables shifts in the trajectory of the city in many different ways [47]. Therefore, the study of the relationship between the green innovation and the new urbanization and its time evolution process are of much theoretical value and practical guiding significance.
This study makes the following contributions to enriching this topic. First, it measures the new urbanization and green innovation level in the Yangtze River Delta city group with the entropy method and undesirable-SBM method. Second, the relationship between the new urbanization and green innovation is measured and analyzed through the coupling degree and coupling coordination degree. Third, an analysis of the spatial correlation between the green innovation level and new urbanization development is conducted. Last, using a geographical detector, we explore and analyze the main influencing factors that cause the coupling coordination degree of regional green innovation and the new urbanization.
The rest of this article is arranged as follows: the “Materials and Methods” introduces the Yangtze River Delta city group, the index system, and the selected research methods. In “Results”, an empirical study is conducted into the new urbanization and green innovation in the Yangtze River Delta city group from 2010 to 2020. Then, the relevant influencing factors are explored. Finally, “Discussion” explains the internal mechanism of green innovation and new urbanization, as well as their relationship with space and economic development. “Conclusions” discusses the countermeasures.

2. Materials and Methods

2.1. The Introduction to the Yangtze River Delta City Group

The Yangtze River Delta city group is located in the Yangtze River Economic Belt in eastern China and is centered on Shanghai with Hangzhou, Nanjing, and Hefei as its sub-centers (Figure 1). It consists of Nanjing, Wuxi, Changzhou, Suzhou, Nantong, Yangzhou, Zhengjiang, Yancheng, and Tàizhou in Jiangsu province, Hangzhou, Ningbo, Huzhou, Jiaxing, Shaoxing, Jinhua, Zhoushan, and Taizhou in Zhejiang province, and 26 cities in Anhui Province, including Hefei, Wuhu, Ma’anshan, Tongling, Anqing, Chuzhou, Chizhou, and Xuancheng etc. The Yangtze River Delta city group is the sixth-largest urban agglomeration in the world and the most dynamic and representative urban agglomeration in China [48]. At the same time, it is also the top priority of the high-quality development of the Yangtze River Economic Belt [49]. It is located in the alluvial plain through which the Yangtze River flows into the sea, covering an area of 211.7 thousand square kilometers and accounting for about 2.2% of China’s total area. At the end of 2021, the permanent population was about 172 million, accounting for about 12% of the country’s total population, and the regional GDP is 22.73 trillion CNY, occupying about 26% of China’s GDP. The “Development Plan for the Yangtze River Delta city group” specifies that it will be built into the most economically dynamic resource allocation center; a global influential technological innovation highland; an important global modern service industry and advanced manufacturing center; an important international gateway in the Asia-Pacific region; a pioneer in the new round of reform and opening up; and a beautiful China construction demonstration zone [50]. By 2030, it will be fully built into a world-class urban agglomeration with global influence and become the most influential and dynamic area in terms of ecological environment, innovation development, and coordinated urban-rural development. It is the most representative area of innovation in China and the benchmark for new urbanization [51]. Therefore, taking it as the research object is of great significance and reflects the future development trend to some extent. It is very valuable to explore whether or not and how green innovation and new urbanization can be synergistic development, which may illustrate and influence regional sustainable development. The Yangtze River Delta city group has been given a lot of expectations and policy test bases (for example, Zhejiang Common Prosperity Demonstration Zone, Shanghai Free Trade Zone, Yangtze River Delta Ecological Integration). Its success will, directly and indirectly, affect China’s future policies and development strategies [52]. Similarly, it can also be regarded as a reference for the sustainable development of other countries and regions.

2.2. Constructing Index System

To accurately evaluate the coordination degree between the regional green innovation and the new urbanization system and to reflect the interaction between the indicators in each system, the evaluation index system (see Table 1) below was developed by referring to the existing literature and considered the characteristics of the two systems.
The performance of regional green innovation is commonly measured with the input-output method from an efficiency perspective [8], which needs to consider the resource input and undesirable environmental pollution output [35]. It contains three aspects: innovation input, desirable output, and undesirable output. Innovation input mainly includes human resources, capital, and energy, and desirable output indicators mainly include patent authorization, sales revenue of new products, and industrial added value. Three wastes in industrial production are undesirable output. Based on the existing literature and the availability and accuracy of data, the volume of books in public libraries represents a regional innovation environment. Therefore, based on the traditional innovation indicator system, the green innovation indicator system has deliberately added innovation environment to better reflect the science, greenness, and sustainability of innovation. There are different models for measuring green innovation efficiency; the SBM model is still a good model for measuring the green innovation efficiency [8]. With this in mind, this paper uses the SBM model [53], considering undesirable outputs to measure regional green innovation performance.
Table 1. Input and output.
VariableIndicator and IntroductionReferences
InputThe full-time equivalence of R&D personnelZhang [54]; Wang [48]
Intramural expenditure on R&DZeng [12]
Energy input (total energy consumption)Dai [35]
The volume of books in public libraries
Desirable outputNumber of domestic granted invention patentsChen [55]
Sales revenue of new productsFeng [56]
Industrial added valueLuo [57]
Undesirable outputIndustrial wastewater emissionsDai [35]; Zeng [12]
Industrial SO2 emissionsDai [35]; Zeng [12]
Industrial solid waste emissionsDai [35]; Zeng [12]
The new urbanization system is a comprehensive evaluation system that is different from the traditional one, which is only based on population. It includes six parts (see Table 2), which are population, economy, space, society, ecology, and environmental pollution. The population urbanization rate is mainly indicated by the proportion of the urban population in the total population of the region with the traditional accounting method. The economic urbanization rate mainly reflects the structural proportion of agriculture and non-agriculture and their compositions and is expressed by the proportion of the secondary and tertiary industries’ output value in the total output value. The spatial urbanization rate is measured by the conversion of land nature, that is, the degree to which rural and agricultural land is converted into urban construction land. Specifically, it is measured by the proportion of built-up area in the total land area of the city district. Society urbanization, which indicates the development level of urban and rural economy and society and people’s living standards, is measured by the total retail sales of social consumer goods per capita in urban and rural people. The ecological urbanization rate is measured by the park green area per capita. According to the practical situation of China, the comprehensive recycling rate of solids and other wastes is above 95% (according to the data from the 2020 statistical annual report published by the provinces and cities of the Yangtze River Delta city group). As a result, this article selects the main pollution source as industrial wastewater and PM2.5 [58] as the environmental pollution. The new urbanization is in line with social development. Based on the existing research, this study takes population, economic, spatial, social ecology, and environment into consideration, aiming at scientific and sustainable development of the new urbanization.

2.3. Data Sources

The Yangtze River Delta city group is a typical academic research demonstration area of China, and the main data are taken from the EPSDATA (epsnet.com.cn) (accessed on 1 March 2022) and China Statistical Yearbook (http://www.stats.gov.cn/tjsj/ndsj/) (accessed on 1 March 2022). The PM2.5 data come from PM25.in (www.pm25.in) (accessed on 1 March 2022). The map comes from the Resource and Environment Science and Data Center (www.resdc.cn) (accessed on 1 March 2022).

2.4. Comprehensive Evaluation Method

2.4.1. SBM Model

The traditional DEA model is based on radial and angular measurements. It lacks full consideration of the slackness of input and output, and it cannot accurately measure the efficiency when there are undesired outputs. To overcome these shortcomings, Tone (2004) [3] proposed a non-radial and non-angle SBM model considering undesirable outputs. Drawing on the existing research (Chen et al., 2021 [62] and Li et al., 2020) [63], this study applies the undesirable-SBM model to measure the green innovation performance to reflect the regional green innovation level of the researched area.

2.4.2. Entropy Method

The entropy method is an objective-weighting method, and its use of determining the index weight has a high credibility degree. The index is divided into a positive index and a negative index. The larger the positive index value is, the more favorable it is for the system, while the larger the negative index value is, the more unfavorable it is for the system. Because of the original variable dimensions, we first standardize the selected indicators as follows:
Positive index:
  X i j = X i j min ( X i j ) max ( X i j ) min ( X i j )
Negative index:
  X i j = max ( X i j ) X i j max ( X i j ) min ( X i j )
where Xij represents the comprehensive score of the jth in the year i, max (Xij) is the maximum value of the jth index, min (Xij) is the minimum value of the jth index, and Xij is the normalized value of Xij.
Y i j = X i j i = 1 m X i j ( 0 Y i j 1 )
e j = 1 ln m   i = 1 m Y i j ln Y i j
d j = 1 e j
w j = d j j = 1 m d j
where Yij represents the proportion of the jth index value in year i; ej and dj are the entropy value and utility value of the indicator j, and wj stands for the weight of the indicator j.
U = i = 1 m w j X i j
where U represents the comprehensive score of the new urbanization. The larger the comprehensive score, the higher is the new urbanization development degree.

2.5. Coupling Coordination Degree Model

The coupling degree model is a typical application of hard science principles in the field of soft science. Because of its clear meaning and simple calculation, this model has been widely used in geographical research [64]. Coupling mainly refers to the phenomenon in which two or more systems affect each other through various interaction mechanisms. Drawing lessons from the related models of coupling coordination degree in physics, the expression of the coupling degree model generally has two forms. Given n ≥ 2 system, Ui ≥ 0 is used to represent the evaluation value of the system; then the generalized calculation formula of the coupling degree can be expressed as formulas (8) and (9):
C 1   ( U 1 , U 2 , , U n ) = n × [ U 1 U 2 U n ( U 1 + U 2 + + U n ) n ] 1 n
C 2   ( U 1 , U 2 , , U n ) = 2 × [ U 1 U 2 U n i < j ( U i + U j ) 2 n 1 ] 1 n
D = C T ,   T = α 1 U 1 + α 2 U 2 + + α n U n
where C1 and C2 represent two kinds of coupling degrees. When n = 2, C1 = C2, and when n > 2, 0 ≤ C1C2 ≤ 1 [65]. D is the coupling coordination degree; T is the comprehensive coordination index; α1, α2, …, αn are the undetermined coefficients. Referring to the existing research results [66] and combined with the practical reality, this paper takes α1 = α2 = … = αn = 1/n.
So far, there are no uniform criteria for the coordination degree [46]. The existing researchers have paid more and more attention to green innovation efficiency and new urbanization efficiency in recent years, but most of them are limited within the scope of a single efficiency factor. As a result, with a reference to the previous studies [67], the coordination degree is divided into five categories, as shown in Table 3.

2.6. Spatial Autocorrelation Analysis

The spatial weight matrix is a prerequisite for spatial autocorrelation analysis, and it is also the basis for Moran’s I statistical tests and model construction. Wij represents the spatial weights, which are mainly divided into spatial weights based on adjacency relationships and spatial weights based on distance relationships. Considering economic relations and the practical needs of the research, the minimum threshold distance of the spatial weights based on the distance relationship was chosen for this study.
W i j = { 1 0 bound   ( i ) bound   ( j ) 0 bound   ( i ) bound   ( j ) = 0
where bound (i) is the boundary of a spatial unit. Because Zhoushan and other cities do not share a common boundary on the map but have a cross-sea bridge connection with Ningbo, this is according to the closeness of economic and social exchanges which choose to connect with Ningbo.
The Moran’s Index is divided into Global Moran’s I and Local Moran’s I. Global Moran’s I indicates whether there is agglomeration or anomaly in space, while local Moran’s I indicates where there is an anomaly or where there is agglomeration. The expression of Global Moran’s I is given by:
I = N S 0 i = 1 N j = 1 N W i j ( y i Y ¯ ) ( y j Y ¯ ) i N ( y i Y ¯ ) 2
where S 0 = i = 1 N j = 1 N W i j , Y ¯ = 1 N y = 1 N y i , and   y i represents the observed value of region i. N is the total number of observation regions.
The expression of local Moran’s Ii is:
I i = Y i Y ¯ S i 2 j = 1 , j i N W i j ( Y j Y ¯ )

2.7. Geographical Detector

Compared to the traditional linear model, the geographical detector is capable of handling categorical dependent variables and exploring the spatiotemporal heterogeneity of geographic phenomena under the influence of potential factors without a linear hypothesis [68,69]. It assumes that if variable X contributes to variable Y, then the spatiotemporal distribution of Y is similar to that of X. The factor detector uses a q value to quantify the influences of X on Y; q is given by the following formula:
q = 1 h = 1 L N h σ h 2 N σ 2
where q is the measurement value of indicator differentiation, which is used to express the degree of interpretation of an independent variable to a dependent variable; N is the number of indicators; σ2 is the variance of the indicators; and h = 1, …, L, L denotes the number of categories or partitions. The value range of q is [0, 1]. The larger the q value, the stronger is the influence of variable X on Y.
In this study, the factor detection of the geographical detector is used to explore and analyze the main influencing factors that cause the coupling coordination degree of the regional green innovation system and the new urbanization system.

3. Results

This paper uses panel data of the Yangtze River Delta city group from 2010 to 2020 to explore whether regional green innovation and new urbanization can achieve synergistic development through spatiotemporal evolution analysis and coupling coordination degree model.

3.1. The Green Innovation and New Urbanization Development in the Yangtze River Delta City Group

3.1.1. An Overview of the Development of the Yangtze River Delta City Group

Yangtze River Delta city group is the best performing regional area in terms of economic aggregate and growth rate in China. From Figure 2, it can be seen that the GDP per capita is 16,162 USD in 2020, while China’s GDP per capital is 11,300 USD in the same year. During the study period, it maintained an average annual growth rate of 10.30%, while China’s domestic average growth rate was 7.15%. Therefore, the Yangtze River Delta city group is known as the compass, locomotive, and barometer of China’s economy and its future development. Economic development has brought extremely great economic benefits, but it has also formed serious ecological pressure on this regional area [70]. Especially in some cities in Jiangsu province [46], the number of companies taking severe environmental risks ranks among the top in China, and coal consumption accounts for nearly 60% of primary energy consumption, which leads to an energy consumption structure based on coal and an industrial structure based on heavy chemicals [46]. Therefore, the study of the relationship between green innovation and new urbanization development highlights future development and its trends.

3.1.2. Analysis of the Green Innovation and New Urbanization System Typical Index

Figure 3 shows the increasing emphasis on green innovation in recent years, especially on some core technologies. In terms of green innovation, the annual growth of capital investment in R&D reached 15.86% (from 165 billion CNY in 2010 to 672 billion CNY in 2020), which far exceeds the economic growth rate of 7.15% (Figure 2) and indicators development rate (Table 4) in the same period. However, the number of full-time equivalents of R&D personnel has stayed roughly the same (from 1,144,610 man-years in 2010 to 1,423,600 man-years in 2020). The number of domestic granted patents, which is an important indicator reflecting the innovation index, increases in waves by 1.323. The proportion of successful patent applications has shown a downward tendency in the past 11 years (Figure 3), which suggests that innovation is no longer as productive as it used to be. This may be related to the stage of regional development and social development. The reduction of green innovation will affect the development of the entire regional innovation system and may further affect the development of new urbanization.
New urbanization is a comprehensive and developmental system index. It consists of various sub-indexes. It encompasses people, economy, society, ecology, and environment, which is a new type of people-oriented and eco-environment protection and adapts to the future trend of social development. Over the last decade or so, China’s environmental governance has achieved very good results, especially in some regions. Wastewater discharge dropped from 5.4 billion tons in 2010 to 3.1 billion tons in 2020 (Table 4), and the average annual PM2.5 was from 51.17 mg/m3 to 34.2 mg/m3. The retail sales of consumer goods per capita increased by an average of one per cent each year, which was well below the inflation rate of the same period in China. Another important indicator of the ecological environment is park green area per capita growing by over half a square meter. Due to the continuous expansion of some cities, the proportion of built-up areas has decreased in recent years. Yangtze River Delta city group is no exception. Of course, there is a little difference from city to city in this regional area.

3.1.3. Analysis of Green Innovation and New Urbanization Coupling Coordination Degree Development

To present the green innovation and new urbanization development more clearly, we use SBM and comprehensive score to reflect the regional development degree of green innovation and new urbanization. In Table 4, from 2010 to 2020 the results of green innovation and new urbanization system in the Yangtze River Delta city group were on the rise, and the green innovation which has been growing for a long time is growing fast. Although the new urbanization has also been growing, its growth rate was smaller than that of the green innovation system and decreased gradually, only from a quantitative point of view. During the study period, the green innovation system developed faster than the new urbanization system, but the two systems were not generally out of sync and coordination. It can be seen that the coupling degree (C) fluctuated around the range of 20%. Table 5 also revealed that the coupling coordination degree (D) of the two systems does not change much, but it has generally been increasing, and the increase rate is relatively little.

3.2. The Coupling Coordination Analysis of Green Innovation and New Urbanization in the Yangtze River Delta City Group

3.2.1. Coupling Coordination Index

To further study the relationship between green innovation and new urbanization, the coupling coordination degrees (D) of 26 cities from 2010 to 2019 in the Yangtze River Delta city group were calculated by using formulae (8) and (10). It can be seen from Table 6. for the coupling coordination degree that the overall upward trend is unstoppable. Among them, 25 cities were on the rise, while Jiaxing reached its peak of 0.4301 in 2018 and fell a little (0.4301–0.4291) in 2019. The coupling coordination degree of Nanjing has improved the fastest (0.385–0.479), both in terms of volume and growth rate. Nanjing was the only city among the 26 cities in which the growth rate is over 20%.
Comparing the top three cities and bottom three cities ranked by the coupling coordination degree in each year in Table 5 and Table 6, it is observed that the data from 2010 to 2020 can be divided into three levels by variation: (1) there are 13 cities which increased less than 10%; (2) six cities’ growth is between 10% and 12%, including Ningbo, Jinhua, Chizhou, Maanshan, Huzhou, and Nantong; (3) with an increase between 12% and 15% there are Xuancheng, Yancheng, and Shanghai; (4) the top increases are Nanjing (24.47%), Suzhou (18.88%), Hangzhou (16.45%), and Hefei (15.23%). In 2000, only Shanghai ranks Preliminary coordination, along with all of the other cities in Preliminary disorder. By 2020, there was Ningbo, Hangzhou, Wuxi, Suzhou, Nanjing, and Shanghai located in Preliminary coordination, and the rest are still in their original Preliminary disorder.

3.2.2. Urban Scale Characteristics in the Yangtze River Delta City Group

Comparing the top three cities and bottom three cities ranked by the coupling coordination degree in each year in Table 7, it is observed that the data from 2010 to 2020 can be divided into two parts by the ranking. From 2010 to 2014, the top three have always been Shanghai, Jiaxing, and Hangzhou. In 2016, it turned to Shanghai, Jiaxing, and Nanjing. In 2018, it became Shanghai, Nanjing, and Suzhou. During the study period, Chizhou and Anqing were at the lowest level, while Xuancheng and Chuzhou also appeared at the bottom. The average of D for the top three cities increased from 0.414 to 0.482 by 13.52%, while the average of D for the bottom three cities also increased from 0.318 to 0.349 by 9.75%. Therefore, the gap between different cities in the Yangtze River Delta city group has a further increasing trend.

3.3. Spatiotemporal Analysis of Coupling Coordination Degree of Green Innovation and New Urbanization

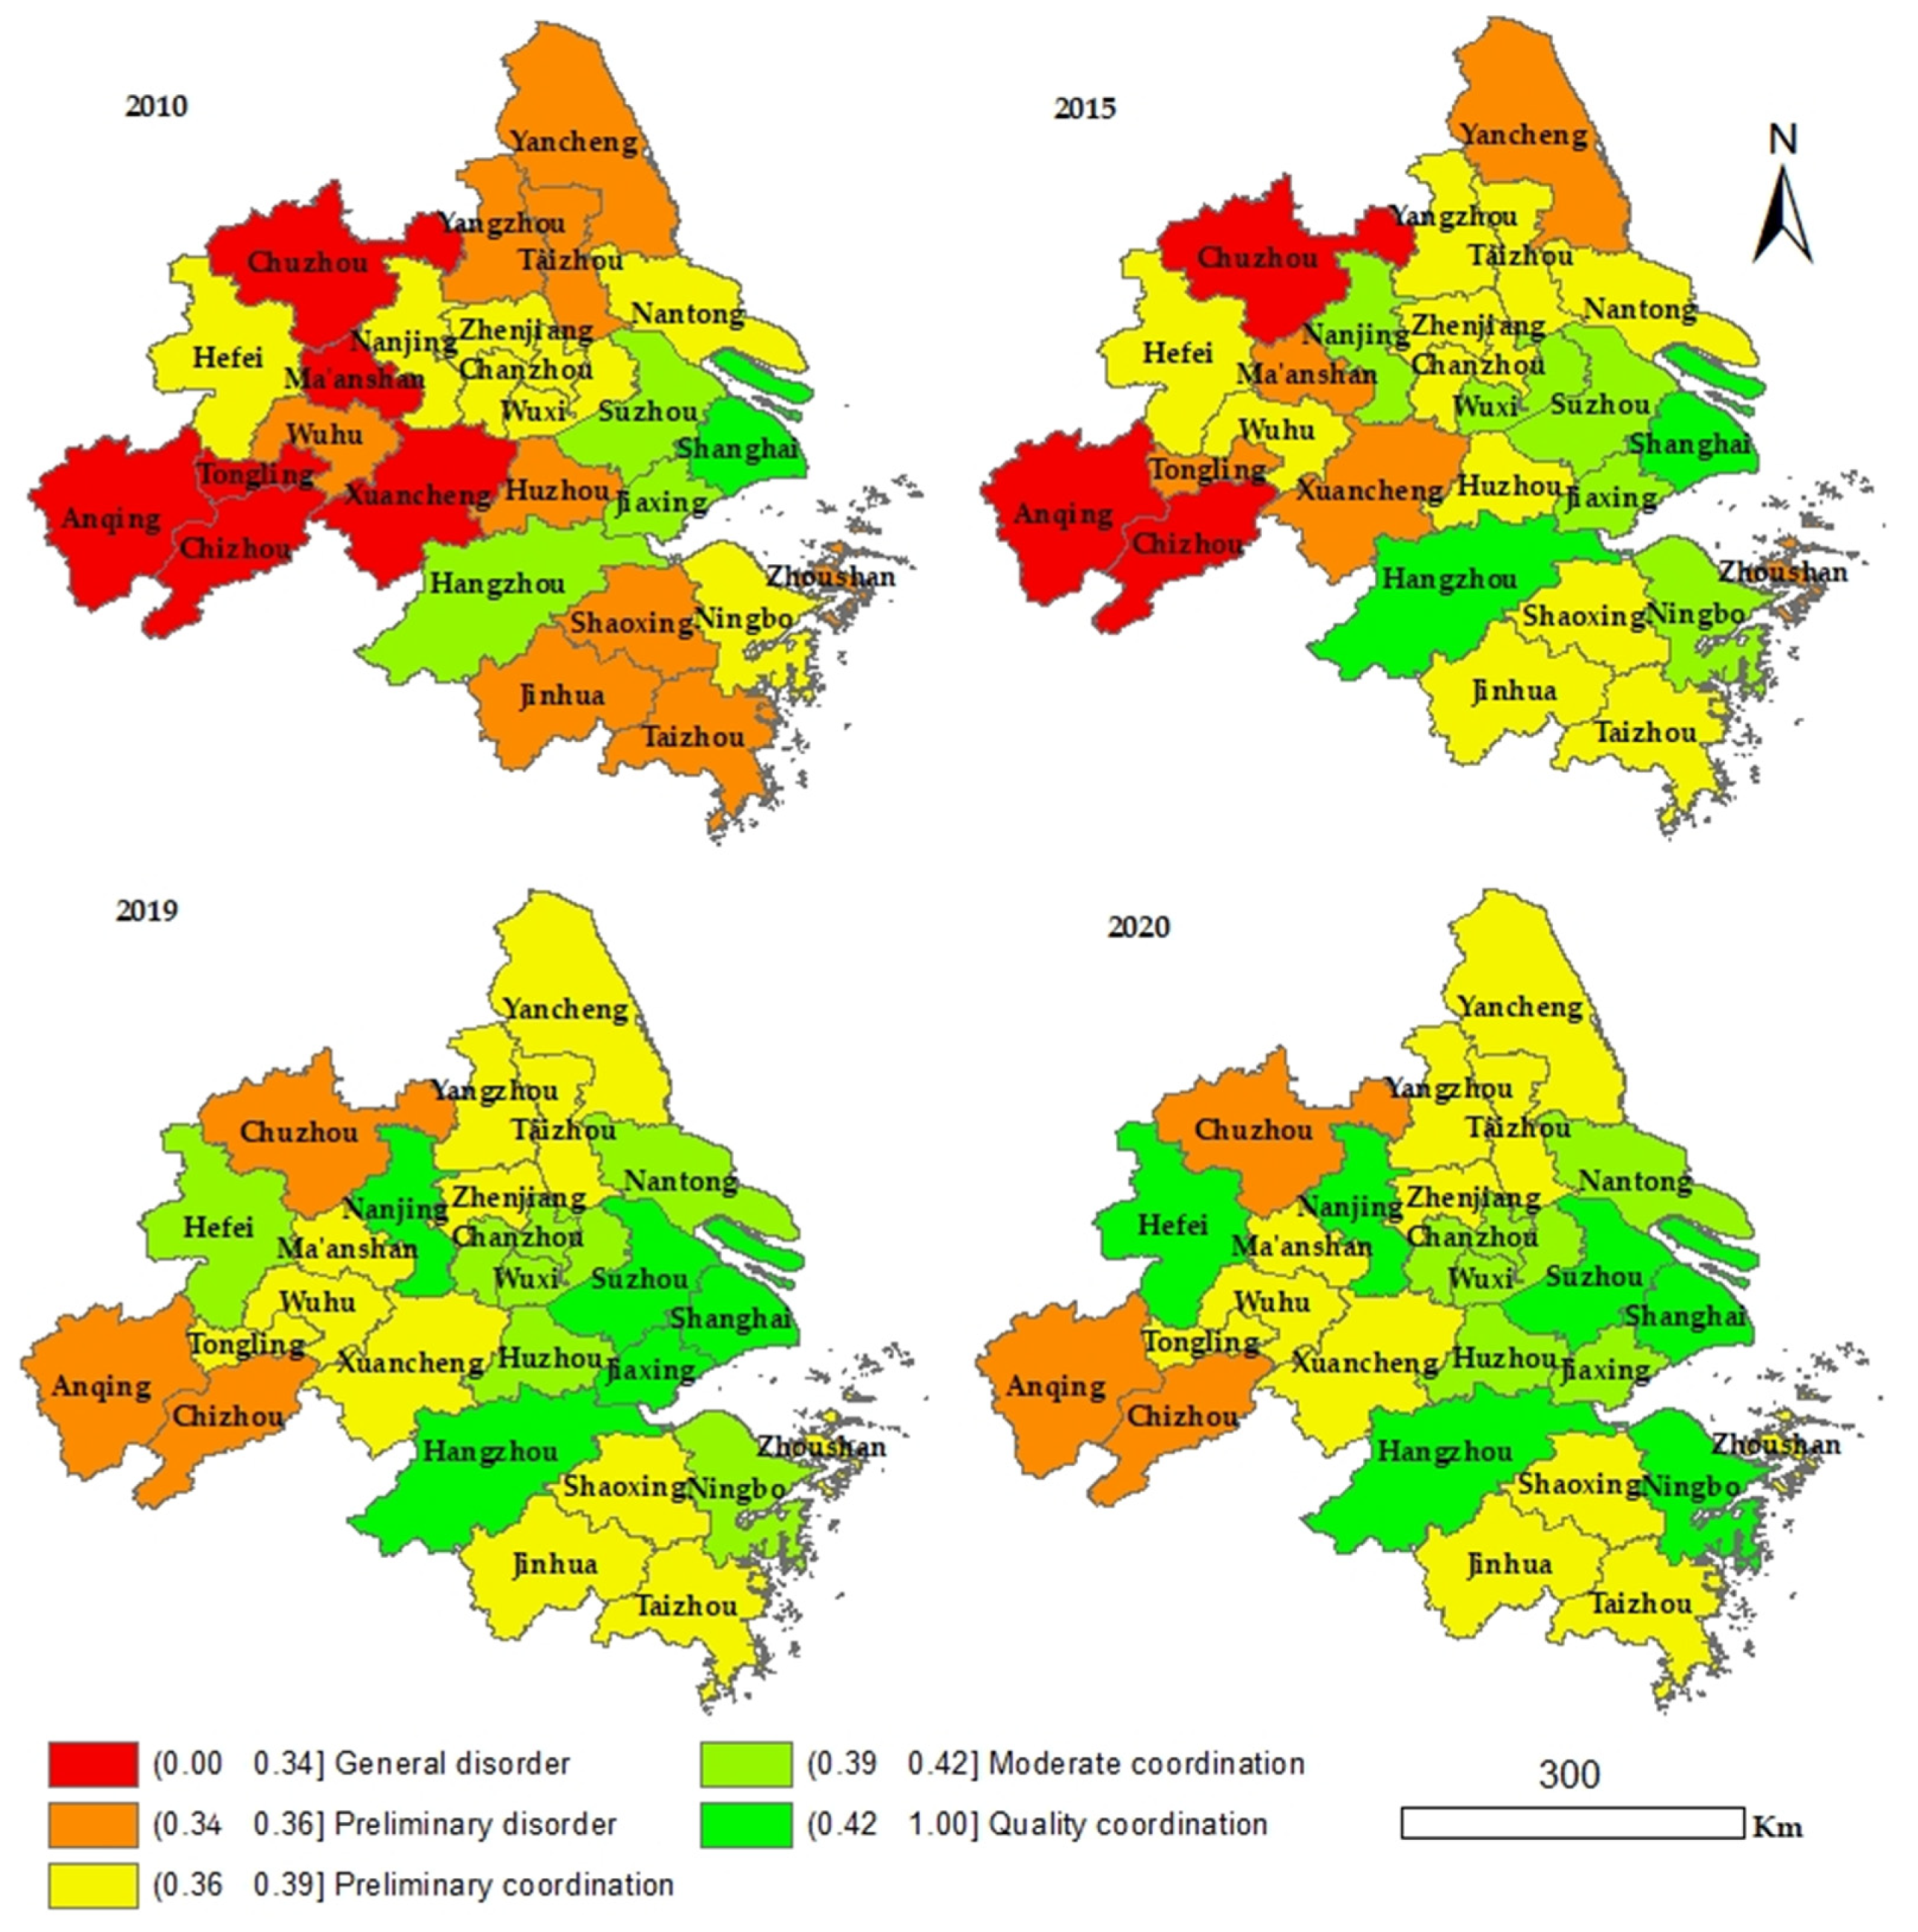
3.3.1. Evolution Characteristics of Spatial Distribution Differences

By observing the changing trend of coupling coordination degree in Table 6 and Table 7 and Figure 4, the four years of 2010, 2015, 2019, and 2020 are selected as typical years to analyze the spatiotemporal distribution differences in coupling coordination degree between green innovation and new urbanization in the Yangtze River Delta city group.
From Figure 4, in 2010 six cities were at the lowest level (general disorder): Anqing, Tongling, Chizhou, Xuancheng, Ma’anshan, and Chuzhou; only Shanghai was at the highest stage of quality coordination; Suzhou, Hangzhou, and Jiaxing were in the moderate coordination stage. There were eight cities in the preliminary disorder and preliminary coordination, respectively. By 2020, six cities reached the highest level, namely Hefei, Ningbo, Suzhou, Hangzhou, Nanjing, and Shanghai, during the study period. In 2020, due to COVID-19, the Yangtze River Delta city group still maintained strong growth (see Figure 2), compared with 2019; Hefei and Ningbo entered the quality coordination, and some cities have also retreated a little in value (see Table 6), but most of them were still within the same level, and no cities regressed (except Jiaxing). At the beginning of the study period, six cities were in the general disorder; by 2020, these cities upgraded at least one level. Some entered the preliminary coordination (e.g., Xuangcheng), and no city was in the general disorder.

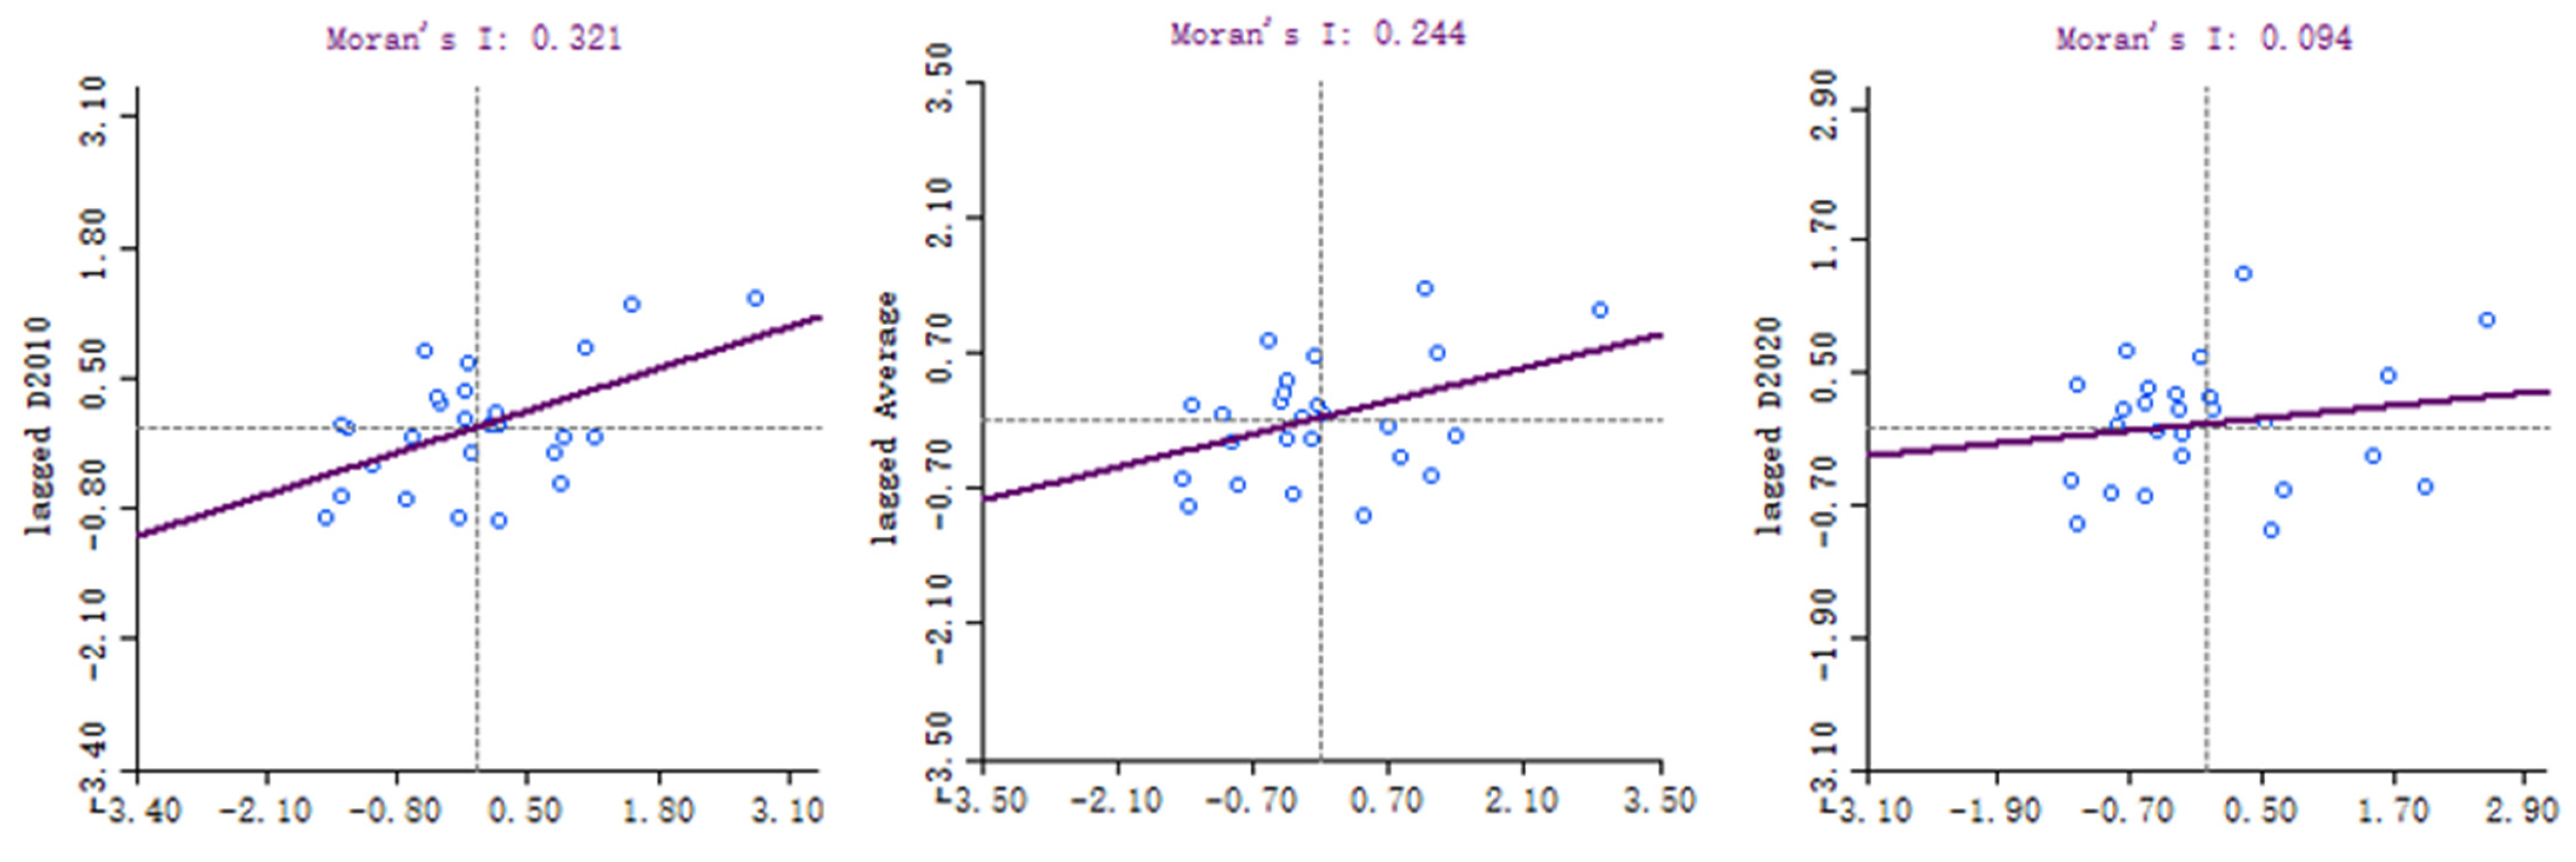
3.3.2. Spatial Autocorrelation Analysis

Based on the data of 26 selected cities regarding the coupling coordination degree between green innovation and new urbanization system from 2010 to 2020, the spatial correlation of coupling coordination degree for each city was analyzed. For the systematic and scientific study, three value points (2010, Average, 2020) are selected to analyze.
In Figure 5, the horizontal axis represents the comprehensive score of coupling coordination degree between the two systems for the 26 cities and the vertical axis denotes the comprehensive score of the mean coupling coordination degree for the 26 cities after the spatial weighting calculation. It can be concluded that the coupling coordination index for the Yangtze River Delta city group has a certain spatial aggregation. Its spatial correlation was relatively very strong from the Moran index value, and the tendency was to weaken (from Moran‘s I 0.321 to 0.094). The correlation is strong to weak, indicating that the synergy between new urbanization development and green innovation does display a particularly obvious spatial agglomeration. It can be seen that the spatial concentration force in these regions is smaller. This also reflects that, to some extent, the gap in development levels of the local cities and the external effects are weakened.
Figure 6 is a cluster map of the Yangtze River Delta city group showing the average scores of the coupling coordination index at a significance level of 5%. It shows that Shanghai, Suzhou, and Jiaxing are of the High-High type; Hefei and Nanjing are of the High-Low type; Chizhou, Tongling, and Wuhu are of the Low-Low type; and the correlations in other cities are not very prominent. In 2010, compared with the average, there is less of Nanjing’s High-Low type. Similarly, there is less of Suzhou’s High-High type, Nanjing’s High-Low type, and Tongling’s Low-Low type in 2020. Through the spatial correlation analysis of the coupling coordination degree in the 26 cities, the conclusions can be drawn: from 2010 to 2020, the cities with a relatively high coupling coordination degree between the green innovation and new urbanization system were Hefei, Nanjing, Shanghai, Jiaxing, and Suzhou. Comparatively speaking, the coordination between Chizhou, Tongling, and Wuhan is lower, and its level of coordinated development is not good. On the contrary, the coordinated governance capabilities of the nearby cities are stronger. They should keep pace and proactively learn from other cities’ experiences to improve the ability of coordinated governance of the green innovation and new urbanization system and improve the level of coordinated development in the region.

4. Influence of the Index Factors of Coupling Coordination Degree between Green Innovation (GI) and New Urbanization (NU) of Yangtze River Delta in China

4.1. Variables

To further explore the influence of spatial heterogeneity cities in the Yangtze River Delta on the coupling coordination of green innovation and new urbanization, according to existing the relevant articles and conclusions [7,17,71,72,73], 12 factors are selected from the three dimensions of natural resources, economic development, and social conditions society (see Table 8). The level of regional greening is closely related to local natural conditions, such as forest coverage, which will affect the purification capacity of local air pollution and has a direct and indirect relationship with the absorption and conversion of carbon dioxide. Therefore, in terms of natural resources, forest coverage, solar radiation, water resources, and the temperature as the main factors. In terms of economic factors, it is mainly explored from four aspects: the level of economic development, industrial structure, industrialization level, and digital economy development level. The indicators of the city’s digital economy development and computing method are based on and refer to the relevant literature [74]. In addition, digital financial inclusion is added, because digital finance plays an important positive role in influencing industrial investment, transformation, upgrading [75], regional green economy [63], and development of new urbanization [76]. The digital financial inclusion coefficient cites data from the Peking University Digital Financial Inclusion Index of China (PKU-DFIIC) [77]. In terms of the social conditions, it mainly includes the social carrying capacity, the level of government input, people’s wealth level, and educational standards.

4.2. The Driving Factors of the Coupling Coordination Degree between Green Innovation and New Urbanization

Using the natural breakpoint method through ArcGIS soft, each factor is discretized by the quintile, and the GeoDetector is used to detect the influence of each element on the coupling coordination degree of the two systems and its interaction. Table 6 shows the q-value measurements of each factor and their interactions by geographic detectors from 2000 to 2020. In general, economic, social, and natural differences are the driving forces that contribute to the heterogeneity of the coupling coordination degree, and the explanatory power of economic development (0.370) > the social conditions (0.219) > natural resources (0.143) (see Table 9). As shown in Table 9, among all of the detection factors, economic development is the highest (0.116), while the temperature conditions are the lowest (0.025). In factor interactions, of the 66 interactions groups, 40 groups show nonlinear enhancement, and the remaining 26 are double-enhanced. In the factors’ interaction, the digital economy (E4) interacts with the other factors by nonlinear enhancement (except forest resources N1), but its own is only 0.057, ranking in the middle of all factors (6/12).

5. Discussion

5.1. Green Innovation and New Urbanization Is a Synergistic Effect between the Two

Urbanization development should rely on technological progress and promote economic growth through technological progress [78]. Wilson and Vandenabeele [43] analyzed that technological innovation was the source of power to promote urbanization development. Green innovation is based on the regional science and technology innovation system, which highlights the friendliness and sustainability of the environment. Therefore, indicator factors such as environmental friendliness and sustainability are highlighted in the measurement of the green innovation system. The new urbanization is a complex system, which is quite different from the traditional one only using population as the measurement index. It includes population urbanization, economic urbanization, spatial urbanization, social urbanization, ecological urbanization, and environmental pollution. What is the relationship between the green innovation system and the new urbanization system? Understanding the relationship between the two becomes meaningful. By using the coupling degree model in Table 4, it can be known that there is a coupling development between green innovation and new urbanization. The coupling degree between the two has always been maintained at around 0.25, and the coupling coordination degree ([0.361 0.403]) has been improved year by year during the study period except for the year 2020 (because of COVID-19, all parts have been significantly affected, and so the coupling coordination of the two has been slightly affected [0.405 0.403]. However, this is not the topic of this paper, and so we do not discuss it). Therefore, there is a clear interaction between the two systems. Therefore, the synchronization effect of the two systems is obvious. Previous studies have shown that technological innovation has a significant positive effect on the quality of the new urbanization development. The communication and mutual promotion mechanism between the two systems have not been fundamentally changed due to the additional green indicators. However, compared with the impact of technological innovation on new urbanization, the impact made by green innovation has certain differences in the coupling degree, coupling coordination degree, and relative development speed of new urbanization. This may be mainly because the factors such as environment and sustainability have weakened the interaction between the two.

5.2. The Intensity and Coupling Coordination between Green Innovation and New Urbanization Are Affected by the Level of Economic Development

Yipiao, et al. [79] found that there is an interaction between new urbanization and technological innovation which is manifested as a positive bilateral impact. The coupling coordination between the two is affected by regional economic level, and the smaller the impact of the developed regions on new technological innovation level, the greater is the role of urbanization. It can be seen from Table 9 that the level of economic development is the strongest among all the detected factors. According to the data released by the National Bureau of Statistics in 2020, there are 16 cities in China with a GDP exceeding one trillion CNY, eight of which are in the Yangtze River Delta city group. It can also be seen from Table 6 and Table 9 that the level of economic development will affect the degree of coupling coordination between the two. As the economic level rises, the coupling coordination degree further improves. It can be found from Figure 5 and Table 5 that Anqing’s coupling coordination increases accordingly. Anqing’s coupling coordination stayed at the lowest level throughout the study period, though most of its neighboring cities were at a higher level. Anqing’s main indicators reflecting the level of economic development, such as GDP per capita (E1) and digital economy development level (E4), are at the bottom level among 26 cities in the Yangtze River Delta. Chizhou and Chuzhou have quite similar situations. In brief, the lower the economic level, the weaker is the coupling coordination degree accordingly. It can be concluded that the main factor is the level of economic development, which affects the intensity and coupling coordination between green innovation and new urbanization. From the existing research (transportation infrastructure [80]), and environmental pollution [1]. Therefore, the development of the green economy is still the most important solution to solve the problems encountered on the way forward and is an important driving force for promoting green innovation and new urbanization coupling coordinated development.

5.3. Green Innovation and New Urbanization Have a Positive Spatial Correlation and Regional Agglomeration

It can be seen from Figure 5 that the global Moran’s I index reflecting spatial auto-correlation is 0.244, indicating that there is a positive spatial correlation. From Figure 6 LISA cluster map, it can be found that there are high-high, low-low, and high-low clusters. From the perspective of spatiotemporal patterns, Jiaxing’s coupling coordination has been maintained at a relatively high level, thanks to the influence of spatial spillover effects of surrounding cities such as Suzhou and Shanghai. It can be found from Figure 4 and Table 6 that the overall overflow benefits of space are obvious, and the internal economic development level is an important factor that affects the coupling coordination between green innovation and new urbanization; its effect exceeds the external spatial effect.

6. Conclusions and Policy Implication

The relationship between green innovation and new urbanization has not been thoroughly and systematically analyzed and discussed in depth. This article first builds scientific indicator systems for green innovation and new urbanization based on the existing literature and research results; innovatively analyzes the internal relationship between green innovation and new urbanization system by the methods of coupling and coupling coordination; and combines the external relationship of these two methods to further explain whether green innovation and new urbanization achieve synergistic development and what factors can promote coupling coordination development. Taking the Yangtze River Delta city group as an example, the green innovation and new urbanization development and the coupling degree and coupling coordination degree between them were evaluated in 11 consecutive years from 2010 to 2020, and their spatiotemporal characteristics and evolutionary laws were investigated as well. The main conclusions are drawn as follows. (1) Green innovation has facilitated the development of new urbanization, and meanwhile, new urbanization has also provided beneficial support for green innovation. Therefore, there is a synergy between the two which advances in the interval of simultaneous development. For this reason, green innovation and new urbanization must be supported simultaneously to achieve coordinated and synchronized development. (2) The interaction and coupling coordination degree between green innovation and new urbanization is affected by the level of regional economic development, and its influence is greater than the spatial effect between adjacent cities. Based on this conclusion, the interaction degree and coupling coordination degree in each region are different, and corresponding measures should be taken based on the actual conditions of each region to ensure green and sustainable development. (3) In space, there is a positive relationship between neighbors. It shows high-high, low-low, and high-low clusters. (4) In the detection of driving factors, economic development > social conditions > natural resources; 40 groups show nonlinear enhancement, and the rest of the groups are double-enhanced. The digital economy factor accounts for the largest proportion.
Based on the previous results, several policy recommendations are made as a practical reference for policymakers. First, green innovation needs to be taken as seriously as new urbanization. Innovation is an important driving force for social progress and a major indicator of society’s future development. Green innovation, the integration of economy and ecology, is one of the two key components of sustainable development [81]. The process of urbanization involves the economy and society and is a comprehensive process [11]. There is also a view that urbanization contributes to increased environmental pollution [22]. Therefore, the government must balance it well, as there are internal coupling and coordination and unity mechanisms between green innovation and new urbanization. If one loses the other, it will inevitably lead to an imbalance, which will harm economic development, ecological harmony, and the realization of new urbanization. Second, more importance should be attached to green economic development. Economic development is still an important driving force for promoting coupling coordination between green innovation and new urbanization. Economic development is an important basis of funding for green innovation and other things, and it is also an important guarantee for the transformation and development of new urbanization. Of course, it is high-quality development under the new normal of economy rather than extensive growth by increasing the input of production factors alone. The interaction of the digital economy must be fully recognized and applied. Third, regional coordination and cooperation should be strengthened to build a green and high-quality regional integration. Because of positive spatial correlation and regional agglomeration, the mutual influence between two neighboring regions is obvious. Therefore, regional coordination can better realize the organic unity of green innovation and new urbanization overall and promote mutual development.
We would like to notify some limitations in this research. We are trying to build a more reasonable and perfect indicator system for measuring green innovation and new urbanization, which is limited by the availability, completeness, and continuity of data. As more data become available in the future, more relevant variables can be covered to build a more reasonable indicator system. This research is conducted at the city level in the Yangtze River Delta city group, which represents China’s future development trend and is the “barometer” of China’s economic development. Future research may be focused on the following aspects: choosing different regions and analyzing the topic at the provincial level from a more macro perspective or at the county level from a more micro perspective to obtain more accurate, practical, and universal conclusions in this field.

Author Contributions

Conceptualization, L.M.; Data curation, L.M.; Formal analysis, L.M.; Investigation, L.M. and Y.H.; Methodology, L.M. and X.C.; Project administration, X.C. and X.Q.; Supervision, X.C.; Visualization, Y.H. and X.Q.; Writing—original draft, X.C., Y.H. and X.Q.; Writing—review & editing, Y.H. All authors have read and agreed to the published version of the manuscript.

Funding

This research received no external funding.

Institutional Review Board Statement

Not applicable.

Informed Consent Statement

Not applicable.

Data Availability Statement

The data required in this study were all from the official statistical yearbook and statistical bulletin.

Conflicts of Interest

The authors declare no conflict of interest.

References

  1. Udemba, E.N.; Magazzino, C.; Bekun, F.V. Modeling the nexus between pollutant emission, energy consumption, foreign direct investment, and economic growth: New insights from China. Environ. Sci. Pollut. Res. Int. 2020, 27, 17831–17842. [Google Scholar] [CrossRef] [PubMed]
  2. Weng, X. On the main theories innovation of a report at the 19th national congress of the communist party of China. J. Kaili Univ. 2018, 36, 5–8. [Google Scholar]
  3. Liu, Y.; Zhu, J.; Li, E.Y.; Meng, Z.; Song, Y. Environmental regulation, green technological innovation, and eco-efficiency: The case of Yangtze river economic belt in China. Technol. Forecast. Soc. Change 2020, 155, 119993. [Google Scholar] [CrossRef]
  4. Liu, K.; Qiao, Y.; Shi, T.; Zhou, Q. Study on coupling coordination and spatiotemporal heterogeneity between economic development and ecological environment of cities along the Yellow River Basin. Environ. Sci. Pollut. Res. Int. 2021, 28, 6898–6912. [Google Scholar] [CrossRef] [PubMed]
  5. Schnell, I.; Cohen, P.; Mandelmilch, M.; Potchter, O. Portable–trackable methodologies for measuring personal and place exposure to nuisances in urban environments: Towards a people oriented paradigm. Comput. Environ. Urban Syst. 2021, 86, 101589. [Google Scholar] [CrossRef]
  6. Zhang, M.; Tan, S.; Zhang, Y.; He, J.; Ni, Q. Does land transfer promote the development of new-type urbanization? New evidence from urban agglomerations in the middle reaches of the Yangtze River. Ecol. Indic. 2022, 136, 108705. [Google Scholar] [CrossRef]
  7. Jin, C.; Shahzad, M.; Zafar, A.U.; Suki, N.M. Socio-economic and environmental drivers of green innovation: Evidence from nonlinear ARDL. Econ. Res.-Ekon. Istraživanja 2022, 1–21. [Google Scholar] [CrossRef]
  8. Zhao, N.; Liu, X.J.; Pan, C.F.; Wang, C.Y. The performance of green innovation: From an efficiency perspective. Socio-Econ. Plan. Sci. 2021, 78, 101062. [Google Scholar] [CrossRef]
  9. Magazzino, C.; Cerulli, G. The determinants of CO2 emissions in MENA countries: A responsiveness scores approach. Int. J. Sustain. Dev. World Ecol. 2019, 26, 522–534. [Google Scholar] [CrossRef]
  10. Zhao, X.; Ma, X.; Chen, B.; Shang, Y.; Song, M. Challenges toward carbon neutrality in China: Strategies and countermeasures. Resour. Conserv. Recycl. 2022, 176, 105959. [Google Scholar] [CrossRef]
  11. Muhammad, S.; Long, X.; Salman, M.; Dauda, L. Effect of urbanization and international trade on CO2 emissions across 65 belt and road initiative countries. Energy 2020, 196, 117102. [Google Scholar] [CrossRef]
  12. Zeng, J.; Škare, M.; Lafont, J. The co-integration identification of green innovation efficiency in Yangtze River Delta region. J. Bus. Res. 2021, 134, 252–262. [Google Scholar] [CrossRef]
  13. Aldieri, L.; Gatto, A.; Vinci, C.P. Evaluation of energy resilience and adaptation policies: An energy efficiency analysis. Energy Policy 2021, 157, 112505. [Google Scholar] [CrossRef]
  14. Yanbing, M.; Yunke, Y. An empirical study of the impact of new green urbanization on economic growth. J. Shanghai Univ. Soc. Sci. Ed. 2019, 36, 107–118. [Google Scholar] [CrossRef]
  15. Liang, L.; Chen, M.; Lu, D. Revisiting the relationship between urbanization and economic development in China since the reform and opening-up. Chin. Geogr. Sci. 2022, 32, 1–15. [Google Scholar] [CrossRef]
  16. Wang, C.; Cao, Y. Forecasting Chinese economic growth, energy consumption, and urbanization using two novel grey multivariable forecasting models. J. Clean. Prod. 2021, 299, 126863. [Google Scholar] [CrossRef]
  17. Wu, X.; Huang, Y.; Gao, J. Impact of industrial agglomeration on new-type urbanization: Evidence from Pearl River Delta urban agglomeration of China. Int. Rev. Econ. Financ. 2022, 77, 312–325. [Google Scholar] [CrossRef]
  18. Yu, Y.; Wang, T. New urbanization, energy-intensive industries agglomeration and analysis of nitrogen oxides emissions reduction mechanisms. Atmosphere 2021, 12, 1244. [Google Scholar] [CrossRef]
  19. Zhang, Q.; Tang, D.; Bethel, B.J. Impact of urbanization on the environmental regulation efficiency in the Yangtze River Basin based on the empirical analysis of spatial econometrics. Int. J. Environ. Res. Public Health 2021, 18, 9105. [Google Scholar] [CrossRef]
  20. Huang, S.Z.; Sadiq, M.; Chien, F. Dynamic nexus between transportation, urbanization, economic growth and environmental pollution in ASEAN countries: Does environmental regulations matter? Environ. Sci. Pollut. Res. Int. 2021, 1–16. [Google Scholar] [CrossRef]
  21. Liang, W.; Yang, M. Urbanization, economic growth and environmental pollution: Evidence from China. Sustain. Comput. Inform. Syst. 2019, 21, 1–9. [Google Scholar] [CrossRef]
  22. Hao, Y.; Zheng, S.; Zhao, M.; Wu, H.; Guo, Y.; Li, Y. Reexamining the relationships among urbanization, industrial structure, and environmental pollution in China—New evidence using the dynamic threshold panel model. Energy Rep. 2020, 6, 28–39. [Google Scholar] [CrossRef]
  23. Tan, F.; Yang, S.; Niu, Z. The impact of urbanization on carbon emissions: Both from heterogeneity and mechanism test. Environ. Dev. Sustain. 2022, 1–17. [Google Scholar] [CrossRef]
  24. Li, K.; Zu, J.; Musah, M.; Mensah, I.A.; Kong, Y.; Owusu-Akomeah, M.; Shi, S.; Jiang, Q.; Antwi, S.K.; Agyemang, J.K. The link between urbanization, energy consumption, foreign direct investments and CO2 emanations: An empirical evidence from the emerging seven (E7) countries. Energy Explor. Exploit. 2021, 40, 477–500. [Google Scholar] [CrossRef]
  25. Chen, F.; Liu, A.; Lu, X.; Zhe, R.; Tong, J.; Akram, R. Evaluation of the effects of urbanization on carbon emissions: The transformative role of government effectiveness. Front. Energy Res. 2022, 10, 115. [Google Scholar] [CrossRef]
  26. Long, X.L.; Sun, C.W.; Wu, C.; Chen, B.; Boateng, K.A. Green innovation efficiency across China’s 30 provinces: Estimate, comparison, and convergence. Mitig. Adapt. Strateg. Glob. Change 2020, 25, 1243–1260. [Google Scholar] [CrossRef]
  27. Wang, J.; Zhou, W.; Pickett, S.T.A.; Yu, W.; Li, W. A multiscale analysis of urbanization effects on ecosystem services supply in an urban megaregion. Sci. Total Environ. 2019, 662, 824–833. [Google Scholar] [CrossRef]
  28. Zheng, H.; Khan, Y.A.; Abbas, S.Z. Exploration on the coordinated development of urbanization and the eco-environmental system in central China. Environ. Res. 2022, 204, 112097. [Google Scholar] [CrossRef]
  29. Weng, Y.; Wang, X.; Du, L.; Zhou, X. Research on the coordination degree of new urbanization and green economy efficiency in Zhejiang province: Based on the perspective of “two mountains theory”. East China Econ. Manag. 2021, 1–9. [Google Scholar] [CrossRef]
  30. Zhang, W.R.; Zhu, L. Research on the relationship between green growth and urbanization efficiency based on ecological perspective. Fresenius Environ. Bull. 2021, 30, 13402–13409. [Google Scholar]
  31. Ding, X.; Cai, Z.; Fu, Z. Does the new-type urbanization construction improve the efficiency of agricultural green water utilization in the Yangtze River economic belt? Environ. Sci. Pollut. Res. Int. 2021, 28, 64103–64112. [Google Scholar] [CrossRef] [PubMed]
  32. Li, C.; Yan, J.; Xu, Z. How does new-type urbanization affect the subjective well-being of urban and rural residents? Evidence from 28 provinces of China. Sustainability 2021, 13, 13098. [Google Scholar] [CrossRef]
  33. Zhao, N. The impact of China’s new-type urbanization on individual sustainable development: A comparison between coastal and inland areas. Mar. Policy 2022, 136, 104938. [Google Scholar] [CrossRef]
  34. Luo, X.; Zhang, W.Y. Green innovation efficiency: A threshold effect of research and development. Clean Technol. Environ. Policy 2021, 23, 285–298. [Google Scholar] [CrossRef]
  35. Dai, L.; Mu, X.; Lee, C.C.; Liu, W. The impact of outward foreign direct investment on green innovation: The threshold effect of environmental regulation. Environ. Sci. Pollut. Res. Int. 2021, 28, 34868–34884. [Google Scholar] [CrossRef]
  36. Zhang, Y.L.; Sun, J.; Yang, Z.J.; Wang, Y. Critical success factors of green innovation: Technology, organization and environment readiness. J. Clean. Prod. 2020, 264, 121701. [Google Scholar] [CrossRef]
  37. Bai, Y.; Wang, J.-Y.; Jiao, J.-L. A framework for determining the impacts of a multiple relationship network on green innovation. Sustain. Prod. Consum. 2021, 27, 471–484. [Google Scholar] [CrossRef]
  38. Borsatto, J.; Bazani, C.L. Green innovation and environmental regulations: A systematic review of international academic works. Environ. Sci. Pollut. Res. Int. 2021, 28, 63751–63768. [Google Scholar] [CrossRef]
  39. Shen, C.; Li, S.L.; Wang, X.P.; Liao, Z.J. The effect of environmental policy tools on regional green innovation: Evidence from China. J. Clean. Prod. 2020, 254, 120122. [Google Scholar] [CrossRef]
  40. Xie, Z.; Wang, J.; Zhao, G. Impact of green innovation on firm value: Evidence from listed companies in China’s heavy pollution industries. Front. Energy Res. 2022, 9, 1026. [Google Scholar] [CrossRef]
  41. Li, L.; Msaad, H.; Sun, H.; Tan, M.X.; Lu, Y.; Lau, A.K.W. Green innovation and business sustainability: New evidence from energy intensive industry in China. Int. J. Environ. Res. Public Health 2020, 17, 7826. [Google Scholar] [CrossRef] [PubMed]
  42. Chen, M.; Liu, W.; Lu, D. Challenges and the way forward in China’s new-type urbanization. Land Use Policy 2016, 55, 334–339. [Google Scholar] [CrossRef]
  43. Wilson, R.P.; Vandenabeele, S.P. Technological innovation in archival tags used in seabird research. Mar. Ecol. Prog. Ser. 2012, 451, 245–262. [Google Scholar] [CrossRef] [Green Version]
  44. Shunfei, L.; Shengyuan, X.; Fayuan, W. Analysis on the effect of S&T investment and public support on urbanization-based on the empirical analysis of 11 provinces and cities spatial Dubin model in Yangtze River economic zone. Sci. Technol. Prog. Policy 2019, 36, 57–64. [Google Scholar]
  45. Jacobs, J. The Economy of Cities; Random House: New York, NY, USA, 1969. [Google Scholar]
  46. Peng, B.; Sheng, X.; Wei, G. Does environmental protection promote economic development? From the perspective of coupling coordination between environmental protection and economic development. Environ. Sci. Pollut. Res. Int. 2020, 27, 39135–39148. [Google Scholar] [CrossRef]
  47. Fei, J.; Wang, Y.; Yang, Y.; Chen, S.; Zhi, Q. Towards eco-city: The role of green innovation. Energy Procedia 2016, 104, 165–170. [Google Scholar] [CrossRef]
  48. Yi, M.; Wang, Y.; Yan, M.; Fu, L.; Zhang, Y. Government R&D subsidies, environmental regulations, and their effect on green innovation efficiency of manufacturing industry: Evidence from the Yangtze River economic belt of China. Int. J. Environ. Res. Public Health 2020, 17, 1330. [Google Scholar] [CrossRef] [Green Version]
  49. Linggang, K.; Yinkai, W.; Qingping, C. A summary of the Yangtze River delta high-quality integrated development forum. Reg. Econ. Rev. 2019, 5, 145–150. [Google Scholar] [CrossRef]
  50. State Council of the People’s Republic of China. Reply of the State Council on the Development Plan of the Yangtze River Delta Urban Agglomeration. 2019. Available online: http://www.gov.cn/zhengce/2019-12/01/content_5457442.htm?tdsourcetag=s_pcqq_aiomsg (accessed on 1 December 2019).
  51. Zhou, X.; Yu, Y.; Yang, F.; Shi, Q. Spatial-temporal heterogeneity of green innovation in China. J. Clean. Prod. 2021, 282, 124464. [Google Scholar] [CrossRef]
  52. Kong, X.; Chen, J.; Wang, J.; Zhao, X. Evaluation of ecological disturbance coupling land use pattern and process change: Taking the Yangtze River delta as an example. Sci. Geogr. Sin. 2021, 41, 2031–2041. [Google Scholar] [CrossRef]
  53. Kaoru, T. Dealing with undesirable outputs in DEA: A slacks-based measure (SBM) approach. In Proceedings of the North American Productivity Workshop, Toronto, ON, Canada, 23–25 June 2004; pp. 44–45. [Google Scholar]
  54. Zhang, J.; Ouyang, Y.; Ballesteros-Pérez, P.; Li, H.; Skitmore, M. Understanding the impact of environmental regulations on green technology innovation efficiency in the construction industry. Sustain. Cities Soc. 2020, 65, 102647. [Google Scholar] [CrossRef]
  55. Chen, Y.-E.; Li, C.; Chang, C.-P.; Zheng, M. Identifying the influence of natural disasters on technological innovation. Econ. Anal. Policy 2021, 70, 22–36. [Google Scholar] [CrossRef]
  56. Feng, C.; Shi, B.; Rong, K. Does environmental policy reduce enterprise innovation?—Evidence from China. Sustainability 2017, 9, 872. [Google Scholar] [CrossRef] [Green Version]
  57. Luo, Q.; Miao, C.; Sun, L.; Meng, X.; Duan, M. Efficiency evaluation of green technology innovation of China’s strategic emerging industries: An empirical analysis based on Malmquist-data envelopment analysis index. J. Clean. Prod. 2019, 238, 117782. [Google Scholar] [CrossRef]
  58. Yan, D.; Ren, X.; Zhang, W.; Li, Y.; Miao, Y. Exploring the real contribution of socioeconomic variation to urban PM2.5 pollution: New evidence from spatial heteroscedasticity. Sci. Total Environ. 2022, 806, 150929. [Google Scholar] [CrossRef] [PubMed]
  59. Yingwen, Z.; Huoming, L. Coupling mechanism of new urbanization and agricultural modernization in China. J. Cap. Univ. Econ. Bus. 2016, 18, 3–10. [Google Scholar] [CrossRef]
  60. Zhengyun, J.; Yan, H. Coupling and coordination between new urbanization and agricultural modernization in central China. J. Nat. Resour. 2021, 36, 702–721. [Google Scholar] [CrossRef]
  61. Faming, Z.; Jinping, Y.; Xiaopang, W. Coupling and coordination analysis of new-type urbanization quality and eco-environmental carrying capacity: A case study in central China. Ecol. Econ. 2021, 37, 63–69. [Google Scholar]
  62. Chen, W.; Pan, L.Y.; Lin, C.R.; Zhao, M.Q.; Li, T.; Wei, X. Efficiency evaluation of green technology innovation of China’s industrial enterprises based on SBM model and EBM model. Math. Probl. Eng. 2021, 2021, 6653474. [Google Scholar] [CrossRef]
  63. Li, J.L.; Chen, L.T.; Chen, Y.; He, J.W. Digital economy, technological innovation, and green economic efficiency-empirical evidence from 277 cities in China. Manag. Decis. Econ. 2022, 43, 616–629. [Google Scholar] [CrossRef]
  64. Xiaonan, C. Expression and mathematical property of coupling model, and its misuse in geographical science. Econ. Geogr. 2019, 39, 18–25. [Google Scholar] [CrossRef]
  65. Wang, J.Y.; Wang, S.J.; Li, S.J.; Feng, K.S. Coupling analysis of urbanization and energy-environment efficiency: Evidence from Guangdong province. Appl. Energy 2019, 254, 113650. [Google Scholar] [CrossRef]
  66. Nelson, K.S.; Nguyen, T.D.; Brownstein, N.A.; Garcia, D.; Walker, H.C.; Watson, J.T.; Xin, A. Definitions, measures, and uses of rurality: A systematic review of the empirical and quantitative literature. J. Rural Stud. 2021, 82, 351–365. [Google Scholar] [CrossRef]
  67. Zhong, S.; Xiong, Y.; Xiang, G. Environmental regulation benefits for whom? Heterogeneous effects of the intensity of the environmental regulation on employment in China. J. Environ. Manag. 2021, 281, 111877. [Google Scholar] [CrossRef] [PubMed]
  68. Wang, J.F.; Li, X.H.; Christakos, G.; Liao, Y.L.; Zhang, T.; Gu, X.; Zheng, X.Y. Geographical detectors-based health risk assessment and its application in the neural tube defects study of the Heshun Region, China. Int. J. Geogr. Inf. Sci. 2010, 24, 107–127. [Google Scholar] [CrossRef]
  69. Wang, J.-F.; Zhang, T.-L.; Fu, B.-J. A measure of spatial stratified heterogeneity. Ecol. Indic. 2016, 67, 250–256. [Google Scholar] [CrossRef]
  70. Sun, H.; Huang, Z.; Dongdong, X.U.; Shi, X.; Liu, H.; Tan, L.; Junlian, G.E. The spatial characteristics and drive mechanism of coupling relationship between urbanization and eco-environment in the Pan Yangtze River delta. Econ. Geogr. 2017, 37, 163–186. [Google Scholar] [CrossRef]
  71. Wang, S.; Cui, Z.; Lin, J.; Xie, J.; Su, K. The coupling relationship between urbanization and ecological resilience in the Pearl River delta. J. Geogr. Sci. 2022, 32, 44–64. [Google Scholar] [CrossRef]
  72. Yu, B. Ecological effects of new-type urbanization in China. Renew. Sustain. Energy Rev. 2021, 135, 110239. [Google Scholar] [CrossRef]
  73. Wang, K.L.; Zhang, F.Q. Investigating the spatial heterogeneity and correlation network of green innovation efficiency in China. Sustainability 2021, 13, 1104. [Google Scholar] [CrossRef]
  74. Wang, X.; Sun, X.; Zhang, H.; Xue, C. Digital economy development and urban green innovation CA-pability: Based on panel data of 274 prefecture-level cities in China. Sustainability 2022, 14, 2921. [Google Scholar] [CrossRef]
  75. Liu, Y.; Yang, Y.; Li, H.; Zhong, K. Digital economy development, industrial structure upgrading and green total factor productivity: Empirical evidence from China’s cities. Int. J. Environ. Res. Public Health 2022, 19, 2414. [Google Scholar] [CrossRef] [PubMed]
  76. Lyu, R.; Zhang, J.; Xu, M.; Li, J. Impacts of urbanization on ecosystem services and their temporal relations: A case study in Northern Ningxia, China. Land Use Policy 2018, 77, 163–173. [Google Scholar] [CrossRef]
  77. Feng, G.; Jingyi, W.; Fang, W.; Tao, K.; Xun, Z.; Zhiyun, C. Measuring China’s digital financial inclusion: Index compilation and spatial characteristics. China Econ. Q. 2020, 19, 1401–1418. [Google Scholar] [CrossRef]
  78. Grossman, J. The evolution of inhaler technology. J. Asthma 1994, 31, 55–64. [Google Scholar] [CrossRef]
  79. Yipiao, T.; Xiuchuan, X.; Lvjie, X.; Minyue, L.; Weiguo, Z. Regional difference of dynamic relationship between technolagical innovation and the new urbanization: PVAR analysis based on provincial panel data. Sci. Technol. Prog. Policy 2016, 33, 42–50. [Google Scholar] [CrossRef]
  80. Magazzino, C.; Mele, M. On the relationship between transportation infrastructure and economic development in China. Res. Transp. Econ. 2021, 88, 100947. [Google Scholar] [CrossRef]
  81. Tolliver, C.; Fujii, H.; Keeley, A.R.; Managi, S. Green innovation and finance in Asia. Asian Econ. Policy Rev. 2021, 16, 67–87. [Google Scholar] [CrossRef]
Figure 1. Location of the study area in China.
Sustainability 14 05765 g001
Figure 2. GDP Growth of China and Yangtze River Delta city group.
Sustainability 14 05765 g002
Figure 3. Main indicators of the green innovation in the Yangtze River Delta city group.
Sustainability 14 05765 g003
Figure 4. Spatial differences in coupling coordination in the Yangtze River Delta city group.
Sustainability 14 05765 g004
Figure 5. Moran Scatter Chart of Coupling Coordination in the Yangtze River Delta City Group.
Sustainability 14 05765 g005
Figure 6. LISA Cluster Map of the Yangtze River Delta City Group.
Sustainability 14 05765 g006
Table 2. New urbanization evaluation index system.
IndexIncluding and IntroductionPropertyReferences
Population urbanizationThe proportion of the urban population in the total population+Wu [17,31]
Economic urbanizationThe proportion of the non-agricultural economy in GDP+Zhao [59]
Spatial urbanizationThe proportion of the built-up area of the city+Zhang [6]
Social urbanizationRetail sales of consumer goods per capita+Jiang [60]
Ecological urbanizationPark green area per capita+Zhang [61]
Environment pollutionWastewater dischargeZhang [6]
PM2.5 (average annual PM2.5)Wu [17]
Table 3. Classification criteria for coordination.
Coordination IntervalCoordination Level
0.00 < D ≤ 0.34General disorder
0.34 < D ≤ 0.36Preliminary disorder
0.36 < D ≤ 0.39Preliminary coordination
0.39 < D ≤ 0.42Moderate coordination
0.42 < D ≤ 1.00Quality coordination
Table 4. Yangtze River Delta city group’s new urbanization index (2010–2020).
Index20102011201220132014201520162017201820192020
Wastewater discharge
(billion tons)
5.394.934.714.514.314.343.793.513.433.403.06
PM2.5 (average annual of PM2.5 for 26 cities) (Mg/m3)51.1753.8647.1547.9251.4746.5739.1739.0236.1535.2434.17
The proportion of urban population in the total population (%)59.1163.0162.8262.6462.4662.2962.1361.9861.8462.7961.97
The proportion of non-agricultural economy in GDP (%)89.2291.5991.5391.4791.4291.3691.3191.2691.2291.4691.06
The proportion of built-up area of the city (%)6.526.436.376.316.256.196.136.076.016.016.00
Retail sales of consumer goods per capita (104 CNY)2.462.852.842.832.822.812.802.792.782.802.84
Park green area per capita (sq.m.per.person)13.5513.8813.9113.9313.9714.0014.0314.0614.1014.2114.23
Table 5. Main mean index data of Yangtze River Delta city group from 2010 to 2020.
YearUiUuCD
20100.3830.03740.2850.361
20110.3260.03420.2930.363
20120.3810.03870.2890.364
20130.4090.04150.2890.370
20140.4310.04280.2870.374
20150.4520.04390.2840.376
20160.5990.04670.2590.384
20170.6480.04890.2550.388
20180.7190.05060.2480.392
20190.8230.05740.2470.405
20200.8210.05660.2460.403
Ui represents the level of the green innovation system; Uu represents the level of the new urbanization development system; C represents the coupling degree between the green innovation system and new urbanization development system; D is the coupling coordination degree of the green innovation system and new urbanization development system.
Table 6. The coupling coordination degree of Yangtze River Delta city group (2010–2020).
Name20102011201220132014201520162017201820192020
Shanghai0.44200.44590.44690.44980.45010.45310.46160.47440.48760.49990.5020
Nanjing0.38480.38700.38820.38920.39130.40210.41540.41870.42900.44980.4790
Wuxi0.38590.38800.38810.38850.38910.39090.39960.40000.40800.41870.4194
Changzhou0.36660.36340.36400.36470.37010.37220.38480.38680.38980.40000.4002
Suzhou0.39150.39680.39800.39910.39970.40950.41860.41990.42360.43550.4654
Nantong0.36320.36300.36310.36520.36820.36970.37240.38120.38830.39970.3999
Yangzhou0.35830.35900.36010.36710.36900.37130.37860.38120.38720.38720.3897
Zhengjiang0.36510.36800.36910.37010.37510.37770.37860.37900.38590.38590.3869
Tàizhou0.34930.35030.35200.36000.36210.36860.36900.36900.37430.37550.3753
Yancheng0.34070.34180.34500.35120.35510.35870.37860.38590.38800.38900.3888
Hangzhou0.39470.39650.39910.40140.40410.42110.42520.42620.43160.44470.4596
Ningbo0.38250.38710.38800.39910.39950.40100.40170.40290.41600.41990.4265
Jiaxing0.40570.40700.40900.40910.41940.40950.40960.41980.43010.42910.4290
Huzhou0.35760.35930.36200.36710.36750.36920.37490.38210.39450.39850.3955
Shaoxing0.35600.35700.35880.36010.36420.36460.36860.37020.37600.37800.3761
Zhoushan0.34480.35090.35200.35510.35730.35940.36420.36900.36970.36990.3690
Taizhou0.35630.35810.36110.36740.36790.37150.37730.37970.38010.38310.3805
Jinhua0.34830.35010.35550.35910.36010.36340.36840.37120.37570.37870.3877
Hefei0.36660.37000.37300.38000.38330.38540.39890.40100.40150.41290.4224
Wuhu0.35410.36010.36140.36540.36560.36570.37000.37430.37480.37780.3758
Maanshan0.32880.33270.33670.34010.34510.34600.35830.35950.36140.36540.3653
Tongling0.33870.34040.34040.34410.34740.34780.35410.35980.36020.36420.3632
Anqing0.31980.32160.32260.32320.32860.33000.33720.34000.34700.34790.3479
Chuzhou0.32170.32220.32230.33450.33480.33660.33920.34010.35000.35000.3499
Chizhou0.31510.31610.31750.32900.33000.33150.34130.34810.35150.35750.3501
Xuancheng0.31990.32400.32520.33810.33880.34260.35740.36000.36850.36950.3672
Table 7. Coupling coordination degree of the top and bottom three in the Yangtze River Delta city group (2010–2020).
YearThe Top ThreeAverage of DThe Last ThreeAverage of D
2010Shanghai Jiaxing Hangzhou0.414Xuancheng Anqing Chizhou0.318
2011Shanghai Jiaxing Suzhou0.417Chuzhou Anqing Chizhou0.320
2012Shanghai Jiaxing Hangzhou0.418Anqing Chuzhou Chizhou0.321
2013Shanghai Jiaxing Hangzhou0.420Chuzhou Chizhou Anqing0.329
2014Shanghai Jiaxing Hangzhou0.421Chuzhou Chizhou Anqing0.331
2015Shanghai Hangzhou Jiaxing0.428Chuzhou Chizhou Anqing0.333
2016Shanghai Hangzhou Suzhou0.435Chizhou Chuzhou Anqing0.339
2017Shanghai Hangzhou Suzhou0.440Chizhou Chuzhou Anqing0.343
2018Shanghai Hangzhou Nanjing0.449Chizhou Chuzhou Anqing0.349
2019Shanghai Nanjing Hangzhou0.465Chizhou Chuzhou Anqing0.352
2020Shanghai Nanjing Suzhou0.482Chizhou Chuzhou Anqing0.349
Table 8. Influence of the index factors of coupling coordination degree between green innovation and new urbanization of Yangtze River Delta cities in China.
Target LayerSystem LayerIndicator LayerUnitCode
Name
Natural
resources
Forest resourcesForest coverage%N1
Solar radiationHours of sunshineHours/yearN2
Water resourcesannual precipitationMm/yearN3
The temperature conditionsMean temperature°CN4
Economic developmentEconomic developmentGDP per capita104 CNY/personE1
Industrial structureThe proportion of the output value of the tertiary industry in GDP%E2
Industrialization levelThe proportion of total industrial output value in GDP%E3
Digital economy development levelNumber of Internet broadband access users104 personsE4
Telecom business revenue106 CNY
Information transmission, computer services, and software practitioners104 persons
Mobile phone penetration104/person
Digital finance development
Social conditionsSocial carrying capacityDensity of populationPersons/km2S1
The level of government inputThe proportion of local fiscal expenditure in GDP%S2
People’s wealth levelAverage annual savings per capita104 CNY/personS3
Educational standardsAverage years of schooling per personYears/personS4
Table 9. Each variable factor detection and its interaction value of q.
Detection
Factors
N1N2N3N4S1S2S3S4E1E2E3E4
N10.046
N20.0970.023
N30.0780.0890.049
N40.0840.0770.0730.025
S10.9300.0520.0970.0750.037
S20.1300.1000.1470.2200.1260.085
S30.0540.0500.0870.0590.0800.1200.028
S40.1170.9380.1090.1040.0940.1470.1040.069
E10.1730.1380.1670.1440.0960.2490.1230.2300.116
E20.1110.1060.1130.1230.1080.1830.1160.1140.2250.105
E30.1140.1040.1200.1080.1020.1410.1790.1210.2240.2150.092
E40.1030.0810.1100.0950.0890.1580.0960.1270.1660.2650.1710.057
The values in bold represent the effect of nonlinear enhancement after the two factors interact.
Publisher’s Note: MDPI stays neutral with regard to jurisdictional claims in published maps and institutional affiliations.

