
Key Concerns and Drivers of Low-Cost Air Quality Sensor Use


Department of Urban and Regional Planning, University of Colorado Denver, Denver, CO 80204, USA
Sustainability 2022, 14(1), 584; https://doi.org/10.3390/su14010584
Submission received: 17 November 2021
/
Revised: 3 January 2022
/
Accepted: 3 January 2022
/
Published: 5 January 2022
(This article belongs to the Topic Climate Change and Environmental Sustainability)
Abstract
:Low-cost sensors are revolutionizing air pollution monitoring by providing real-time, highly localized air quality information. The relatively low-cost nature of these devices has made them accessible to the broader public. Although there have been several fitness-of-purpose appraisals of the various sensors on the market, little is known about what drives sensor usage and how the public interpret the data from their sensors. This article attempts to answer these questions by analyzing the key themes discussed in the user reviews of low-cost sensors on Amazon. The themes and use cases identified have the potential to spur interventions to support communities of sensor users and inform the development of actionable data-visualization strategies with the measurements from such instruments, as well as drive appropriate ‘fitness-of-purpose’ appraisals of such devices.
1. Introduction
Air pollution concentrations are collected by networks of expensive, high-quality, fixed-reference monitoring stations that measure a set of ‘criteria’ or widespread pollutants. However, because reference monitors are expensive and can cost several USD 10,000, such networks are sparse. Even the US, which has one of the densest air pollution monitoring networks in the world, only has a regulatory monitor reporting high-quality PM2.5 concentrations (mass concentrations of fine particulate matter that has a diameter of <2.5 μm) in ~21% of the 3100 counties.
Low-cost sensors (LCS) (<USD 2500, as defined by the US EPA Air Sensor Toolbox) have the potential to capture concentrations of pollutants in previously unmonitored locations. [1,2,3,4]. The relatively low cost of these devices has made them accessible to the public, making them important new players in air quality monitoring. Although LCS measurements have many sources of uncertainty and cannot be used for regulatory purposes, they are increasingly being used to collect real-time, localized data about individuals and their surroundings [5,6]. There are a range of low-cost sensors on the market that are of varying quality, measure different pollutants, have different mechanisms and designs, and present measurements made using a range of metrics through different interfaces.
In the last five years, there have been several studies published that evaluate the various low-cost sensors on the market in laboratory and field conditions for different end purposes. In a literature review of the applications of low-cost sensors, US EPA researchers identified four broad application categories: (1) identification of the spatio-temporal variability of pollutants; (2) comparison of air pollution levels against a threshold value or between networks, areas, and times; (3) identification of long-term trends in pollutant concentrations; and (4) use of data from low-cost sensors for decision support [7]. This review was conducted to aid efforts in developing ‘fitness-of-purpose’ appraisals of the different sensors for these end-use applications.
However, little research exists on how such sensors are used more broadly by the public for non-research purposes and what the “behavioural, socio-political, and ethical implications of introducing sensors into communities” are [8]. Although important research has been conducted on how such tools have been used by specific communities [9,10], there has been little work done to (1) examine the drivers of sensor use and (2) understand how the general public are interpreting and using the data from such devices. Such work can enable the future design of low-cost sensors and data visualizations to provide easy-to-interpret insights to communities to address key questions or concerns. It can also aid in policy interventions to grow and sustain communities of sensor users.
To address these research needs, this study analyzes product review comments on Amazon (a leading multinational online retailer) for 94 low-cost air quality monitors measuring a range of different pollutants: formaldehyde (HCHO), total volatile organic compounds (TVOCs or VOCs), particulate matter: PM1.0, PM2.5, and PM10, carbon monoxide (CO), carbon dioxide (CO2), nitrogen dioxide (NO2), and ozone (O3), as well as a combined estimate of different pollutants in the form of an air quality index (AQI), in the price range of USD 13.97–USD 329, to identify the key themes that arose when users described their use of the sensor they had purchased.
Infodemiology, the practice of analyzing consumer-sourced qualitative data, such as Amazon reviews, is an emerging area of research that uses freely-available consumer-generated data to provide insights that can be used for making public-health-related decisions [11]. As few data currently exist on the usage of low-cost sensors by the public, the Amazon text reviews and ratings (1–5 stars) of the products can provide valuable insights to policy-makers as a key first step. This paper uses topic modeling, an unsupervised machine learning technique, to extract key topics from the 1000s of reviews downloaded. Essentially, topic models pick up co-occurrence signals between different words in the collection of texts. The underlying assumption is that words that occur often in the same sentence are likely to belong to the same latent topic.
2. Data and Methods
Amazon Standard Identification Numbers (ASINs), blocks of 10 characters that uniquely identify all products sold on Amazon, were scraped for all products listed in the department of ‘Indoor Air Quality Meters’ on Amazon, using the tool Helium10 (https://www.helium10.com/, last accessed 25 January 2021) on Monday, 25 January 2021. A manual search for air quality sensors on Amazon indicated that almost all air quality sensors sold on the site were listed under this category. There was no category for ‘Outdoor Air Quality Meters’. The price, overall rating, and number of reviews of each device were also downloaded using Helium10. All the reviews (the text and the star rating) for each device corresponding to the list of ASINs from Amazon were scraped on Monday, 25 January 2021, using ProxyCrawl (https://proxycrawl.com/, last accessed 25 January 2021). The total number of reviews obtained was 2707. Ninety percent of these reviews were from users in North America. There were a small number of reviewers from Europe. No additional information on reviewers was available.
This paper reports the descriptive statistics of the reviews and devices considered in this analysis. Specifically, it details the range of pollutants measured, the average rating of each device, and the standard deviation in star ratings.
2.1. Preprocessing
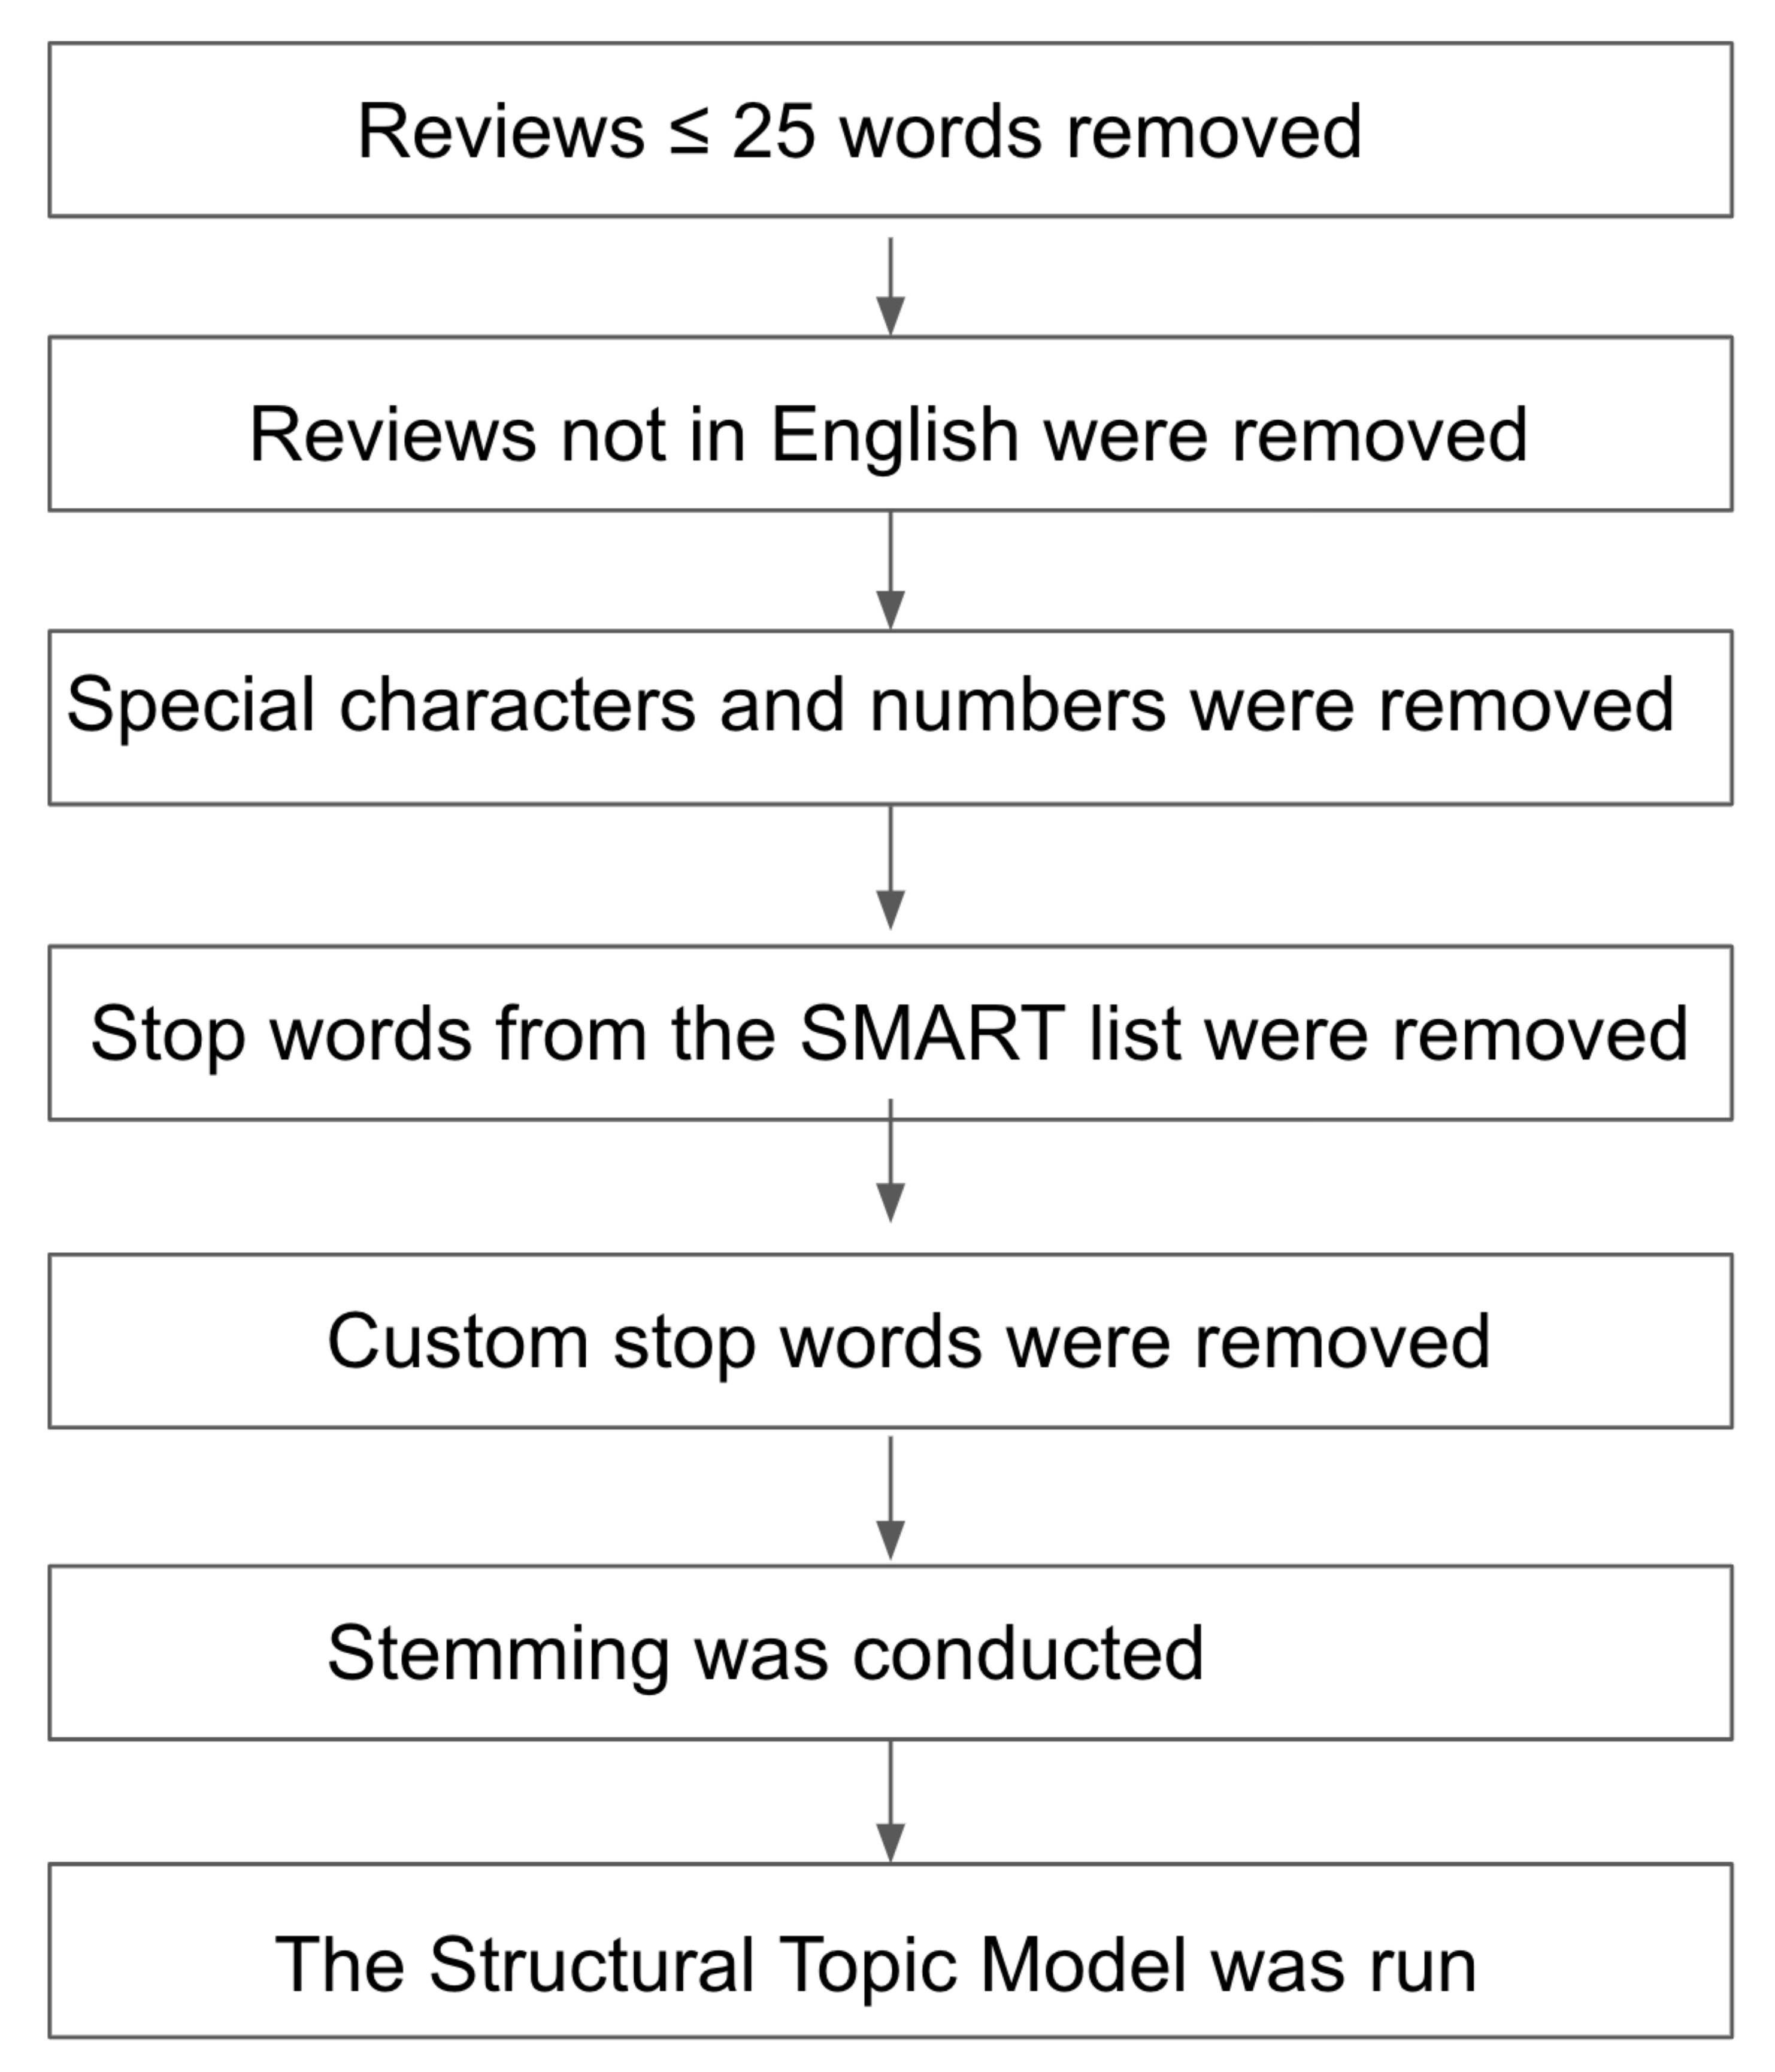
A flowchart that summarizes the preprocessing is presented in Figure 1. A more detailed description of each preprocessing step is now detailed:
- (i)
- All reviews where the word count was ≤25 words were removed. This is because the reviews with less than 25 words contained little information that would be relevant to a topic model. Three reviews that were not in English were removed. One thousand eight hundred and eighty-eight reviews from 94 different monitors remained.
- (ii)
- Special characters (non-ASCII characters), punctuation, and numbers were also removed from the review text.
- (iii)
- (iv)
- After this step, additional stop words from a custom list were removed: { “air”, “read”, “devic”, “unit”, “meter”, “qualiti”, “product”, “quality”, “device”, “monitor”, “amazon”, “measure”, “hcho”, “pm”, “pm25”, “reading”, “bought”, “readings”, ”values”, ”sensor”, “data”, “change”, “compare”, “compared”, “found”, “level”, “measure”, “results”, “levels”, “pollution”, “check”, “highly”, “found”, “house”, “home”, “googl”, “browser”, “html5”, “video”, “formaldehyd”, “formaldehyde”, “ppm”, “ghz”, “pro”, “tvoc”, “voc”, “temperatur”, “co2”, “hour”, “set”, “minut”, “time”, ”la”, “de”, “lot”, “el”, “la”, “particle”, “particulate”, “one”, and “thing” }.
Stop words tend to be high-probability terms that can skew the word-type probability distribution and slow inference from the topic models.
- (v)
- Stemming was used to lemmatize words and their derivatives (e.g., determine, determined, determining), thus rendering all derivative forms of a single word in an unambiguous, non-inflected state. As language exhibits a rich inflectional morphology, if derivatives of the same word are treated as unique tokens, the co-occurrence signal between different words in the corpus under consideration will become weaker. We thus applied stemming to improve the quality of the topic model.
An example of how these pre-processing steps affected the text is as follows:
Before: “Atmotube just arrived! I had downloaded the app ahead of time & it worked great! Easy connection & set up. It has a very solid feel. Nice packaging. I’m looking forward to using this!”
After: “atmotub arriv download app ahead easi connect solid feel nice packag forward”.
2.2. Structural Topic Modeling
Unsupervised machine learning has been commonly used in studies that do not have any predetermined framework to analyze unstructured text data [14,15,16]. Such topic modeling enables researchers to discover topics from the data. This process may avoid biases generated through non-automated coding that relies on subjective interpretations of the text.
Essentially, a topic model represents the overall themes or topics in a corpus as probability distributions over words in a vocabulary; so, while the probability of the word “smoke” is high in a topic relating to wildfires, it will likely be relatively low in a topic pertaining to the ease of use of a low-cost sensor. Documents (which in this case are reviews) consisting of combinations of words were modeled using a generative process where first a topic is selected according to some probability distribution specific to a given document, and then, a word is selected from that topic in accordance with the topic’s distribution over vocabulary words. Using the documents in this corpus (which are the output of such a generative process), we can infer the likelihood of each topic given a document and each word given a topic through a training process.
Latent Dirichlet Allocation (LDA) is the most commonly used topic model. However, LDA has several limitations, one of the most important being that it assumes that topics are independent of each other. The recently introduced structural topic modeling (STM) algorithm builds on the LDA model and allows topics to be correlated [17]. For a more detailed discussion of STM models, refer to [18]. In this paper, topic modeling was implemented in R with the STM package [19], using the spectral algorithm without the inclusion of covariates [20]. When the number of documents is large, as it is in this case, the spectral algorithm has been shown to perform well and provide more stable and consistent results than the LDA model [19].
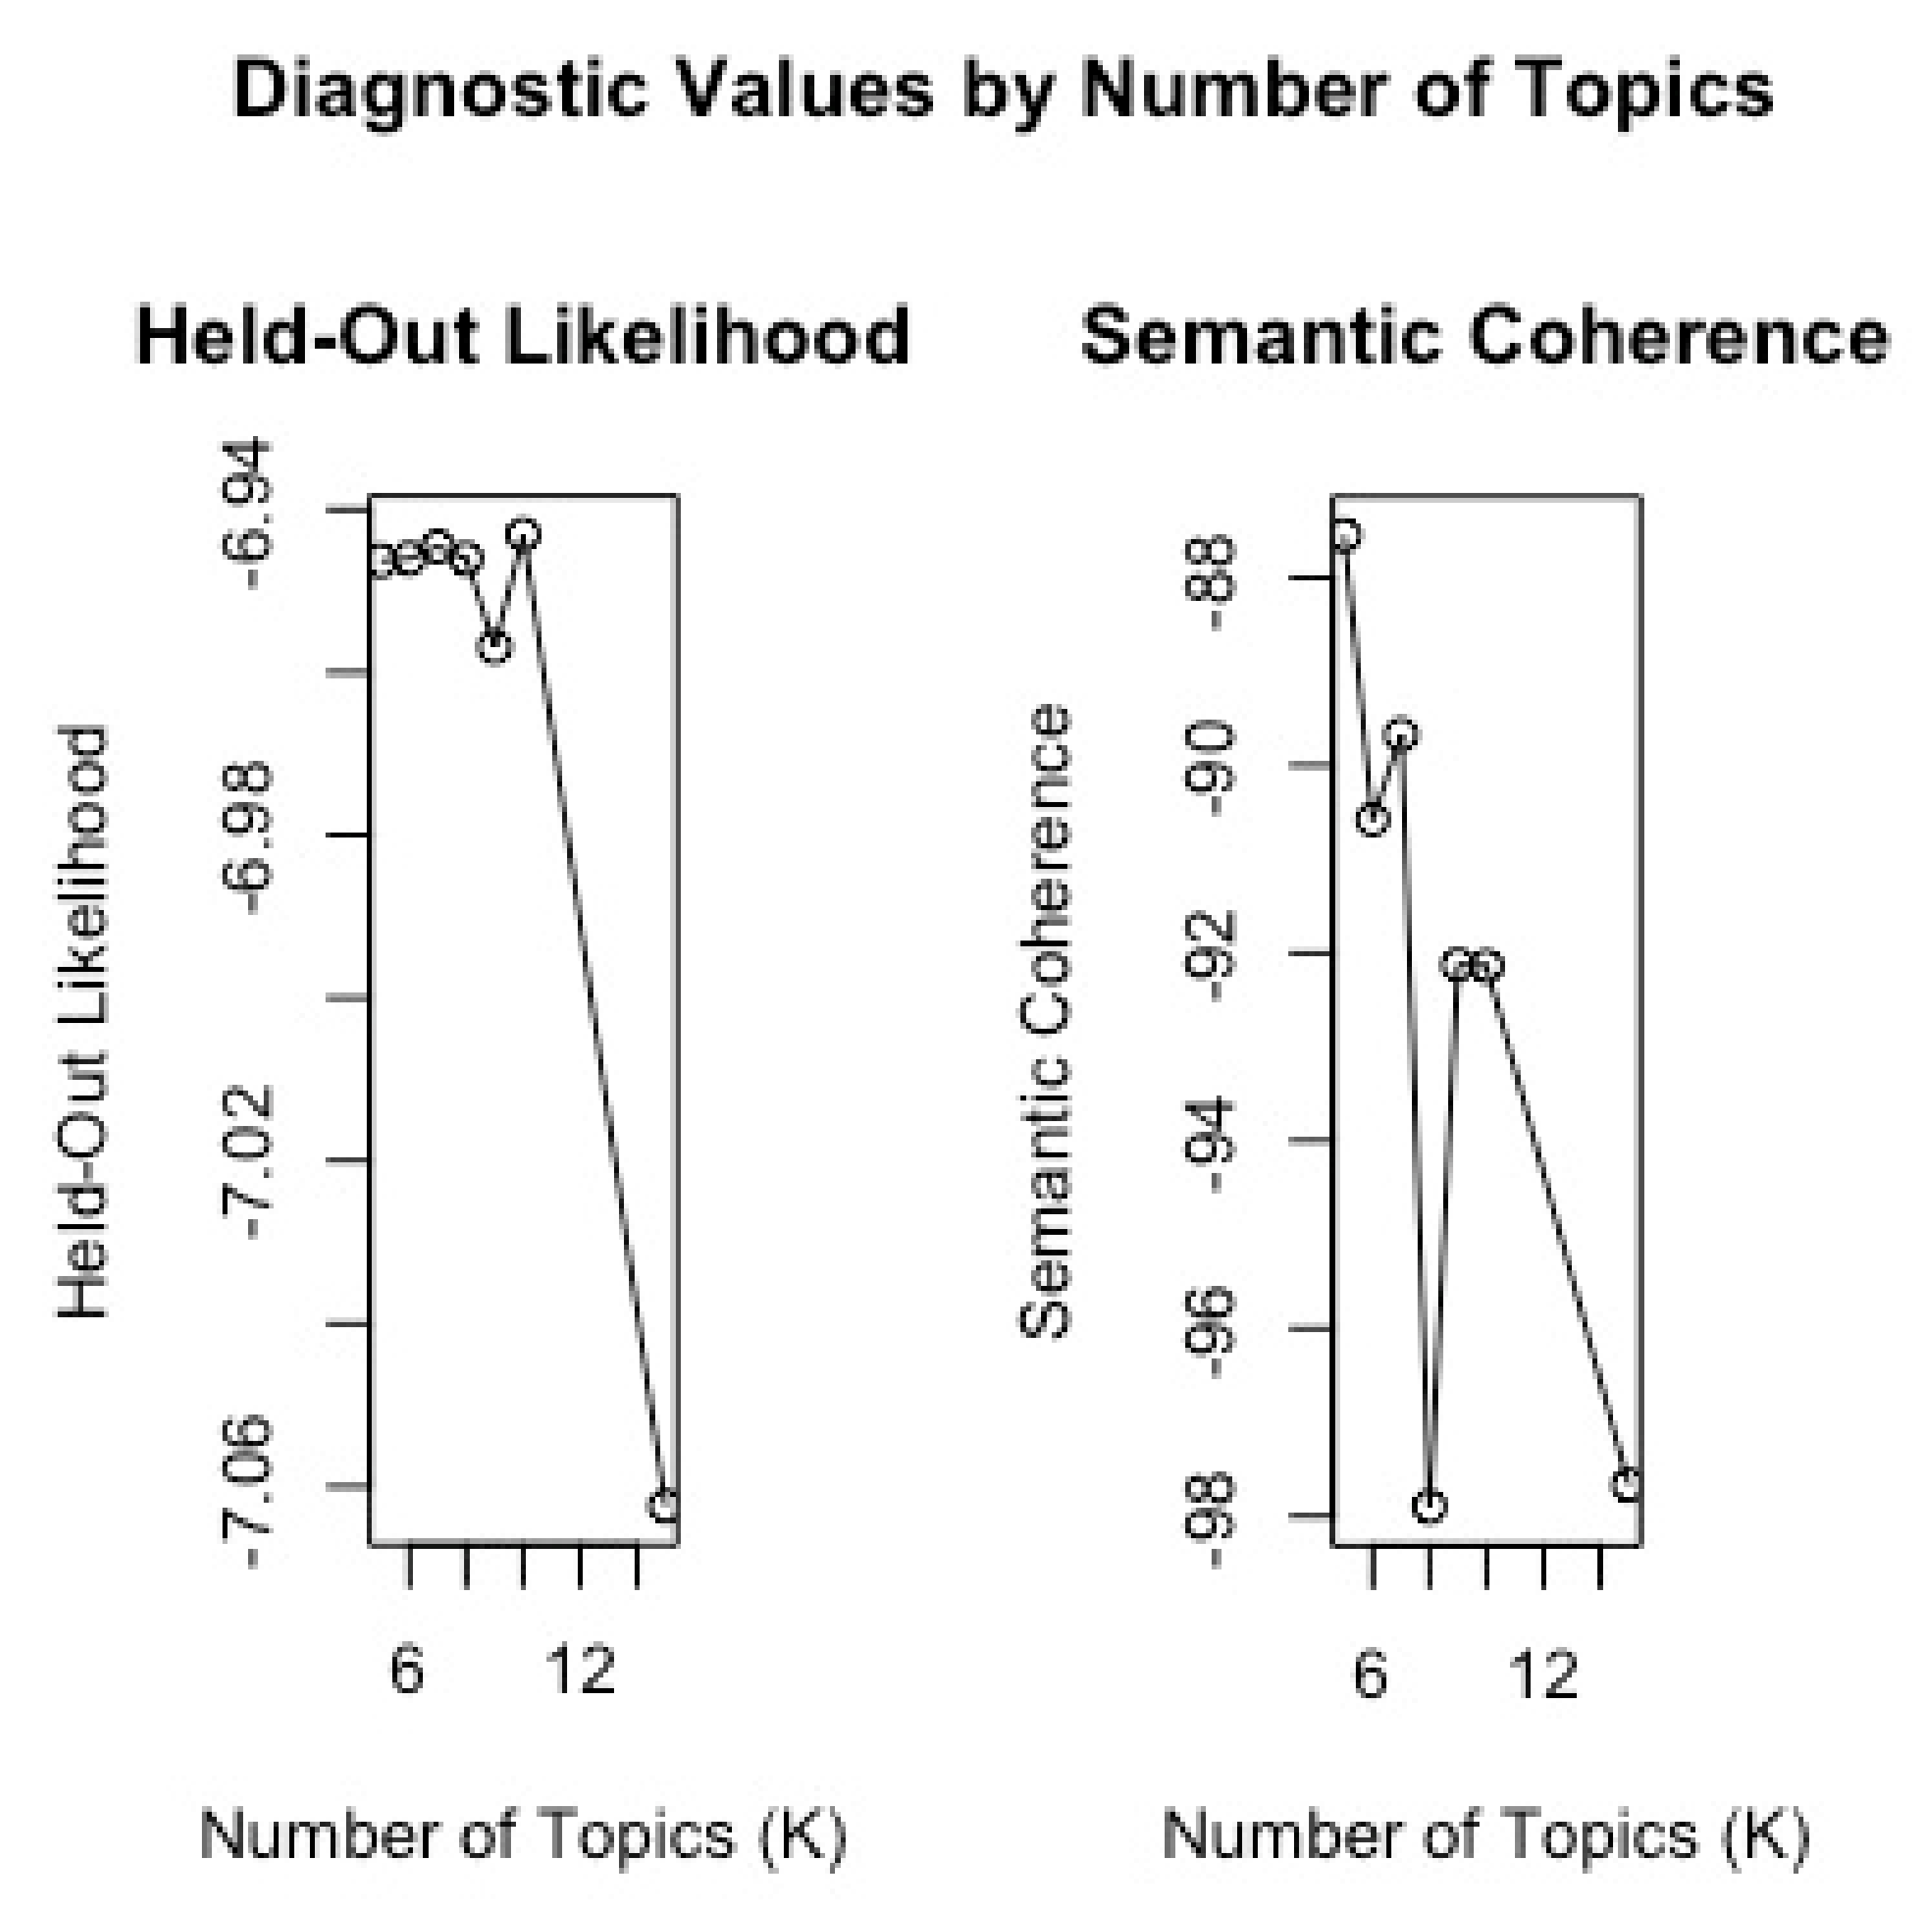
To determine the number of topics in the text, this paper used the metrics of held-out likelihood and semantic coherence provided by the STM package. Held-out likelihood (an indication of cross-validation) is calculated by holding out 10% of the words in the corpus, training the model, and using the document-level latent variables to evaluate the probability of the held-out words. Semantic coherence (an indication of higher topic interpretability) measures the frequency of the co-occurrence of the top words of a topic [21]. This paper compared the performance of 5, 6, 7, 8, 9, 10, 15, and 20 topic models using these metrics.
It can be observed that seven topics appear to provide the best trade-off between the greatest coherence and the held-out likelihood (Figure 2). A model with seven topics also withstood the author’s subjective evaluation of the themes produced.
This paper provides brief summaries of each topic derived from the 7-topic model by reporting words with the highest occurrence probability corresponding to a specific topic. However, as some terms, such as “measure”, will have a high occurrence frequency across several topics, they add limited value for topic interpretation. To aid in identifying topics, Bischof and Airoldi (2012) proposed the FREX statistic, defined as the weighted harmonic mean of a word’s rank in terms of its exclusivity and frequency, to identify high-frequency words exclusive to a given topic [22]. This paper accordingly presents the highest-ranked words using the FREX metric to aid in topic interpretation.
This article also reports the prevalence of the seven topics over reviews corresponding to (i) different ratings—a proxy of user satisfaction with the device, (ii) different reported pollutants, and (iii) different devices. It must also be noted here that >90% of the devices included in this study measure more than one pollutant (Table 1). It is impossible to tell which pollutant was being discussed in the review. In this analysis, each review was linked with all the pollutants that the corresponding device is reported to measure.
Non-parametric Kruskal–Wallis tests, also termed as one-way ANOVA on ranks (Shapiro tests revealed that the assumption of the normality of the distribution of prevalence of each topic did not hold), were run to evaluate whether the prevalence of each topic varied significantly by the customer’s rating, the device being reviewed, and the pollutants reported. Statistical significance in this study is assessed using a p < 0.05 threshold.
3. Results
Table 1 provides a summary of the 1888 reviews of the 94 low-cost air quality monitors sold on Amazon as well as their price and average rating. Three monitors were no longer being sold, and therefore, information about their price was not available.
Each air quality monitor reported a range of different pollutants. Sixty-two reported HCHO concentrations, 55 reported TVOC concentrations, 89 reported PM2.5 concentrations, 68 reported PM10 concentrations, 23 reported PM1 concentrations, 1 reported O3 concentrations, 2 reported NO2 concentrations, 6 reported CO concentrations, and 36 reported CO2 concentrations. Almost all the monitors reported an Air Quality Index (AQI) Value of some form, though these were not consistent.
The accuracy of many (specifically, the brands Elitech (Temtop), uHoo, Awair, AirVisual, Ecowitt Kaiterra, Atmotube, and Flow), but not all, of the 94 monitors, in reporting ‘criteria’ or wide-spread pollutants (PM2.5, PM10, NO2, O3, CO), have been evaluated by regulators or academics in the lab and in the field [23,24]. According to these evaluations, different sensors have varying levels of performance. For example, the PM2.5 concentrations measured using the Kaiterra Laser Egg agree reasonably well with the high-quality alternative (R2 ~0.8), while the PM2.5 readings of the Plume Labs Flow 2 sensor did not do as well (R2 ~0.1) [23] There was little information on the performance of each device in measuring non-criteria pollutants such as HCHO and TVOCs.
The customer reviews of the devices did not correlate well with the reported evaluations by the EPA. For example, the Flow sensor and the Kaiterra Laser Egg sensor, measuring only PM2.5 (ASIN: B07GDR4N6), both had an overall rating of 3.5 (Table 1). For the reviews included in this analysis, the average ratings were 3.4 and 3.38, respectively, with a mean (median) standard deviation in the ratings for both devices of 1.2 (1.5) (Table 1). Different users thus have vastly different experiences with the same device. In order to understand the different dimensions of the users’ experience with the different low-cost air quality sensors, this paper now reports the seven themes that arose from analyzing the customer reviews.
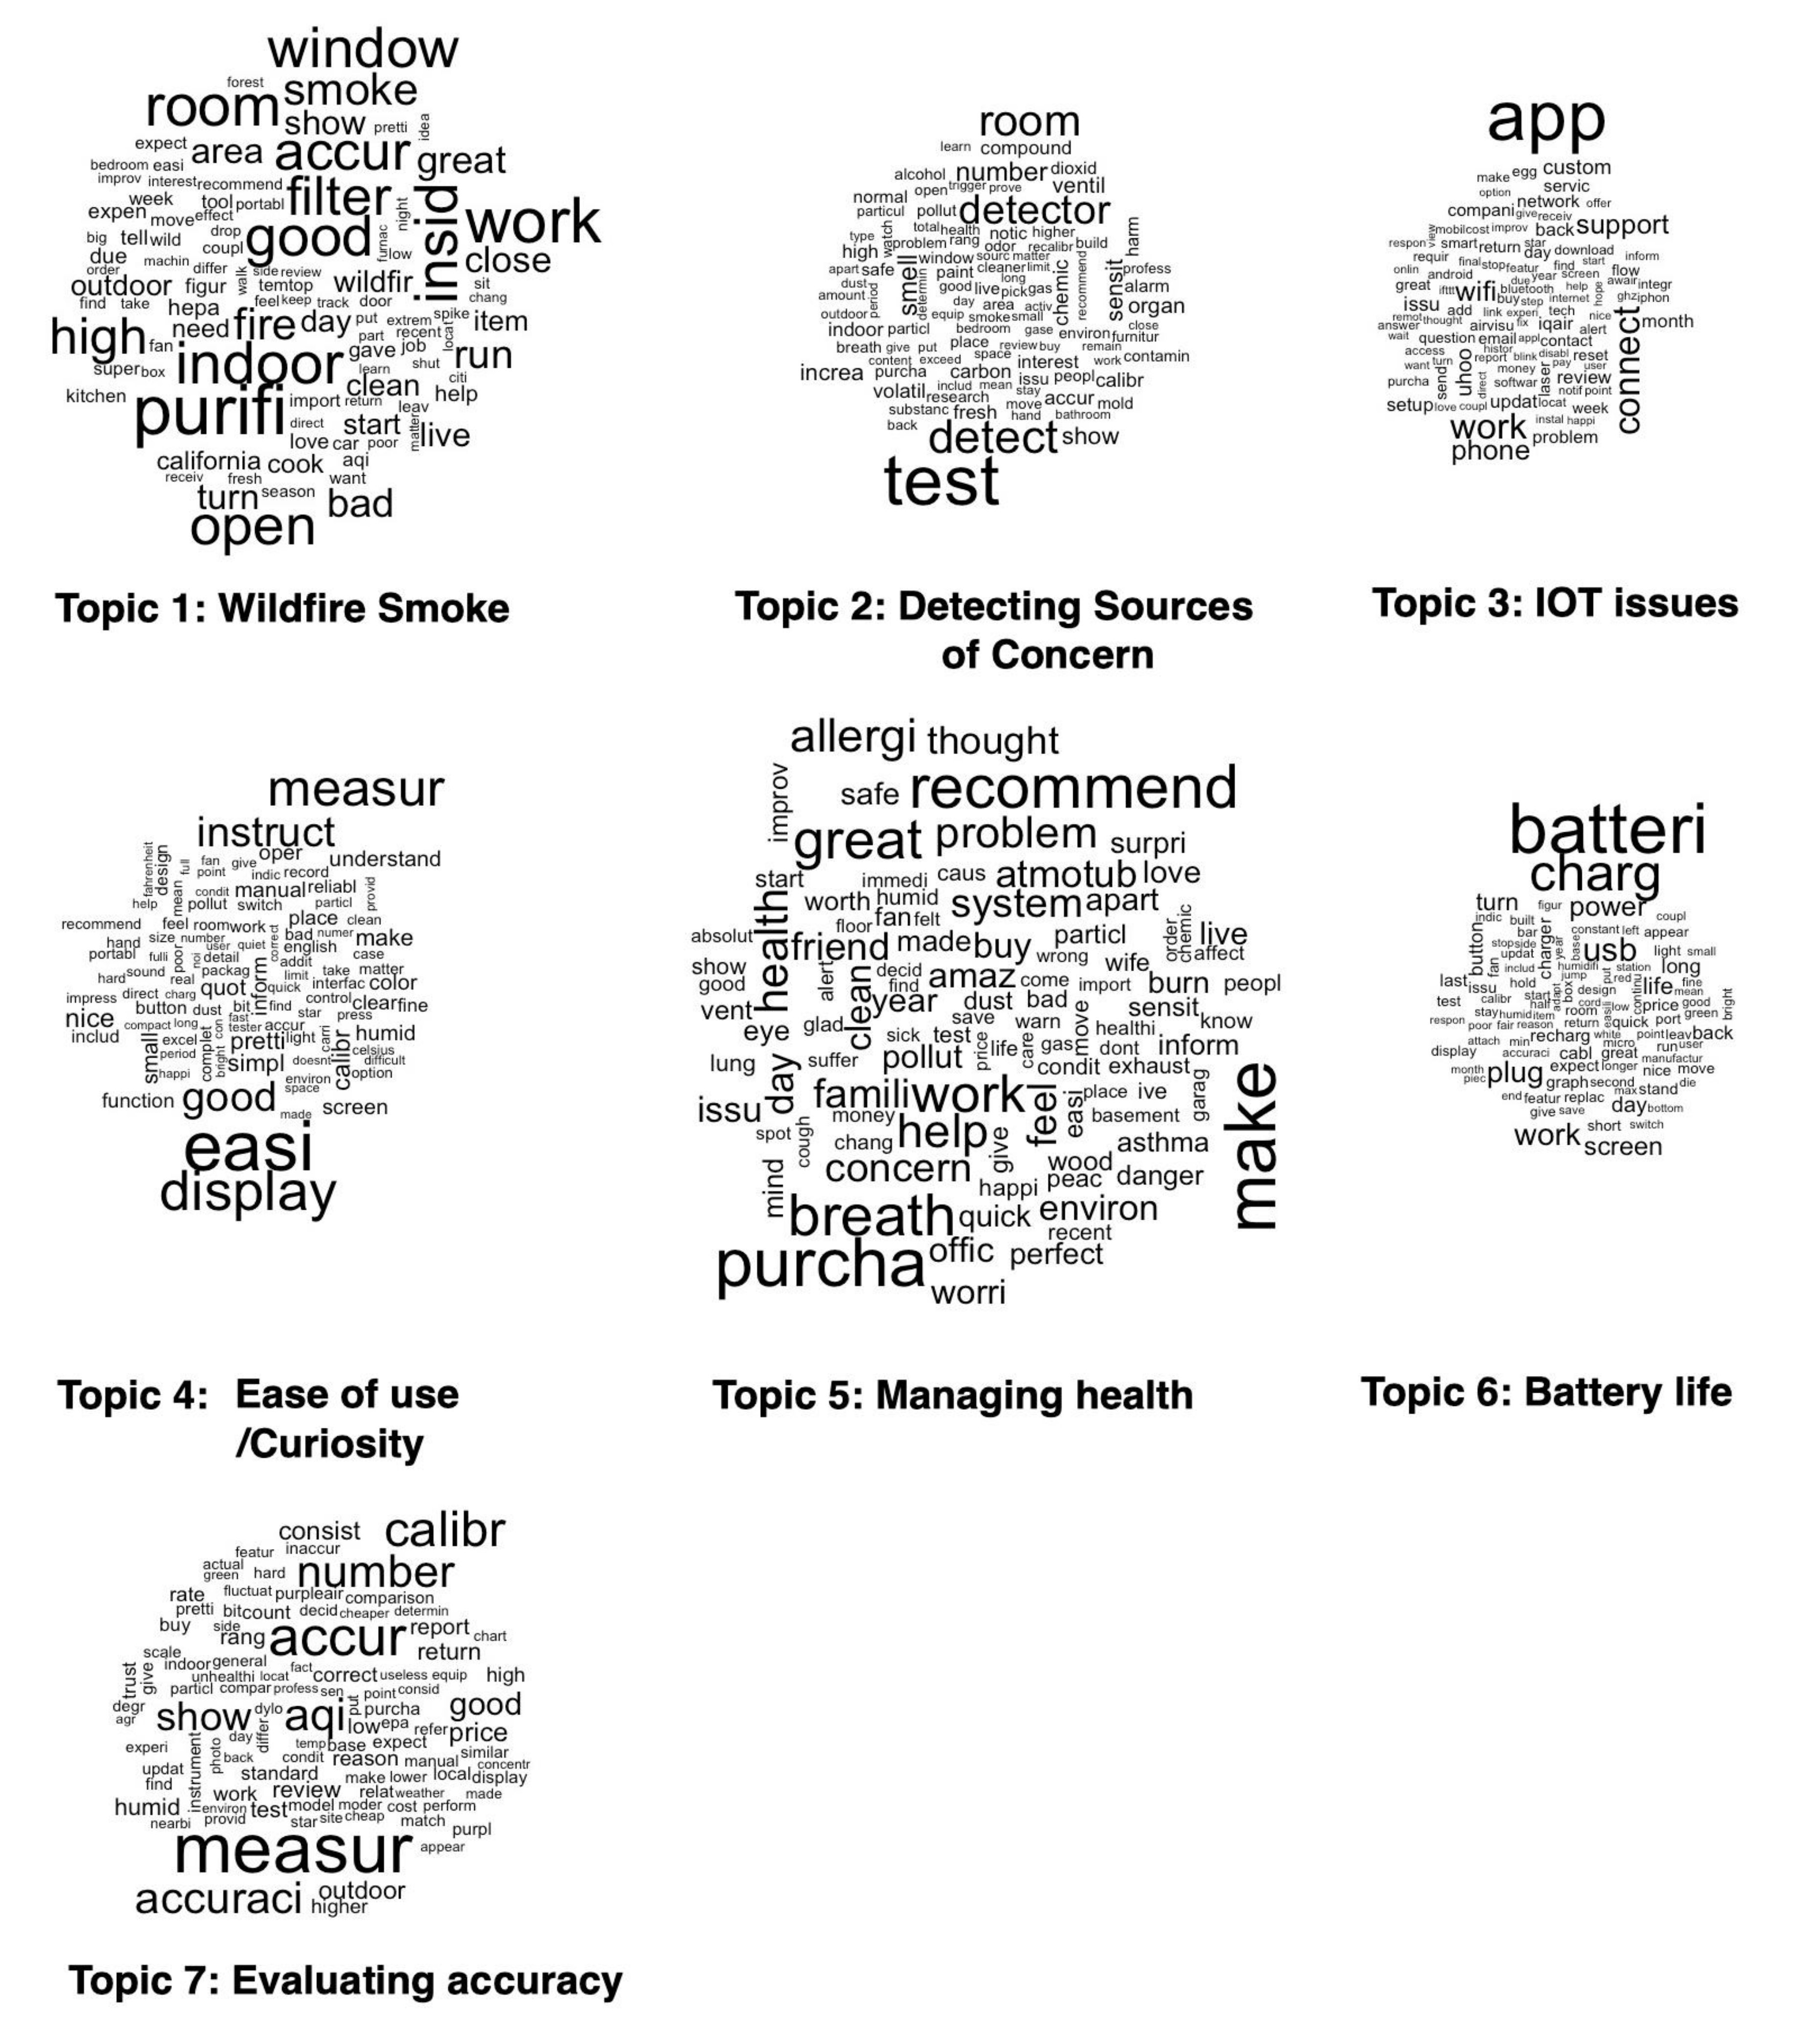
The word clouds for each topic depicting the words with the highest probability of occurrence are presented in Figure 3. The larger the font, the higher the probability of the occurrence of the word for the given topic. The prevalence of each topic (or the proportion of each topic in the entire corpus), words which scored highly on the FREX statistic, as well as the representative reviews corresponding to each topic, are displayed in Table 2.
Briefly, from reviewing Figure 3 and Table 2, the topics identified correspond to the following. Wildfire Smoke: Users bought their devices to understand the smoke infiltration into their homes during the wildfire season. Several reviewers discussed using their devices to determine if it was safe to open windows and when to turn on their air filters (Topic 1). This was the most prevalent theme that emerged from this analysis. Detecting sources of concern: Users bought their devices to detect the impacts of specific sources, such as new furniture, paint, mold, etc. Many reviewers reported how sensitive their devices were to the source in question (Topic 2). Internet-of-Things (IOT) issues: Users discussed the ease of access of the data from their devices, using mobile apps/web browsers, etc. (Topic 3). Ease of use/Curiosity: Users were curious about the air they were breathing and bought monitors to understand the pollution levels in the air. These users tended to comment on the ease of use of their devices and how difficult it was for them to meet their objectives (Topic 4). Managing Health: Several customers bought devices to monitor air pollution because they had allergies or suffered from health conditions that rendered them susceptible to the impact of poor air quality. They used their devices to monitor pollution to control their health conditions (Topic 5). Battery life: Many customers were disappointed by the battery life of their devices. This was especially important for users who wanted to use their devices in a portable manner and monitor pollution in different locations (Topic 6). Evaluating the accuracy of their devices: Many reviewers compared the measurements from their devices with the regulatory readings for their areas or nearby PurpleAir monitors, a widely used low-cost sensor [25] to evaluate the accuracy of their devices. They discussed this in their reviews (Topic 7).
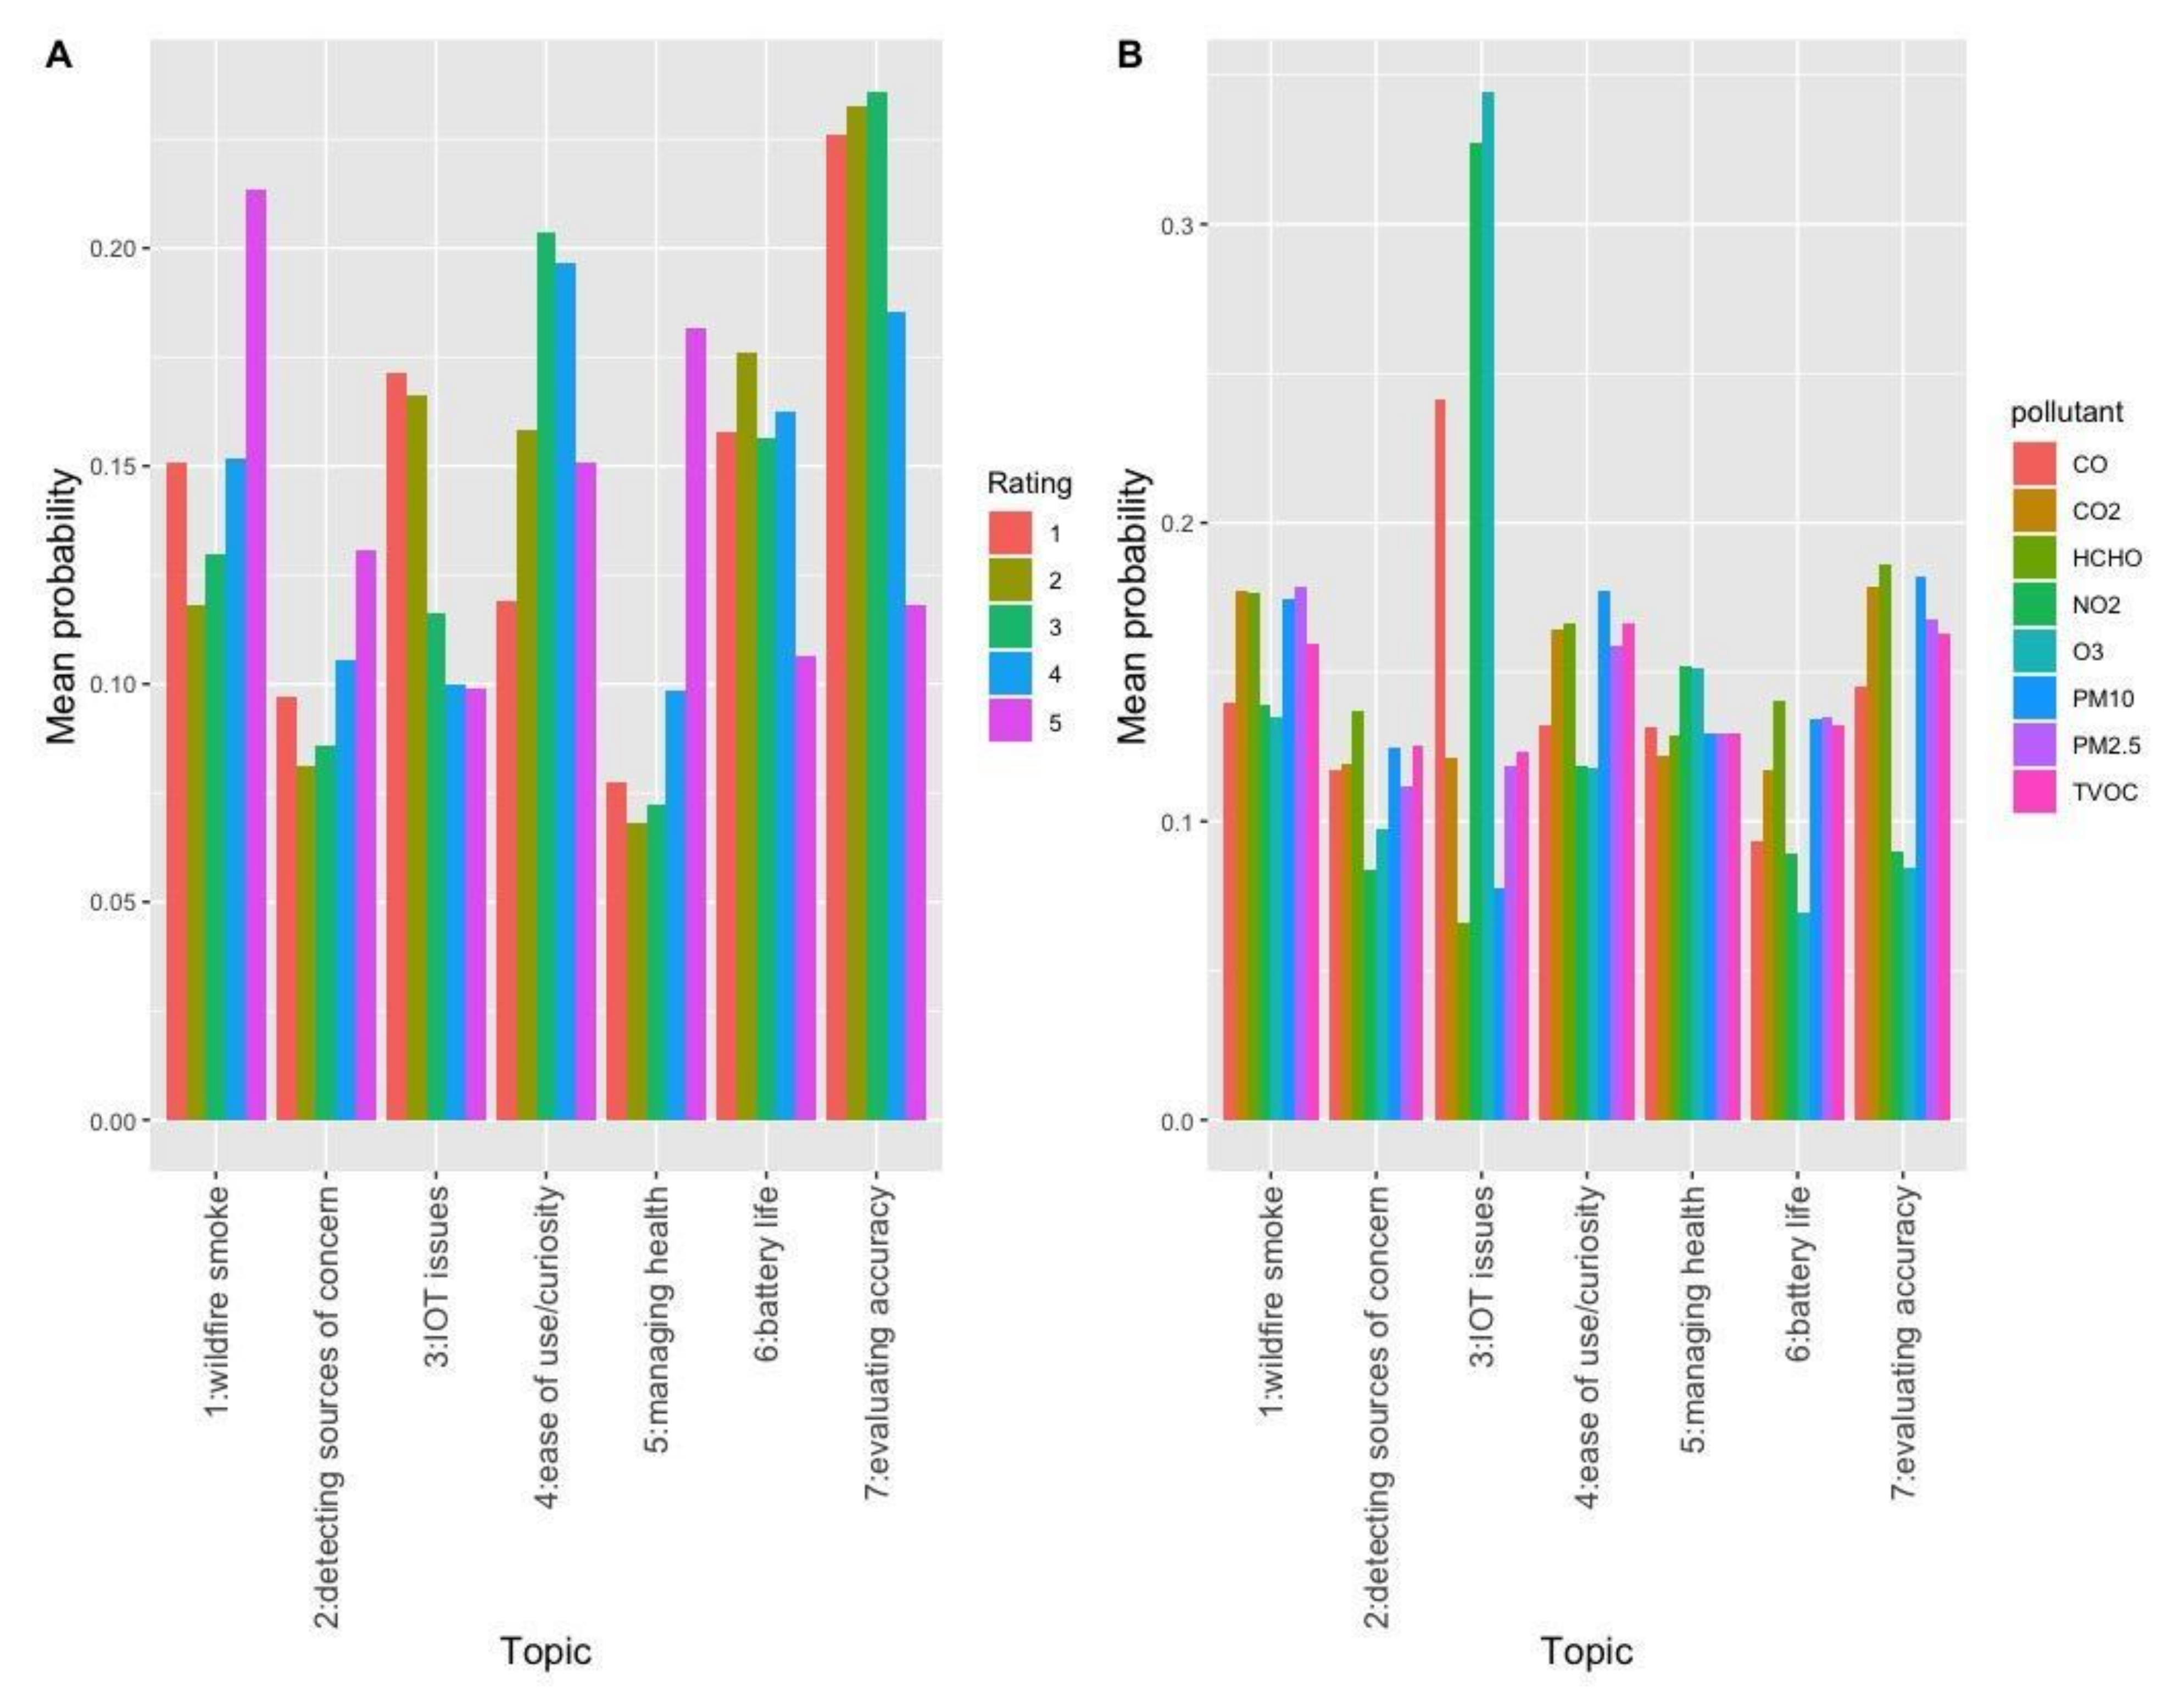
The Kruskal–Wallis tests revealed significant variation in the prevalence of each topic in the reviews by rating and product. The prevalence of different topics in the reviews corresponding to different ratings is displayed in Figure 4A. The users that had written reviews that mainly discussed using their devices to track fires (Topic 1), managing their health (Topic 5), and the ease of use/curiosity (Topic 4) tended to be positive about the device they had bought (their ratings tended to be 4 or 5 stars). On the other hand, the reviews that mainly discussed the accuracy of their instruments (Topic 7), battery life (Topic 6), and IOT issues (Topic 3) tended to correspond to low ratings (their ratings tended to be 1 or 2 stars) in comparison to other data.
The mean prevalence of each topic corresponding to the pollutant(s) measured by the device being reviewed is displayed in Figure 4B. The Kruskal–Wallis tests that examined variation in the prevalence of different topics by pollutant were less informative. Overall, we saw little variation in topic prevalence by pollutants. This is likely because almost all the devices measure several pollutants (e.g., 59 of the 94 devices measured both PM2.5 and HCHO, two very different pollutants). It was unclear which pollutant each review was referring to. Any significant variation seen could thus correspond to variations in the device being reviewed rather than the pollutant.
4. Discussion
The analysis of the key themes discussed by users of low-cost sensors in the Amazon reviews of these devices represents a first step in understanding (1) the motivations of the public in purchasing these sensors and (2) how such the sensors are being used.
Specifically, this article found that many users have purchased devices to track wildfire smoke, manage health conditions such as allergies, evaluate specific sources of concern, and generally learn about air pollution in their environments. The use of low-cost sensors as a tool during smoke events was the most prevalent theme.
The identification of these uses can spur new ‘fitness-of-purpose’ tests of low-cost sensors for these purposes. For example, it is becoming increasingly evident that it is important to evaluate the performance of such devices to detect wildfire smoke as many users are making important decisions to protect their health during such events, such as deciding when to open their windows. Existing protocols, such as those used by the South Coast Air Quality Management District [26] to evaluate sensor performance typically do not include testing these devices during smoky conditions. However, important research is underway to evaluate different devices during wildfires and to develop adjustment factors for measurements from different low-cost sensors to improve their accuracy in capturing wildfire smoke [27,28].
From the variations in ratings of each product (std dev > 1 for greater than 90% of the devices) (Table 1), it appears that users of the same device can have very different experiences with the same product. This analysis found that users who reported using the device to track wildfires and manage allergies tended to be positive about their experience with the device. Reviews where topics related to the device operation, battery life, and concerns about the accuracy of the instrument were most prevalent tended to be associated with low ratings (Figure 4A). This is likely the case because different reviewers evaluated their devices very differently. Some found that their device allowed them to correspond changes in the measurements of their device with that of smoke alerts and the feelings of well-being that allowed them to take necessary action. This correspondence perhaps allowed these customers to take for granted the accuracy of their devices for their purposes. Many such reviewers had become ‘attuned’ to their devices and provided details on how much time it took for their devices to respond to different sources. For example, two such example reviews were:
“....I tested (very informally) it [the device] by putting it near known pollutants and the response time was much quicker than expected (a couple to 10 s of being in the same area started it spiking up).”
“....I put it near a smoky area and also near the exhaust of my car. It takes a good 4 to 5 min before it starts to read “unhealthy levels.”
These reviewers used their devices for making decisions, such as when to turn on their air purifiers and take extra precautions to protect their health (Table 1). Others found that their devices did not correspond to the visual evidence of smoke alerts or did not detect known sources, which made them question the accuracy of their devices, explicitly bringing it up. Still others compared the readings of their devices with the EPA readings for their area/the nearest PurpleAir monitor. Many others took the accuracy of their devices for granted and used their devices to understand the air quality in their environments (Table 1). Crucially, only one review explicitly mentioned the formal regulatory evaluation of the product they were using. This suggests that the work regulators are doing to evaluate different sensors needs to be more widely disseminated. More information overall about the limitations of these low-cost sensors needs to be disseminated to the public as a whole, especially for the safety of users who were making key decisions solely on the basis of such devices.
Finally, IoT issues and ease of access to data were also key topics of discussion. Some reviews provided interesting information on the design features the customer found useful for interpreting the measurements from their device. Several reviewers discussed how being able to visualize trends over time allowed them to identify actions that they could avoid. Such insights could help scientists and regulators who work with communities to visualize and present data in a manner that is most helpful. For example, one reviewer wrote the following review:
“......The device looks great and the display on the device itself is pretty easy to understand once you get used to what each of the bars means. I also like how the display can be adjusted to show any of the metrics individually or can be used as a simple clock if desired. I also appreciate the light level adjustment and the sleep mode which would come in handy if using the device in a bedroom. Additionally, I have found the mobile software to be top notch. I like being able to track trends over time and see the impact of my actions in graph form.”
There are several limitations with this approach. One: Although Amazon reviews are readily available, they do not capture the whole span of a user’s experience of using low-cost air quality sensors. In future research, in-depth interviews and surveys are required to build on this work. Two: Amazon reviewers of low-cost sensors are likely not representative of the general population using such devices. Some reviews may also be spurious (e.g., companies leaving bad reviews for their competitors and companies using third parties to self-promote their own product). Amazon has some protections in place to help limit the number of spurious reviews, such as by denoting a verified buyer. However, the themes identified still capture important topics discussed by close to 2000 users of low-cost devices. Three: We do not have any socioeconomic or demographic information on Amazon reviewers and therefore cannot detail how sensor usage patterns differ in different subpopulations. Recent research suggests that low-cost monitors tend to be deployed in more privileged neighborhoods [29]. It is important to conduct targeted research in the future to understand how to support the use of low-cost sensors by populations in less privileged neighborhoods who bear the brunt of air pollution. Four: Different pollutants are produced by different sources and have different health effects. Because of the lack of information about the kind of pollutant being described in each review, this article was not able to generate separate topics of discussion for users concerned with different pollutants. Five: It is important to acknowledge that the interpretations and summaries of each topic identified by the topic model are subjective. This is a common limitation for topic modeling as the labeling of topics is often determined through examination of the most probable words, which are not necessarily exclusive to a topic and represent a small fraction of the probability distribution. Six: This analysis does not present an exhaustive list of the use cases of low-cost devices. It only serves to highlight key themes that the users brought up in their reviews of these devices.
Despite these limitations, this work represents the first effort to gain an in-depth understanding of how low-cost sensors are actually being used by the public and what users tend to want to know about the air pollution they breathe. These findings could support interventions designed to support such communities of users, as well as spur interviews to understand the different use cases of such devices in more detail.
Funding
This research received no external funding.
Institutional Review Board Statement
Not applicable.
Informed Consent Statement
Not applicable.
Data Availability Statement
All the data used in this study is public.
Acknowledgments
The author is very grateful to Antonio Berrones for his help in scraping the Amazon reviews for this analysis, and to Shin Bin Tan for her comments on an early draft.
Conflicts of Interest
The author declares no conflict of interest.
References
- Castell, N.; Dauge, F.R.; Schneider, P.; Vogt, M.; Lerner, U.; Fishbain, B.; Broday, D.; Bartonova, A. Can commercial low-cost sensor platforms contribute to air quality monitoring and exposure estimates? Environ. Int. 2017, 99, 293–302. [Google Scholar] [CrossRef] [PubMed]
- Kumar, P.; Morawska, L.; Martani, C.; Biskos, G.; Neophytou, M.K.-A.; DI Sabatino, S.; Bell, M.; Norford, L.; Britter, R. The rise of low-cost sensing for managing air pollution in cities. Environ. Int. 2015, 75, 199–205. [Google Scholar] [CrossRef] [PubMed] [Green Version]
- Liu, X.; Jayaratne, R.; Thai, P.; Kuhn, T.; Zing, I.; Christensen, B.; Lamont, R.; Dunbabin, M.; Zhu, S.; Gao, J.; et al. Low-cost sensors as an alternative for long-term air quality monitoring. Environ. Res. 2020, 185, 109438. [Google Scholar] [CrossRef] [PubMed]
- Desouza, P.N.; Oriama, P.A.; Pedersen, P.P.; Horstmann, S.; Gordillo-Dagallier, L.; Christensen, C.N.; Franck, C.O.; Ayah, R.; Kahn, R.A.; Klopp, J.M.; et al. Spatial variation of fine particulate matter levels in Nairobi before and during the COVID-19 curfew: Implications for environmental justice. Environ. Res. Commun. 2021, 3, 071003. [Google Scholar] [CrossRef]
- Morawska, L.; Thai, P.K.; Liu, X.; Asumadu-Sakyi, A.; Ayoko, G.; Bartonova, A.; Bedini, A.; Chai, F.; Christensen, B.; Dunbabin, M.; et al. Applications of low-cost sensing technologies for air quality monitoring and exposure assessment: How far have they gone? Environ. Int. 2018, 116, 286–299. [Google Scholar] [CrossRef] [PubMed]
- Snyder, E.G.; Watkins, T.H.; Solomon, P.A.; Thoma, E.D.; Williams, R.W.; Hagler, G.S.W.; Shelow, D.; Hindin, D.A.; Kilaru, V.J.; Preuss, P.W. The Changing Paradigm of Air Pollution Monitoring. Environ. Sci. Technol. 2013, 47, 11369–11377. [Google Scholar] [CrossRef] [PubMed]
- Williams, R.; Duvall, R.; Kilaru, V.; Hagler, G.; Hassinger, L.; Benedict, K.; Rice, J.; Kaufman, A.; Judge, R.; Pierce, G.; et al. Deliberating performance targets workshop: Potential paths for emerging PM2.5 and O3 air sensor progress. Atmos. Environ. X 2019, 2, 100031. [Google Scholar] [CrossRef] [PubMed]
- Hubbell, B.J.; Kaufman, A.; Rivers, L.; Schulte, K.; Hagler, G.; Clougherty, J.; Cascio, W.; Costa, D. Understanding social and behavioral drivers and impacts of air quality sensor use. Sci. Total Environ. 2018, 621, 886–894. [Google Scholar] [CrossRef] [PubMed]
- Ottinger, G. Refining Expertise: How Responsible Engineers Subvert Environmental Justice Challenges; NYU Press: New York, NY, USA, 2013. [Google Scholar]
- Allen, B.L. Uneasy Alchemy: Citizens and Experts in Louisiana’s Chemical Corridor Disputes; MIT Press: Cambridge, MA, USA, 2003. [Google Scholar]
- Eysenbach, G. Infodemiology and Infoveillance: Tracking Online Health Information and Cyberbehavior for Public Health. Am. J. Prev. Med. 2011, 40, S154–S158. [Google Scholar] [CrossRef] [PubMed]
- Lewis, D.D.; Yang, Y.; Russell-Rose, T.; Li, F. Rcv1: A new benchmark collection for text categorization research. J. Mach. Learn. Res. 2004, 5, 361–397. [Google Scholar]
- Silge, J.; Robinson, D. Tidytext: Text Mining and Analysis Using Tidy Data Principles in R. J. Open Source Softw. 2016, 1, 37. [Google Scholar] [CrossRef] [Green Version]
- Hsu, A.; Rauber, R. Diverse climate actors show limited coordination in a large-scale text analysis of strategy documents. Commun. Earth Environ. 2021, 2, 30. [Google Scholar] [CrossRef]
- Bai, X.; Zhang, X.; Li, K.X.; Zhou, Y.; Yuen, K.F. Research topics and trends in the maritime transport: A structural topic model. Transp. Policy 2021, 102, 11–24. [Google Scholar] [CrossRef]
- Xue, J.; Chen, J.; Chen, C.; Zheng, C.; Li, S.; Zhu, T. Public discourse and sentiment during the COVID 19 pandemic: Using Latent Dirichlet Allocation for topic modeling on Twitter. PLoS ONE 2020, 15, e0239441. [Google Scholar] [CrossRef] [PubMed]
- Bowen, G.A. Document Analysis as a Qualitative Research Method. Qual. Res. J. 2009, 9, 27–40. [Google Scholar] [CrossRef] [Green Version]
- Wang, H.; Zhang, D.; Zhai, C. Structural topic model for latent topical structure analysis. In Proceedings of the 49th Annual Meeting of the Association for Computational Linguistics: Human Language Technologies, Stroudsburg, PA, USA, 19–24 June 2011; pp. 1526–1535. [Google Scholar]
- Roberts, M.E.; Stewart, B.M.; Tingley, D.; Lucas, C.; Leder-Luis, J.; Gadarian, S.K.; Albertson, B.; Rand, D.G. Structural Topic Models for Open-Ended Survey Responses. Am. J. Polit. Sci. 2014, 58, 1064–1082. [Google Scholar] [CrossRef] [Green Version]
- Arora, S.; Ge, R.; Halpern, Y.; Mimno, D.; Moitra, A.; Sontag, D.; Wu, Y.; Zhu, M. A Practical Algorithm for Topic Modeling with Provable Guarantees. In Proceedings of the International Conference on Machine Learning, Atlanta, GA, USA, 6–21 June 2013; PMLR: Cambridge, MA, USA, 2013; pp. 280–288. Available online: http://proceedings.mlr.press/v28/arora13.html (accessed on 31 May 2021).
- Mimno, D.; Wallach, H.; Talley, E.; Leenders, M.; McCallum, A. Optimizing semantic coherence in topic models. In Proceedings of the 2011 Conference on Empirical Methods in Natural Language Processing, Edinburgh, UK, 27–31 July 2011; pp. 262–272. [Google Scholar]
- Bischof, J.; Airoldi, E.M. Summarizing topical content with word frequency and exclusivity. In Proceedings of the 29th International Conference on Machine Learning (ICML-12), Edinburgh, UK, 26 June–1 July 2012; pp. 201–208. [Google Scholar]
- PM Sensor Evaluations. Available online: http://www.aqmd.gov/aq-spec/evaluations/summary-pm (accessed on 3 January 2022).
- Gas Sensor Evaluations. Available online: http://www.aqmd.gov/aq-spec/evaluations/summary-gas (accessed on 3 January 2022).
- PurpleAir. Available online: http://www2.purpleair.com/ (accessed on 3 January 2022).
- South Coast Air Quality Sensor Performance Evaluation Center. Available online: http://aqmd.gov/aq-spec (accessed on 3 January 2022).
- Holder, A.L.; Mebust, A.K.; Maghran, L.A.; McGown, M.R.; Stewart, K.E.; Vallano, D.M.; Elleman, R.A.; Baker, K.R. Field Evaluation of Low-Cost Particulate Matter Sensors for Measuring Wildfire Smoke. Sensors 2020, 20, 4796. [Google Scholar] [CrossRef] [PubMed]
- Delp, W.W.; Singer, B.C. Wildfire Smoke Adjustment Factors for Low-Cost and Professional PM2.5 Monitors with Optical Sensors. Sensors 2020, 20, 3683. [Google Scholar] [CrossRef] [PubMed]
- Desouza, P.; Kinney, P.L. On the distribution of low-cost PM2.5 sensors in the US: Demographic and air quality associations. J. Expo. Sci. Environ. Epidemiol. 2021, 31, 514–524. [Google Scholar] [CrossRef] [PubMed]
Figure 1.
Steps taken to pre-process the text before running the topic model.

Figure 2.
Diagnostics to determine the number of topics.

Figure 3.
Word clouds for each topic. Words with the highest probability of occurrence in each topic are shown. Words in a larger font size indicate a higher occurrence likelihood. Topics are manually labeled by the author.
Figure 3.
Word clouds for each topic. Words with the highest probability of occurrence in each topic are shown. Words in a larger font size indicate a higher occurrence likelihood. Topics are manually labeled by the author.

Figure 4.
The mean estimated proportion of words corresponding to each topic (topic prevalence) for (A) reviews associated with different ratings and (B) different pollutants measured by the device being reviewed.
Figure 4.
The mean estimated proportion of words corresponding to each topic (topic prevalence) for (A) reviews associated with different ratings and (B) different pollutants measured by the device being reviewed.

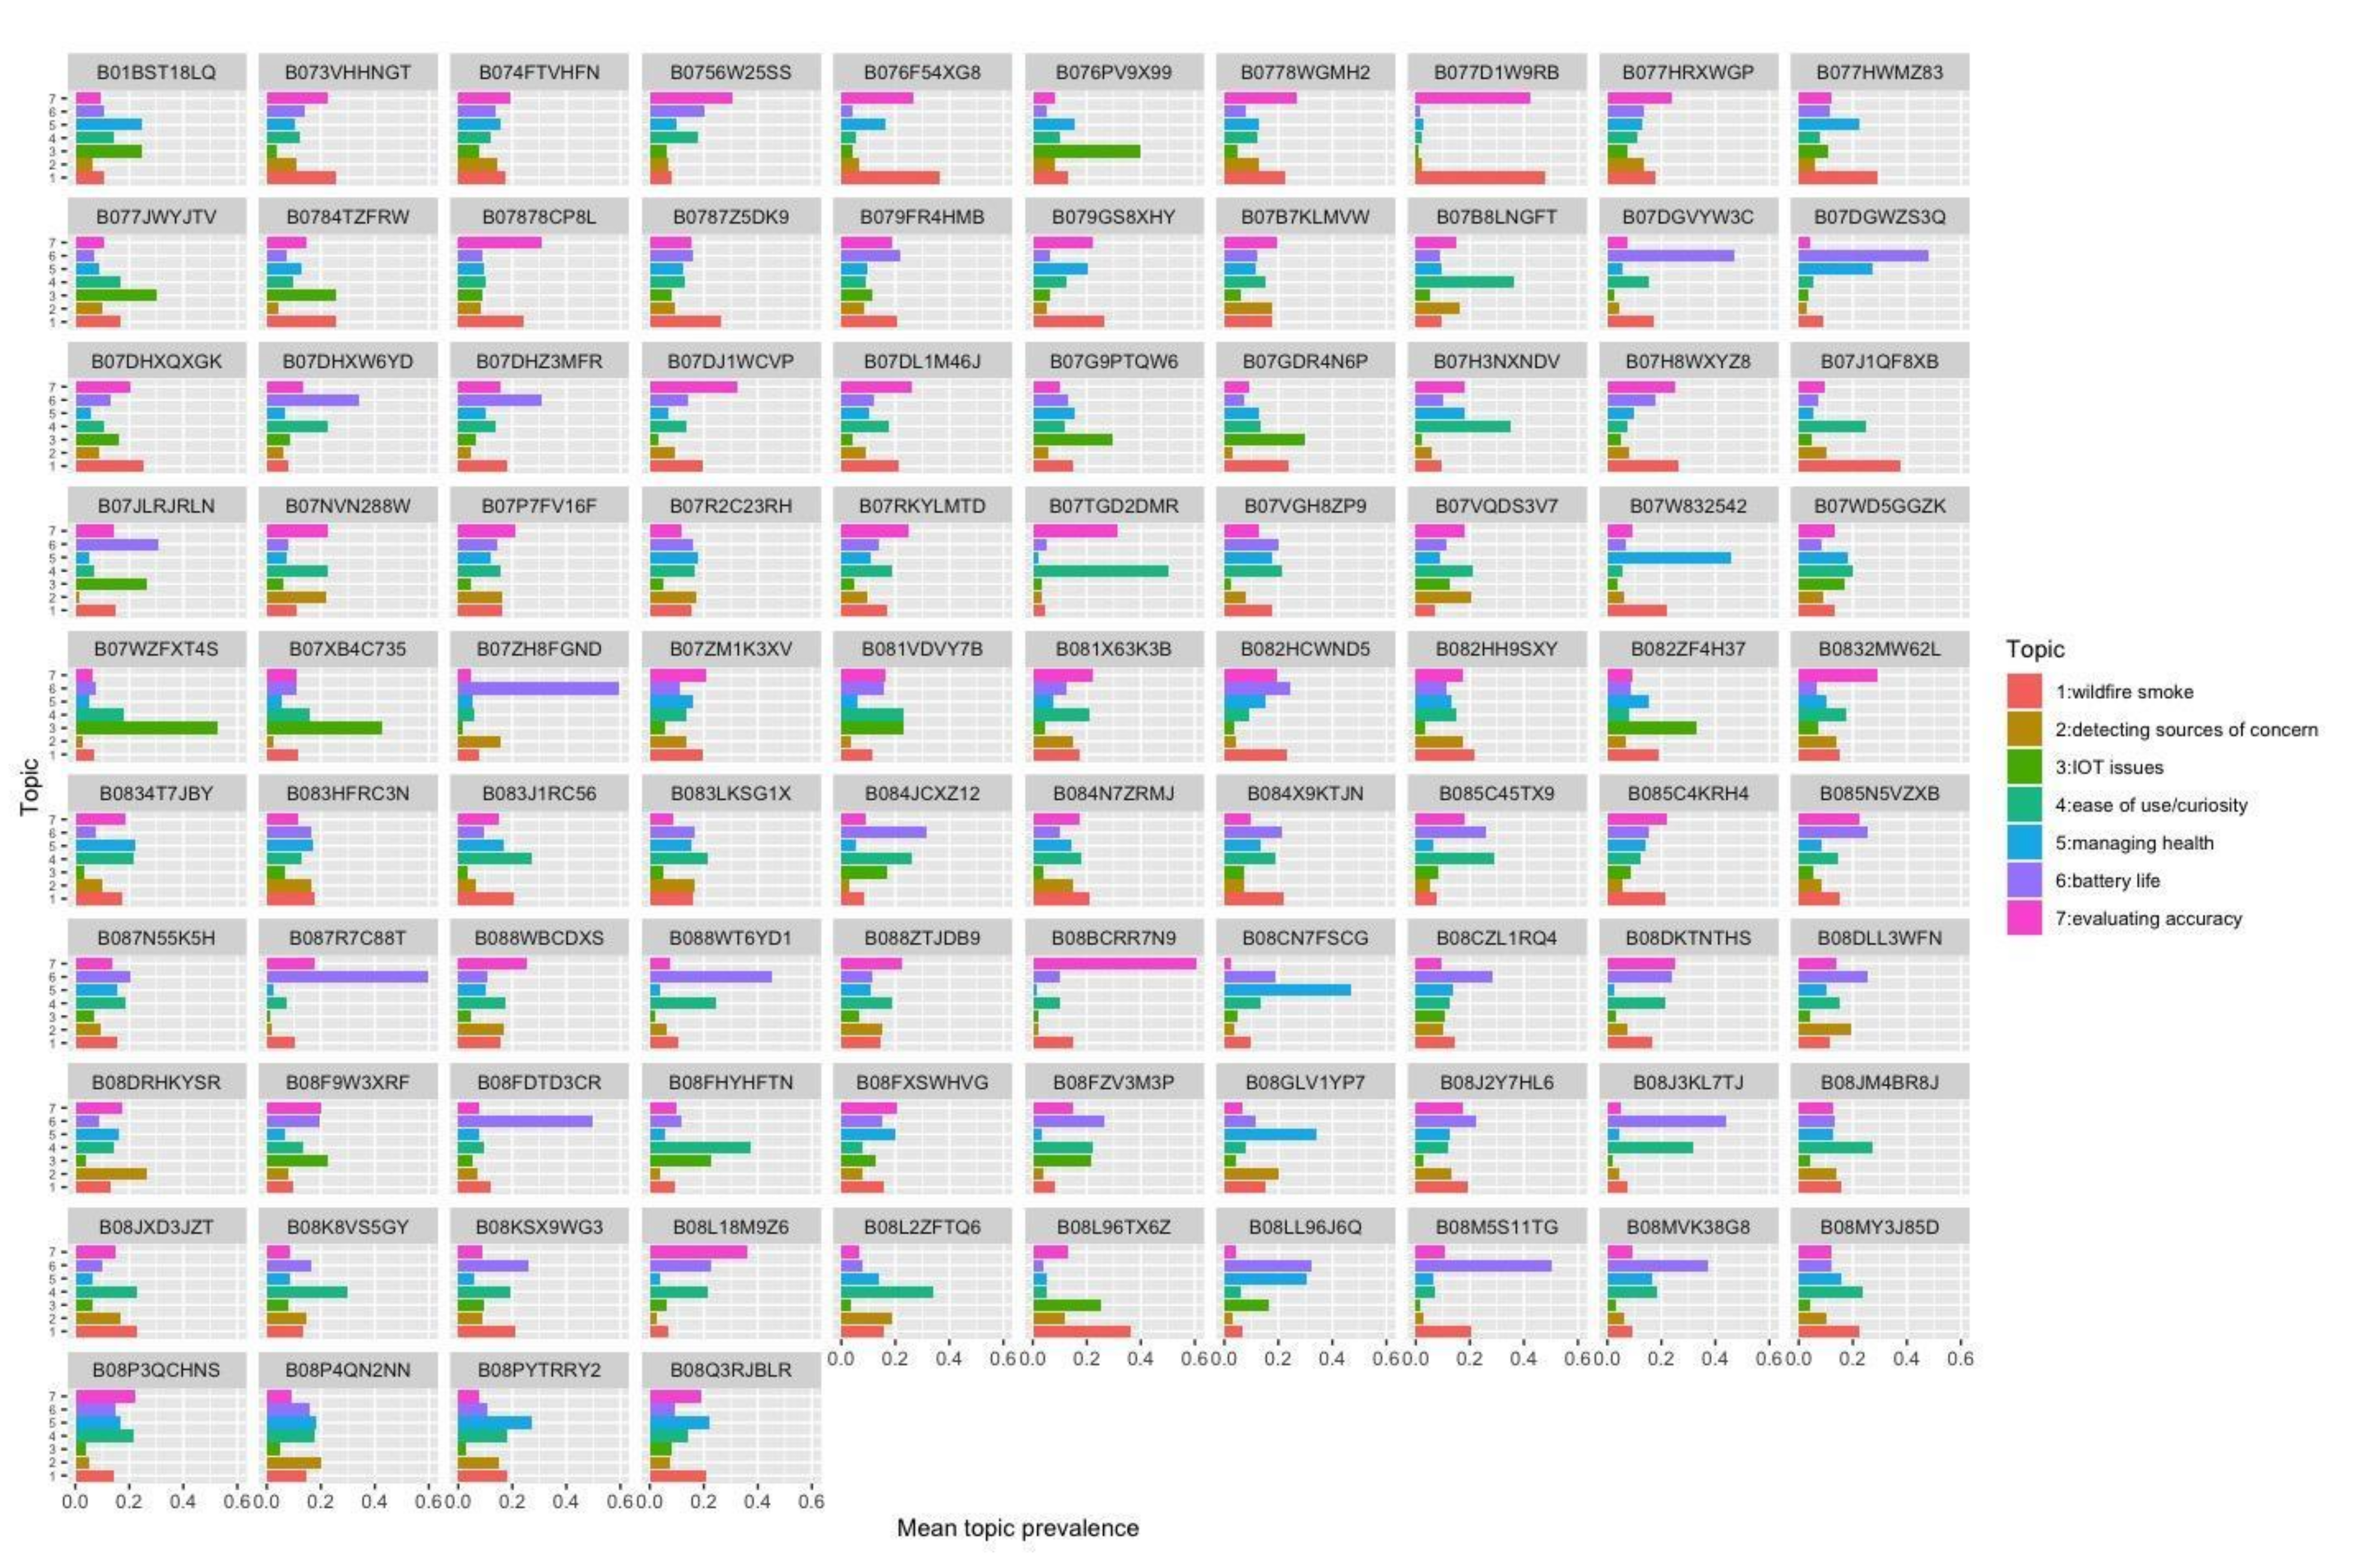
Figure 5.
The mean estimated proportion of words belonging to different topics (topic prevalence) from reviews corresponding to the different low-cost air quality monitors (referred to by ASINs).
Figure 5.
The mean estimated proportion of words belonging to different topics (topic prevalence) from reviews corresponding to the different low-cost air quality monitors (referred to by ASINs).


Table 1.
Unique ASIN number, price, number of reviews, overall ratings, average rating of reviews, std deviation of ratings, min word count, max word count, mean word count, and standard deviation of the word count of reviews considered in this analysis corresponding to each of the 94 low-cost air pollution monitoring devices classified as an ‘Indoor Air Quality Meter’ on Amazon. Almost every device measures multiple pollutants. The various pollutants measured by each device are included in the name of the instrument.
| ASIN | Name | Price (USD) | No. Reviews | Overall Rating | Mean Rating | Std Dev of Rating | Min Words | Max Words | Mean Words | Std Dev Words | |
|---|---|---|---|---|---|---|---|---|---|---|---|
| 1 | B01BST18LQ | Atmotube 2.0—Portable Air Quality Monitor. Indoor/Outdoor Air Pollution Tracker: PM1, PM2.5, PM10, VOC, Temperature, Humidity, Barometric Pressure | 165 | 35 | 3.5 | 3.6 | 1.46 | 26 | 314 | 84.23 | 55.95 |
| 2 | B073VHHNGT | Temtop LKC-1000E Professional Formaldehyde Monitor Detector with HCHO, PM2.5, PM10, AQI Accurate Testing Air Quality Detector | 109.99 | 13 | 4 | 3.46 | 1.76 | 27 | 834 | 167.38 | 276.28 |
| 3 | B074FTVHFN | Air Quality Monitor, Formaldehyde Detector, Pollution Meter, Sensor, Tester; Detect & Test Indoor Pollution, TVOC, HCHO, PM2.5, Dust; eBook | 113.68 | 175 | 4 | 3.32 | 1.64 | 26 | 897 | 109.26 | 122.46 |
| 4 | B0756W25SS | Temtop Airing-1000 Professional Laser Air Quality Monitor PM2.5, PM10 Detector Particle Counter Dust Meter Real Time Display High Accuracy | 159.99 | 9 | 4 | 3.33 | 1.73 | 34 | 253 | 120.89 | 67.79 |
| 5 | B076F54XG8 | Temtop LKC-1000E Air Quality Monitor HCHO Detector, PM2.5, PM10, AQI Tester | 109.99 | 10 | 4 | 3.8 | 1.75 | 37 | 91 | 68.4 | 21.43 |
| 6 | B076PV9X99 | uHoo Indoor Air Quality Sensor—9 in 1 Smart Air Monitor with Temperature and Humidity Gauge, CO2, Dust (PM2.5), VOC, NO2, Allergen Meter -to Breathe Easy and Boost Health | 329 | 78 | 4 | 3.88 | 1.54 | 26 | 907 | 156.63 | 157.15 |
| 7 | B0778WGMH2 | Temtop LKC-1000S+ Professional Formaldehyde Monitor Detector with HCHO, PM2.5, PM10, TVOC Accurate Testing Air Quality Detector | 153.99 | 22 | 4.5 | 3.55 | 1.57 | 26 | 281 | 102.86 | 70.26 |
| 8 | B077D1W9RB | Portable PM2.5 Meter Detector Monitor Air Quality Detect High Accuracy Easy Operation | 56 | 1 | 2 | 3 | NA | 169 | 169 | 169 | NA |
| 9 | B077HRXWGP | Temtop LKC-1000S+ Air Quality Monitor Formaldehyde Detector, Air Pollution Sensor, Humidity and Temperature Meter Tester with PM2.5, PM10, HCHO, AQI, TVOC Histogram | 153.99 | 42 | 4 | 3.48 | 1.61 | 27 | 611 | 122.67 | 120.88 |
| 10 | B077HWMZ83 | Temtop LKC-1000S Air Quality Monitor Formaldehyde Detector, Air Pollution Sensor, Humidity and Temperature Meter Tester with PM2.5, PM10, HCHO, AQI Sensor Indoor Testing | 135.99 | 12 | 4 | 3.67 | 1.72 | 30 | 270 | 82.25 | 83.7 |
| 11 | B077JWYJTV | Kaiterra Laser Egg+ Chemical: Indoor Air Quality Monitor (Tracks PM2.5, TVOC, Temperature, and Humidity) | 199 | 57 | 4 | 3.91 | 1.44 | 27 | 942 | 141.4 | 167.01 |
| 12 | B0784TZFRW | IQAir AirVisual Pro Air Quality Monitor for PM2.5, CO2, AQI, Temperature, and Humidity, IFTTT App Enabled, Real-Time Air Quality | 269 | 87 | 4 | 3.51 | 1.74 | 28 | 621 | 122.57 | 95.78 |
| 13 | B07878CP8L | Temtop P200 Air Quality Laser Particle Detector Professional Meter Accurate Testing for PM2.5, PM10 LCD Display | 64.89 | 16 | 4 | 3.38 | 1.67 | 31 | 356 | 110.81 | 86.53 |
| 14 | B0787Z5DK9 | Temtop P600 Air Quality Laser Particle Detector Professional Meter Accurate Testing for PM2.5, PM10 TFT Color LCD Display | 98.99 | 32 | 4 | 3.91 | 1.33 | 27 | 738 | 91.41 | 123.54 |
| 15 | B079FR4HMB | ECOWITT WH0290 Air Quality Monitor Meter PM2.5 Detector Indoor Outdoor with Temperature and Humidity for Home Office Car | 69.99 | 32 | 4 | 3.62 | 1.68 | 27 | 235 | 80.25 | 51.64 |
| 16 | B079GS8XHY | Temtop LKC-1000S Professional Formaldehyde Monitor Temperature and Humidity Detector with PM2.5, PM10, HCHO, AQI Accurate Testing Air Quality Detector | 135.99 | 5 | 4.5 | 3.8 | 1.64 | 27 | 110 | 70.6 | 36.31 |
| 17 | B07B7KLMVW | Air Quality Monitor, IGERESS Indoor Air Pollution Tester for Formaldehyde TVOC PM1, PM2.5, PM10, Temperature and Humidity, Real Time Home Air Quality Detector Meter, Colorful LCD Screen | 110.99 | 38 | 4 | 3.71 | 1.52 | 27 | 277 | 97.45 | 68.04 |
| 18 | B07B8LNGFT | Air Quality Monitor Sherry Indoor Air Quality Monitor for CO2, HCHO, TVOC, PM2.5, PM10 -Accurate Air Quality Monitor Indoor Radar Detectors | 109.9 | 79 | 4 | 3.42 | 1.46 | 26 | 1176 | 164.96 | 197.63 |
| 19 | B07DGVYW3C | Air Quality Monitor ind CEM DT-968 Accurate Tester for CO2, HCHO, TVOC PM2.5, PM10 Multifunctional Air Gas Detector Real Time Data & Mean Value Recording for indoor | 119.99 | 4 | 3 | 3.5 | 1.73 | 33 | 120 | 77.5 | 35.93 |
| 20 | B07DGWZS3Q | CEM DT-9681 Indoor PM2.5, CO2, HCHO Air Quality Meter Particle Mass Concentration Monitors with LCD Display Testing HCHO, PM2.5, PM10, CO2, Humidity and Temperature Real Time Monitoring | 156.04 | 1 | 3.5 | 3 | NA | 85 | 85 | 85 | NA |
| 21 | B07DHXQXGK | Temtop M10 Air Quality Monitor for PM2.5, HCHO, TVOC, AQI Professional Electrochemical Sensor Detector Real Time Display Rechargeable Battery | 89.99 | 47 | 4.5 | 3.68 | 1.6 | 27 | 538 | 99.38 | 89.66 |
| 22 | B07DHXW6YD | Temtop M1000 Air Quality Monitor for PM2.5, HCHO, TVOC, Temperature and Humidity Detector Large LCD Display Built-in Rechargeable Battery | 116.99 | 13 | 4 | 3.77 | 1.17 | 26 | 456 | 140.54 | 143.08 |
| 23 | B07DHZ3MFR | Temtop P1000 Air Quality Monitor for PM2.5, PM10, CO2, Temperature, Humidity Indoor Detector Large LCD Display Built-in Rechargeable Battery | 120.99 | 11 | 3.5 | 3 | 1.67 | 27 | 400 | 113.18 | 118.2 |
| 24 | B07DJ1WCVP | Temtop M2000C Air Quality Monitor for PM2.5, PM10, CO2, Temperature and Humidity settable Audio Alarm Recording Curve Easy Calibration Colorful Display | 153.99 | 19 | 4.5 | 3.89 | 1.29 | 31 | 1011 | 112 | 225.19 |
| 25 | B07DL1M46J | 2.8” Digital Car PM2.5 Air Quality Detector Tester Meter AQI Home Gas Monitor | 55.99 | 33 | 4 | 4.3 | 1.13 | 26 | 298 | 98 | 68.95 |
| 26 | B07G9PTQW6 | Flow, The Personal Air Quality Sensor by Plume Labs—Mobile, Bluetooth Connection, Measures PM2.5, PM10, NO2, VOC Indoors and Outdoors | 119.99 | 45 | 3.5 | 3.4 | 1.56 | 34 | 601 | 149.6 | 118.39 |
| 27 | B07GDR4N6P | Kaiterra Laser Egg: Indoor Air Quality Monitor (Tracks PM2.5, Temperature, and Humidity) | 149 | 8 | 3.5 | 3.38 | 1.85 | 47 | 194 | 93.12 | 46.12 |
| 28 | B07H3NXNDV | BTMETER—Air Particulate Meter PM2.5 PM10 Monitor Meter BT-5800D Pro Particulate Matter Detector, Accuracy +/− 20% Tester for Air Quality Monitoring Indoor Outdoor w/Back Light | 99.99 | 5 | 4 | 3.8 | 0.45 | 34 | 475 | 193.6 | 180.94 |
| 29 | B07H8WXYZ8 | Temtop LKC-1000S+ Air Quality Monitor Formaldehyde Detector, Air Pollution Sensor, Humidity and Temperature Meter Tester with PM2.5, PM10, HCHO, AQI, Particles, TVOC Histogram | 153.99 | 14 | 4 | 2.86 | 1.75 | 35 | 397 | 145.64 | 113.65 |
| 30 | B07J1QF8XB | CEM DT-9681W Indoor Air Quality Meter Particle Mass Concentration Monitors with WiFi Function LCD Display Testing HCHO, PM2.5, PM10 CO2, Humidity and Temperature | 239 | 1 | 5 | 5 | NA | 113 | 113 | 113 | NA |
| 31 | B07JLRJRLN | ECOWITT WH41 PM2.5 Air Quality Sensor Monitor Indoor Outdoor—Accessory Only, Can Not Be Used Alone | 47.99 | 9 | 4 | 3.56 | 1.67 | 26 | 762 | 187.44 | 225.97 |
| 32 | B07NVN288W | TOPINCN Portable Formaldehyde Detector Indoor Home Digital Hand-Held Air Quality Tester HCHO Meter, TVOC Monitor, PM2.5, Benzene | 17.49 | 3 | 3.5 | 3.33 | 2.08 | 51 | 639 | 257 | 331.16 |
| 33 | B07P7FV16F | Air Quality Monitor Formaldehyde Detector, Indoor Pollution Meter, Tester, Sensor, Temperature and Humidity, Air Detector PM2.5, PM10, HCHO, TVOC Real-Time | 112.99 | 54 | 4 | 3.67 | 1.59 | 26 | 578 | 121.81 | 118.18 |
| 34 | B07R2C23RH | TVOC Air Quality Monitor Detector Pollution Meter Monitor to Detect Indoor Pollution 2020 New Indoor air Quality Monitor | NA | 21 | 3.5 | 4.24 | 1.18 | 27 | 272 | 82.05 | 73.5 |
| 35 | B07RKYLMTD | Huma-i (HI-150), Advanced Portable Air Quality Monitor Indoor Outdoor Which Measures CO2, VOC, PM2.5, PM10, Temperature, Humidity—Black | 149 | 44 | 4.5 | 3.75 | 1.4 | 29 | 908 | 129.77 | 154.92 |
| 36 | B07TGD2DMR | Finetoknow Portable Air Quality Monitor HCHO, TVOC, PM2.5, PM10, HCHO Detector LCD Display Tester | 13.97 | 1 | 1 | 1 | NA | 140 | 140 | 140 | NA |
| 37 | B07VGH8ZP9 | HeiYi Air Quality Monitor, Air Quality Tester Accurate PM2.5, Temperature, Humidity Monitoring Smart Air Quality Detector Indoor Outdoor Real Time LCD Display | 49.99 | 7 | 4 | 3.86 | 1.57 | 32 | 597 | 180.29 | 216.68 |
| 38 | B07VQDS3V7 | Goplus Air Quality Pollution Monitor, 7 in 1 Indoor HCHO Detector, Temperature & Humidity Meter Tester, Detects TVOC, PM2.5, PM10, PM1.0 | 86.99 | 5 | 4 | 3 | 2 | 46 | 161 | 87.8 | 51.06 |
| 39 | B07W832542 | HOLDPEAK Air Quality Tester, PM2.5, PM10 Detector Accurate Air Quality Monitor with Dot-Matrix LCD, use for Home, Industry and Various Occasion (HP-5800D) | 90.99 | 1 | 4 | 4 | NA | 82 | 82 | 82 | NA |
| 40 | B07WD5GGZK | Atmotube Pro Portable Outdoor and Indoor Professional Air Quality Monitor (PM1, PM2.5, PM10, VOC, HCHO, Temperature, Humidity and Barometric Pressure Gauge) | 169 | 58 | 4 | 4.16 | 1.12 | 26 | 727 | 166.67 | 161.21 |
| 41 | B07WZFXT4S | Air Quality Monitor HT9600 PM2.5, PM10, Air Quality Analyzer Humidity Meter Handheld Particle Counter Monitor for Indoor Environment of Family, Office, Inside of Cars and Natural Environment, etc. | 170.19 | 1 | 3 | 1 | NA | 30 | 30 | 30 | NA |
| 42 | B07XB4C735 | AirRadio Smart Indoor Air Quality Monitor (Temperature, Humidity, PM2.5, PM10) Home dust Concentration Detector, Volcanic ash Meter Monitor with Storage Case (APP) | 39.99 | 2 | 3 | 1 | 0 | 33 | 58 | 45.5 | 17.68 |
| 43 | B07ZH8FGND | FUELUS Air Quality Tester, Detector, HCHO, PM2.5, PM10, TVOC Monitor Suitable For Indoor, Outdoor Environmental Air Detection | NA | 4 | 2.5 | 3 | 2.31 | 48 | 232 | 128.5 | 76.32 |
| 44 | B07ZM1K3XV | Air Quality Monitor Meter IGERESS Multifunctional Air Quality Tester Accurate Detector Indoor with Holder for HCHO, TVOC, PM2.5, PM10 (Gray) | 105.99 | 25 | 3.5 | 3.72 | 1.57 | 28 | 501 | 83.12 | 99.55 |
| 45 | B081VDVY7B | iClever Air Quality Monitor, Wireless Chargeable Air Quality Tester for PM2.5, PM10, PM1.0, Temperature, Humidity, Indoor Outdoor Air Detector for Home/Office/Car and Various Occasion (White) | 59.99 | 26 | 3.5 | 3.54 | 1.39 | 34 | 1614 | 208.08 | 304.45 |
| 46 | B081X63K3B | Air Quality Monitor Indoor, Accurate Air Tester Detector(3000mAh) for HCHO, CO2, TVOC, PM2.5, PM10, Home Air Test Kits with Colorful LCD Screen, Suitable for Home Office and Various Occasions | 95.99 | 19 | 4 | 3.53 | 1.43 | 27 | 137 | 63.58 | 33.76 |
| 47 | B082HCWND5 | Air Quality Tester, Detector, Multi-Functional HCHO, PM2.5, PM10, TVOC Monitor, Suitable for Indoor, Outdoor, Vehicle and Other Environmental Air Detection by FUELUS | 49.98 | 7 | 3 | 2.57 | 1.72 | 39 | 212 | 89.43 | 63.8 |
| 48 | B082HH9SXY | SEAN Air Quality Monitor Indoor for TVOC, HCHO, CO2, PM2.5, PM10 Portable Air Quality Meters Tester Detector Sensor Real Time Data & Mean Value Recording for Home Office Outdoor | 49.99 | 7 | 4 | 4 | 1.53 | 26 | 109 | 52.43 | 27.89 |
| 49 | B082ZF4H37 | Awair Element Indoor Air Quality Monitor measuring CO2, TVOC, PM2.5 | 149 | 40 | 4.5 | 3.5 | 1.77 | 27 | 507 | 99.92 | 87.66 |
| 50 | B0832MW62L | Handheld Air Quality Monitor, High Accuracy Air Quality Tester for HCHO, TVOC CO2, PM2.5, PM10 Monitoring, HD Data Real-time and Mean Value Display, Fits Home Office | NA | 9 | 3.5 | 3.78 | 1.64 | 29 | 230 | 68.67 | 62.8 |
| 51 | B0834T7JBY | QekTech Air Quality Monitor, Professional Humidity, Temperature, TVOC, and HCHO Pollution Tester for Home, Indoor and Outdoor awair Test kit Meter; Supports PM2.5, PM1.0, PM10 | 99.99 | 5 | 4 | 4.2 | 1.1 | 28 | 110 | 62.2 | 37.9 |
| 52 | B083HFRC3N | Air Quality Monitor Sherry Indoor Air Quality Monitor for CO2, HCHO, TVOC PM2.5, PM10 -Accurate Air Quality Monitor Indoor Radar Detectors | 109 | 16 | 4 | 4.38 | 1.36 | 26 | 251 | 74.25 | 58.25 |
| 53 | B083J1RC56 | Air Quality Monitor, Seesii Multifunctional Indoor Pollution Detector Meter for HCHO, PM2.5, PM1.0, PM10, TVOC, Temperature and Humidity AQI Test, Real Time Air Tester | 72.9 | 7 | 4 | 4 | 1.15 | 48 | 163 | 98.43 | 54.03 |
| 54 | B083LKSG1X | Multifunctional Air Quality Tester, Sherry Air Quality Monitor, Indoor Formaldehyde Detector Air Quality Monitor Indoor for TVOC, PM2.5, PM10 | 109 | 15 | 4 | 3.93 | 1.83 | 28 | 279 | 93.13 | 74.68 |
| 55 | B084JCXZ12 | Guard Dog Security Air Quality Monitor—TVOC, PM1.0, PM2.5. PM10, Temperature & Humidity—Rechargeable Battery | 112.99 | 2 | 3.5 | 2.5 | 2.12 | 66 | 100 | 83 | 24.04 |
| 56 | B084N7ZRMJ | Air Quality Monitor BIAOLING Accurate Tester for CO2, HCHO, TVOC PM2.5, PM10 Multifunctional Air Gas Detector Real Time Data & Mean Value Recording for Home Office and Various Occasion | 79.99 | 111 | 4 | 4.03 | 1.43 | 26 | 364 | 93.9 | 67.79 |
| 57 | B084X9KTJN | BREATHE|Smart 2 Personal Air Quality Monitor, Instantly Measures Air Quality Levels. Monitors Dust, Smoke, PM2.5 Air Pollution—Reduce Your Exposure to Toxic Air | 139 | 55 | 4 | 4.38 | 0.99 | 27 | 752 | 215.38 | 164.5 |
| 58 | B085C45TX9 | Temtop M2000 2nd Generation PM2.5, PM10, CO2, HCHO Air Quality Monitor Data Export Settable Audio Alarm Recording Curve Easy Calibration Temperature Humidity | 215.99 | 4 | 5 | 5 | 0 | 40 | 198 | 112.25 | 71.14 |
| 59 | B085C4KRH4 | Temtop M2000 2nd Generation Air Quality Monitor for PM2.5, PM10, CO2, HCHO Temperature, Humidity Settable Audio Alarm Data Export Recording Curve Easy Calibration | 215.99 | 41 | 4.5 | 3.8 | 1.52 | 26 | 440 | 110.71 | 75.63 |
| 60 | B085N5VZXB | seeed studio Air Quality Monitor Indoor, Air Quality Testor, HCHO, Detector Real-Time Air Tracking for TVOC, PM2.5, PM10, Air Quality Detector for Home/Office/Car (White) | 69 | 15 | 4 | 3.47 | 1.46 | 26 | 862 | 133.13 | 211.37 |
| 61 | B087N55K5H | Stellate Indoor Air Quality Monitor Detector Sensor HCHO, TVOC, PM2.5, AQI Index Pollution Temperature Humidity Portable for Home Office (AQ200-Stylish) | 85.49 | 50 | 4 | 3.84 | 1.38 | 26 | 433 | 100.86 | 85.47 |
| 62 | B087R7C88T | Air Quality Monitor Indoor, Accurate Air Tester Detector for HCHO, CO2, TVOC, PM2.5, PM10, Temperature, Humidity Monitor Analysis Tester Gas Detector Analyzer Measuring Tool Smog Meter | 95 | 2 | 4 | 3 | 1.41 | 112 | 157 | 134.5 | 31.82 |
| 63 | B088WBCDXS | Air Quality Monitor Accurate Tester for CO2, HCHO, TVOCI, AQI Multifunctional Air Gas Detector Real Time Data & Mean Value Recording for Home Office and Various Occasion | 69.99 | 44 | 4 | 3.57 | 1.59 | 27 | 883 | 103.07 | 157 |
| 64 | B088WT6YD1 | CO2 Detector Infrared Sensor LCD Display PPM Meters Indoor Gas Air Quality Monitor Analyzer Data Logger USB/Battery Power (External Non-Conductive Data) | 129.99 | 3 | 4.5 | 4.33 | 0.58 | 27 | 1190 | 503.33 | 609.36 |
| 65 | B088ZTJDB9 | Air Quality Monitor-Accurate Tester for HCHO, TVOC, CO2, CO Multifunctional Air Gas Detector Real Time Data & Mean Value Recording for Home Office and Various Occasion (White) | 54.7 | 11 | 3.5 | 2.64 | 1.75 | 27 | 190 | 65.36 | 50.9 |
| 66 | B08BCRR7N9 | Air Quality Monitor TVOC, HCHO Detector. PM2.5, PM1.0, PM10 Pollution Meter for Home Office School Restaurants and Hospitals | 79 | 3 | 3.5 | 3.33 | 1.53 | 83 | 429 | 207.33 | 192.44 |
| 67 | B08CN7FSCG | BRWISSEN A16 Air Quality Monitor Indoor Pollution Tester Data Record for PM1.0, PM2.5, PM10 Particulate Matter Fine Dust Meter, TVOC, HCHO Analyzer Detector | 175.99 | 3 | 4 | 5 | 0 | 80 | 219 | 127.67 | 79.12 |
| 68 | B08CZL1RQ4 | AOUSTHOP Indoor Air Quality Sensor, Air Quality Monitor, CO2, HCHO, TVOC PM2.5, PM10 Multifunctional Gas Detector, Accurate Tester Kit for Home Office, Real Time Data Mean Value Recording | 43.99 | 6 | 4 | 3.33 | 1.97 | 32 | 436 | 133.33 | 151.22 |
| 69 | B08DKTNTHS | Air Quality Monitor, Accurate Air Tester Detector for HCHO, CO2,TVOC, PM2.5, PM10 with Colorful LCD, Portable Air Gas Detector Sensor Real Time Data & Mean Value Recording for Indoor Home Car | 79.99 | 2 | 3 | 2 | 0 | 79 | 281 | 180 | 142.84 |
| 70 | B08DLL3WFN | Tusingger Air Quality Monitor Accurate Tester for CO2, HCHO, TVOC PM2.5, PM10 Multifunctional Air Gas Detector Real Time Data & Mean Value Recording for Home and Various Occasion | 53.99 | 8 | 4.5 | 4.75 | 0.46 | 85 | 360 | 204.12 | 101.06 |
| 71 | B08DRHKYSR | Air Quality Monitor Yvelines Air Quality Tester for CO2, HCHO, TVOC, PM2.5, PM10 Multifunctional Air Gas Detector Real Time Data & Mean Value Recording for Home Office and Various Occasion | 97.99 | 53 | 4 | 4.06 | 1.59 | 28 | 479 | 86.83 | 71.65 |
| 72 | B08F9W3XRF | Air Quality Monitor, Elifecity Indoor Tester for HCHO, TVOC, PM2.5, PM10 Humidity and Temperature Meter Multifunctional Air Gas Detector for Home Office School and Car | 69.99 | 4 | 4.5 | 4.5 | 0.58 | 33 | 95 | 55 | 27.8 |
| 73 | B08FDTD3CR | Air Quality Monitor HCHO, TVOC, AQI, CO, CO2 5-in-1 Multifunctional Detector Monitor Outdoor and Indoor for Home Office Baby Room Various Occasion, White Air Quality Test | 49.99 | 3 | 4.5 | 4.33 | 0.58 | 28 | 54 | 37.67 | 14.22 |
| 74 | B08FHYHFTN | Air Quality Monitor Accurate Tester for PM2.5, PM10, PM1.0, Temperature and Humidity, Rechargeable Electrochemical Air Gas Sensor Detector Real Time Data & Mean Value Recording for Home Office Indoor Outdoor | 59.49 | 3 | 3.5 | 2.33 | 2.31 | 38 | 200 | 112.33 | 81.82 |
| 75 | B08FXSWHVG | Davis Instruments AirLink Professional Air Quality Sensor measuring PM1, PM2.5, PM10 | 178.99 | 6 | 4 | 3.83 | 1.83 | 29 | 513 | 138.33 | 188.57 |
| 76 | B08FZV3M3P | WiFi Air Quality Monitor Indoor CO2 Detector Gas Pollution Real Time Tester for PM2.5, HCHO, TVOC, Temperature and Humidity, Colorful LCD Screen, Rechargeable Battery | 99.98 | 14 | 3 | 2.93 | 1.69 | 35 | 178 | 86.86 | 49.73 |
| 77 | B08GLV1YP7 | ATPRO Indoor Air Quality Monitor, HCHO Formaldehyde Detector, Temperature & Humidity, Pollution Tester & Sensor, Measure TVOC, PM1.0, PM2.5, PM10 | 98.95 | 8 | 4.5 | 4.62 | 1.06 | 59 | 305 | 157.12 | 84.45 |
| 78 | B08J2Y7HL6 | Air Quality Monitor, HCHO Detector, Pollution Meter, Sensor, Tester; Detect & Test Indoor Pollution, VOC, PM1, PM2.5, Air Quality Monitor | 75.99 | 9 | 4 | 3.78 | 1.56 | 42 | 215 | 97.11 | 53.82 |
| 79 | B08J3KL7TJ | Air Quality Monitor Indoor, Air Quality Tester for HCHO, PM2.5, PM10, Temperature, Humidity, Colorful LCD Screen with ECO Features, Suitable for Home Office and Various Occasion (White) | 99.99 | 3 | 3.5 | 4.67 | 0.58 | 100 | 510 | 252.67 | 224.15 |
| 80 | B08JM4BR8J | Air Quality Monitor, HeiYi Indoor Air Quality Pollution Detector for HCHO, TVOC, PM2.5, PM1.0, PM10, Temperature, Humidity Data Monitoring, Meter 24-Hour Real-Time Recording | 79.99 | 16 | 4 | 4.31 | 1.01 | 39 | 2260 | 243.5 | 541.16 |
| 81 | B08JXD3JZT | Air Quality Monitor YVELINES Air Quality Tester for CO2, HCHO, TVOC, PM2.5, PM10 Multifunctional Air Gas Detector Real Time Data & Mean Value Recording for Home Office and Various Occasion | 114.99 | 16 | 4.5 | 3.69 | 1.78 | 28 | 173 | 69.56 | 46.67 |
| 82 | B08K8VS5GY | VIVOSUN Air Quality Monitor Indoor Pollution Detector HCHO Tester, TVOC and PM2.5, PM10, PM1.0 temperature and humidity Sensor Function | 79.9 | 12 | 4.5 | 4.67 | 0.65 | 29 | 304 | 85.92 | 75.34 |
| 83 | B08KSX9WG3 | Hofun Air Quality Monitor—Professional Air Quality Detector, 5 in 1 Indoor Air Pollution Tester with AQI, PM2.5, PM10, HCHO, TVOC, Air Particulate Meter for Home, Car, Office, Hotel | 98.01 | 7 | 3.5 | 3.57 | 1.51 | 29 | 320 | 125.29 | 105.55 |
| 84 | B08L18M9Z6 | Air Quality Monitor, HCHO Detector, Temperature & Humidity Meter, Pollution Tester, Sensor; Detect PM2.5, PM10, PM1.0, Test Indoor TVOC | 99.99 | 2 | 3 | 4 | 1.41 | 43 | 137 | 90 | 66.47 |
| 85 | B08L2ZFTQ6 | Air Quality Monitor, Accurate Tester for HCHO, TVOC, PM2.5, PM1.0, PM10, Temperature and Humidity for Home, Office and Various Occasion | 69.99 | 3 | 4 | 4.33 | 0.58 | 42 | 110 | 72.33 | 34.59 |
| 86 | B08L96TX6Z | Air Quality Monitor, HCHO Detector, Temperature & Humidity Meter, Pollution Tester, Sensor; Detect PM2.5, PM10, PM1.0 Test Indoor TVOC | 95.99 | 3 | 4 | 3.33 | 2.08 | 31 | 86 | 56.33 | 27.75 |
| 87 | B08LL96J6Q | Air Quality Monitor, HeiYi PM2.5 Air Quality Tester Highly Accurate Real Time Monitoring Smart Air Quality Detector Indoor Outdoor LCD Display | 69.99 | 3 | 3.5 | 3.67 | 2.31 | 37 | 73 | 57 | 18.33 |
| 88 | B08M5S11TG | Air Quality Monitor, SeeSii Indoor Air Quality Pollution Detector for HCHO, TVOC, PM2.5, PM1.0, PM10, Temperature, Humidity Data Monitoring, Real-Time Recording for Home Office Classroom | 62.9 | 2 | 3.5 | 3 | 2.83 | 85 | 209 | 147 | 87.68 |
| 89 | B08MVK38G8 | Air Quality Monitor, Seesii 8-in-1 Multifunctional Air Quality Tester for HCHO, TVOC, CO2, PM2.5, PM10, AQI, Temperature Humidity, Indoor Outdoor Air Gas Detector for Home/Office/Car and Various Occasion | 85.99 | 2 | 5 | 3 | 2.83 | 63 | 64 | 63.5 | 0.71 |
| 90 | B08MY3J85D | Air Quality Monitor, HCHO Detector, Indoor Pollution Meter, Tester, Sensor, Temperature and Humidity, Multifunctional Air Detector PM2.5, PM10, HCHO, TVOC Real-Time | 99.99 | 7 | 4.5 | 4.43 | 0.98 | 30 | 172 | 103.14 | 48.78 |
| 91 | B08P3QCHNS | Air Quality Monitor, Handife Air Quality Tester for PM2.5, Temperature (−10~50 °C) and Humidity (0%~99% RH) Monitor Highly Accurate Smart Portable Air Quality Detector Indoor Outdoor LCD Display | 45.99 | 5 | 3.5 | 4.6 | 0.89 | 32 | 96 | 48.8 | 26.66 |
| 92 | B08P4QN2NN | HYVQDNM Air Quality Monitor Indoor for CO2, CO, HCHO, TVOC PM2.5, PM10 Multifunction Air Quality Detector Real Time Data & Mean Value Recording Air Gas Detector for Home Office Car School etc | 102.99 | 3 | 5 | 5 | 0 | 29 | 164 | 77.67 | 74.97 |
| 93 | B08PYTRRY2 | Air Quality Monitor PM2.5, PM10, PM1.0 Tester, HCHO, TVOC, temperature, humidity Detector, Air Quality Tester | 79.99 | 6 | 5 | 5 | 0 | 32 | 128 | 74.33 | 40.55 |
| 94 | B08Q3RJBLR | Air Quality Monitor Indoor & Outdoor for PM2.5 Particulate Matter, BAIVON Air Quality Tester Pollution Detector Meter for Home Office Car Travel Use Etc | 79.99 | 8 | 5 | 4.5 | 1.41 | 46 | 134 | 89.12 | 33.7 |
Table 2.
The prevalence, word clouds, high probability key words, and representative excerpts from customer reviews for each topic.
Table 2.
The prevalence, word clouds, high probability key words, and representative excerpts from customer reviews for each topic.
| Topic | Topic (Prevalence) | Topics Based on FREX | Representative Excerpts | |
|---|---|---|---|---|
| 1 | Wildfire Smoke | 0.176 | fire, filter, purifi, california, insid, season, open | “Bought this to see how our air filters were working against the wildfire smoke. The image on the left is in front of a high quality HEPA filter and the image on the right is after two minutes outside in the smoky air. Good news is our filters work, but the bad news is how awful the smoke is. I would say this is very accurate and helpful for determining what works in our home and what does not (air quality wise anyway).” “With the recent wildfires in California I could not rely on my instinct about air qualities. What I needed was a good estimate of the air quality in my city and my house so I can at least know whether it is a good idea to open the window or not. This little machine does just what I need. It tells me to open up the window for better air or it is better to shut closed. It does connect to your phone and the app is easy to follow. I assume that the app is operated in several languages since mine started with Korean in the beginning.” |
| 2 | Detecting sources of concern | 0.168 | compound, paint, odor, furniture, substance, organic, detector | “This device may be useful for some things, but the description exaggerates its capabilities. The description claims that the device can measure TVOC which is an abbreviation for “total volatile organic compounds.” However, I did a number of tests and while it is clear that it detects some VOCs, it does not detect others (for example, the VOCs released by some glues). 2) The Formaldehyde (labelled HCHO on the device) detector is not useful for detecting the real amount of formaldehyde. While it may be triggered by formaldehyde, it also detects many other common VOCs that are not formaldehyde. For example, it seems to be triggered by isopropyl alcohol (a disinfectant commonly used in first aid and medical applications).” “Just bought new furniture and want to make sure there was no harmful gases off them. This unit is easy to use, but make sure to wait 1 hr for the results to reach equilibrium. Results look pretty accurate.” |
| 3 | IOT issues | 0.159 | app, wifi, network, email, android, iphone | “Potentially great product ruined by bad software, onboarding. I am a Cisco Certified Network Professional with decades of network and IT experience. I also develop IOT in my spare time, and have tons of home automation experience. When I say this thing is a failure, I am not joking. The fundamental flaw is trying to “Magically” “Make Easy” the addition of IOT devices like this. They TRY to leverage your existing WiFi account information. “ “It does what it should and, in my opinion, very well. However, there is a star deduction because I could not set up the device with an Android mobile phone because the app had constantly lost the connection to the device. When I tried the setup with an iPhone, it worked immediately and without any problems.” |
| 4 | Ease of use | 0.135 | color, quiet, instructions, easy, operate, simple | “For me, it is a good device to get an overview of pollutants or loads. However, I am not very sure about the accuracy of the data really. Unfortunately, the device does not have a meaningful operating manual and so it is really not easy to use. Assessing or evaluating the data is then also difficult. You have to try out a lot, read on and then derive the data yourself, whether it is precise or at all meaningful. All in all a bit difficult and for me not necessarily the point.” “It is easy to use. I bought it to check the air quantity of my new house. I once felt difficult to understand the terms, but this product is easy to use. The handbook is also easy to understand. Generally, it is easy to handle.” |
| 5 | Managing health | 0.131 | allergies, cough, husband, wood, exhaust, vent | “Grandma often has bad lungs and coughs easily. She took a lot of medicine, she had a lot of treatment, but nothing worked very well. It was probably because she was old and had seen it by chance. I think my grandmother needs it. For the old people, the surrounding environment cannot be ignored, so I decided to buy it, the results of its display shocked us, originally with our life can not live without so many harmful factors in the air, we are glad to choose it.” “This device saved my dads life! So for the past year or so my dad have been feeling not so good. Soar through dizzy nauseous. Well during the COVID lock down it got 10 times worse. He spent thousands of dollars on air cleaners trying to remove dust as he thought he had allergies. When nothing worked we thought it might be VOC’s from some flooring we did last year. Once we hooked the device up it immediately indicated CO2 levels were at almost 1900 parts per million anyting over 1000 parts per million can make you sick. We traced it back to an improperly burning gas fireplace. He was suffering for CO2 poisoning. Once we shut the gas off to the fire place the part per million dropped to just over 700. I strongly recommend this device.” |
| 6 | Battery Life | 0.119 | batteries, recharging, configure, usb, charger | “When I use the provided USB cable, with a 2.0 amp USB charger, a lightning bolt shows up on the battery indicator for a half second; it then disappears. Using a different USB cable and charger, the lightning bolt appears, flashes regularly, and the battery indicator appears to be filling up (one bar, two bars, 3 bars, etc.).” “Worked well enough, until it spontaneously died after 6 months of use. Now it will not even turn on. Next time I will buy a more reliable product.” |
| 7 | Evaluating accuracy | 0.112 | inaccuracies, consistency, comparison, accuracies, count, epa, standard | “I have changed my rating from 1 star to 2 stars. I have determined that for the unit I have the PM2.5 readings are reasonably accurate. However, the inaccurate PM10 readings (as discussed below) are a major deficiency. This is one of those occasions when I wonder how the product gets such good ratings. The PM10 reading is always approximately 1.4 times the PM2.5 reading (as also noted by another reviewer). It varies from the 1.4 ratio very little. The readings I get (outdoors) with this meter are reasonably close to the local air quality values for PM2.5 but are WAY TOO LOW for PM10.” “The unit is simple and appealing, and allows you to adjust gain and bias (slope and intercept of the calibration, notably for the PM2.5 particle counter, which is why I bought the unit.) Near me there are a number of PurpleAir airborne particle monitors, which agree with one another, each has a dual laser for accuracy, and they agree approximately with the one EPA monitor a few miles away. But I can not get my unit to match those readings; it reads too low even if I set the gain (percent) to its max of 30%.” |
Publisher’s Note: MDPI stays neutral with regard to jurisdictional claims in published maps and institutional affiliations. |
© 2022 by the author. Licensee MDPI, Basel, Switzerland. This article is an open access article distributed under the terms and conditions of the Creative Commons Attribution (CC BY) license (https://creativecommons.org/licenses/by/4.0/).
Share and Cite
MDPI and ACS Style
deSouza, P.N. Key Concerns and Drivers of Low-Cost Air Quality Sensor Use. Sustainability 2022, 14, 584. https://doi.org/10.3390/su14010584
AMA Style
deSouza PN. Key Concerns and Drivers of Low-Cost Air Quality Sensor Use. Sustainability. 2022; 14(1):584. https://doi.org/10.3390/su14010584
Chicago/Turabian StyledeSouza, Priyanka Nadia. 2022. "Key Concerns and Drivers of Low-Cost Air Quality Sensor Use" Sustainability 14, no. 1: 584. https://doi.org/10.3390/su14010584
Note that from the first issue of 2016, this journal uses article numbers instead of page numbers. See further details here.