
Infrastructure Service Assessment Model Based on a Service Quality Gap Model—Focused on South Korea

Department of Architectural Engineering, Kwangwoon University, Seoul 01897, Korea
Sustainability 2022, 14(1), 577; https://doi.org/10.3390/su14010577
Submission received: 15 October 2021
/
Revised: 13 December 2021
/
Accepted: 29 December 2021
/
Published: 5 January 2022
(This article belongs to the Special Issue Sustainability and Territorial Project Assessment)
Abstract
:To improve the quality of life (QOL) of the citizen, it is essential to not only to secure a quantitative stock, such as the number or extension of individual infrastructure, but to also understand the perspective of the public on service levels and the demand for infrastructure. In this study, an infrastructure service level assessment model that reflects the demands of citizens is proposed, and the importance and adequacy of infrastructure service indexes for setting priorities and goals for the investment of government funds in infrastructure are verified. The evaluation items used in this model included usability, accessibility, and recovery speed. The infrastructure service level for 12,500 Korean citizens was surveyed using the proposed assessment model, and the results reveal that the satisfaction of citizens with their residences had a significant effect on the QOL improvement, and that the level of infrastructure performance in a residential area significantly affected the satisfaction of citizens with their residences. In addition, the results revealed that the quantitative and qualitative aspects of infrastructure should be simultaneously considered. Lastly, the possible application of this model for the evaluation of the effectiveness of investment for infrastructure improvement is proposed.
1. Introduction
In the USA, infrastructure is defined as the backbone of America (ASCE), whereas it is defined as the economic backbone in the UK [1]. Infrastructure is a societal component that plays a pivotal role in enabling the economic activities of cities and creating an absolute impact on the convenience and safety of citizens, and has been regarded as the basic framework of an urban environment.
According to the World Economic Forum (WEF) [2], the correlations between infrastructure and the global competitiveness index and gross national income (GNI) of major nations in 2018 are 0.98 and 0.90, respectively, indicating the close relationship between national competitiveness and the fulfillment level of infrastructure requirements. In addition, as infrastructure has been included as an assessment parameter in the assessment of the quality of life (QOL) of all citizens, the QOL of citizens is significantly affected by infrastructure development level.
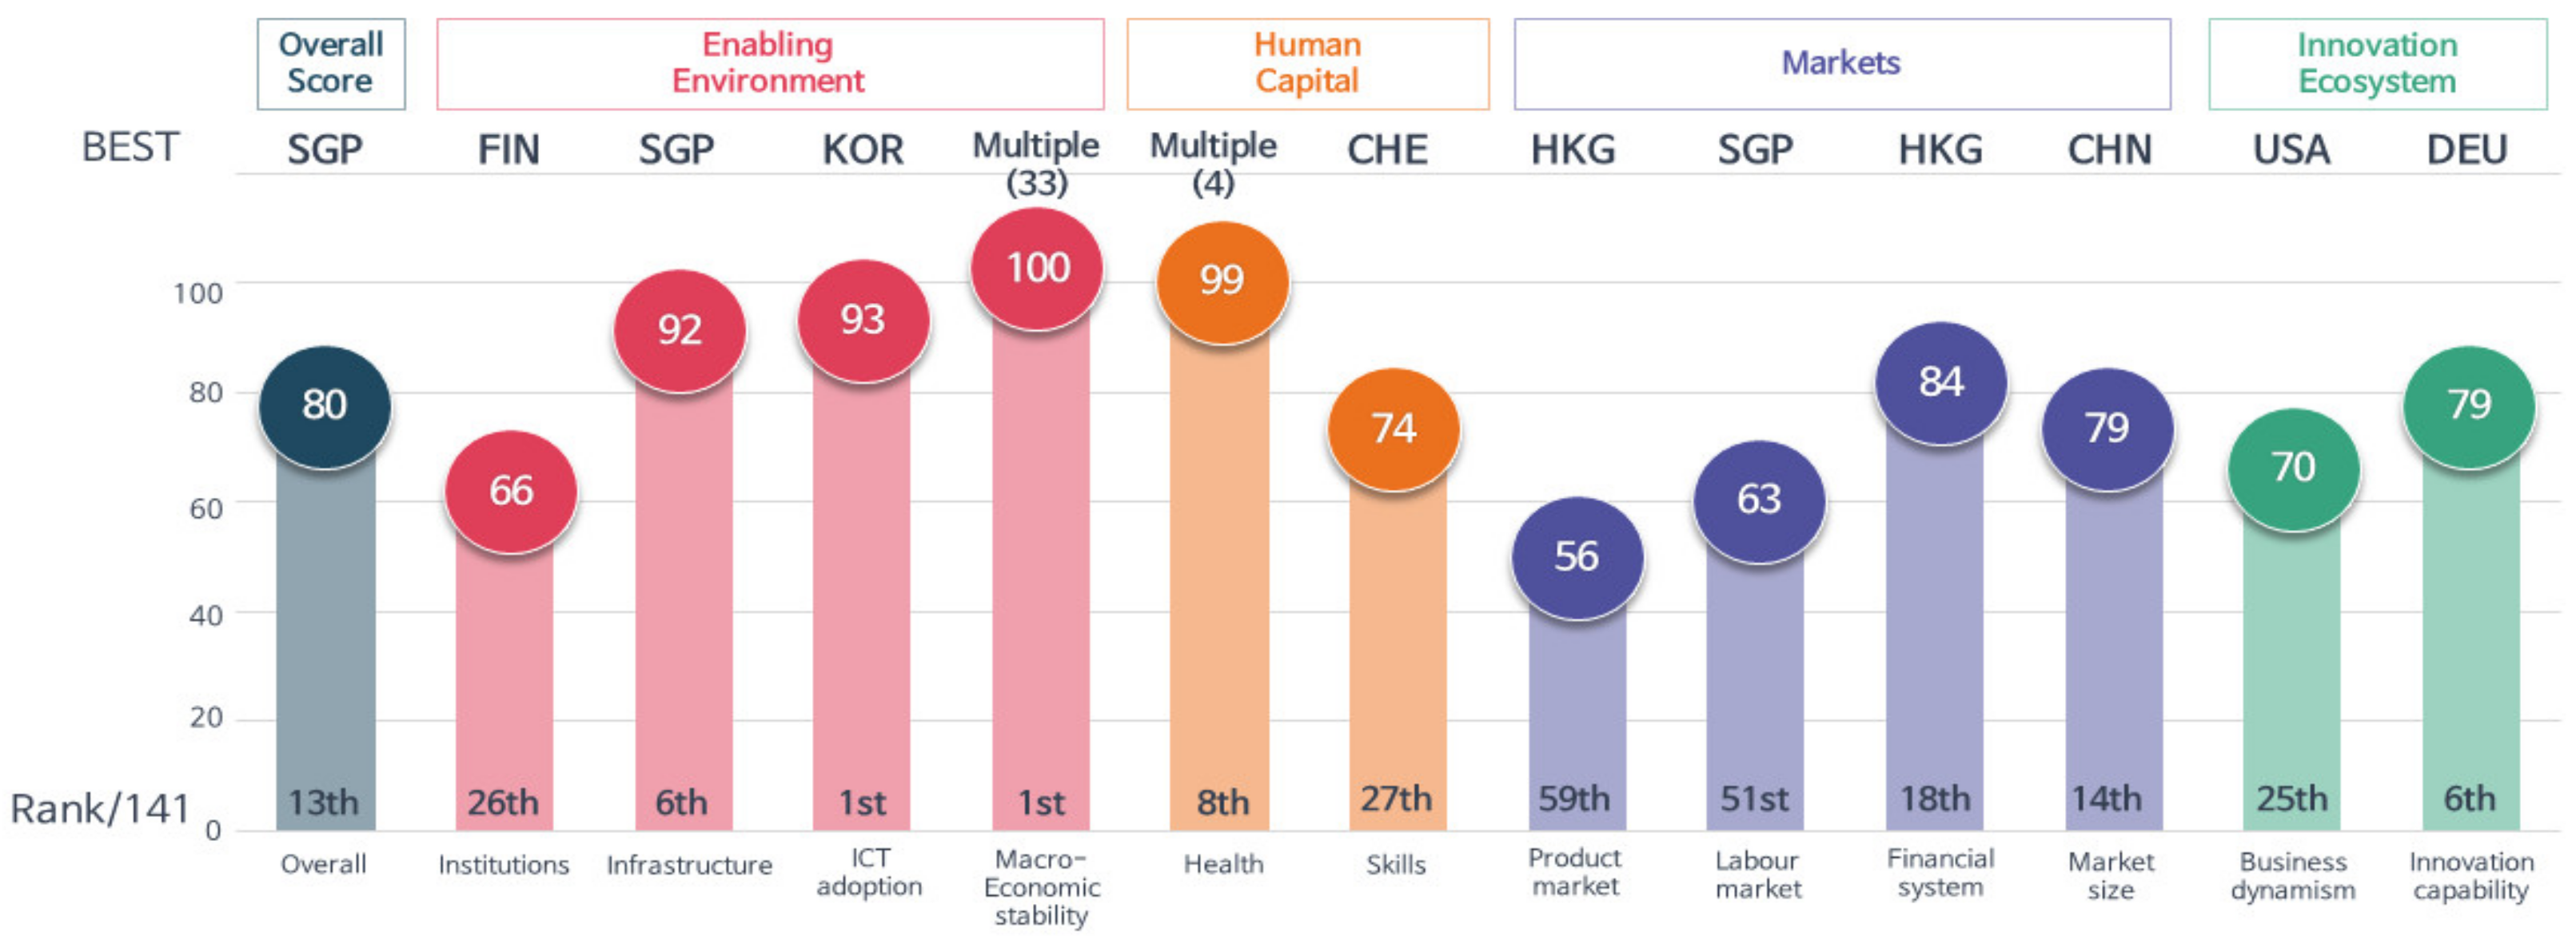
South Korea possesses relatively high infrastructure stocks, and was ranked sixth in the world in 2019 (See, Figure 1). Owing to the fact that the level of infrastructural development in Korea is higher than the GNI, the Korean government has proposed a reduction in the budget for the social overhead cost (SOC).
However, among the two sub-categories of the infrastructure sectors, the country rank was increased by transportation (ranked fifth), while another utility item, which is related to electricity and water resource infrastructure, was ranked 22nd. Particularly, the exposure to unsafe drinking water in relation to the water resource infrastructure and the reliability of the water supply of the country were ranked 26th and 28th, respectively, and the road and airport connectivity in the sub-categories of transportation were ranked 26th and 16th, respectively, indicating the relatively poor infrastructure of the service sectors of Korea. In addition, the assessment of the satisfaction degree of the citizens with the infrastructure of the country in their daily lives, which differs from the quantitative stocks, revealed that the degree of satisfaction of the citizens was lower than the expected level [3,4].
Policies proposed by the Korean government regarding the development of national infrastructure have largely focused on strengthening national and industrial competencies to promote economic growth and improve international competitiveness. Accordingly, supplier-oriented quantitative goals have been set and achieved by policymakers. However, with an increase in the GNI, improvement in the QOL of citizens has attracted increased attention, thus increasing the interest of citizens in the performance of infrastructure. Therefore, it is essential to not only secure the quantitative stocks, such as the number of individual elements and extensions, but also extensively manage infrastructure based on the determination of the service level and services required by citizens.
However, existing evaluation system for the assessment of the quality of life and urban competitiveness of people only focuses on some infrastructure related to evaluation institutions. Moreover, the evaluation of these factors from the perspective of the consumers has focused on consumer satisfaction. Consequently, although the current satisfaction level of the residents can be grasped, their demands are yet to be fully understood.
Recently, infrastructure projects, with a total cost of KRW 24 trillion [5], have been exempted from a preliminary feasibility study by the Ministry of Economy and Finance in Korea, and “the Second Korean New Deal Strategy Meeting” in October 2020 announced that it will proceed with the “regional balance new deal project,” which invests KRW 75 trillion out of a total project cost of KRW 160 trillion in regional projects. In addition, it announced that it will push forward new deal projects led by 136 local governments and public agencies [6]. In response to this news, experts have expressed concerns about the possible waste of the precious money of taxpayers, and have requested that the validity of this policy be strictly analyzed to prevent the execution of too many projects by local governments [7].
Therefore, in this study, infrastructure service indexes that reflect the public demand are proposed based on prior research on infrastructure quality of life evaluation, operational cases of infrastructure service assessment systems in advanced nations, and the infrastructure construction goals and guidelines established by the government and public institutions for each infrastructure sector. In addition, the importance and adequacy of the proposed evaluation model were verified by investigating and analyzing the infrastructure service level for Korea.
To achieve the research purpose, this study was conducted as follows. (1) First, the importance of improving infrastructure performance to improve the QOL was verified by reviewing literature on QOL and infrastructure service assessment models, and the direction of the infrastructure service assessment model that reflects the needs of residents was suggested (Section 2). (2) Second, a measurement item and scale that can assess the extent to which the infrastructure service level meets the needs of residents are proposed (Section 3). (3) Third, the perceived infrastructure service level of 125,000 citizens is surveyed (Section 4). (4) Forth, the relationship among the infrastructure performance of a residence, life satisfaction, and residence satisfaction; the relationship between the residence satisfaction and their satisfaction with the infrastructure performance; and the relationship between the residence satisfaction and their satisfaction with the infrastructure sectors, are analyzed to validate the adequacy of the proposed model. In addition, the infrastructure service levels of each sector and the infrastructure service level of each sector based on region are compared and analyzed to validate the importance and adequacy of the proposed model (Section 5). (5) Lastly, the possible application of this model for policy application and future research are suggested (Section 6).
The relevance of this study is established in the fact that it quantifies the level of infrastructure service experienced by citizens and verifies the importance of evaluating not only the existing quantitative stocks but also the needs of residents who are users of infrastructure to establish infrastructure investment policies.
2. Literature Review
2.1. Infrastructure Assessment Model Based on Country
Infrastructure is regarded as the basic framework of an urban environment that not only plays a pivotal role in enabling urban economic activities but also has an absolute impact on the convenience and safety of the lives of citizens. In addition, infrastructure can be classified based on industries, such as roads, ports, railways, power plants, and communication facilities, and living amenities, such as schools, hospitals, and water and sewage treatment plants (Table 1).
As shown in Table 2 [9], in other countries, rather than individual agencies, the infrastructure policy and evaluation systems are operated by a separate organization (known as the control tower) that can perceive infrastructure from an integrated perspective. In addition, experts have conducted qualitative evaluations based on various pieces of data related to infrastructure.
USA: The US federal government established the National Council on Public Works Improvement (NCPWI), which publishes infrastructure evaluation report cards to ensure the reasonable and efficient allocation of their budget. After the abolition of the NCPWI in 1988, the publication of the infrastructure evaluation report card has been handled by the American Society of Civil Engineers (ASCE). Subsequently, ASCE established a committee consisting of approximately 20 experts to prepare and publish the infrastructure evaluation report.
UK: In the UK, the publication of the infrastructure evaluation report is aimed at encouraging debate on policies on infrastructure and attract attention to the actions required to improve the infrastructure and supplied services of the UK. This report presents a proposal for improving the grade of each facility group and focuses on the long-term vision, strategy, and direction that national and local government organizations must adopt. The evaluation methodology of the report is based on qualitative evaluation, which is similar to those of the USA and Australia, and the report contains qualitatively evaluated collected data, which are dispersed. However, details of the evaluation methods are unknown.
Canadian: In recent years, Canada has provided rational grounds for its drastic increase in the investment of the government in water and sewage systems, rainwater systems, and roads managed by local governments. This not only satisfies the right of the public to know the efforts of the government by objectively revealing the current infrastructure status to the public as much as possible but also provides a consensus for infrastructure-related policymaking. The Canadian infrastructure evaluation report was first published by the Canadian Infrastructure Report Card Project Steering Committee in 2012. The Report Card Advisory Board (RCAB) participated in the project execution process and provided feedback on the data analysis and results. In addition, the RCAB maximizes its credibility and neutrality by ensuring that industries, universities, research institutes, and government agencies equally participate in the RCAB.
Australia: The infrastructure report card 2010 Australia was published by the Institution of Engineers Australia, which is a group of engineering experts in Australia. This report provided the direction of infrastructure development and maintenance operations at the national level to meet global trends and social issues. In addition, it provided strategies that should be adopted by the central, state, and regional governments, as well as tactics that should be employed by infrastructure owners or at the managerial level. After the publication of the Infrastructure Report Card 2005 Australia, the Infrastructure Australia Act 2008, which was enacted in 2008, provided a foundation for establishing Infrastructure Australia, which was a national institution that established a strategy and plan for infrastructure development in Australia.
2.2. Assessment of the Quality of Life (QOL) and City Competitiveness
The assessment of the results of evaluation systems used to determine the QOL of citizens or urban competitiveness revealed that all evaluation systems contain the assessment elements of infrastructure, indicating that the infrastructure level affects the improvements of the QOL of citizens and urban competitiveness. However, the further application of existing evaluation systems has been limited by their inability to identify the demand of national or regional residents, owing to the focus of most of these systems on the satisfaction level from the perspective of the consumer, and the fact that these systems only focus on a part of the infrastructure, or that only a one-off survey is conducted. Existing evaluation indexes are briefly described below.
Seoul Survey (SEOUL) [3]: The Urban Policy Index of the Seoul Survey is used as foundational data to operate the city and establish policies after identifying the overall aspects of the social lives of citizens (e.g., QOL perceived by Seoul citizens, hierarchical structure, citizenship, social trust, community consciousness, and major living patterns), and to predict and prepare for the future of Seoul.
Indicators of QOL (KOSTAT) [10]: The ultimate goals of this are to measure the status of detailed living categories that consist of QOL as the main index, through which the actual situation of Korean QOL is objectively presented, and to provide the foundational data required to establish and execute policies to improve Korean QOL. Subsequently, the results are employed as foundational data to identify the strengths and vulnerabilities of Korean society and to determine tasks that should be solved for each category, as well as to provide measures for improving the tasks for the enhancement of quality of life.
Evaluation of urban sustainability and living infrastructure (MOLIT) [11]: This is an evaluation index of urban sustainability and living infrastructure, and it was proposed to promote a close relationship between central and local government plans (e.g., urban plans) through the uniform evaluation of local governments at the national level, and to present a direction for regional development through local government-customized diagnosis evaluations.
The Global livability index [12]: This is a survey conducted annually by the Economist Intelligence Unit (EIU). The survey ranks cities based on how livable they are by evaluating the living conditions of each city to be used as foundational data to calculate the allowances for dispatching expatriates to overseas cities.
Quality of living survey [13]: This involves the use of the Mercer Human Resource Consulting (MHRC) survey as foundational data for the calculation of the dispatch allowance for overseas expatriates. MHRC is a multi-national consulting company that provides clear criteria for the determination of the hardship allowance paid to employees dispatched overseas, as overseas corporates and expatriates frequently enter and exit different countries. This survey focuses on the QOL perceived by overseas expatriates, according to the purpose of the survey.
Global competitiveness report [2]: This is a ranking report published by WEF on the global competitiveness of 141 nations (as of 2018) based on the statistics of various international organizations and opinion polls with industry leaders.
The limitations of the existing indices discussed above are shown in Table 3 below.
There are two major indices used to evaluate Korean QOL. One is the Korean QOL Index, which is updated quarterly using the national statistical indicators from Statistics Korea, and the other is the Seoul Survey Urban Policy Index, which is published annually using survey results and statistical indicators as foundational data and used to establish urban policies in Seoul. In addition, there are several surveys conducted by local governments on the living and consciousness of the residents in their local region, but they are not conducted regularly.
The indexes used to evaluate Korean QOL include infrastructure-related items, but they focus only on a part of the infrastructure. Furthermore, these indexes consist of quantitative indicators, such as the penetration rate, area, and the number of installations at the national level or regional level, which can be used to compare data between cities. However, their ability to identify the satisfaction of residents is limited. Although some quantitative indicators survey the satisfaction level of citizens or residents, the satisfaction level only indicates the status of satisfaction, which does not comprehensively reflect infrastructure requiring urgent improvement.
The Korea Research Institute for Human Settlements [14] proposed sentiment indexes, by which the feelings of citizens toward infrastructure, such as accessibility and convenience, can be measured. These sentiment indexes are distinguished from existing indexes, and they consist of objective and subjective indicators for each item. For example, “accessibility” is evaluated as an objective indicator based on distance, whereas the subjective indicator is defined as the satisfaction level indicated by residents. However, the measurement of the feelings of the residents toward accessibility using distance alone cannot fully describe the entire situation. For example, residents may feel positively toward accessibility to a far distance if transportation is well supplied. In addition, as subjective indicators do not evaluate the sentiment degree of citizens on the objective indicators, but were borrowed from similar items, statistical indicators, or social survey data previously held by local governments, it is difficult to understand the results by establishing a relationship between the objective and subjective indicators.
The infrastructure services assessment model proposed in this study measured “the infrastructure service level” by surveying “the current levels” and “the required levels” based on the answers of the respondents, and investigated the satisfaction level that represented the satisfaction degree of the respondents with the current level, and “the level of need for improvement”, which represented the comprehensively required level of improvement of the item. Thereby, this model aimed to support the establishment of investment in infrastructure preferred by local residents rather than an investment plan of infrastructure to reduce regional deviation. Nonetheless, quantitative indexes surveyed by central or local governments should be considered in identifying the causes of assessment results derived from the assessment model employed in this study and establish a detailed plan.
2.3. Service Quality Gap Model
Zeithaml, Parasuraman, and Berry conducted a representative study on the conceptualization and measurement of service quality in the marketing field [15,16,17]. SERVQUAL, which is a model based on the “Expectancy–Disconfirmation Theory”, defines the difference between the “perception quality” and “expectation quality” of a customer’s service as “service quality”. This indicates that consumers assume an expectation or a desirable level for a service when consumers consume a service, and the extent to which these expectations are met is a measure of service quality. Accordingly, as the difference between the expected level and the actual performance increases, the probability of determining and correcting a problem increase.
SERVQUAL enables a company evaluate and measure the service level perceived by customers, extract key factors for quality control or specific items within those factors, and implement intensive management. Therefore, it is used as a tool for measuring service quality, not only in the marketing field but also in various other fields [18], such as education [19,20], hospital service [21], and hotel management [22].
In addition, SERVQUAL has been used to evaluate the quality of public transportation services that citizens can directly experience compared with other infrastructure among urban services. Gilbert and Wong [23] evaluated airline services in Hong Kong using SERVQUAL, and Devi and Raja [24] proposed and investigated the application of RAILQUAL for evaluating Indian railway passenger service. In addition to the five dimensions defined by SERVQUAL, RAILQUAL includes comfort, security, and convenience for evaluating the quality experienced by the citizens. Too and Earl [25] compared the perceived quality of bus passengers compared with train passengers in Varsity Lakes (Australia). Anjali A. et al. [26] evaluated the service quality of the transportation system of Montreal using SERVQUAL, and employed fuzzy TOPSIS to more accurately measure the linguistic expression of service sensitivity. Benedetto B. et al. [27] measured the service quality of city bus transportation using SERVQUAL, and demonstrated the possible application of SERVQUAL for complying with the requirements set in European standards for defining the service levels for bus traffic. Sadia A. et al. [28] proposed Citizen’s ScoreCard for urban service quality to provide urban services considering the needs of citizens. Ecem T. et al. [29] proposed a P-SERVQUAL 4.0 (Pandemic SERVQUAL 4.0) model to improve their strategies and operations to adapt Industry 4.0 and prevent the spread of SARS-CoV-2 (COVID-19) in Istanbul.
Although SERVQUAL is a generalized tool for measuring service quality, it can be modified and supplemented, and applied as an appropriate evaluation model that considers the characteristics of the field of application. Therefore, to utilize SERVQUAL, the dimensions of service quality are reclassified according to the type of industry, and the phraseology used for each measure of service quality must be adjusted to the context of the service provision.
In terms of infrastructure investment decision making, even if the gap for infrastructure services is the same, the cost required according to the current level and the required level may differ. That is, although the current level (perception) is lower than that of other regions, the required level (expectancy) is also lower than that of other regions, so that the infrastructure service level may be high. In contrast, although the current level (perception) is higher than that of other regions, the required level (expectancy) is also higher than of other regions, so the overall service level may be low.
In this study, to set the level of infrastructure service that reflects the demand of residents, SERVQUAL, which can examine the gap between residents, as well as the perceived quality (current level) of the infrastructure service and the expected quality (required level), was used.
The novelty of this study compared with previous studies that employed SERVQUAL for urban service evaluation are as follows. First, this study considered various infrastructures, not specific infrastructure (urban service). In addition, appropriate measurement items for each infrastructure sector were derived to evaluate the service level experienced by residents. Second, this study does not only utilize linguistic scales or Likert scales for service evaluation but a measurement scale for each infrastructure sector was defined based on actual numerical data published by the Korean government or research institutes to more accurately measure the perceptions of the residents regarding infrastructure services.
3. Infrastructure Service Level Assessment Model
3.1. Measurement Item
This study utilized the infrastructure classification in the infrastructure scores of US [30,31] and National Infrastructure Plan of the UK [32]. Accordingly, infrastructure that can affect the QOL of citizens and impact the daily lives of citizens, regardless of the responsible government agencies, was targeted. Hence, houses considered to be private properties were excluded. Thus, the evaluated sectors included the transportation (T), water (W), energy (E), telecommunication (TC), waste and environment (WE), and living (L) sectors.
The assessment model proposed in this study quantified the degree of satisfaction of local community residents with the infrastructure development levels in their daily lives to identify demands needing improvement. Thus, the measurement items used in this study included accessibility, usability, and recovery speed based on existing service assessment models.
- Usability: The extent to which the expected functions of the infrastructure are appropriately available.
- Accessibility: The extent to which the infrastructure is available when required.
- Recovery speed: The extent to which recovery is speedy in the event of damage due to disasters or accidents.
For example, transportation infrastructure was evaluated using the commute and connectivity times to a metropolitan transportation network (e.g., expressway and airport) rather than road extensions or the number of subway stations or bus stops. In addition, living infrastructure was evaluated based on the times required to arrive at public administration agencies, medical institutions, and libraries. Therefore, to meet the required level derived from the accessibility assessment, it is essential to expand a specific facility; however, if the expansion of a facility, such as an airport, is not viable, the level of the infrastructure services could be improved by developing a strategy to improve the infrastructure in various respects, such as improving a transportation connection system. In addition, community residents may require the improvement of the water infrastructure to ensure a constant supply of clean water without worrying about a water charge rather than an improvement in the capacity of freshwater and water supply facilities. Accordingly, the required level based on the assessment results can be achieved either by improving the construction plans for freshwater and water supply facilities or establishing new facilities. That is, the perceived infrastructure service levels of the residents as ascertained through the assessment model will be the goal of the model. Accordingly, various measures, including ensuring the quantitative stocks, improving aged facilities, and adjusting fees, would be employed to achieve this goal.
In this study, 31 measurement items corresponding to the infrastructure sectors were proposed (Table 4), and these items were used to verify the infrastructure service levels that reflect the demand of the citizens. Based on the measurement items used in our previous study [33] on the investigation and analysis of the infrastructure service level in Seoul, a measurement item was included to investigate the nationwide infrastructure service level.
3.2. Measurement Scale
The usability, satisfaction level, and level of need for improvement assessment items were measured using a six-point scale, and the accessibility and recovery speed assessment items were measured based on their required times.
To accurately measure required time, time was directly inputted by the respondents. Thus, the goals and guidelines established by the government and public agencies or in the previous study and survey results from 2019 (Table 5) [33] were utilized to configure the assessment scale (Table 6). In the assessment scale, consisting of required time, the satisfaction level increased with a decrease in required time.
3.3. Infrastructure Service Index
In this study, the infrastructure service level was defined as the difference between the current and required levels based on the infrastructure services evaluated using SERVQUAL [15,16,17], which is a well-known assessment model for assessing existing service qualities.
- Current level: What is the current level of each measurement item?
- Required level: What is your expected level of each measurement item?
The calculation of the infrastructure service level revealed that the service level increased with a decrease in the required time. Thus, the infrastructure service level was calculated using the inverse of the current/required level. For example, if the measured current and required levels of the commute time were 55 and 40 min, respectively, the infrastructure service level of the required commute time will be 72.7%. For the other six-point scale questions, the point was calculated by dividing the current level by the required level.
- Measurement scale is time: {1/(current level/required level)} × 100
- Measurement scale is a six-point scale: (current level/required level) × 100
To verify the current and required levels of Korean infrastructural development from various perspective, and to present the potential applications of the assessment model from policy perspectives, the satisfaction level and level of need for improvement of the following assessment items were surveyed.
- Satisfaction: How satisfied are you with the current level?
- Need for Improvement: To what extent should the item be improved to reach the expected level?
In addition, the measurement items that involved required times were calculated using six-point-scale questions and the answers were converted to the time median value (e.g., 10 min and 30 min).
4. Data Collection
The questionnaires used in this survey included questions on the current and required levels for each infrastructure sector perceived by the citizens during their daily lives, as well as their residential environment to analyze the reasons for their perceptions. To validate whether the infrastructure performance of a residence has a positive effect on life satisfaction, life satisfaction, residence satisfaction, and the selection factor of residence were investigated. In addition, to validate the measurement items for infrastructure service level, residence satisfaction, satisfaction with the infrastructure performance, and satisfaction with the infrastructure sectors were investigated (see Table 7).
The overview of the survey on the infrastructure service level perceived by citizens is presented in Table 8. This study provided a measure for surveying the perceptions of citizens on national infrastructure to determine the nationwide perceptions of infrastructure. Where all the regions in the country were included, some survey areas have a small population, and Gyeonggi-do exhibits an excessively high population density within the survey area, with a population of above 500,000. Accordingly, this study proposed a stratified sampling method suitable for the survey based on the lower limit of population and metropolitan population status based on geographical characteristics. For special and metropolitan cities consisting of districts and large cities with a population of above 500,000, survey areas were divided based on the single-city criterion; however, there were difficulties in dividing survey areas in small and medium cities, including counties, with a population of below 500,000 based on the single-city criterion. Thus, the survey areas in those cities were divided based on geographical circumstances. Therefore, regions were stratified into a total of 118 survey areas. For the populations in the regions, the resident registration statistics of the Ministry of Public Administration and Security, as of the end of August 2020, were utilized, and the sample allocation was performed using the square root allocation method to prevent a sampling bias by region. To derive representative analysis results, weight was applied after the survey to match the sample and population composition ratios.
In addition, the characteristics of the 12,500 nationwide respondents sorted by region are presented in Table 9.
5. Results and Implications
5.1. Validation of the Adequacy of the Proposed Model
First, to verify whether the infrastructure performance of a residence had a positive effect on life satisfaction, the relationship between life satisfaction and residence satisfaction was verified. In addition, as a factor that affects the satisfaction of residence, the selection factor of residence was investigated.
The correlation between the satisfaction levels of the respondents with life and with their residence was 0.555. In addition, the Durbin–Watson value, the model of which represents the influential relationship between the satisfaction levels with residence and life, was 1.996. Furthermore, the independence assumption of the residual term, which is the basic assumption of the regression model, was satisfied, and its F value was 5557.810. This indicates that the regression model equation, which was estimated at a significance level of 0.01, was statistically significant. In addition, the R2 value was 0.308, indicating that the satisfaction level of the respondents with their residence corresponded to their satisfaction level with life by approximately 30.8%. This suggests that there is a close relationship between improvements in the satisfaction with a residence and that with life. Moreover, the analysis results on the correlations between the satisfaction levels of the respondents with life and their residence, and the categories of residence revealed that the highest correlations were observed between the comfort of a residence and the satisfaction level with the residence, and between the satisfaction levels with life and a residence (Table 10).
Owing to the close relationship between the satisfaction levels with a residence and life, this study investigated the factors that are considered important when selecting a residence to understand the factors that improved the satisfaction level of citizens with a residence. The results revealed that economic circumstances (41.1%) had the most significant effect on the selection of a residence, followed by the transportation environment (24.2%). In addition, the factors that affected the residence decisions of 55.3% of the respondents were related to infrastructural factors (e.g., transportation environment, childcare and education environment, convenience and cultural facilities, comfortable environment, parks and greenery, safety in disasters and accidents, and crime prevention environment).
Second, the relationship between residence satisfaction and satisfaction with infrastructure performance, and the relationship between residence satisfaction and satisfaction with infrastructure sectors were analyzed to verify the measurement items for the infrastructure service level.
The aforementioned results revealed that there was a close relationship between the satisfaction levels of the respondents with their residences and infrastructure. In addition, the analysis results revealed that the correlation index between the satisfaction levels with a residence and with infrastructure was 0.498, thus verifying the close relationship. To determine the infrastructure performance that had the most significant impact on the infrastructure satisfaction of the respondents, a regression analysis between the overall satisfaction with infrastructure and satisfaction with infrastructure performance was performed. The analysis results revealed that the usability, accessibility, and recoverability of infrastructure had significant effects on the overall satisfaction level of the respondents with respect to infrastructure (Table 11) [45]. This indicates that the usability, accessibility, and recoverability presented in Section 3 are relevant measurement items for infrastructure service level.
In addition, the analysis results of the correlations between the satisfaction level with a residence and with six infrastructure sectors revealed that, among the six infrastructure sectors, the transportation and living infrastructure sectors exhibited a high correlation with the satisfaction levels of respondents with their residences (Table 12). This indicates that, owing to the high correlation between transportation and living infrastructure sectors and to satisfaction with residence, this factor can be used to extensively configure items measuring infrastructure service level.
5.2. Validation of the Importance of the Proposed Model
5.2.1. Comparison of the Infrastructure Service Level by Infrastructure Sectors
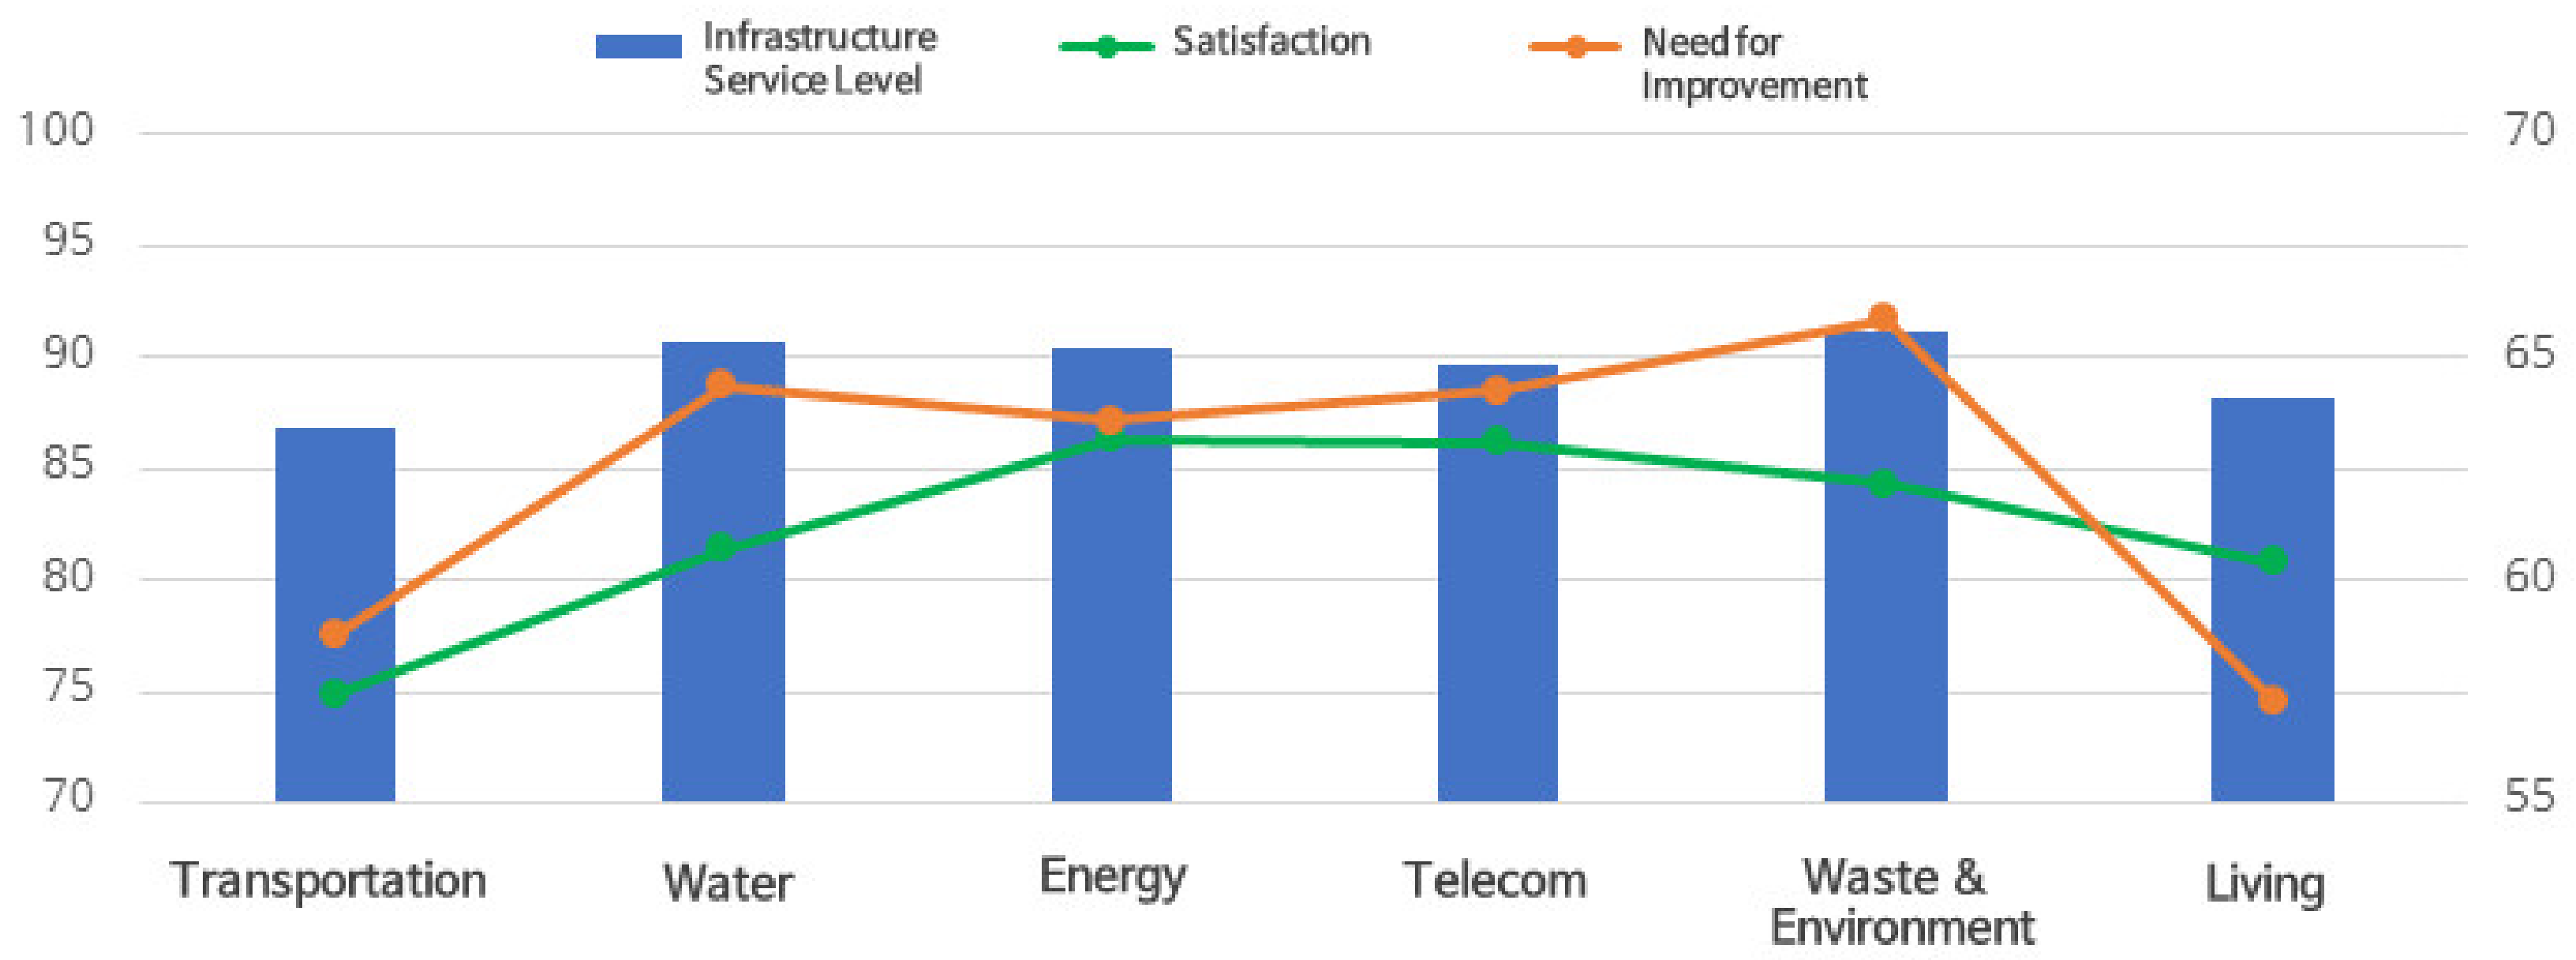
The total infrastructure service level of Korean infrastructure was 89.2%. In addition, among the infrastructure sectors, the water infrastructure sector (91.0%) exhibited the highest infrastructure service level, followed by the waste and environment (90.7%), energy (90.1%), transportation (86.8%), and living (87.3%) infrastructure sectors. The infrastructure service levels of the transport and living infrastructure were less than 90%, which was relatively lower than those of the other sectors.
In the transportation infrastructure sector, among the measurement item, the public transport exhibited the lowest infrastructure service level (78%; the level at the time of authorship was 14.5 min, whereas the required level is 13.4 min), followed by the required time to reach the transportation hub (79.7%; the level at the time of authorship was 36.3 min, whereas the required level is 25.2 min). In the living infrastructure sector, among the measurement items, the time required to get to the library exhibited the lowest infrastructure service level (77.9%; the level at the time of authorship was 16.8 min, whereas the required level is 12.0 min), followed by the required time to get to living and cultural facilities (78.6%; the current level was 34.6 min, whereas the required level was 25.2 min).
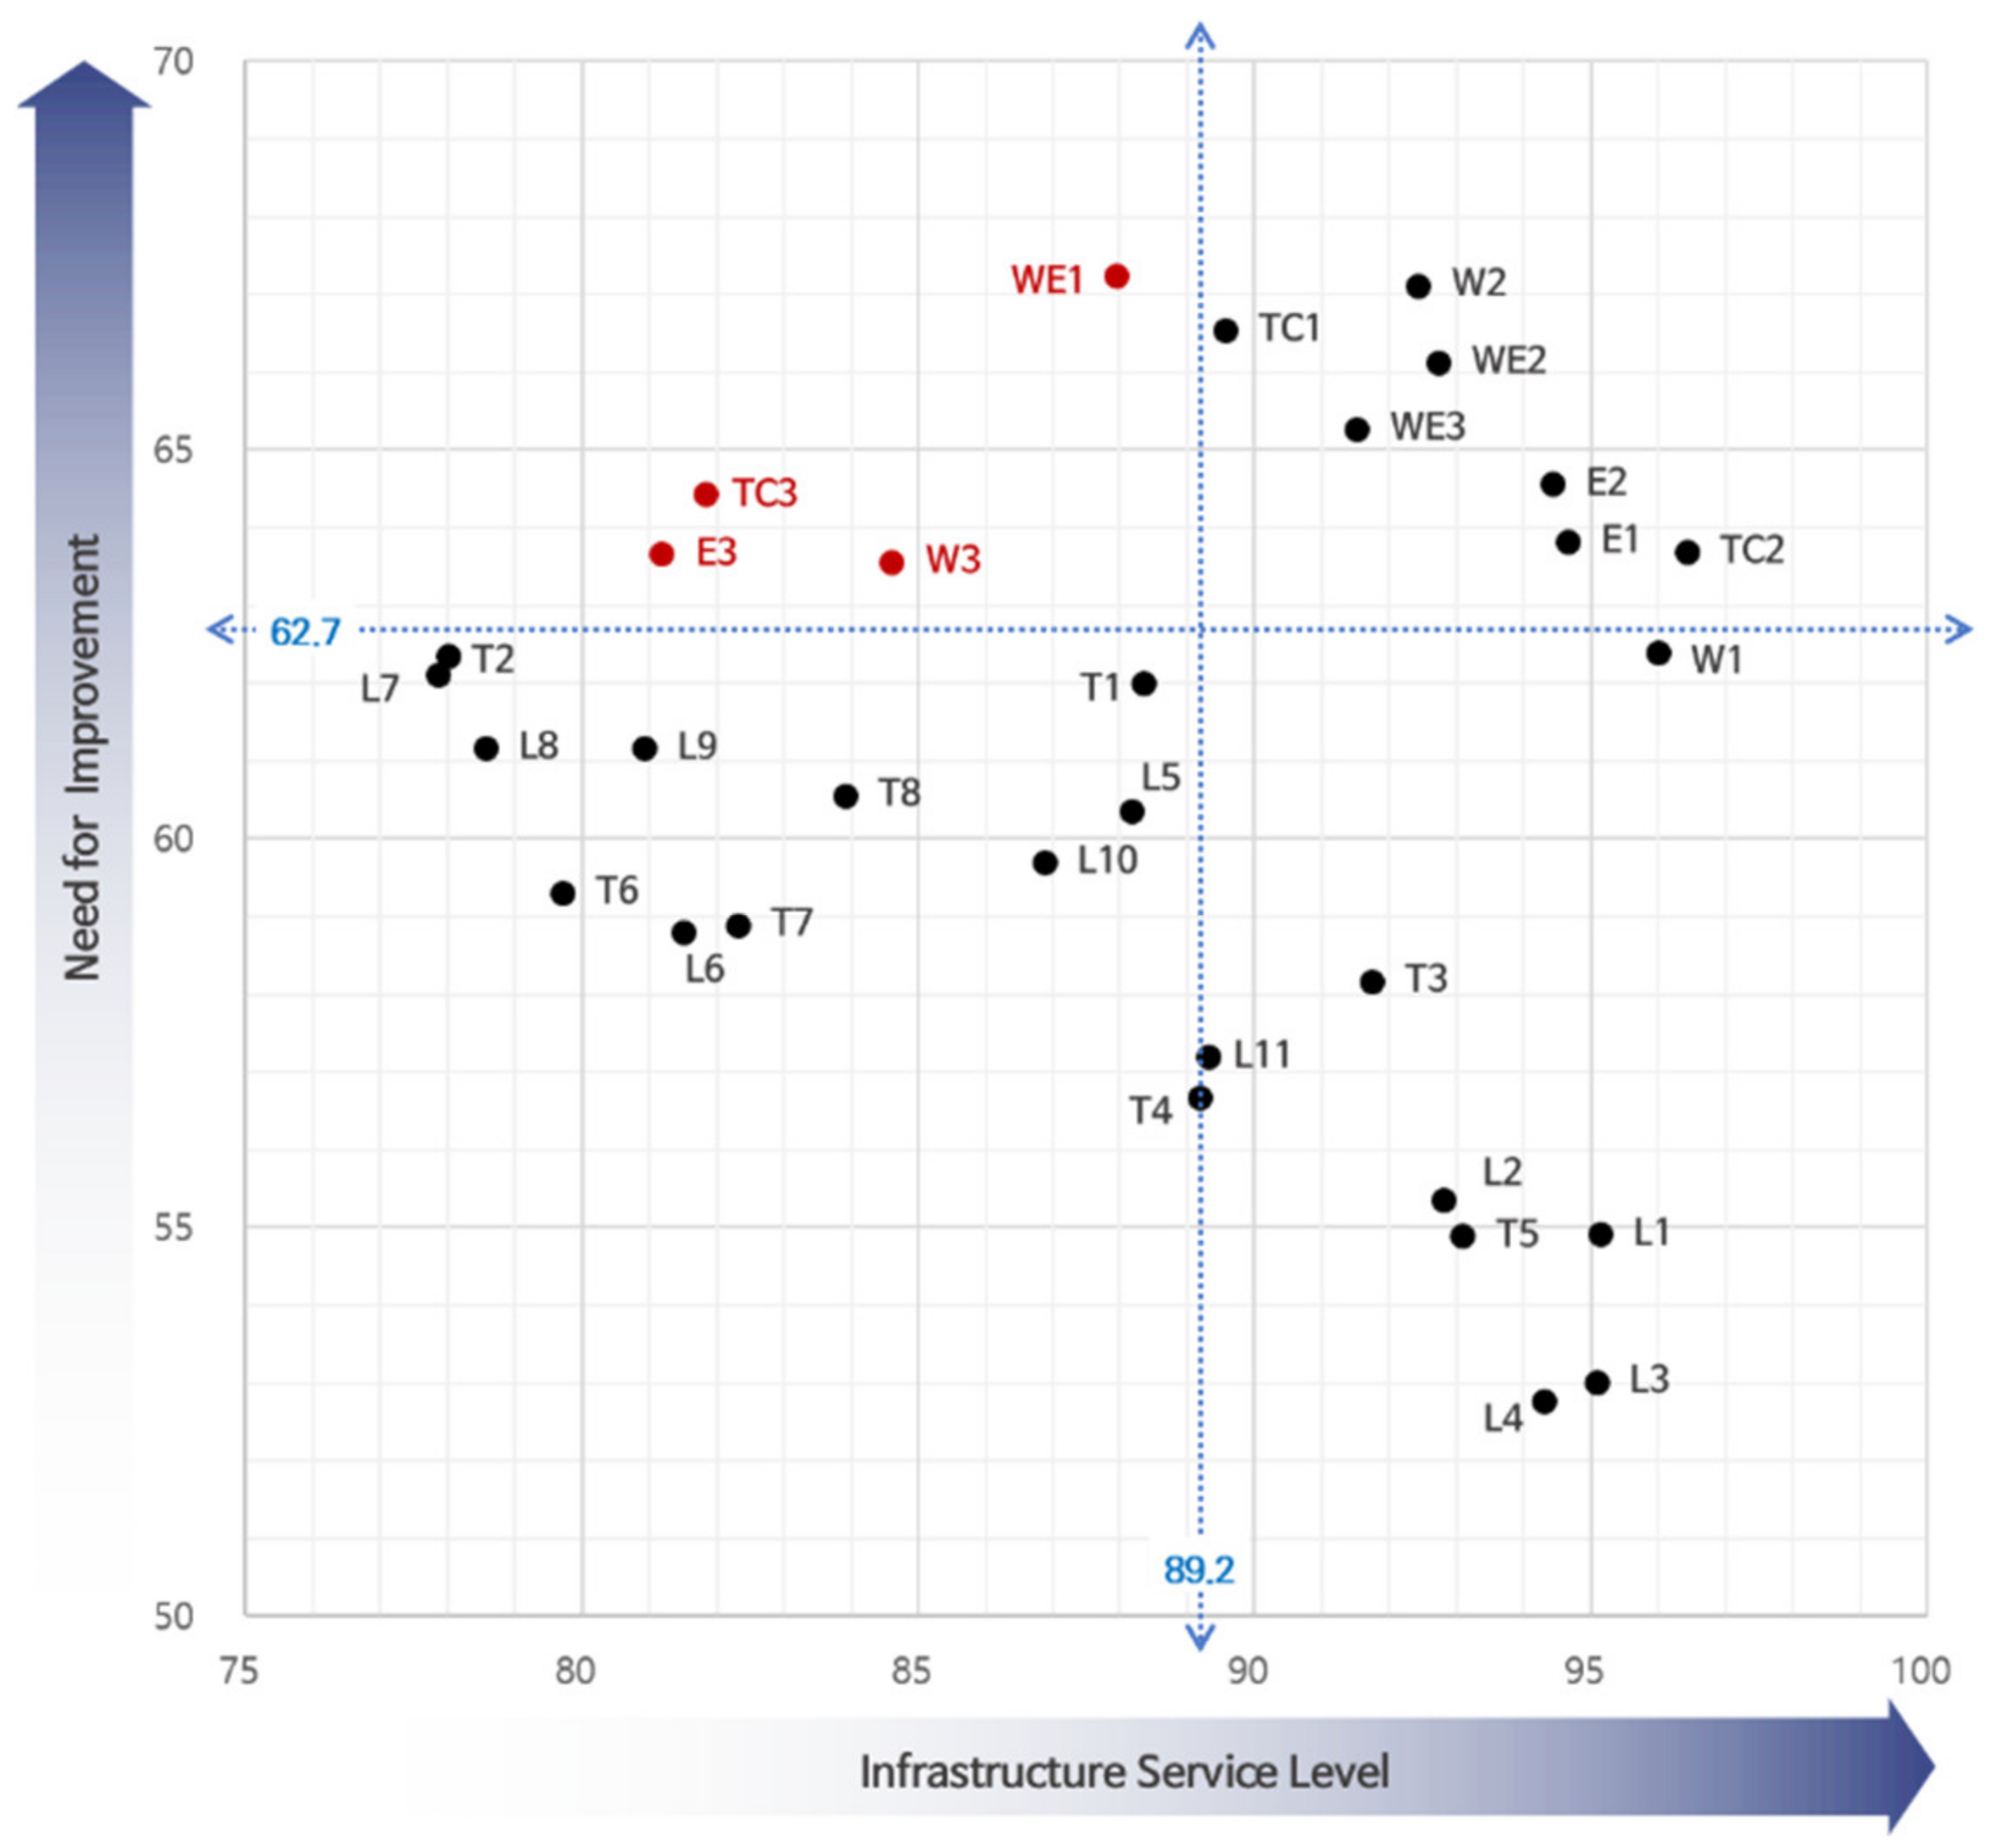
The quadrant analysis results on the infrastructure service level and the need for improvement revealed that both the infrastructure service level and the level of need for improvement of waste and the environment, water, energy, and telecommunication infrastructure sectors were high. However, both were relatively low for the transportation and living infrastructure sectors (Table 13).
The areas perceived as most urgently requiring improvement are the items belonging to Quadrant 2. These items included the recovery time after an internet connection and communication disruption (the level at the time of authorship was 30.6 min, whereas the required level is 22.7 min), the required time to recover from a power outage (the level at the time of authorship was 30.6 min, whereas the required level is 22.6 min), the required time to recover from water contamination (the level at the time of authorship was 13.2 h, whereas the required level is 9.9 h), and the level of sewage odor generation (the level at the time of authorship was 4.0 points, whereas the required level is 4.7 points) (Figure 2). In addition, the need for improvement in energy and telecommunication infrastructure sectors was relatively high, and the overall infrastructure service level of the energy and telecommunication infrastructure sectors was higher than those of the other infrastructure sectors. However, the infrastructure service level from the recovery speed perspective, such as “outage recovery time (E3)” and “internet connection and call disruption recovery time (TC3)”, was low, thus, increasing the degree of urgent improvement. This result verified the steady increase in the demand of the citizen for not only “usability” but also “reliable use”.
Further, the measurement items in the transportation and living sectors, which exhibited a low infrastructure service level that required an urgent need for improvement included public transit, required time for road recovery, required time to get to the transportation hub in the transportation infrastructure sector, and required time to get to public/private/small libraries, public parking places, and a neighborhood park.
The infrastructure service level, satisfaction, and the need for improvement of various infrastructure sectors revealed that the infrastructure service level and satisfaction levels of the living infrastructure sector were lower than those of the water, telecommunication, energy, and waste and environment infrastructure sectors (See, Figure 3). In addition, the perceived level of the need for improvement of the living infrastructure sector was lower than those of the water, telecommunication, energy, and waste and environment infrastructure sectors. This indicates that, because the water, telecommunication, energy, and waste and environment infrastructure sectors have already been developed to some extent, and there has been satisfaction regarding the quantitative stocks announced to date, as verified in the survey results, they exhibited a high infrastructure service level. However, because these sectors are related to survival, they exhibited a high need for improvement. Although citizens do not consider the service level of the transportation and living infrastructure sectors, which are related to the convenience of residence, satisfactory, the perceived levels of the need for improvement of these sectors were lower than those of the infrastructure sectors related to survival. In addition, the satisfaction levels of these sectors were higher, and they exhibited the largest gap between the infrastructure service and satisfaction levels. The inconsistency in the result of the infrastructure service and satisfaction levels verified that increasing the satisfaction level by the quantitative expansion has a limitation. This indicates that it is essential to perform detailed investigation and analysis to identify what type of demand is required to increase satisfaction level.
5.2.2. Comparison of the Infrastructure Service Level by Region
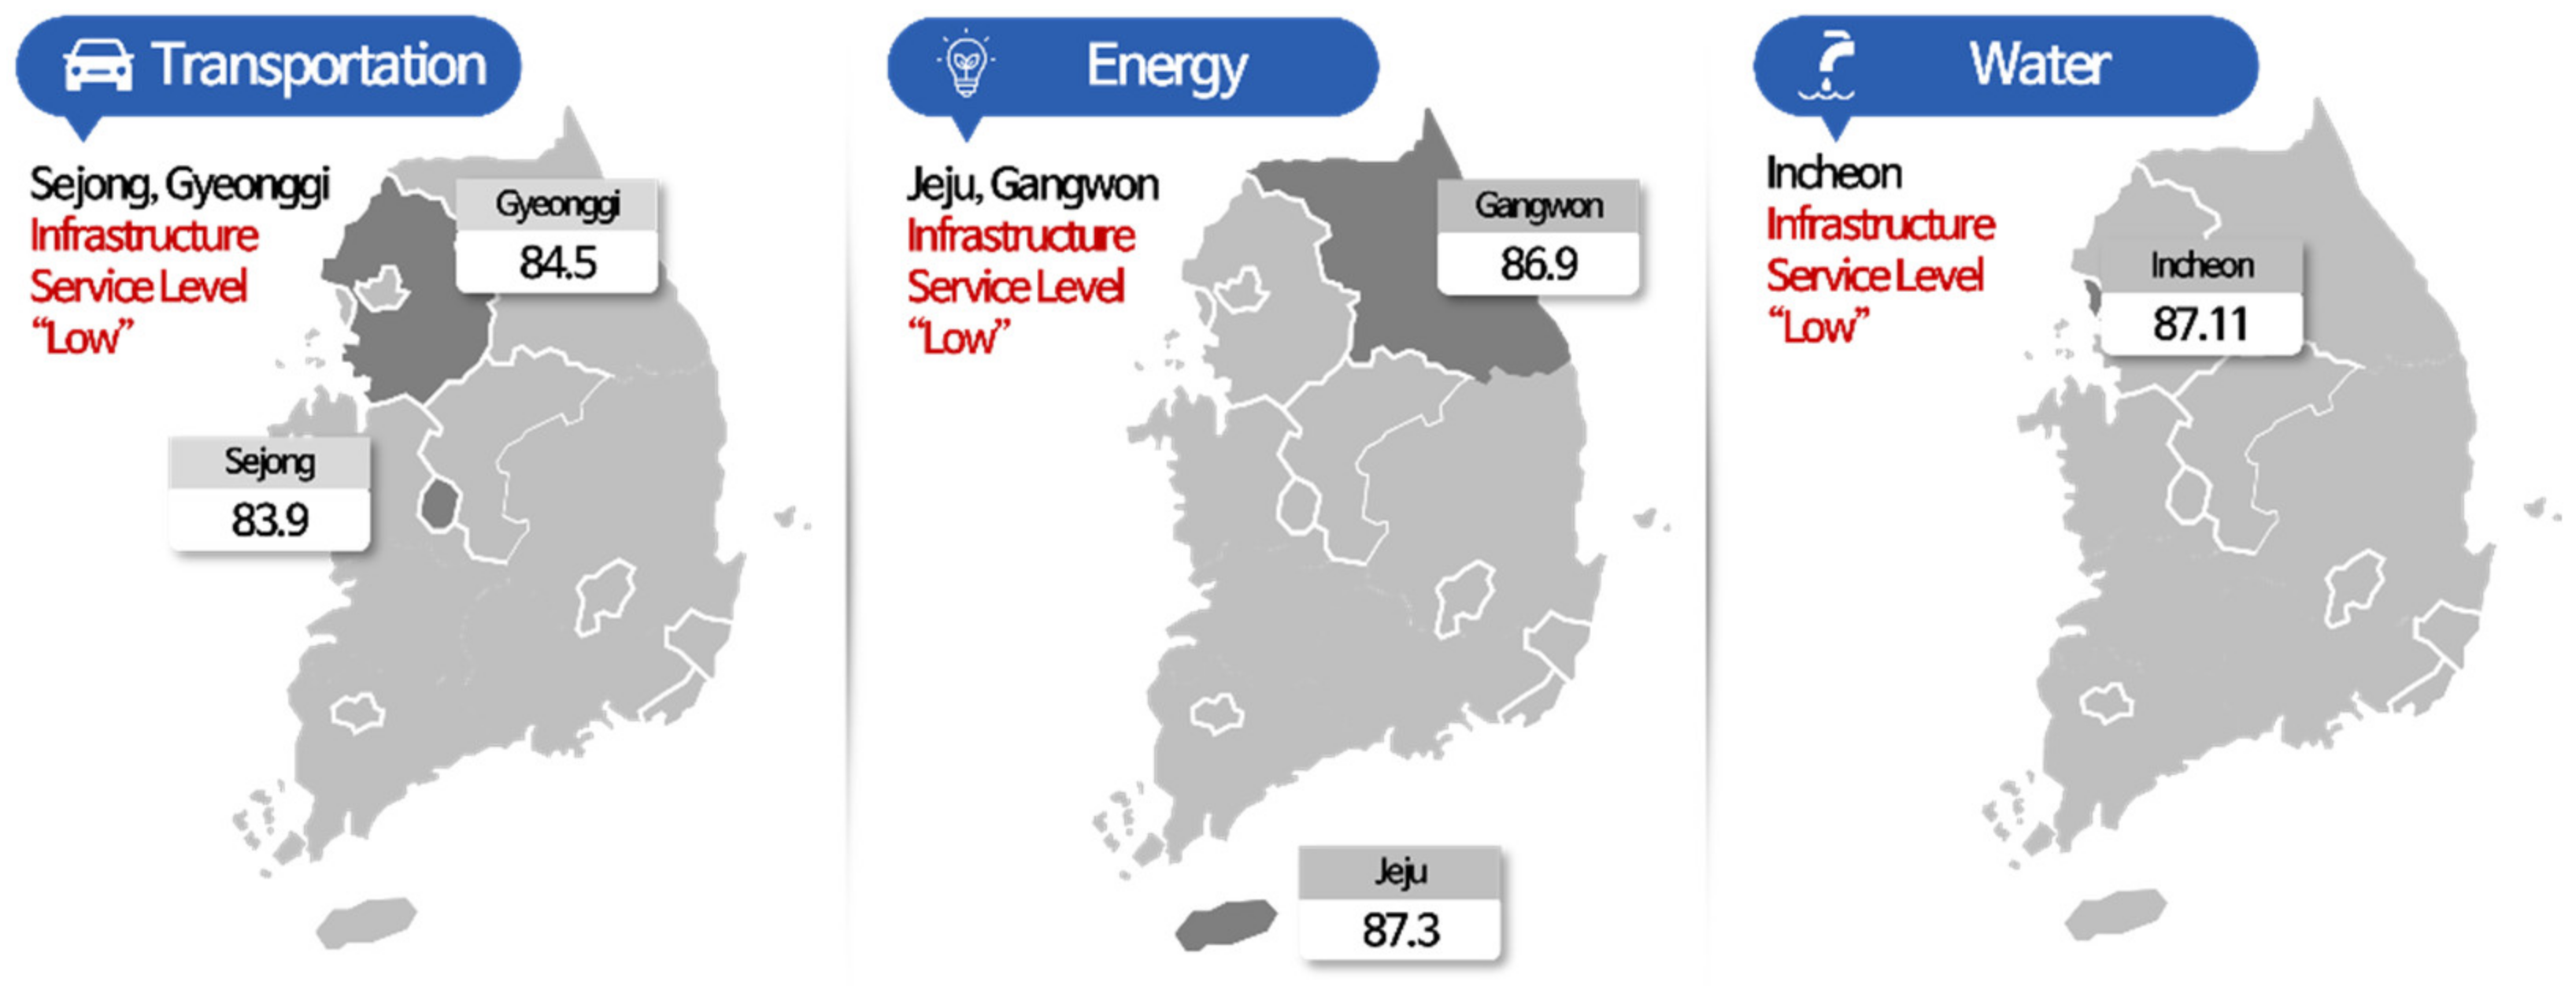
Metropolitan transportation in the transportation infrastructure sector and that of the living infrastructure sector, such as medical, sports, culture, and public facilities, used in the daily lives of citizens exhibited a generally low infrastructure service level. However, infrastructure sectors with low regional infrastructure service levels differed by region (See, Figure 4).
The results revealed that Sejong, Gangwon, and Chung-nam exhibited lower satisfaction level scores than other regions, and among regions, Chung-nam exhibited the lowest satisfaction level scores. Both the current and required levels were investigated, and the current satisfaction level of Sejong was higher than those of the other regions; however, Sejong exhibited a significantly higher required satisfaction level, which resulted in a low fulfillment level (i.e., the difference between the current and required levels). Gangwon exhibited a similar current satisfaction level with other regions, but the required level was higher than those of the other regions, which resulted in a low infrastructure service level. Particularly, the comparison of the current and required levels revealed that although Seoul exhibited similar infrastructure service levels with Gangwon, the current and required infrastructure service levels of Seoul were approximately 22.8 and 19 min, respectively, whereas those of Gangwon were approximately 19 and 15.8 min, respectively. This indicates that even at a similar infrastructure service level, the required level may differ depending on the region. Thus, it is essential to set a goal that reflects the regional demand rather than a “single goal” for the entire region of Korea or Seoul.
Sejong and Gangwon exhibited low infrastructure service level scores, but their current levels were not significantly low, indicating that their satisfaction levels were not significantly low. However, the low infrastructure service level in Chung-nam could be attributed to the lower current satisfaction level of the region compared with those of other regions, which resulted in a low satisfaction level. Compared with other regions, Gwangju exhibited higher infrastructure service level and current levels, which resulted in a high satisfaction level. The aforementioned results indicate that the satisfaction level regarding infrastructure is related to the current level of infrastructure.
In addition, the required degree of infrastructure and priority may differ regionally when comparing the infrastructure service level of infrastructure between and within regions (See, Figure 5).
Accordingly, this indicates that there should be a change in the national direction of policies regarding infrastructure from “equalization/standardization” to “customization to the region” policies based on the regional variation in demand. That is, as the overall infrastructure service levels of the transportation infrastructure (e.g., commute time to work and school and required time to subway station or bus stop) and living infrastructure (e.g., required time to education, sports, and cultural facilities) sectors were low, the construction of a long-distance traffic network for balanced regional development and an SOC construction policy for the daily lives of citizens will reflect the demand of citizens. Nonetheless, the goal and priority should be set according to the regionally required level.
In addition, as expected, the infrastructure service level of public parking places, senior welfare facilities, living sports facilities, and neighborhood parks in Seoul was high. However, this result could be attributed to the fact that the current and required satisfaction levels of these facilities in Seoul were low compared with those of other regions, rather than because of the high accessibility of Seoul compared with other regions. This indicates that the needs of infrastructure are highly complex, that is, they cannot be simply determined by the number of facilities or access distance but should be identified from diverse and integrated perspectives.
As the pivotal role of infrastructure in supporting industries and economic activities has been recognized, the quantitative building goal been set from the perspective of the supplier. However, owing to the increase in the individual incomes of citizens, and the significant attention attracted by improvements in quality of life, the demand for service level improvements that represent the satisfaction of qualitative goal has increased.
Based on the results of the national demand survey that revealed that services at a higher level than the current level have been provided and revealed the difference between the existing quantitative assessment result and the degree felt by citizens (See, Table 14), both quantitative and qualitative needs should be comprehensively reflected in infrastructure investment plans. However, as the psychological aspect that satisfied the fact that people wanted more infrastructure was reflected in the survey, it is essential to consider the extent to which the required level by citizens will be set and the necessary cost to satisfy the required level.
5.2.3. Comparison of the Infrastructure Service Level Based on Region Size
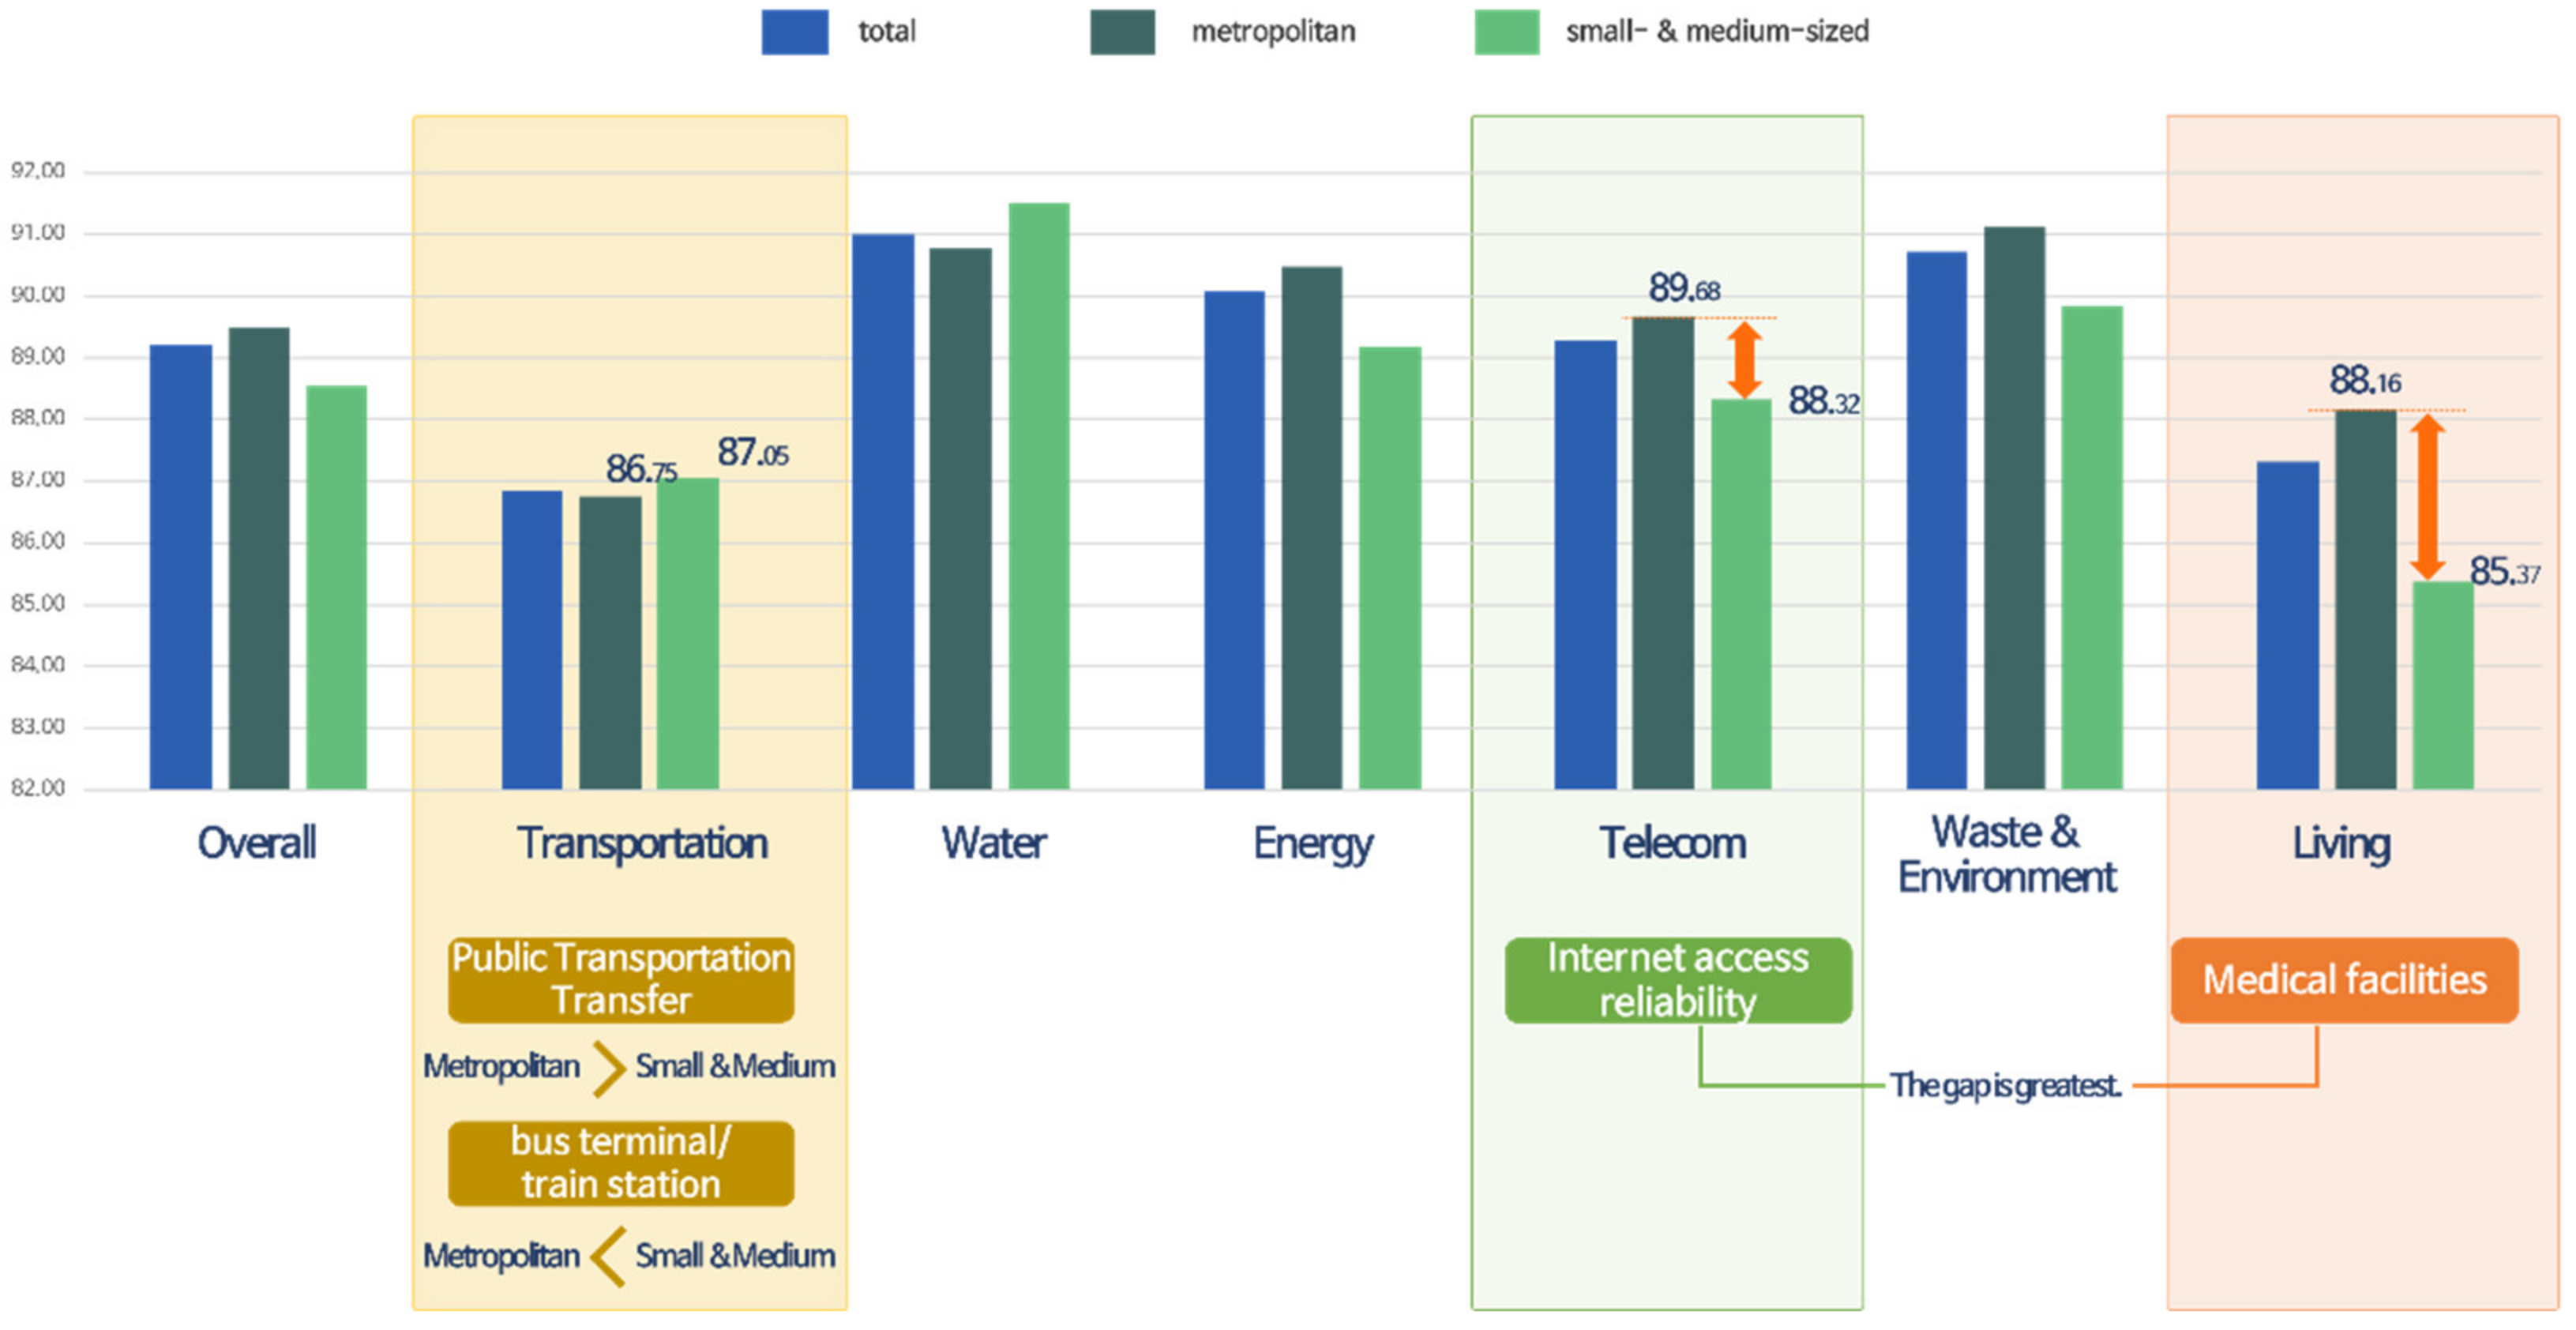
The infrastructure service level of each infrastructure sector in large regions was higher than the overall infrastructure service level in small- and medium-sized regions; however, the need for improvement was higher in small- and medium-sized regions than in large regions. In addition, the infrastructure service level of all the infrastructure sectors were higher in large regions than in small- and medium-sized regions except the water infrastructure sector (See, Figure 6).
Furthermore, the infrastructure service level of transportation infrastructure was higher in large regions than in small- and medium-sized regions. This indicates that the infrastructure service level of public transport transit systems was higher in large regions than in small- and medium-sized regions. Moreover, it exhibited the largest difference among the assessment items according to urban size. In contrast, the infrastructure service level of commute and transportation hub was higher in small- and medium-sized regions than in large regions.
The most common case of commute to work and school among the respondents included commute to another town, township, or neighborhood within a city, county, or district of the current residence (43.5%), which was followed by the commute to work and school within the town, township, or neighborhood of current residence (23.3%). In addition, the respondents in special and metropolitan regions exhibited the highest responses to commute to another town, township, or neighborhood within a city, county, or district of current residence; however, residents in Gyeonggi and Incheon exhibited a high ratio of commute to work and school to another city, county, or district, whereas residents in Sejong exhibited a high ratio of commute to work and school to another city or province. Furthermore, Gyeonggi, Incheon, and Seoul exhibited the lowest current level of the commute time to work and school. For Gyeonggi and Incheon, this could be attributed to traffic congestion rather than a long distance. As Sejong is an isolated city, it exhibited a higher ratio of commute to other regions and provinces than other regions, but the current level was in between those of other regions. In contrast, Gangwon exhibited the largest ratio of respondents who commuted within the town, township, or neighborhood of current residence, and the difference in the commute time of Gangwon to that of Gyeonggi was 15 min.
In addition, over 50.8% of the respondents selected private car as the transportation means used during the commute to work and school, whereas 39.7 and 27.4% selected bus (public transport or commute bus) and subway and railway, respectively, as the utilized transportation means. The ratio of using bus during the commute to work and school was higher in special and metropolis, whereas the ratio of using private cars was higher in provincial regions. In addition, the ratio of using public transit was relatively higher in special, metropolis, and large regions. This could be attributed to the fact that large regions were well equipped with public transport transit systems.
The largest difference in the infrastructure service level according to the city size was observed in the telecommunication and living infrastructure sectors. In the telecommunication infrastructure sector, the infrastructure service level of internet connection exhibited the largest difference according to city size, and for the living infrastructure sector, the infrastructure service level of medical facilities exhibited the largest difference.
This study assessed the results of the satisfaction level of investment, in which the national average was 59 points. Particularly, small- and medium-sized regions scored 56 points, which was less than that of large regions (61 points). To date, most infrastructure investments have been politically determined. Thus, the process has not been transparent, and the decisions made were devalued or overestimated depending on the ideology in which the estimator belonged. Consequently, this has prevented the satisfaction of citizens with infrastructure investment. As such, if a system that can reflect the needs of regional residents is put in place during infrastructure investment for balanced regional development, the satisfaction level of residents, as well as their perceptions of the infrastructure service level, will be increased. Furthermore, the controversy over the fact that sensitive issues, such as priority decision-making on regional infrastructure investment are politically determined.
6. Conclusions
This study proposed an infrastructure evaluation model that reflected the demand of citizens based on previous studies on the evaluation of the QOL, operation cases of infrastructure service assessment systems in advanced nations, and infrastructure building goals and guidelines that were previously established by the government and public institutions for each infrastructure sector. Therefore, this study investigated the perceived nationwide infrastructure satisfaction levels of citizens using the proposed model. In addition, the importance of systemizing the infrastructure service level and satisfaction levels compared with the infrastructure required by citizens during their daily lives was verified, and the possible application of this model for national policy decision-making process was proposed.
The main implications obtained through the assessment of the perceived infrastructure service level by the citizens in Korea are as follows:
First, this study verified that the satisfaction level of residents with their residence significantly affected the QOL improvement, and the level of infrastructure performance in the region significantly affected the satisfaction levels of residents.
Second, the difference between the “quantitative fulfillment level of infrastructure (stocks)” and the “perceived infrastructure service level” by the citizens indicated an increase in the interest of the public in “securing the quality of infrastructure”, implying that the quantitative and qualitative aspects of infrastructure should be simultaneously considered.
Third, rather than focusing on the low or high infrastructure service levels of a specific region, the inconsistency in the correlation of the infrastructure service and satisfaction levels in the infrastructure service survey results should be considered. In addition, although the road stocks were relatively higher than that of advanced countries and the length of highways in Korea per national land area was ranked first among the G20 [40], the survey results revealed that the infrastructure service level of transportation infrastructure in Korea was less than 100%, as discussed in Section 1. These results indicated that there is a demand other than for the quantitative expansion of infrastructure, and suggested the importance of conducting a detailed analysis to understand this demand.
Forth, for example, although the infrastructure service levels of the usability of the energy and telecommunication sectors were high, the infrastructure service level in terms of rapid recovery was low. This resulted in an increase in the need for urgent improvement, and in the demand for not only “usability” but also ”reliable use”.
Fifth, there were variations between the infrastructure service level and service priority of infrastructure by regions. In addition, the comparison of the infrastructure service level by regions revealed that there was a difference in the required satisfaction level of various regions even at the same infrastructure service level. This implies that the goal and priority of infrastructure improvement should reflect the regional demand rather than establishing infrastructure investment policies with a single nationwide goal.
The infrastructure service level investigated using the proposed model can be used as a basic data for establishing an infrastructure master plan for each country and administrative district. Every nation possesses its infrastructure master plan at the national level, although there may be slight variations in the content. Moreover, there are few administrative districts with master plans, although they are not universal. For example, the UK published its national infrastructure master plan developed by the HM Treasury, and London also published its urban infrastructure master plan [46] for the long-term development of the city. If the autonomous metropolitan governments of the 237 administrative districts in Korea developed their master plan based on the index of the infrastructure service assessment system proposed in this study, it would facilitate the effective execution of infrastructure improvements or additional construction policies by the heads of autonomous governments according to the demand of their residents. Furthermore, approximately 95.1% of the respondents indicated that the demand from residents should be reflected in investments for improving and expanding infrastructure. In addition, the results revealed that the extent to which the demands of the residents are reflected in the investments made to improve and expand infrastructure should increase with an increase in the incomes of the residents.
A significant level of time and effort was devoted in this study to developing the master plan, starting with eight special and metropolitan cities before further expansion. In addition, the assessment of the infrastructure service level can not only be used to identify the current demand of citizens but can also be used as a post-assessment system of infrastructure investment policy through continuous monitoring. In Korea, there is currently no standard that defines an official quality level for infrastructure services. However, if the reliability of the data is secured by continuously evaluating the service quality level based on the evaluation model proposed in this study, it can be used as a basis for establishing standards for infrastructure services.
The measurement items and scale constituting the model proposed in this study need to reflect the characteristics of the country being assessed and the characteristics of the times. Therefore, it is necessary to continuously update the evaluation model. The following improvements are required to effectively utilize the deliverables of this study to re-establish the infrastructure policy direction of citizens by the government.
First, to identify whether the change in infrastructure demand is a short-term event or a long-term trend, it is essential to accumulate time-series data. Particularly, because most investment on infrastructure is made on a large scale, it would be difficult to immediately respond to the change in demand verified in a one-year interval survey result. However, the direction of the overall change can be identified through the accumulation of time-series data, thereby ensuring its reflection in the infrastructure investment policy.
Second, although there are differences in the cost of constructing infrastructure depending on its type and attributes, and the cost of constructing the same infrastructure may differ with region, the cost required to improve an index, such as the infrastructure service level and satisfaction levels, which quantify the qualitative needs of infrastructure proposed in this study by 0.01, can be estimated. Although an exact budget estimation would be difficult, it is possible to estimate an approximate budget for policy decision-making using budget estimation methods for each infrastructure sector for each local government. In addition, it is essential to investigate the budget estimation required to improve the pilot infrastructure by 1% after establishing a budget estimation model to improve the infrastructure service level of infrastructure for each region through additional studies.
Lastly, previous studies and this subject suggested that infrastructure should be constructed based on a demand-oriented customization for regional residents. Therefore, it is essential for other related institutions to participate to form a consensus on the need and efficacy of the development of the index at a national level. To develop a national index, continuous attention should be drawn from institutions related to the daily living of citizens and national balanced development. Subsequently, the achievements of this research should be disclosed to the main institutions that can significantly influence the formation of a consensus with related institutions, and opinions should be gathered to create an enabling atmosphere by holding several seminars for the facilitation of the reliability of the survey.
Funding
This work was supported by the National Research Foundation of Korea (NRF) grant funded by the Korea government (MEST) (NRF-2020R1I1A1A01071545). And This work was supported by Research Resettlement Fund for the new faculty of Kwangwoon University in 2021.
Data Availability Statement
The data presented in this study are available on request from the corresponding author.
Conflicts of Interest
The author declares no conflict of interest.
References
- UK HM Treasury. National Infrastructure Strategy. 2020. Available online: https://assets.publishing.service.gov.uk/government/uploads/system/uploads/attachment_data/file/938539/NIS_Report_Web_Accessible.pdf (accessed on 20 March 2020).
- WEF. The Global Competitiveness Report 2019. Available online: http://www3.weforum.org/docs/WEF_TheGlobalCompetitivenessReport2019.pdf (accessed on 20 March 2020).
- The Seoul Institute. SEOUL at a Glance 2017; ISBN 979-11-5621-687-2. Available online: https://www.si.re.kr/node/58872 (accessed on 5 March 2020).
- Korea Research Institute for Human Settlements. Is the Basic Living SOC Available within 10 Minutes? Krihs Issue Report October 2018. Available online: https://www.krihs.re.kr/issue/pressView.do?seq=28708 (accessed on 5 March 2020).
- Ministry of Economy and Finance. Available online: https://www.moef.go.kr/com/bbs/detailComtnbbsView.do?menuNo=9090000&searchNttId1=MOSF_000000000026654&searchBbsId1=MOSFBBS_000000000114 (accessed on 22 September 2021).
- Ministry of Economy and Finance. Available online: https://www.moef.go.kr/com/bbs/detailComtnbbsView.do?menuNo=9090000&searchNttId1=MOSF_000000000051884&searchBbsId1=MOSFBBS_000000000114 (accessed on 22 September 2021).
- Citizens’ Coalition for Economic Justice. Available online: http://ccej.or.kr/64499 (accessed on 22 September 2021).
- National Land Planning and Use Act (Article 2, No. 6). Available online: https://www.law.go.kr/lsSc.do?section=&menuId=1&subMenuId=15&tabMenuId=81&eventGubun=060101&query=8.%09National+Land+Planning+and+Use+Act+#undefined/ (accessed on 15 February 2021).
- Construction & Economy Research Institute of Korea. Understanding of the Infrastructure Evaluation System and Suggesting Directions for Domestic Adoption in UK and US Developed Country; CERIK: Seoul, Korea, 2013. [Google Scholar]
- Statistics Korea. Available online: http://kostat.go.kr/portal/eng/surveyOutline/5/3/index.static (accessed on 5 March 2020).
- Ministry of Land, Infrastructure and Transport. A Guide to Assessing Urban Sustainability and Living Infrastructure; Ministry of Land, Infrastructure and Transport Order No.1127. 2018.12.21; MOLIT: Sejong, Korea, 2018.
- Economist Intelligence Unit. The Global Liveability Index 2021. Available online: https://www.eiu.com/n/campaigns/global-liveability-index-2021/ (accessed on 10 March 2020).
- Mercer Human Resource Consulting 2019. Available online: https://www.mercer.com/newsroom/2019-quality-of-living-survey.html (accessed on 10 March 2020).
- Korea Research Institute for Human Settlements. Implementation Study of Urban Sustainability and Living Infrastructure Evaluation; KRIHS: Sejong, Korea, 2014. [Google Scholar]
- Parasuraman, A.; Zeithaml, V.A.; Berry, L.L. SERVQUAL: A multi-item scale for measuring consumer perceptions of service quality. J. Retail. 1988, 64, 13–30. [Google Scholar]
- Parasuraman, A.; Berry, L.L.; Zeithaml, V.A. Refinement and reassessment of the SERVQUAL scale. J. Retail. 1991, 67, 420–450. [Google Scholar]
- Parasuraman, A.; Zeithaml, V.A.; Berry, L.L. A conceptual model of service quality and its implication for future research. J. Mark. 1985, 49, 41–50. [Google Scholar] [CrossRef]
- Maria, L.S. SERVQUAL—Thirty years of research on service quality with implications for customer satisfaction. Mark. Inf. Decis. 2011, 4, 420–429. [Google Scholar]
- Aditya, C.; Chiranjib, G.; Souvik, B. Assessing students’ rating in higher education: A SERVQUAL approach. Total Qual. Manag. Bus. Excell. 2009, 20, 1095–1109. [Google Scholar]
- Arambewela, R.; Hall, J. A comparative analysis of international education satisfaction using SERVQUAL. J. Serv. Res. 2006, 6, 141–163. [Google Scholar]
- Kazemnezhad, L.; Ghasemzade, M.J.; Mohebi, S. The quality of maternal and child health care services with SERVQUAL Model. J. Health Care 2016, 18, 111–119. [Google Scholar]
- Maria, C.L.F.; Ana, M.S.B. Applying SERVQUAL to Diagnose Hotel Sector in a Tourist Destination. J. Qual. Assur. Hosp. Tour. 2005, 6, 9–24. [Google Scholar]
- Gilbert, D.; Wong, R.K.C. Passenger expectations and airline services: A Hong Kong based study. Tour. Manag. 2003, 24, 519–532. [Google Scholar] [CrossRef]
- Devi Prasad, M.; Raja Shekhar, B. Development of railqual: A service quality scale for measuring Indian railway passenger services. Manag. Sci. Eng. 2010, 4, 87–94. [Google Scholar]
- Too, L.; Earl, G. Public transport service quality and sustainable development: A community stakeholder perspective. Sustain. Dev. 2010, 18, 51–61. [Google Scholar] [CrossRef]
- Awasthi, A.; Chauhan, S.S.; Omrani, H.; Panahi, A. A hybrid approach based on SERVQUAL and fuzzy TOPSIS for evaluating transportation service quality. Comput. Ind. Eng. 2011, 61, 637–646. [Google Scholar] [CrossRef]
- Benedetto, B.; Eusebio, D.; Proto, T. Measuring service quality in urban bus transport: A modified SERVQUAL approach. Int. J. Qual. Serv. Sci. 2012, 4, 238–252. [Google Scholar]
- Ecem, T.; Ertugrul, A.; Alev, T. Interval valued intuitionistic fuzzy AHP-WASPAS based public transportation service quality evaluation by a new extension of SERVQUAL Model: P-SERVQUAL 4.0. Expert Syst. Appl. 2021, 186, 115757. [Google Scholar]
- Sadia, A.; Fahmida, H.; Muntasir, B.H.; Nafis, F.; Ishrat, I.; Nusrat, S.; Fariba, S. Assessing the municipal service quality of residential neighborhoods based on SERVQUAL, AHP and Citizen’s ScoreCard: A case study of Dhaka North City Corporationarea, Bangladesh. J. Urban Manag. 2021, 10, 179–191. [Google Scholar]
- American Society of Civil Engineers. Available online: https://www.infrastructurereportcard.org (accessed on 6 January 2021).
- McKinsey Global Institute. Bridging Infrastructure Gap Has the World Made Progress? 2017. Available online: https://www.mckinsey.com/business-functions/operations/our-insights/bridging-infrastructure-gaps-has-the-world-made-progress (accessed on 22 March 2020).
- UK HM Treasury. National Infrastructure Plan. 2011. Available online: https://assets.publishing.service.gov.uk/government/uploads/system/uploads/attachment_data/file/188337/nip_2011.pdf (accessed on 22 March 2020).
- Lee, S.K.; Kim, T.K. The Infrastructure Service Index for Citizen’s Life Quality Improvement: Focused on Seoul. J. Archit. Inst. Korea 2020, 36, 55–65. [Google Scholar]
- DNews. 1 Hour and a Half to Commute to the Metropolitan Area...More Than Three Times the OECD Average. Available online: https://m.dnews.co.kr/m_home/view.jsp?idxno=201706211052008920642 (accessed on 22 March 2020).
- Korea Transportation Safety Authority. Public Transport Status Survey 2017; TS: Gimcheon, Korea, 2017.
- Daejeon Sejong Research Institute. A Study on Analyzing Transit Patterns and Improving Transit System. 2011. Available online: https://www.dsi.re.kr/board.es?mid=a10101000000&bid=0001&act=view&list_no=677&nPage=82&sel_date= (accessed on 14 October 2021).
- Seoul Metropolitan Government. Comprehensive Development Plan for Urban Railway; 2013. Available online: https://news.seoul.go.kr/traffic/archives/12416 (accessed on 14 October 2021).
- ICEE. The Rights of the People to the National Infrastructure and Seoul Citizens’ Experience of National Infrastructure; SNU ICEE Discussion Book No. 09; ICEE: Seoul, Korea, 2019. [Google Scholar]
- Ministry of Land, Infrastructure and Transport. 1st National Roads Comprehensive Plan (2016–2020); Ministry of Land, Infrastructure and Transport: Seoul, Korea, 2016.
- Korea Research Institute for Human Settlements. Research to Establish Highway Construction Plan (2016–2020); Korea Research Institute for Human Settlements: Sejong, Korea, 2016. [Google Scholar]
- The Korea Transport Institute. What Is the Regional Accessibility of Public Transportation to Major Transportation Facilities? The Korea Transport Institute: Sejong, Korea, 2017. [Google Scholar]
- The Korea Transport Institute. Comparative Analysis of Access Transportation Systems at Major Airports in Korea, Japan and China, Current Issue Analysis Report; The Korea Transport Institute: Sejong, Korea, 2015. [Google Scholar]
- Enforcement Rules of the Education Environment Protection Act [Attached Table 1]. Available online: https://www.law.go.kr/%EB%B2%95%EB%A0%B9/%EA%B5%90%EC%9C%A1%ED%99%98%EA%B2%BD%EB%B3%B4%ED%98%B8%EC%97%90%EA%B4%80%ED%95%9C%EB%B2%95%EB%A5%A0%EC%8B%9C%ED%96%89%EB%A0%B9 (accessed on 22 March 2020).
- Office for Government Policy Coordination. Steering Group of Living SOC (2019), 3-Year Plan of Living SOC (2020–2022); OPM: Sejong, Korea, 2019.
- Belsley, D.A.; Kuh, E.; Welsch, R.E. Regression Diagnostics: Identifying Influential Data and Source of Collinearity; John Wiley and Sons: Hoboken, NJ, USA, 1980. [Google Scholar]
- Mayor of London. London Infrastructure Plan 2050 a Consultation. 2014. Available online: https://www.london.gov.uk/what-we-do/business-and-economy/better-infrastructure/london-infrastructure-plan-2050 (accessed on 14 October 2021).
Figure 1.
Performance Overview of Korea [2].
Figure 1.
Performance Overview of Korea [2].

Figure 2.
Improvement priority by the measurement items.

Figure 3.
Infrastructure service level, satisfaction, and need for improvement of various infrastructure sectors.
Figure 3.
Infrastructure service level, satisfaction, and need for improvement of various infrastructure sectors.

Figure 4.
Infrastructure service level by region.

Figure 5.
Difference between improvement priorities by infrastructure sector and improvement priorities by regions.
Figure 5.
Difference between improvement priorities by infrastructure sector and improvement priorities by regions.

Figure 6.
Infrastructure service level based on region size.


Table 1.
National Land Planning and Use Act (Article 2, No. 6) [8].
Table 1.
National Land Planning and Use Act (Article 2, No. 6) [8].
| Division | Detailed Facility |
|---|---|
| Transportation facility | Road, railway, port, airport, parking lot, car stop, track, cableway, canal, automobile/construction machinery inspection facility, and automobile/construction machinery driving school |
| Space facility | Square, park, green area, amusement park, and open area |
| Distribution/supply facility | Distribution, water supply, electricity supply, gas supply, heat supply, broadcasting/telecom, common duct, market, and oil storage/transmission |
| Cultural/sports facility | School, playground, public office, cultural facility, sports facility, research facility, public vocational training, library, social welfare, and youth training |
| Disaster prevention facility | River, reservoir, retarding basin, fireproof, windproof, waterproof, erosion control, and seawall |
| Health sanitation facility | Crematorium, cemetery, ossuary, slaughterhouse, funeral hall, and general medical facility |
| Environmental facility | Sewerage, waste treatment, water pollution prevention, and junkyard |
Table 2.
Comparison of infrastructure evaluation models based on country.
| Organization | Target | Factor | Method | Level |
|---|---|---|---|---|
| ICE (UK) | Energy, transportation, water/sewage, flood management, digital, and waste and resource management | Physical condition and capacity, resilience, sustainability, impact of financial cuts, and forecast for the next five years | Collection of scattered data and performance of qualitative evaluation by experts | Five levels from A to D |
| American Society of Civil Engineers (ASCE; USA) | Airport, dam, water supply, sewage, energy, hazardous waste, solid waste, waterway, embankment, park, railway, road, bridge, school, and transportation | Capacity, physical condition, financing, future demand, operation/maintenance, public safety, and resilience | Qualitative evaluation by experts using the facilities inspection report and the results of thousands of surveys on the status of facilities. | Five levels from A to D |
| Government/Industry/ Academic Project Steering Committee (Canada) | Water, sewage, rain, road (facilities where data can easily be collected) | Physical status, asset management status, and capabilities | Survey by public official of infrastructure management using specific autopsy/detection data, and expert opinion. | Five levels from A to D |
| ENGINEER AUSTRALIA (Australia) | Roads, railways, airports, ports, waterworks, sewers, rainwater facilities, irrigation facilities, electricity, gas, and telecom | Physical condition, availability, reliability, effectiveness, efficiency, and sustainability (economic, environmental, and social issues) | Qualitative evaluation by field experts using various supporting data. | Five levels from A to D |
Table 3.
Limitation of existing index.
| Division | Limitation |
|---|---|
| Seoul Survey (SEOUL) |
|
| Quality of life indicators (KOSTAT) |
|
| Evaluation of urban sustainability and living infrastructure (MOLIT) |
|
| Global Livability Index (EIU) |
|
| Quality of Living Survey (MHRC) |
|
| Global Competitiveness Report (WEF) |
|
Table 4.
Measurement items used to assess the infrastructure service level.
| ID | Measurement Items |
|---|---|
| T1 | Average duration required from residence to work/university |
| T2 | Average duration required to transfer public transportation while commuting (access time + vehicle waiting time) |
| T3 | Average duration required to walk from residence to the subway station or bus stop |
| T4 | Average duration required to drive from residence to the highway interchange |
| T5 | Average duration required to drive from residence to arterial highway |
| T6 | Average duration required to drive from residence to express bus terminal/train station |
| T7 | Average duration required to drive from residence to airport |
| T8 | Average duration required to recover from pothole or road collapse |
| W1 | Availability of living water at any time without worrying about charges |
| W2 | Water quality (no problem with color and smell) |
| W3 | Average duration required to recover from water pollution |
| E1 | Availability of electricity at any time without worrying about charges |
| E2 | Availability of heating energy (district heating/gas) at any time without worrying about charges |
| E3 | Average duration required to recover from a power outage in residence |
| TC1 | Stability of internet assess at any time without worrying about charges (comfortable degree of app operation, video play, initial screen transfer speed) |
| TC2 | Stability of telephone call at any time without worrying about charges (connect in 20 s, no break within 65 s, and no sound defects) |
| TC3 | Average duration required to recover from internet access and dropped calls in residence |
| WE1 | The degree of sewage odor generation in the sewerage of the residence |
| WE2 | The degree of smoothness in collecting household waste |
| WE3 | Ease of using resource recycling service in residence |
| L1 | Average duration required to walk from residence to elementary school |
| L2 | Average duration required to drive from residence to middle school/high school |
| L3 | Average duration required to walk from residence to childcare facility (e.g., nursery and kindergarten) |
| L4 | Average duration required to walk from residence to elderly care facility |
| L5 | Average duration required to walk from residence to medical facility (e.g., hospital and health center) |
| L6 | Average duration required to walk from residence to public parking lots |
| L7 | Average duration required to walk from residence to library |
| L8 | Average duration required to walk from residence to cultural facility (e.g., library, museum and performance hall) |
| L9 | Average duration required to walk from residence to sports facility (e.g., gymnasium and park) |
| L10 | Average duration required to walk from residence to neighborhood park |
| L11 | Average time required to drive from residence to administrative agency (e.g., city hall, ward office, community center) |
Table 5.
Reference for the assessment scale of the time duration.
| Divisions | Goals | Reference |
|---|---|---|
| Place of work/University | OECD: an average of 28 min Korea: an average of 60 min | DNEWS [34] |
| Transit transfer | An average of 8 min on weekdays An average of 9 min on weekends | TS [35], DSI [36] |
| Subway Station/Bus Stop | An average of 10 min | Seoul [37] |
| Arterial Highway | Current level: 20 min Required level: 10 min | ICEE [38] |
| Highway Inter Change (IC) | National target: 30 min Desired: 17.7 min Actual: 23.5 min | MOLIT [39], KRIHS [40] |
| Express bus terminal/Train station | Train Station: 35 min Bus Terminal: 33 min | KOTI [41] |
| Airport | International Airport: 90 min Domestic Airport: 45 min | KOTI [42] |
| Power outage recovery | Current level: 40 min Required level: 30 min | ICEE [38] |
| Internet access and call loss recovery | Current level: 30 min Required level: 15 min | ICEE [38] |
| Elementary school | 30 min on foot | Appendix 1 of the Enforcement Rule of the Education Environment Protection Act [43] |
| Middle/High school | 30 min by public transport | |
| Living infrastructure (child/elderly care, medical, parking lots, sports etc.) | An average of 10 min | Office for Government Policy Coordination, Steering Group of Living SOC [44], KRIHS [4] |
| Administrative agency | Current level: 30 min Required level: 25 min | ICEE [38] |
Table 6.
Example of measurement scale (ex. Average duration required to drive from residence to airport).
Table 6.
Example of measurement scale (ex. Average duration required to drive from residence to airport).
| Scale | 1 | 2 | 3 | 4 | 5 |
|---|---|---|---|---|---|
| Current Level | More than 120 min | 105 min | 90 min | 75 min | Within 60 min |
| Required Level | More than 120 min | 105 min | 90 min | 75 min | Within 60 min |
Table 7.
Design of the questionnaire.
| Division | Contents | Scale |
|---|---|---|
| residential environment |
| Likert six-point scale |
| infrastructure service level |
| Likert six-point scale or duration |
Table 8.
Survey overview.
| Division | Contents |
|---|---|
| survey target | Residents between the age of 20 to 69 years |
| sample size | 12,500 |
| sampling method | Proportional allocation by region, gender, age |
| data collection method | online panel survey |
| survey period | 28 September 2020–12 October 2020 (15 Days) |
| analysis tool | The collected data was passed through the Editing–Coding–Key in programming process and analyzed using SPSS for Windows |
Table 9.
Characteristics of respondents.
| Division | Frequency | % | |
|---|---|---|---|
| gender | male | 6346 | 50.8% |
| female | 6154 | 49.2% | |
| age | 20s | 2287 | 18.3% |
| 30s | 2335 | 18.7% | |
| 40s | 2787 | 22.3% | |
| 50s | 3797 | 30.4% | |
| 60s | 1294 | 10.4% | |
| job | agriculture, forestry, fishery | 103 | 0.8% |
| professional, office worker, civil servant | 5911 | 47.3% | |
| service workers, simple labor workers | 1821 | 14.6% | |
| self-employed | 1110 | 0.0% | |
| students (college and graduate students) | 564 | 8.9% | |
| houseworkers | 1602 | 4.5% | |
| others | 1388 | 12.8% | |
| city size | metropolis | 8713 | 11.1% |
| small- and medium-sized regions | 3787 | 30.3 | |
| Total | 12,500 | 100.0 | |
Table 10.
Correlation between “Satisfaction with Life” and “Satisfaction with Residence”.
| Division | Safety/Security | Convenience | Comfort | Life Satisfaction |
|---|---|---|---|---|
| safety/security | 1 | 0.512 ** | 0.571 ** | 0.450 ** |
| convenience | 1 | 0.465 ** | 0.431 ** | |
| comfort | 1 | 0.492 ** | ||
| life satisfaction | 1 |
** p < 0.05.
Table 11.
Regression analysis between “Overall Satisfaction” and “Performance of Infrastructure”.
| Research Hypothesis | Unstandardized Coefficients | Standardized Coefficients (β) | t | ||
|---|---|---|---|---|---|
| Dependent Variable | Independent Variable | B | Standard Error | ||
| infrastructure satisfaction | usability | 0.301 | 0.026 | 0.317 | 11.751 *** |
| accessibility | 0.226 | 0.024 | 0.248 | 9.425 *** | |
| safety | 0.157 | 0.008 | 0.151 | 18.602 *** | |
| recoverability | 0.218 | 0.008 | 0.211 | 27.576 *** | |
*** p < 0.01.
Table 12.
Correlation between “Residence Satisfaction” and “Satisfaction with infrastructure sectors”.
Table 12.
Correlation between “Residence Satisfaction” and “Satisfaction with infrastructure sectors”.
| Division | T | W | E | TC | WE | L |
|---|---|---|---|---|---|---|
| Residence satisfaction | 0.494 ** | 0.366 ** | 0.371 ** | 0.350 ** | 0.356 ** | 0.455 ** |
** p < 0.05.
Table 13.
Infrastructure service level and need for improvement of the infrastructure sectors of Korea.
Table 13.
Infrastructure service level and need for improvement of the infrastructure sectors of Korea.
| Division | Korea | T | W | E | TC | WE | L |
|---|---|---|---|---|---|---|---|
| infrastructure service level | 89.2 | 86.8 | 91.0 | 90.1 | 89.3 | 90.7 | 87.3 |
| need for improvement | 62.7 | 59.0 | 64.4 | 64.0 | 64.9 | 66.2 | 57.9 |
Table 14.
Comparison of quantity (Stocks) and quality (Needs) of transportation.
| Regions | Infrastructure. Service Level (%) (Needs) | Road Length per Land Area (km/km2) (Stocks) |
|---|---|---|
| Seoul | 85.9 | 13.7 |
| Busan | 86.6 | 4.4 |
| Deagu | 89.2 | 3.2 |
| Incheon | 87.0 | 3.0 |
| Gwangju | 92.1 | 3.7 |
| Daejeon | 88.6 | 4.0 |
| Ulsan | 88.7 | 2.0 |
| Sejong | 83.9 | 0.9 |
| Gyeonggi | 84.5 | 1.3 |
| Gangwon | 86.2 | 0.6 |
| Chung-buk | 91.5 | 0.9 |
| Chung-nam | 85.7 | 0.9 |
| Jeon-buk | 89.3 | 1.1 |
| Jeon-nam | 90.0 | 0.9 |
| Gyeong-buk | 88.1 | 0.7 |
| Gyeong-nam | 87.7 | 1.2 |
| Jeju | 94.5 | 1.7 |
red (low) → green (high).
Publisher’s Note: MDPI stays neutral with regard to jurisdictional claims in published maps and institutional affiliations. |
© 2022 by the author. Licensee MDPI, Basel, Switzerland. This article is an open access article distributed under the terms and conditions of the Creative Commons Attribution (CC BY) license (https://creativecommons.org/licenses/by/4.0/).
Share and Cite
MDPI and ACS Style
Lee, S. Infrastructure Service Assessment Model Based on a Service Quality Gap Model—Focused on South Korea. Sustainability 2022, 14, 577. https://doi.org/10.3390/su14010577
AMA Style
Lee S. Infrastructure Service Assessment Model Based on a Service Quality Gap Model—Focused on South Korea. Sustainability. 2022; 14(1):577. https://doi.org/10.3390/su14010577
Chicago/Turabian StyleLee, Seulki. 2022. "Infrastructure Service Assessment Model Based on a Service Quality Gap Model—Focused on South Korea" Sustainability 14, no. 1: 577. https://doi.org/10.3390/su14010577
Note that from the first issue of 2016, this journal uses article numbers instead of page numbers. See further details here.