Article

Social Network Relationships between Biomass Industry Stakeholders in the Agricultural Waste Power Generation Industry—A Case of Northern Jiangsu, China

1
Department of Environmental Science and Engineering, Fudan University, Shanghai 200433, China
2
Fudan Tyndall Centre, Fudan University, Shanghai 200433, China
*
Author to whom correspondence should be addressed.
Sustainability 2022, 14(1), 571; https://doi.org/10.3390/su14010571
Submission received: 3 December 2021 / Revised: 2 January 2022 / Accepted: 3 January 2022 / Published: 5 January 2022

Abstract

:
This study aimed to explore the impact of the interaction between stakeholders in the sustainable development of the biomass industry and to reveal network issues relating to material flow and information flow under the current biomass energy development model. This study focused on the agriculture and forestry waste power generation industry. Taking the biomass industry in Nanjing, Suqian, and Yancheng as examples, the study selected six stakeholder groups involved in the industry and conducted field investigations by using semi-open interviews and questionnaires. The research mainly applied social network analysis methods, combined with UCINET software, to draw a network diagram of the stakeholder relationships and to quantitatively analyze stakeholder centrality and overall network density. The results revealed that (1) the biomass enterprises had the highest centrality in the overall network, which played a vital role in the construction of the overall network; (2) the farmers were positioned at the outer fringes of the industrial social network and their information acquisition capabilities and degree of control over the network were the lowest; and (3) the overall network density was low, which showed that the connections between stakeholders were not close enough to support the circulation of material and information in the overall network.

1. Introduction

China has abundant biomass resources and great development potential. The total amount of biomass that can be used for resource utilization each year is approximately equal to 460 million standard coal [1]. Entering the “14th Five-Year Plan” stage (2021–2025), with the introduction of a series of policies, such as carbon peaking, carbon neutrality, green growth, and rural revitalization strategies, the market potential of China’s rural biomass energy industry has been enhanced [2].
At present, research concerning the problems of power generation from agricultural and forestry waste in China has mainly concentrated in the fields of economics, policies, regulations, and technology [3,4,5,6]. Wang Siyi, Guo Jiao, and others analyzed the subsidy policy for the agricultural and forestry waste power generation industry and found that the current subsidy policy has limitations in promoting the net profit of the industry and the net profit of its participants [7,8,9]. Zhang Shengyi and others analyzed the advantages and disadvantages of the development of China’s agricultural and forestry waste power generation industry and found that problems remain, such as unreasonable industrial layout and lack of efficiency in the supply chain [10,11]. In fact, a significant part of the above problems is caused by the inactive and insufficient participation of stakeholders in industry-related work. However, few studies have focused on the social factors (e.g., social systems, social groups, social interactions, ethics, national laws, public opinion, and customs) that affect industrial development. Up to now, many studies have used social network analysis methods to explore the relationship and mutual influence between social factors (including users). This type of research has mainly been concentrated in the fields of education and business [12,13]. In the field of ecological environment, social network analysis can also be applied for carbon capture technology cooperation and inter-provincial cooperation research on carbon emissions control [14,15], Wang Wenting and others used social network analysis methods to study industry–university–research cooperation in the energy storage industry and provided suggestions on the current cooperation model based on the research results [16]. The social network analysis method is also used internationally to analyze ecological compensation projects [17], the overall network impact of actors involved in water governance [18], and the collaborative governance analysis of the food–energy–water relationship [19]. In the field of energy research, studies also attempted to apply social networks to explore the impact of stakeholders on building energy efficiency [20] and to analyze potential stakeholders of a new type of biofuel in Europe [21,22]. So far, the application of social network analysis methods remains unexplored for the agricultural and forestry waste power generation industry in the bioenergy industry, especially for the discussion of China’s biomass industry and its problems. The development of China’s biomass industry is greatly affected by conditions in the rural areas. Therefore, analyzing the functional characteristics and proximity of industrial stakeholders in the social network is of great significance for promoting the circulation of industrial social resources and sustainable development [23].

2. Methodology

This study applied social network analysis methods, took the agricultural and forestry waste power generation industrial chain in the bioenergy industry as the research object, and focused on revealing the impact of the interaction between stakeholders on the sustainable development of the industry. From the calculation of stakeholder centrality and the analysis of the social network structure, the results reflected the impact of the proximity of the network on the development of the industry and motivated policy recommendations.
This study selected Suqian, Yancheng, and Nanjing in Jiangsu Province as case cities and applied social network analysis methods to study the impact of stakeholders in the bioenergy industry on industrial development. The concept of stakeholders refers to groups or individuals that can influence the realization of a goal or are affected by it [24]. The research object was the agricultural and forestry waste power generation industry chain in the bioenergy industry. The research divided the stakeholder groups of the industry into governments, research institutions, associations, biomass enterprises, brokers, and farmers [25,26].
The advantages of utilizing the social network analysis method used in this study can be summarized as follows:
(1) The social network analysis provides a powerful set of quantitative chart indicators for understanding the relationships between the network and the individuals and groups in it. It includes aggregate network indicators, such as network density, diameter, reciprocating vertex contrast ratio, and the number of connected components, which characterize the network as a whole.
(2) The network indicators help to determine who is the most important or core and closely connected subgroup of people in the network (i.e., network clusters) and the overall network structure (such as the density of the network).

2.1. Social Network Analysis Method

2.1.1. Method of Analyzing the Network Density, Cohesive Subgroups, and Structural Holes

The social network analysis method is able to clarify social structures between interdependent social roles, and to apply symbolic graphics or measurement models in order to reveal hidden networks of relationships, thereby exposing the theoretical motives hidden under social relationships that lead to unsustainable industrial development [24,27]. The analysis of network density, cohesive subgroups, and structural holes is a significant part of accessing the structure of social networks.
(1) Network density. The network density index mainly reflects the proximity of the connections between members in the overall network [28]. The higher the network density, the higher the compactness of the network, and the information circulation in the network will also have a greater impact on the decision making and behavior of members [29]. According to the different interaction methods of participants, there are two drawing methods: undirected network diagram and directed network diagram. The calculation formula for the network density of these two network diagrams are as follows [30]:
f = m n ( n 1 ) / 2
z = m n ( n 1 )
In these formulas, f represents the density of the undirected network diagram, z represents the density of the directed network diagram, m represents the actual number of relationships contained in the network, and n represents the number of participants in the network.
(2) Condensing subgroups. Condensed subgroups disperse the overall network into several small groups. When the overall network is more complex, it is easier to observe which participants have stronger homogeneity and reciprocity [31]. In this study, faction analysis was mainly conducted on the industrial social network, where a faction is a cohesive subgroup based on mutual benefit.
(3) Structural holes. Structural holes refer to vacancies in social networks and suggest there is a connection, but not a direct connection, between two individuals in the network. At this time, there is a gap between the two, and the position of the third party connecting the two in their relationship network is a structural hole. These roles among other members can also be referred to as a “middleman” responsible for disseminating information to other roles.

2.1.2. Method of Analyzing the Centrality in Accessing the Structure of Social Networks

“Centrality” is the main point of the social network analysis method [32]. To discover the most central stakeholders in an industrial network is to find out who can undertake the important material flow and information flow transmission task in the industrial network. It can also strengthen the interaction between the most marginal stakeholders of the network and other members so that marginal stakeholders can more intensively participate in the tasks of industrial development. In the method of analyzing the centrality of different stakeholders in the industrial network, three indicators need to be evaluated:
(1) Point centrality. Point centrality refers to the number of other nodes directly connected to a node, where the related formula is as follows [32]:
Absolute   point   centrality :   C AD ( x )
Relative   point   centrality :   C RD ( x ) = ( x   indegree + x   outdegree ) ( 2 n 2 )
In these formulas, C AD ( x ) represents absolute point degree centrality, C RD ( x ) represents relative point degree centrality, x represents actors, and n represents the network scale.
(2) Betweenness centrality. If an actor is the shortest distance for many other members, it means that the member has the highest centrality [32]. The betweenness centrality can also be used to analyze the extent to which members occupy structural holes. The “middleman” introduced in the structural hole concept refers to the member with the highest betweenness centrality in the network [29]. The calculation formula of this indicator is as follows:
Absolute   betweenness   centrality :   C ABi = j n k n b jk ( i )
Relative   betweenness   centrality :   C RBi = 2 C ABi n 2 3 n   + 2
In these formulas, C ABi represents the absolute betweenness centrality;   C RBi represents the relative betweenness centrality; n represents the network scale; i, j, and k represent actors (i ≠ j ≠ k); b jk ( i ) represents that i can control the interaction between j and k; and b jk ( i ) = g jk ( i ) / g jk , where g jk represents the number of shortcuts between actor j and actor k and g jk ( i ) represents the number of shortcuts that exist between actor j and actor k through the third actor i.
(3) Closeness centrality. Closeness centrality is used to measure the degree to which a member is not controlled by others. It refers to how close the member is to the center of the network, and it can also mean how close the member is to other members [29]. The calculation formula is as follows:
Absolute   closeness   centrality :   C APi 1 = j = 1 n d ij
Relative   closeness   centrality :   C RPi = n 1 C APi 1
In these formulas, C APi represents the absolute closeness centrality, C RPi represents the relative closeness centrality, i and j represent actors, n represents the network scale, and d ij represents the shortcut distance between actor i and actor j (that is, the number of connecting lines included in the shortcut).
This study mainly used UCINET software to organize the relevant data obtained through research into a relational matrix, create an algorithm using Formulas (1)–(8) above, and automatically calculate the results. UCINET is powerful social network analysis software. It was originally written by Professor Linton Freeman from the University of California, Irvine, who is also the pioneer of social network research. This software has been widely used in the research of social network analysis methods [33,34]. This study used the latest UCINET6 software to analyze the 6 types of stakeholder relationships involved in the case of the biomass industry, which was innovative.

2.2. Data Collection Method

Data collection mainly involved questionnaire surveys combined with semi-structured interviews. Through semi-structured face-to-face interviews with each stakeholder, a combination of quantitative (data collection on contact frequency) and qualitative (open-ended questions for industry development suggestions) was used. Before conducting the field investigation, the ideas and sequence of contacting the interviewed units shown in Figure 1 were utilized.
By applying the above methods, the survey of 4 counties and 15 towns in Nanjing, Suqian, and Yancheng was completed from 6 to 20 January 2021, and the relevant data were collected. The stakeholder groups participating in the questionnaire survey and interviews included governments (provincial, municipal, township), associations, research institutions, biomass enterprises, brokers, and farmers. The specific list of interviewed units was recommended and obtained by the relevant departments of the Jiangsu provincial and municipal governments. A total of 101 valid questionnaires were collected during the field investigation. The detailed survey location, unit, and interviewee information are shown in Appendix A (Table A1 and Table A2).
In addition to the aforementioned interviewed units, a total of 3 cities, 4 counties, and 15 towns were visited during the field investigation. Among them, the counties and towns were mainly located in Suqian and Yancheng. In the process of the township surveys, the stakeholders interviewed mainly consisted of brokers and farmers. Among them, there were 7 brokers and 83 farmers. Each broker is responsible for the smashing, bundling, and transportation of straw in 2–3 towns (each person is responsible for 20,000 acres of farmland). The average amount of straw transported by the broker can reach about 5000 tons per year.

3. Research Results and Discussion

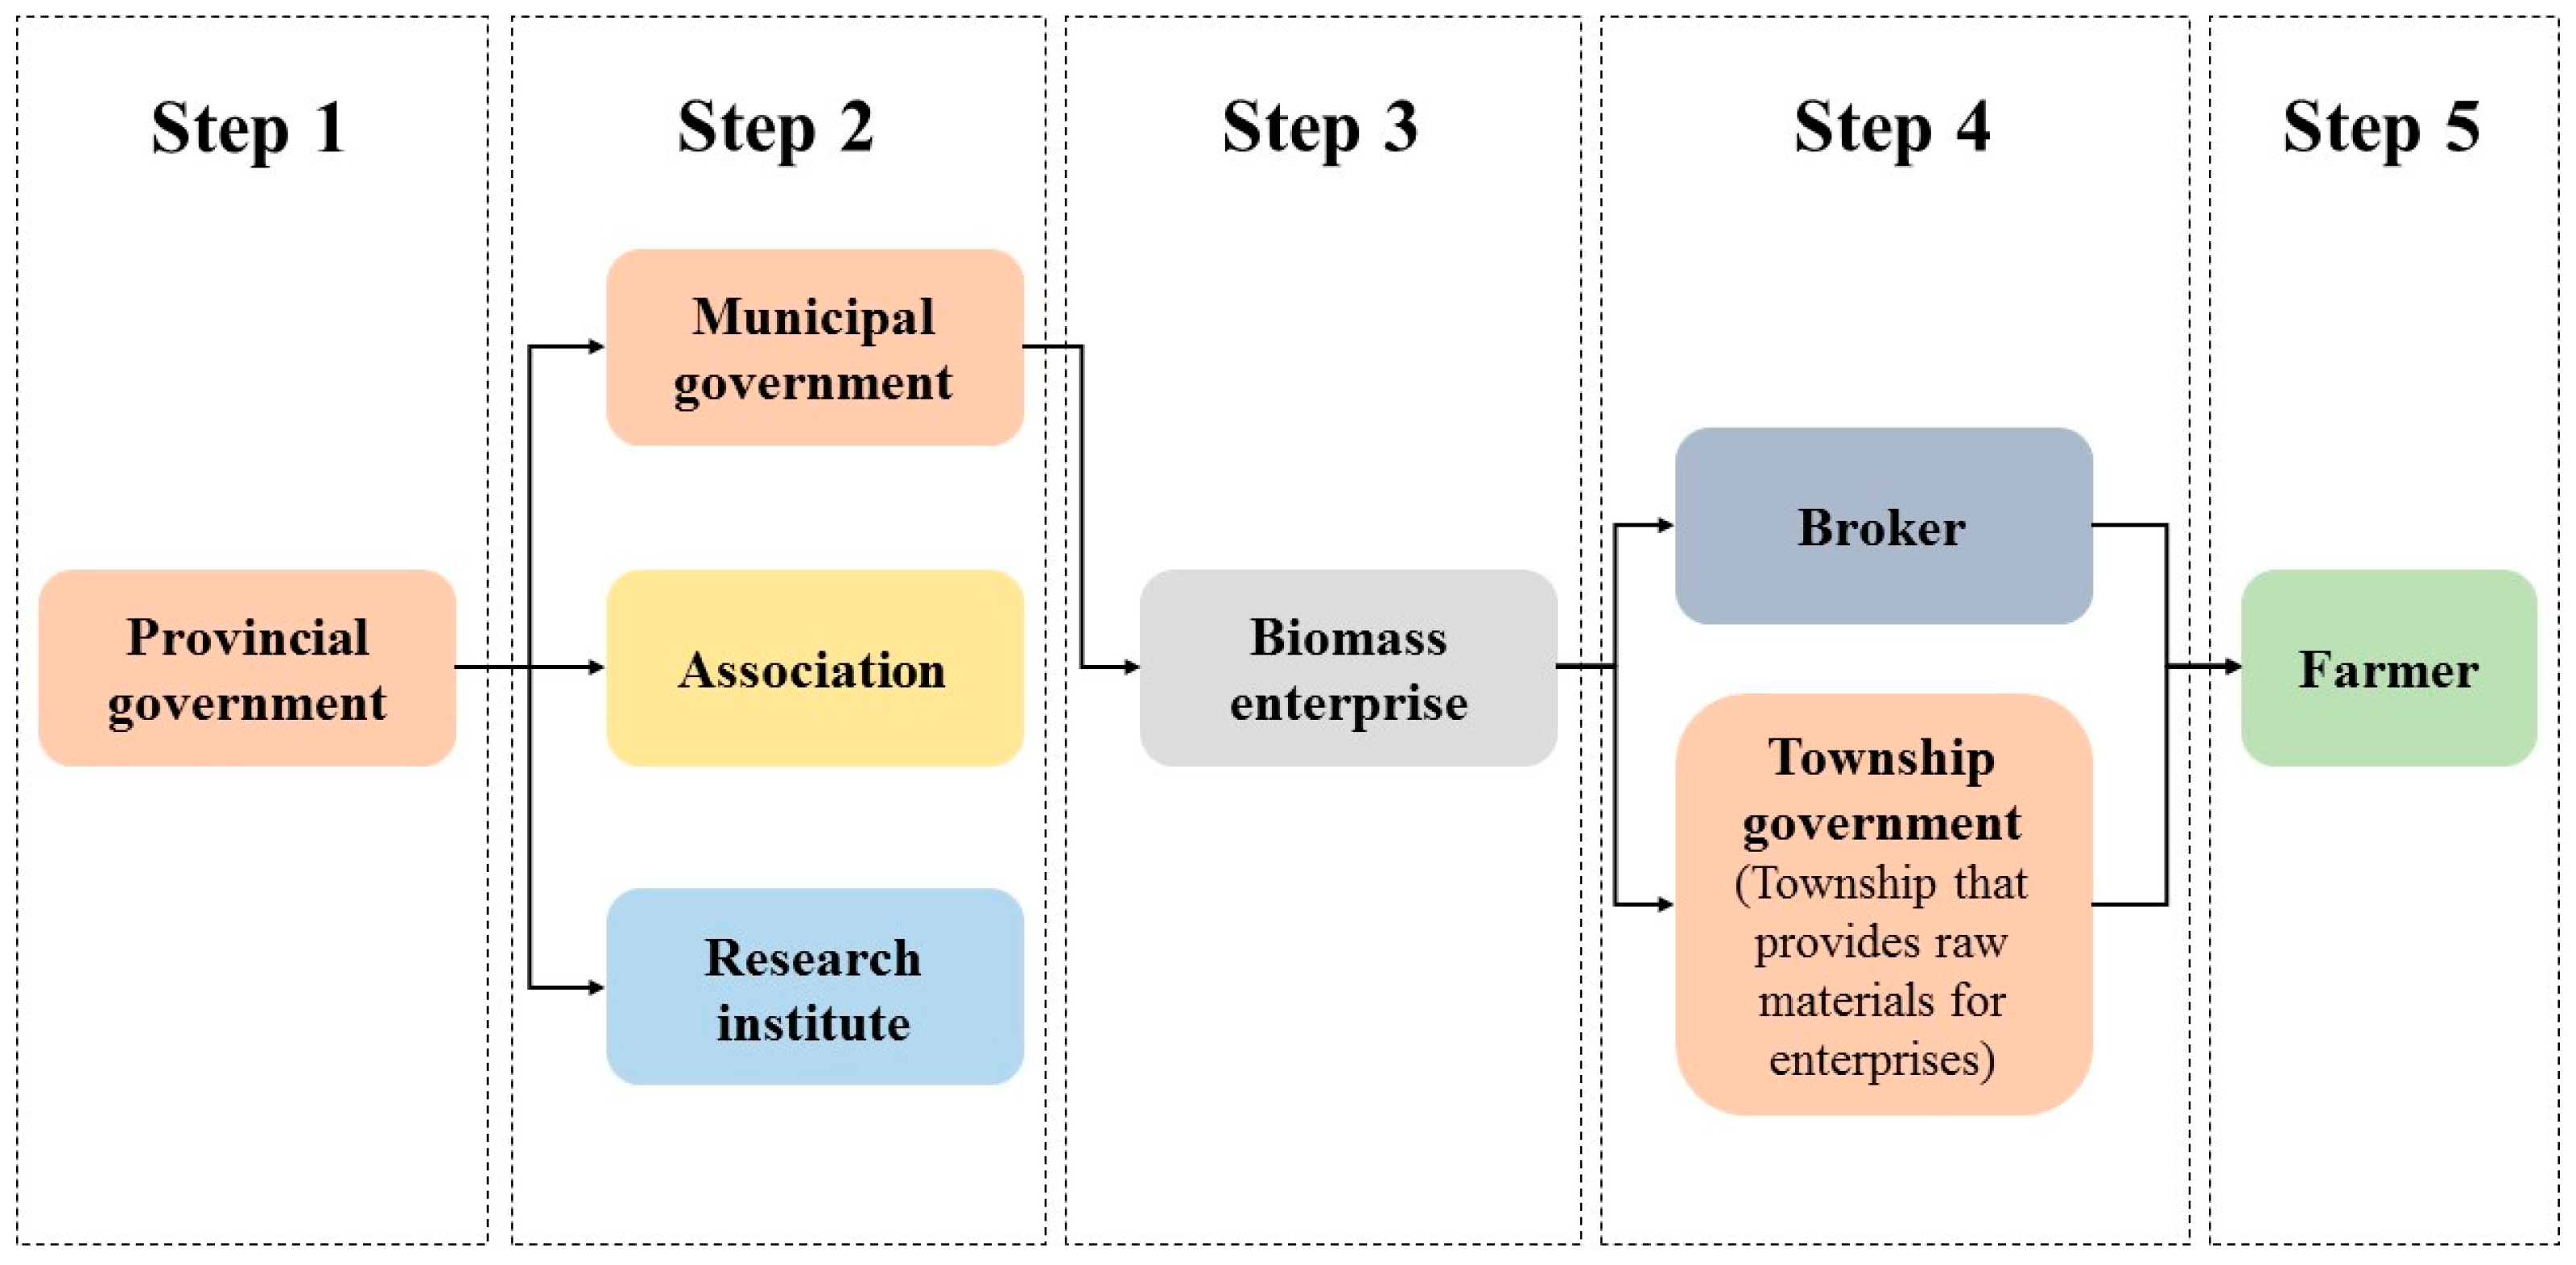
3.1. Case Introduction

This study selected the northern part of Jiangsu Province in the Yangtze River Delta region of China as a research case. Jiangsu Province is a major economic province, as well as a major agricultural province. The annual sown area of crops is more than 7.3 × 10⁴ km2, and the annual output of straw is more than 40 million tons, ranking fourth in the country in terms of resources. The province’s straws are mainly rice, wheat, rapeseed, and corn stalks, which account for more than 80% of the total straw resources. The total amount of straw resources in Jiangsu Province gradually increases from south to north. The southern, central, and northern regions account for 15.1%, 27.2%, and 57.7% of the province’s total, respectively [35]. As of 2020, the total installed capacity of agricultural and forestry biomass power generation in Jiangsu Province will reach 520,000 kW. The case city of Suqian is the largest biomass power generation industrial base in Jiangsu Province [36]. As of January 2021, Yancheng has built nine biomass power plants with a total installed capacity of 210,450 kW [37]. The annual output of crops in Yancheng City and Suqian City accounted for 45.22% of the entire northern region, and the sown area of crops accounted for 44.73% of the entire northern region. In terms of raw materials, the two case cities in northern Jiangsu selected for this study have obvious development advantages. For our study, the research case city also included Nanjing, where important government departments, research institutions, and industry associations are located.
The research involved six types of stakeholders (Table 1) and analyzed the characteristics and influence of each stakeholder in the industrial social network.

3.2. Stakeholder Network Index Analysis

This part of the research was carried out by using the UCINET6 software. Before the analysis, the collected data on the interaction frequency of stakeholders was integrated into a collaborative matrix code, as shown in Table 2. Among them, the stakeholders corresponding to S1–S6 were the governments (S1), research institutions (S2), industry associations (S3), biomass enterprises (S4), brokers (S5), and farmers (S6). As an element in the matrix, S[i, j] represents the frequency of contact between stakeholder i and stakeholder j. The value “0” indicates that the node did not actively establish an interactive relationship with other nodes, and “1–5” indicated the intensity of interaction between nodes; the higher the number, the higher the intensity, indicating that the relationship between the two nodes is closer.
It is worth noting that the stakeholders in this study were a collection of groups rather than independent individuals. To facilitate the calculation of centrality and the drawing of network diagrams, each stakeholder group was regarded as a node. That is, the interaction relationship within each group was not considered; therefore, the diagonal data in Table 2 was set to 0.
Centrality is the key content of the social network analysis methods. In this study, it was mainly used to analyze the degree of centrality of different stakeholders in the social network so as to deduce which stakeholder played a vital role in the material flow and information flow of the industry.

3.2.1. Point Centrality

The number of stakeholders directly connected with a certain stakeholder is the point centrality of this stakeholder. As shown in Table 2, the collaboration matrix of stakeholders in the biomass energy industry was asymmetric. There was a difference between the frequency of contacts initiated by stakeholders and those received passively. Therefore, it was necessary to analyze the in-degree (passively received contact) and the out-degree (actively initiate contact). After inputting the relationship matrix into UCINET6, the following results were obtained (Table 3).
According to the above calculation results, the bioenergy enterprises (S4) had the highest number of in-degree or out-degree among all stakeholders, and their various indicators were significantly higher than other stakeholders. The number of direct connections between other stakeholders and bioenergy enterprises was also the largest. Therefore, enterprises played a key role in the circulation of information in the network. The governments (S1), as policymakers, bore the responsibility of policy formulation and policy publicity. However, it can be seen from Table 3 that its point centrality degree was low, and the gap between in-degree and out-degree was the highest among all stakeholders. This shows that the interaction between the governments (S1) and other stakeholders was based on the active contact of other stakeholders, while the governments (S1) rarely actively established interactive relationships with other stakeholders.

3.2.2. Closeness Centrality

This research mainly used closeness centrality to reflect the proximity of a certain stakeholder to other stakeholders in the industry. The difference between closeness centrality and point centrality is that the calculation standard of closeness centrality is based on the shortcut distance between points, rather than only considering points that are directly connected. Before calculating the closeness centrality, the data in Table 2 had to be binarized, that is, change all the data greater than or equal to 1 in the matrix to 1, and then the binarized table was entered into the UCINET software. The calculation results are shown in Table 4.
In this calculation result, Farness represents the distance, and Closeness represents the proximity to other stakeholders; therefore, the closer the distance (the lower the data corresponding to Farness), the higher the closeness. From the calculation results, it can be seen that the closeness centrality of the enterprises (S4) was the highest, indicating that they were the least controlled by others in the industrial network and had a high degree of independence. Enterprises could also enhance the effectiveness of information transmission in social networks. The stakeholders farthest from the center were the farmers (S6), who were the weakest in terms of information resources and power control.

3.2.3. Betweenness Centrality

This indicator was mainly used to measure the degree of control of resources by a certain stakeholder in the industry, and the strength of the mediating effect played in the construction of social network relationships. The calculated results after entering the data are shown in Table 5.
According to the calculation results, it can be seen that biomass enterprises (S4) occupied the highest degree of centrality in the overall network, indicating that biomass companies (S4) were at the core of the network and controlled the information dissemination rights of the industrial network. The centralities of the industry associations (S2), research institutions (S3), and farmers (S6) were 0. This shows that these three stakeholders did not control other stakeholders in the industrial network and that they were also at the edge of the network.

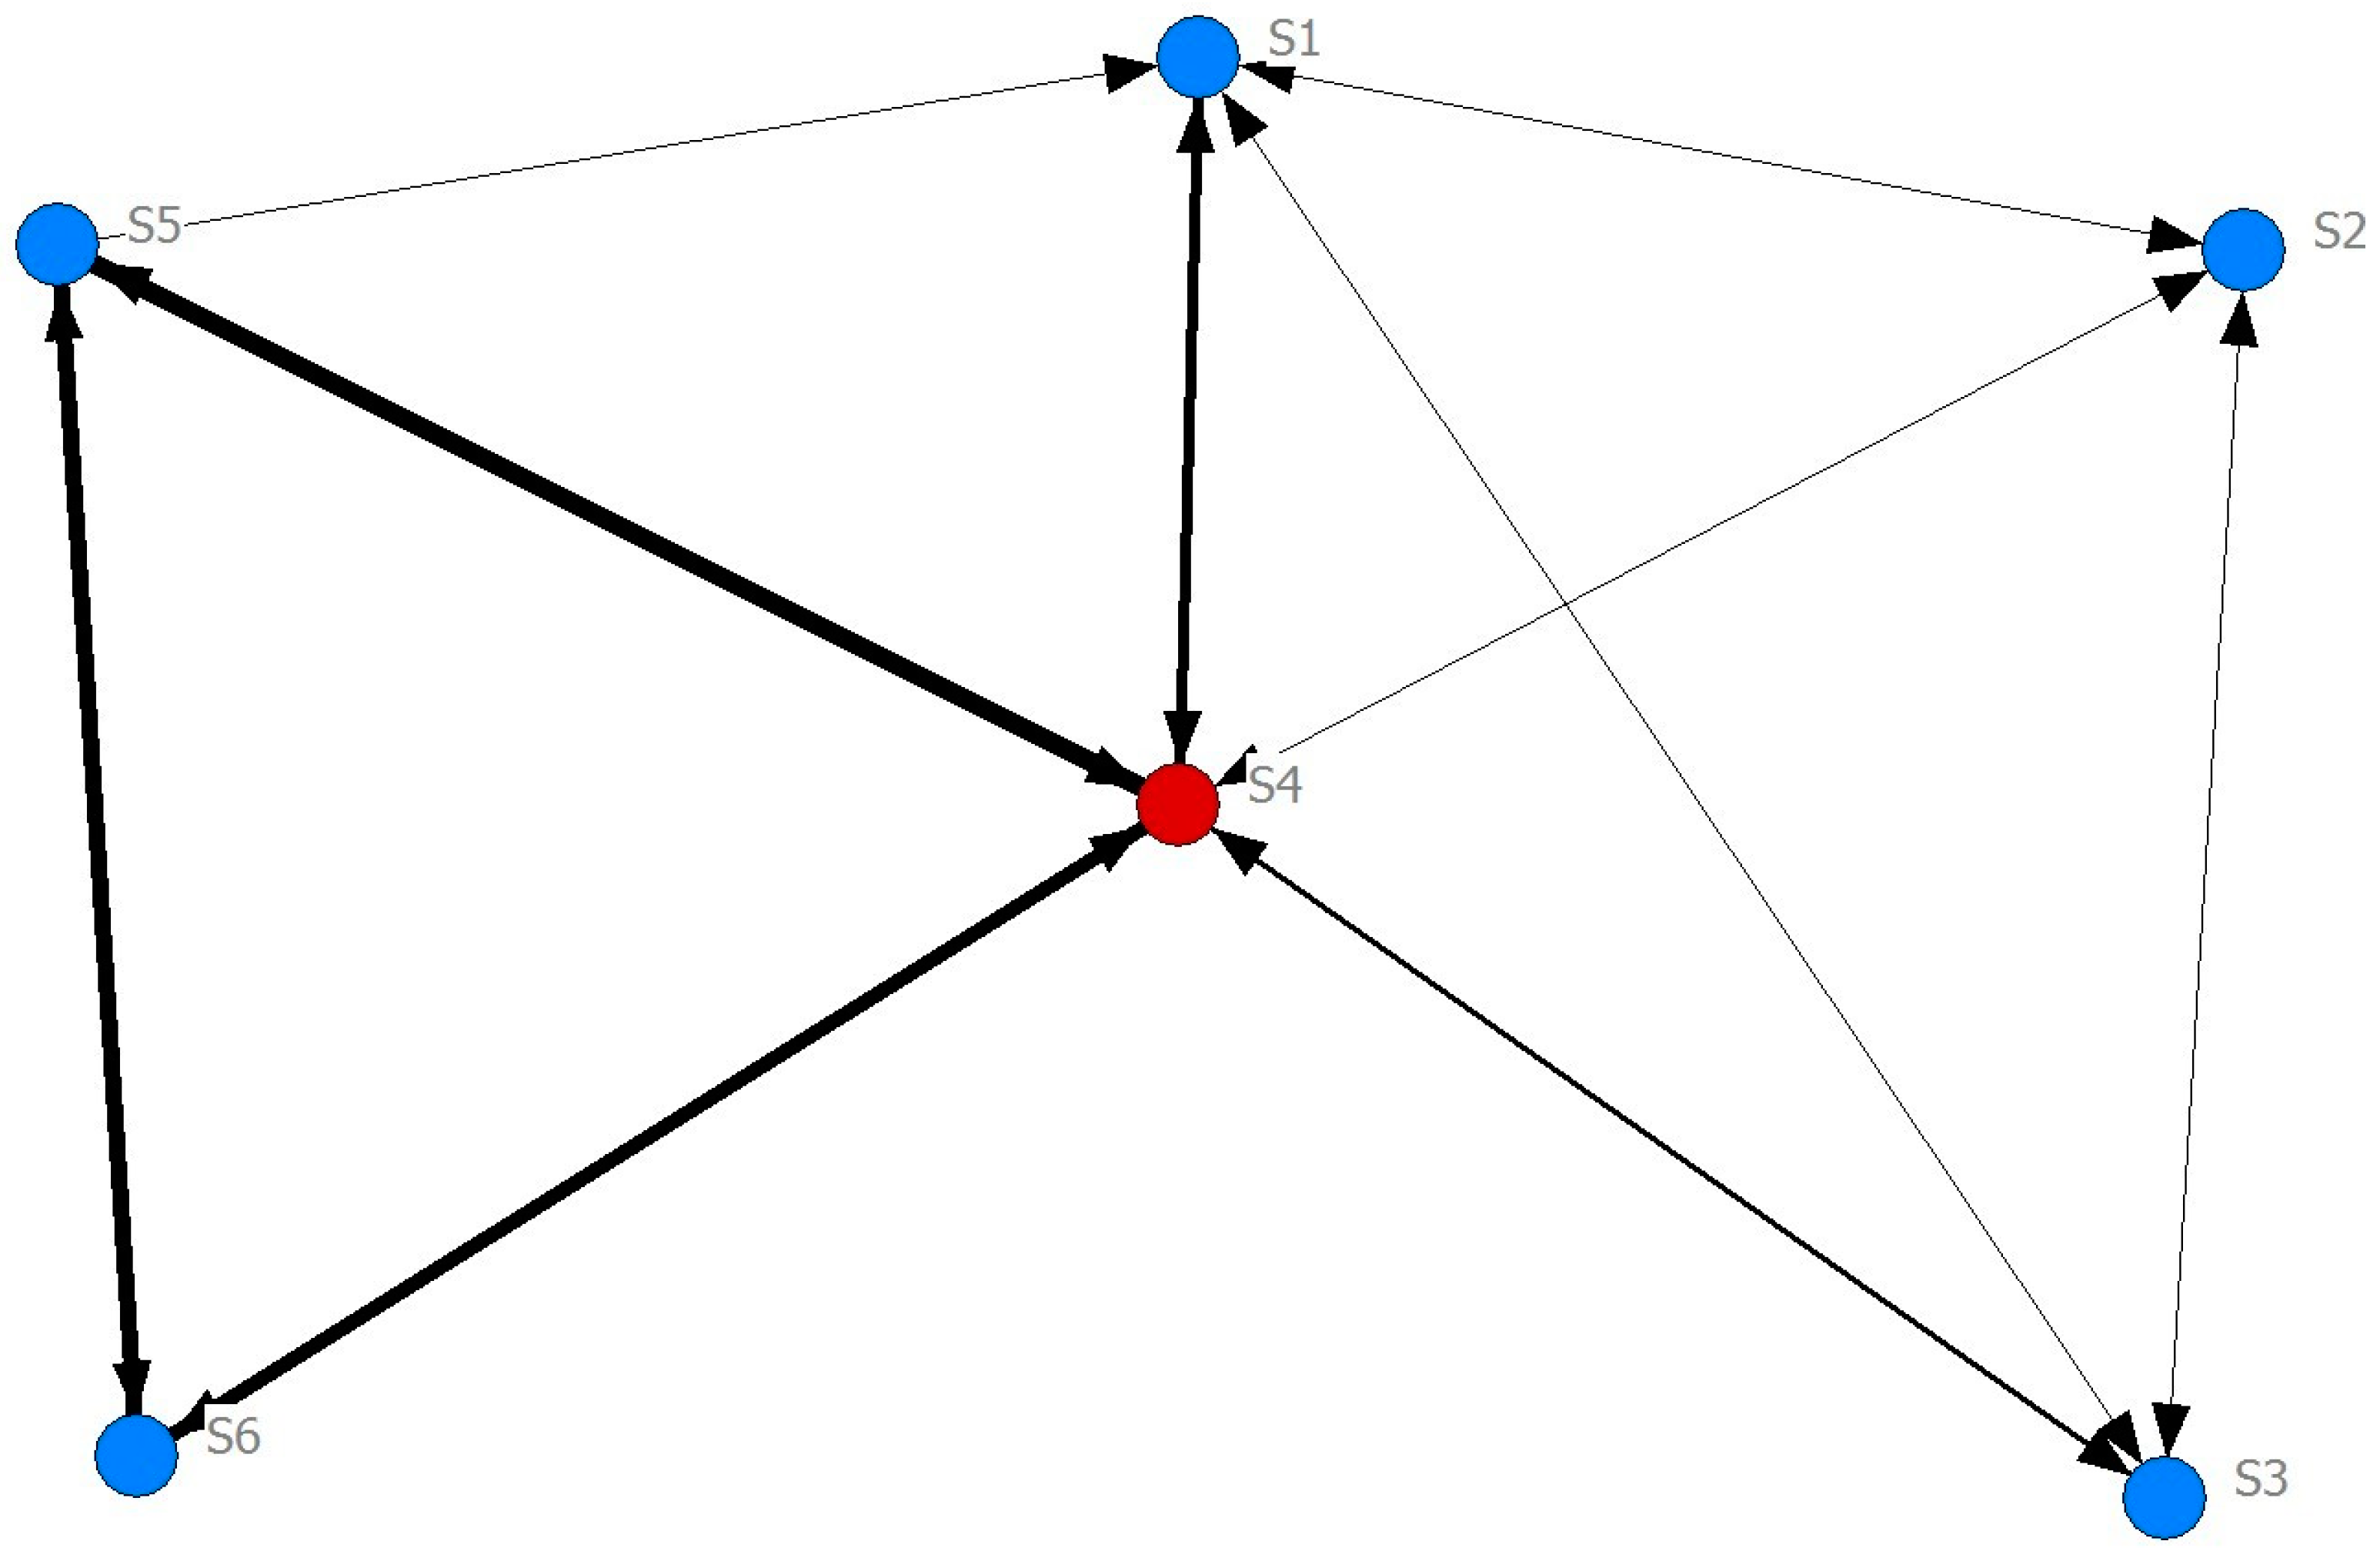
3.3. Social Network Structure Analysis

3.3.1. Network Density Analysis

Figure 2 shows the social network structure diagram as drawn by the Netdraw tool in the UCINET software. Among them, S1–S6 corresponds to the six stakeholder groups, and the thickness of the arrow represents the strength of the interaction relationship. From the social network diagram, we can intuitively see which stakeholders were more closely connected.
After inputting the binarized relationship matrix into UCINET, the standard value of the network density was calculated to be 0.4819, indicating that the network density was not close enough and the influence between stakeholders and the industrial social network was not high enough. Although it can be seen from the centrality data of each stakeholder that there were interactions between stakeholders, from the perspective of the overall industry network, the overall activity of the industry was not frequent. It can be seen from Figure 2 that the farmers (S6) and brokers (S5) had little contact with other stakeholders. The closeness of the network could be improved by strengthening the interaction between stakeholders so that policy information and the latest technical information can be shared by the whole network.

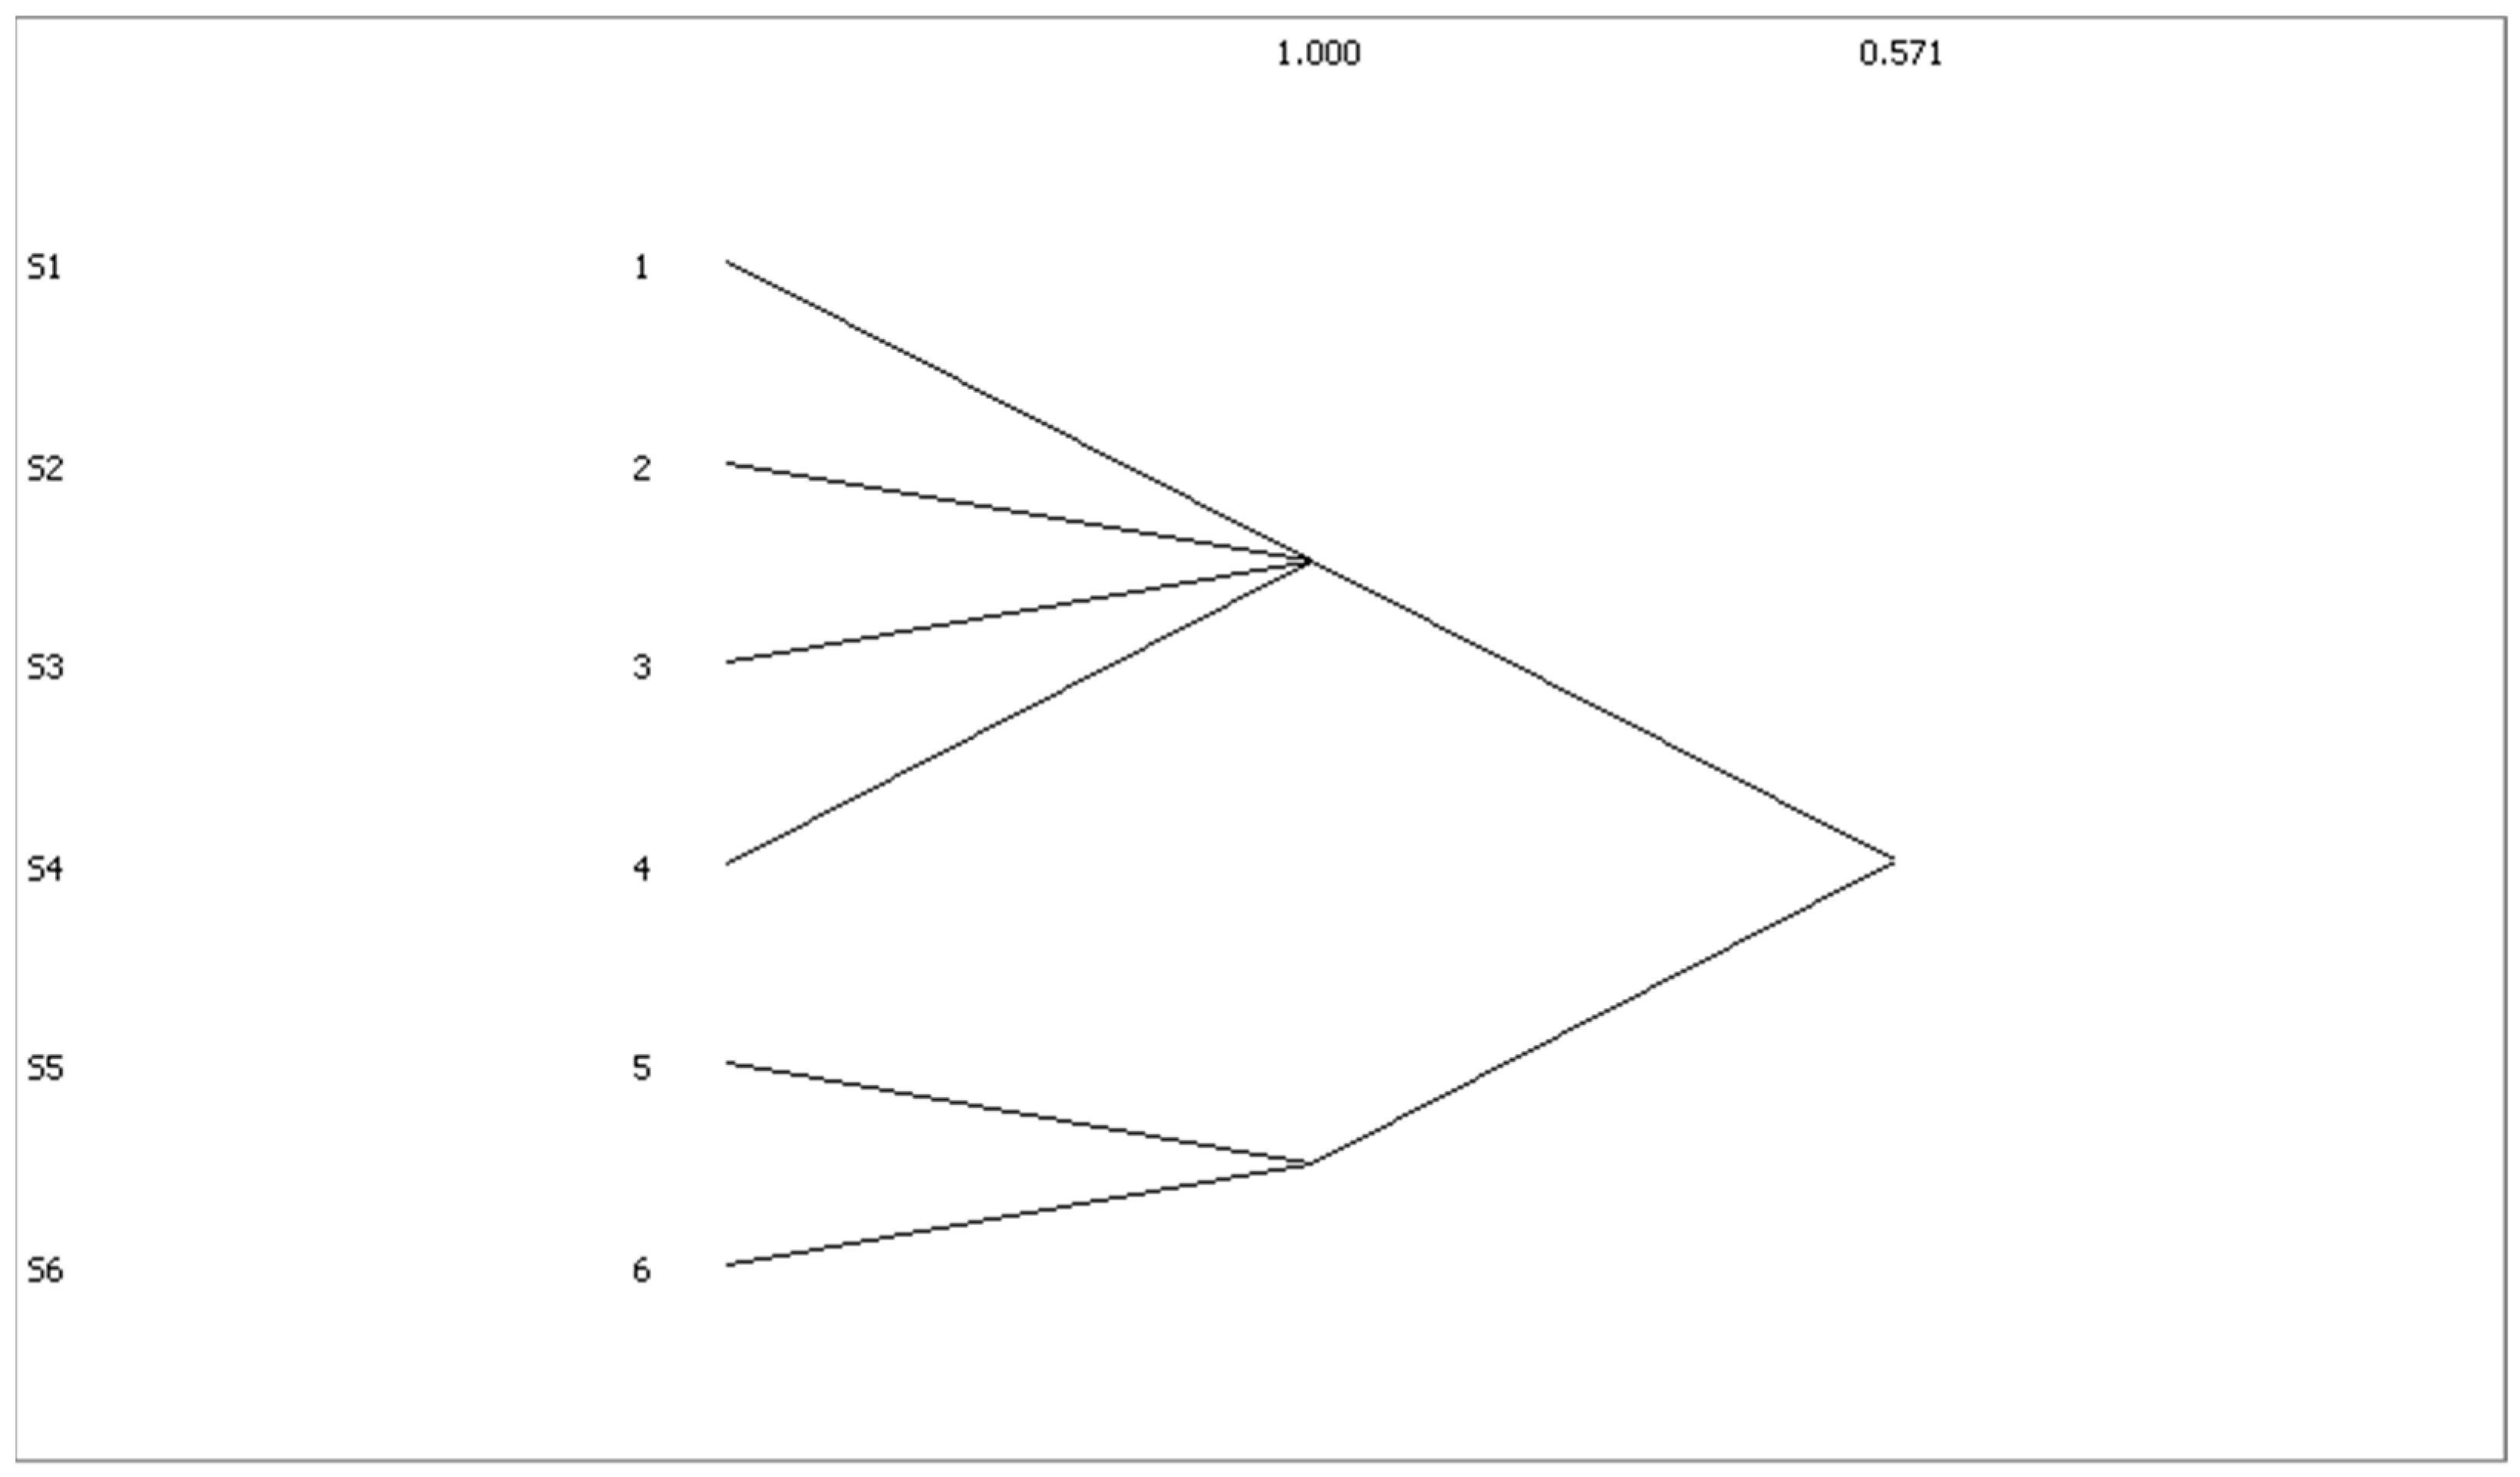
3.3.2. Condensed Subgroup Analysis

UCINET software was used to symmetrize the binary relationship matrix, which was then applied to the symmetric relationship matrix for clique analysis. In the same faction, there was a reciprocal relationship between members. In addition to the members of the same clique, adding any other member would change the reciprocal nature of the clique. The final operating results showed that stakeholders in the bioenergy industry were divided into two cliques. The first clique included the governments (S1), industry associations (S2), research institutions (S3), and bioenergy companies (S4); the second clique included the biomass companies (S4), brokers (S5), and farmers (S6). Figure 3 shows the composition of the two cliques and the degree of cohesion between the members. The results of the clique analysis also reflected the fact that farmers and brokers were excluded from the ranks of reciprocity in the first clique. As the main supplier of the material flow, the second clique had difficulty receiving the information transmitted by the first clique. Only by strengthening the mutually beneficial cooperation between the two cliques could the overall network achieve closeness.

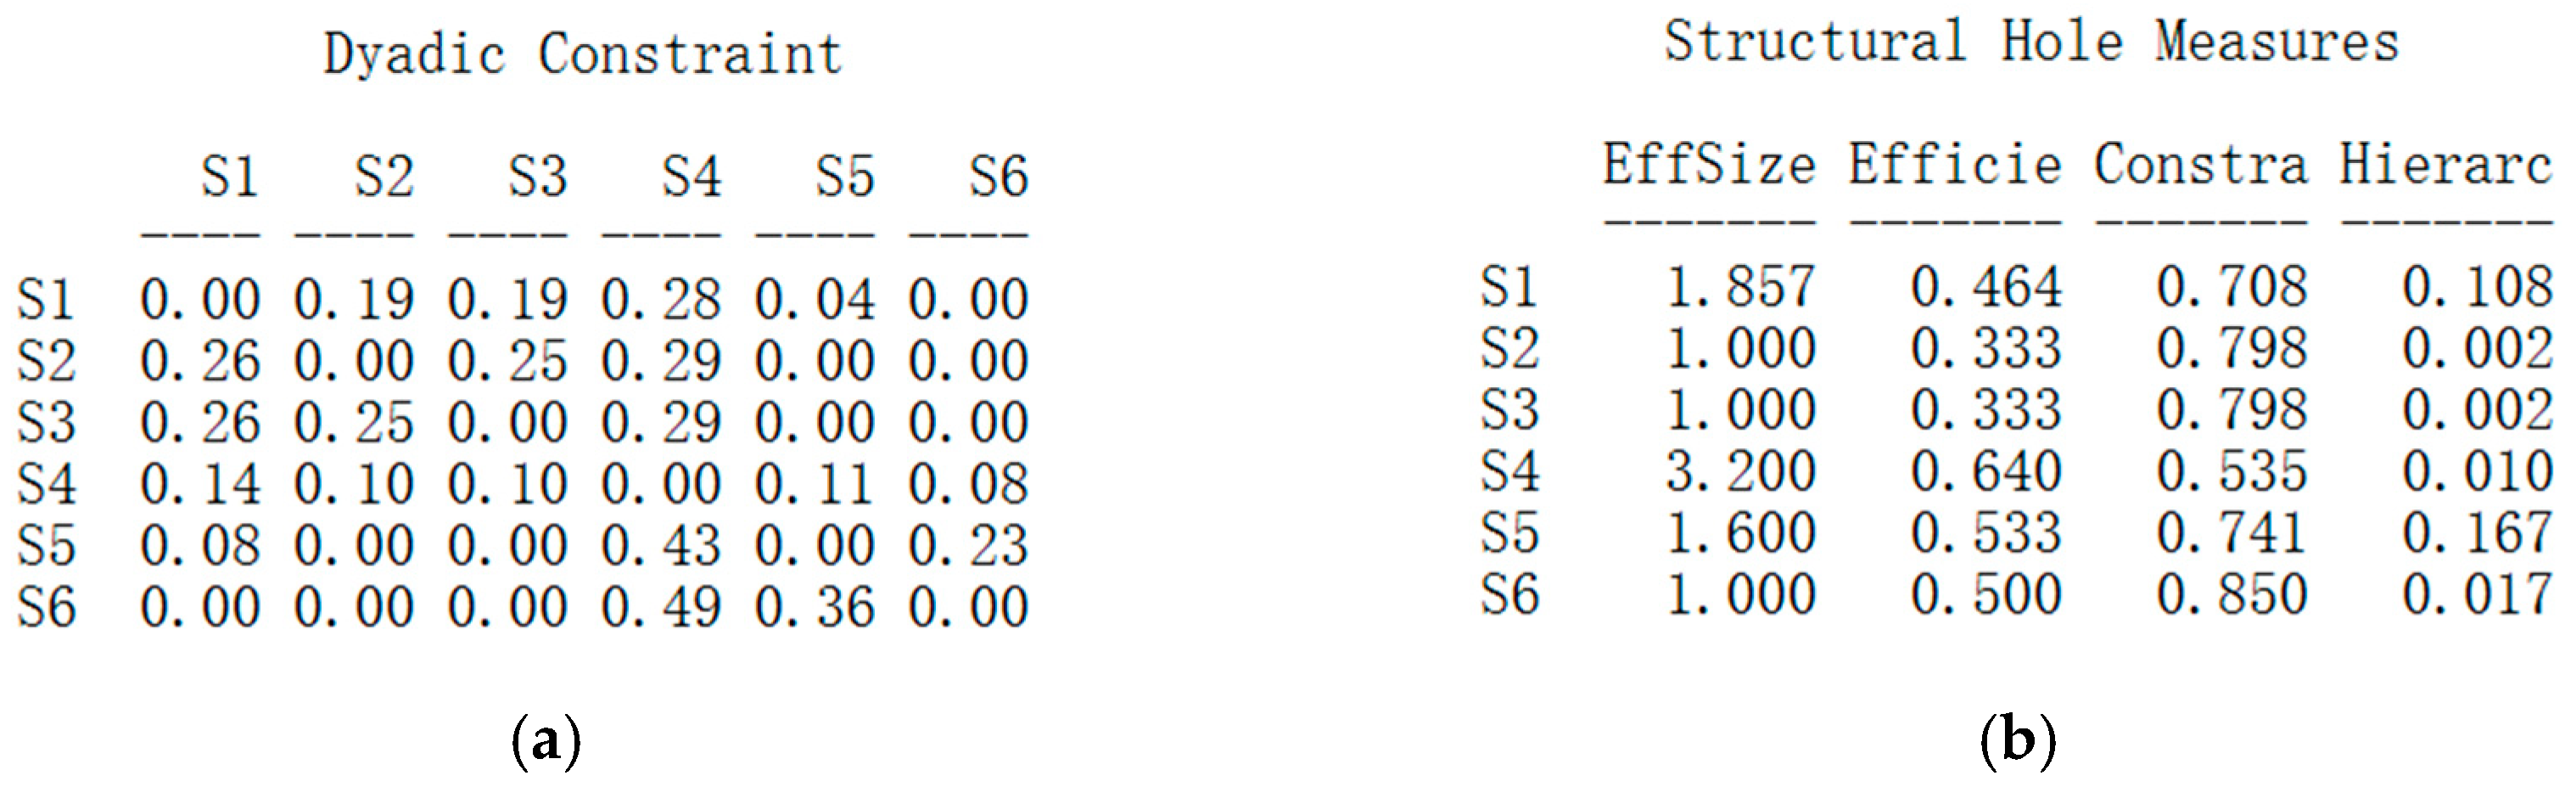
3.3.3. Structural Hole Analysis

There are four important indicators for analyzing the structural hole index of industrial social networks: effective size, efficiency, constraint, and hierarchy. The effective scale of an actor is equal to the size of the actor’s individual network minus the redundancy of the network. The efficiency of a point is equal to the ratio of the effective scale of the point to the actual scale. The “limitation” for a person refers to the person who has the ability to use structural holes in their own network. Hierarchy refers to the degree to which restrictions are concentrated on one actor. Among the four indicators, the constraint is the most important reference indicator. The higher the constraint on a stakeholder, the more difficult it is for the stakeholder to have direct contact with other stakeholders in the network. After inputting the binarized relationship matrix into UCINET software, the calculated results were as shown in Figure 4.
It can be seen from Figure 4b that the farmer households (S6) were those who were most constrained by the overall network. Figure 4a also shows that the farmers (S6) were constrained by the biomass companies (S4) to 0.49 and the farmers (S6) were restricted by the brokers (S5) to 0.36. This suggests that the two stakeholder groups of enterprises and brokers played a key role as a bridge between farmers and the overall network.

3.4. Discussion

3.4.1. Problems of Industrial Development

Based on the above data analysis results and discussions, it was concluded that the current agricultural and forestry waste power generation industry in Jiangsu Province had the following problems.
(1) The division of government functions was too fragmented. In the calculation of stakeholder centrality, it was found that although the government’s point centrality was very low, the government’s closeness centrality was only lower than that of the biomass enterprises. This shows that the governments played a key role associated with important stakeholders in this industry [38]. However, it can be seen from the calculation results of centrality that the governments seldom established contact with other stakeholders. During the field investigation, it was also found that the distribution of powers of different levels of government was too fragmented. Through semi-structured interviews, we learned that the governments were more responsible for policy formulation and subsidy distribution in the process of industrial development. Furthermore, the governments at different hierarchy levels had different responsibilities. The provincial governments regularly participated in symposiums organized by industry associations and communicated with companies on the problems that they encountered in their development. However, the municipal governments were in an overhead state and had little understanding of subsidies and related subsidy policies. As a result, township governments could not receive the latest information on technological progress.
(2) The farmers were at the edge of the social network. From the above calculations, it can be seen that the closeness centrality and betweenness centrality of the farmers were the lowest among all stakeholders. This shows that the farmers had the most marginal existence in the entire industrial network, even though the farmers were responsible for supplying raw materials. It can be seen from Figure 2 that the only two groups that interacted with farmers were the governments and brokers. When the industry associations and research institutions were engaged in industry-related work, they did not interact with the farmers or brokers. This shows that when providing suggestions to the governments to formulate policies, the industry associations and research institutions could only obtain the shortcomings of the current industrial development through the information feedback from the enterprises, which led to one-sided information acquisition and failed to consider the source of the insufficient supply of raw materials from the perspective of the farmers.
(3) The companies did not take the initiative to undertake the transmission capacity of material flow and information flow. From the calculation results of centrality, it can be concluded that the biomass enterprises comprised the stakeholder group with the highest centrality in the industrial social network and that they had the greatest control over the information. However, the point centrality data showed that companies actively initiated interactions with the governments, industry associations, and research institutions at a low frequency. This also reflected that the frequency of enterprises taking the initiative to report industrial development issues was very low, making it difficult for policymakers to obtain comprehensive and effective information. In addition, no certain policy propaganda measures were taken to expand the scope of raw material acquisition in towns.

3.4.2. Policy Recommendations

Based on the outcomes of the study, three policy recommendations are given below:
(1) Refine the division of government functions. In response to the fragmented distribution of the governments’ functions, it is recommended that the functions of relevant departments be redistributed so that the powers of the relevant departments concerned about the development of new energy are more concentrated. On the one hand, the development of biomass energy is within the jurisdiction of the new energy sector. On the other hand, biomass energy is inseparable from the management of raw material straw by the Ministry of Rural Agriculture. The functions of these two departments, or other related departments, can be combined to make the powers more concentrated. This would make it far easier for the new energy sector to formulate industry development plans.
(2) Improve the centrality of farmers in the industrial social network. It is recommended that farmers be made key policy propaganda objects. To promote the sustainable development of the biomass power generation industry and to solve the problems of insufficient raw materials faced by enterprises, it is necessary to start with the raw material suppliers, namely, farmers. The interests of farmers ought to be identified so as to help them to more actively participate in industry-related work. From the perspective of industry associations and research institutions, the frequency of field surveys should be increased and communication with farmers and brokers should be strengthened. This would ensure that the channels for obtaining information among stakeholders would be more comprehensive and provide reliable suggestions for the government to formulate plans. The government can also lean toward encouraging the utilization of straw in the next plan and provide corresponding subsidies to farmers who are willing to provide straw raw materials for power generation. The close relationship between brokers, biomass companies, and farmers should be encouraged and made good use of, while brokers or companies ought to promote appropriate policies to farmers.
(3) Make proper use of the central position of the enterprises in the industrial social network. Enterprises should take the initiative to establish cooperation with township governments. On the one hand, special straw collection, storage, and transportation platforms can be established in each township, while on the other hand, relevant subsidy policies can be propagated through township governments. In addition, companies can also give corresponding transportation subsidies to brokers with cooperative relations to establish stable and long-term contacts. When companies encounter development problems, they should provide more feedback to industry associations or research institutions. For example, additional feedback would benefit the current issue of corporate subsidies and corporate layout planning issues to enable the policy formulation process to be in a position to consider the needs of enterprises.

4. Conclusions

This study used social network analysis methods to portray the interaction of stakeholders in the agricultural and forestry biomass power generation industry in the case cities of Jiangsu Province through symbolic graphics and calculated the degree of centrality occupied by each stakeholder in the industrial network. It aimed to solve the problems of insufficient supply of raw materials and insufficient policy publicity encountered in current industrial development. According to the analysis results, the biomass enterprises comprised the stakeholder group with the highest centrality of the industrial network among all the stakeholders and should undertake the material flow and information flow transmission tasks of the entire industrial network. In addition, the study also found that farmers were the main suppliers of raw materials but were also at the most marginal position in the industrial network. The farmers had the lowest information reception and impact on the overall network. The farmers’ ignorance of the related technologies and subsidy policies for the utilization of straw resources greatly exacerbated the current situation of the insufficient supply of raw materials for enterprises. The above problems can be solved by strengthening the closeness of the overall network. For example, companies could take the initiative to establish raw material purchasing and storage centers in cooperation with nearby township governments, or take the initiative to train brokers specializing in the transportation of raw materials in various villages and towns. This will not only ensure a stable supply of raw materials but also create high-frequency interaction between the township government and farmers so that biomass power generation policies and technologies can be effectively promoted.
In the field survey process, in addition to the data collected in the questionnaire survey, semi-open interviews with stakeholders were also conducted. Based on the qualitative analysis of the data collected in the interview, it was concluded that 98.79% of the farmers did not understand the potential methods for using straw as a resource. This also further confirmed that farmers at the edge of the social network had extremely low control over information, which also became the main reason for the insufficient supply of raw materials for biomass enterprises.

Author Contributions

Conceptualization, J.Z., H.L., X.Y. (Xinyu Yang), X.Y. (Xiaohui Yang) and T.M.D.V.; methodology, J.Z.; software, J.Z.; formal analysis, J.Z.; investigation, J.Z. and T.M.D.V.; resources, H.L.; data curation, X.Y. (Xinyu Yang); writing—original draft preparation, J.Z.; writing—review and editing, J.Z., H.L. and X.Y. (Xiaohui Yang); visualization, J.Z.; supervision, P.J.; project administration, P.J. and H.L.; funding acquisition, P.J. All authors have read and agreed to the published version of the manuscript.

Funding

This research was funded by the National Nature Science Foundation of China (grant numbers 31961143006 and 71774033) and the Fudan Tyndall Centre of Fudan University (IDH6286315).

Institutional Review Board Statement

Not applicable.

Informed Consent Statement

Not applicable.

Data Availability Statement

Not applicable.

Conflicts of Interest

The authors declare no conflict of interest.

Appendix A

Table A1. Survey Questionnaire Design and Summary of Questions.
SerialCategoryQuestionRemark
1Basic information collectionWhat are your gender and age?Understand the ratio of men to women and the average age of practitioners.
2Stakeholder classificationAccording to the nature of your work, which part of the development of the bioenergy industry did you participate in?Understanding the work links involved in the agricultural and forestry waste power generation industry and which stakeholders correspond to different links was conducive to the analysis of individual networks in different links.
According to job attributes, what kind of stakeholder do you belong to?
3InteractiveWhen engaged in work related to the bioenergy industry, what other stakeholder groups will you come into contact with?Establish an interactive network.
What is the frequency of this contact?Give 1–5 grades for the interviewee to choose.
4ReasonPlease briefly describe the kind of work in which you interact with other stakeholders?Understand the reasons for the connections between stakeholders.
5SuggestionFrom the perspective of your work, briefly describe your suggestions for the future development of the bioenergy industry.Open question.
Table A2. List of Interviewed Organizations.
Stakeholder ClassificationRespondentNumber of Interviews
GovernmentNew Energy and Renewable Energy Division, Development, and Reform Commission of Jiangsu Province
(Department of Energy Technology and Equipment)
4
Energy Bureau of Nanjing Development and Reform Commission
New Energy Division of Suqian Development and Reform Commission
New Energy Division of Yancheng Development and Reform Commission
AssociationJiangsu Electric Power Industry Association1
Research institutionJiangsu Engineering Consulting Center1
Biomass enterpriseCECEP Biomass Power Generation Co., Ltd.5
Jiangsu Guoxin Siyang Biomass Power Generation Co., Ltd.
Jiangsu Guoxin Yancheng Biomass Power Generation Co., Ltd.
Jiangsu Senda Thermal Power Group (Jianhu) Co., Ltd.
Urban Environmental Protection New Energy Development Dafeng Company

References

  1. Prospective Industry Research Institute. “An Analysis of the Development Status of China’s Biomass Power Generation Industry in 2020 Shows That the Cumulative Installed Capacity Will Exceed 20 Million Kilowatts”. Available online: https://bg.qianzhan.com/report/detail/300/200722-f5cce379.html (accessed on 22 July 2020).
  2. State council of PRC. Guiding Opinions of the State Council on Accelerating the Establishment and Improvement of a Green and Low-Carbon Circular Development Economic System. Available online: http://www.gov.cn/zhengce/content/2021-02/22/content_5588274.htm (accessed on 2 February 2021).
  3. Zhang, Y.F.; Xun, H.H. Research on legal regulations and related countermeasures of China’s biomass power generation raw material market. Saf. Environ. Eng. 2020, 27, 17–22. (In Chinese) [Google Scholar]
  4. Mana, A.A.; Allouhi, A.; Ouazzani, K.; Jamil, A. Feasibility of agriculture biomass power generation in Morocco: Techno-economic analysis. J. Clean. Prod. 2021, 295, 126293. [Google Scholar] [CrossRef]
  5. Wang, Z.W.; Wang, Z.F.; Xu, G.Y.; Ren, J.Z.; Wang, H.; Li, J. Sustainability assessment of straw direct combustion power generation in China: From the environmental and economic perspectives of straw substitute to coal. J. Clean. Prod. 2020, 273, 122890. [Google Scholar] [CrossRef]
  6. Ji, C.Y.; Cheng, K.; Nayak, D.; Pan, G.X. Environmental and economic assessment of crop residue competitive utilization for biochar, briquette fuel and combined heat and power generation. J. Clean. Prod. 2018, 192, 916–923. [Google Scholar] [CrossRef]
  7. Wang, S.Y. Research on Optimization of Subsidy Policy for Agriculture and Forestry Biomass Power Generation. Ph.D. Thesis, Beijing Forestry University, Beijing, China, 2019. (In Chinese). [Google Scholar]
  8. Guo, J.; Mi, F.; Zhang, Q. Research on the effect of current electricity price subsidy in China’s agriculture and forestry biomass power generation industry. Issues For. Econ. 2020, 40, 155–164. (In Chinese) [Google Scholar]
  9. Wang, Z.W.; Wang, Z.F.; Tahir, N.; Wang, H.; Li, J.; Xu, G.Y. Study of synergetic development in straw power supply chain: Straw price and government subsidy as incentive. Energy Policy 2020, 146, 111788. [Google Scholar] [CrossRef]
  10. Zhang, S.Y.; Zhang, J.; Wang, T. SWOT analysis of China’s agriculture and forestry biomass power generation industry. Rural Econ. Sci.-Technol. 2020, 31, 4–7. (In Chinese) [Google Scholar]
  11. Wang, L.L.; Watanabe, T.; Panoutsou, C. A Stackelberg Game Theoretic Analysis of Incentive Effects under Perceived Risk for China’s Straw-Based Power Plant Supply Chain. Energies 2016, 9, 455. [Google Scholar] [CrossRef] [Green Version]
  12. Dang, G.Z. Research on the structural characteristics of online fan community network based on social network analysis. J. Libr. Sci. Soc. Sichuan 2020, 1, 95–100. (In Chinese) [Google Scholar]
  13. Storey, K.E.; Stearns, J.A.; McLeod, N.; Montemurro, G. A social network analysis of interactions about physical activity and nutrition among APPLE schools staff. SSM—Popul. Health 2021, 14, 100763. [Google Scholar] [CrossRef]
  14. Qu, J.S.; Han, J.Y.; Liu, L.N.; Xu, L.; Li, H.J.; Fan, Y.J. Inter-provincial correlations of agricultural GHG emissions in China based on social network analysis methods. China Agric. Econ. Rev. 2020, 13, 167–184. [Google Scholar] [CrossRef]
  15. Yin, C.H.; Gu, H.Y.; Zhang, S.J. Measuring technological collaborations on carbon capture and storage based on patents: A social network analysis approach. J. Clean. Prod. 2020, 274, 122867. [Google Scholar] [CrossRef]
  16. Wang, W.T.; Jian, L.R.; Liu, J.; Wang, W.J.; Guo, Q.Y. Research on the evolution of Industry-University-Research cooperation in the energy storage industry—Based on the perspective of patent network. Energy Storage Sci. Technol. 2021, 10, 752–765. (In Chinese) [Google Scholar]
  17. Cheng, C.; Bettina, M.; Lin, Z.; Barbara, S. Social-Network Analysis of local governance models for China’s eco-compensation program. Ecosyst. Serv. 2020, 45, 101–191. [Google Scholar]
  18. Samira, N.; Maryam, S.; Mostafa, A. Social network analysis for identifying actors engaged in water governance: An endorheic basin case in the Middle East. J. Environ. Manag. 2021, 288, 112376. [Google Scholar]
  19. Jones, J.L.; Dave, D.W. A social network analysis of collaborative governance for the food-energy-water nexus in Phoenix, AZ, USA. J. Environ. Stud. Sci. 2021, 11, 671–681. [Google Scholar] [CrossRef]
  20. Xu, X.X.; Xiao, B.; Li, C.Z.D. Stakeholders’ power over the impact issues of building energy performance gap: A two-mode social network analysis. J. Clean. Prod. 2020, 289, 125–623. [Google Scholar] [CrossRef]
  21. Ludovico, N.; Dessi, F.; Bonaiuto, M. Stakeholders Mapping for Sustainable Biofuels: An Innovative Procedure Based on Computational Text Analysis and Social Network Analysis. Sustainability 2020, 12, 10317. [Google Scholar] [CrossRef]
  22. Anbumozhi, V.; Gunjima, T.; Ananth, A.; Visvanathan, C. An assessment of inter-firm networks in a wood biomass industrial cluster: Lessons for integrated policymaking. Clean Technol. Environ. Policy 2010, 12, 365–372. [Google Scholar] [CrossRef]
  23. Kassim, M.A.; Meng, T.K.; Serri, N.A.; Yusoff, S.B.; Shahrin, N.A.M.; Seng, K.Y.; Bakar, M.H.A.; Keong, L.C. Sustainable Biorefinery Concept for Industrial Bioprocessing. In Biorefinery Production Technologies for Chemicals and Energy, 1st ed.; Kuila, A., Mukhopadhyay, M., Eds.; Wiley & Sons: Hoboken, NJ, USA; Scrivener Publishing LLC: Beverly, MA, USA, 2020; pp. 15–53. [Google Scholar]
  24. Wellman, B. The Development of Social Network Analysis: A Study in the Sociology of Science. Contemp. Sociol. J. Rev. 2008, 37, 221–222. [Google Scholar] [CrossRef]
  25. Zhu, J.A.; Li, Y.L.; Jiang, P.; Hu, B.; Yang, L. Analysis on the Dynamic Evolution of Bioenergy Industry in the Yangtze River Delta Based on Multilevel Social Network Theory. Energies 2020, 13, 6383. [Google Scholar] [CrossRef]
  26. Gold, S. Bio-energy supply chains and stakeholders. Mitig. Adapt. Strateg. Glob. Chang. 2011, 16, 439–462. [Google Scholar] [CrossRef]
  27. Ngaruiya, G.W.; Jürgen, S. Actors and networks in resource conflict resolution under climate change in rural Kenya. Earth Syst. Dyn. 2016, 7, 441–452. [Google Scholar] [CrossRef] [Green Version]
  28. Wasserman, S.; Faust, K. Social Network Analysis: Methods and Applications; Cambridge University Press: London, UK, 1994. [Google Scholar]
  29. Liu, J. Whole Network Approach; People’s Publishing House: Shanghai, China, 2019. (In Chinese) [Google Scholar]
  30. Lusher, D.; Koskinen, J.; Robins, G. Exponential Random Graph Models for Social Networks: Theory, Methods and Applications. Bull. Sociol. Methodol. 2013, 123, 80–87. [Google Scholar]
  31. Friedkin, N.E. Structure Equivalence and Cohesion Explanations of Social Homogeneity. Sociol. Methods Res. 1984, 12, 235–261. [Google Scholar] [CrossRef]
  32. Freeman, L.C. Centrality in social networks conceptual clarification. North-Holland. Soc. Netw. 1978, 1, 215–239. [Google Scholar] [CrossRef] [Green Version]
  33. Wu, K.Y.; Yang, T.G.; Wei, X.Y. Does the structure of intersectoral embedded carbon flow network matter to carbon reduction in China? J. Clean. Prod. 2019, 233, 1061–1074. [Google Scholar] [CrossRef]
  34. Viviana, L.H.; Heiner, S. Agency in actor networks: Who is governing transitions towards a bioeconomy? The case of Colombia. J. Clean. Prod. 2019, 225, 728–742. [Google Scholar]
  35. Energy Bureau of Jiangsu Province. Post-Evaluation Study of Jiangsu Straw Power Plant; Energy Bureau of Jiangsu Province: Nanjing, China, 2020. (In Chinese) [Google Scholar]
  36. Zhang, H.; Cui, W. Suqian has become the largest biomass power generation industrial base in Jiangsu Province. Power Demand Side Manag. 2011, 13, 65. (In Chinese) [Google Scholar]
  37. New Energy Industry Work Class of Yancheng Development and Reform Commission. Report on the Development Status of Biomass Power Generation Industry in 2020; New Energy Industry Work Class of Yancheng Development and Reform Commission: Yancheng, China, 2020; (Non-publicise). [Google Scholar]
  38. Dong, X.Y.; Li, F.Y. Research on Rural Private Loan Supervision Based on Structural Hole Theory. South China Financ. 2011, 8, 40–43. (In Chinese) [Google Scholar]
Figure 1. The order of contacting the interviewed units.
Sustainability 14 00571 g001
Figure 2. Social network structure of stakeholders in the bioenergy industry.
Sustainability 14 00571 g002
Figure 3. Analysis of the cohesion subgroups of stakeholders in the bioenergy industry’s social network.
Sustainability 14 00571 g003
Figure 4. Structural hole analysis results. (a) shows the constraint between different stakeholder groups. The four indicators in (b) from left to right respectively represent the effective size and efficiency of the stakeholders in the overall network, the constraint in the overall network, and the hierarchy in the overall network.
Sustainability 14 00571 g004
Table 1. Introduction to the functions and characteristics of each stakeholder in the industry.
Stakeholder ClassificationCharacteristic
GovernmentThe new energy departments or agricultural departments of the provincial, municipal, and township governments, as well as their functions, include:
(1) Provincial and municipal governments are responsible for issuing policy plans.
(2) The role of the township government in the industry is relatively weak.
AssociationThe main functions of industry associations:
(1) Represent the entire new energy industry. Hold regular industry meetings.
(2) Share advanced work experience. Experts in the industry will explain the latest laws and policies to enterprises.
(3) Communicate with the government and enterprises, provide regular feedback, and put forward suggestions and solutions.
Research institutionThe main functions of research institutions:
(1) Research the development of the industry and put forward plans and suggestions.
(2) Provide consultation and advice to the government.
(3) Regular communication and information exchange with industry associations and other research institutions.
Biomass enterpriseThe main functions of biomass enterprises:
(1) Responsible for the resource utilization of straw.
(2) Cooperate with the government and industry associations.
(3) Obtain raw materials for power generation through brokers and farmers. The price of straw recycling is determined by the company.
BrokerThe brokers are mainly responsible for the crushing, bundling, and transportation of straw resources. The broker’s income mainly includes the following:
(1) The government will give broker subsidies based on the actual transportation tonnage provided by its cooperative enterprises.
(2) The income obtained by selling straws to enterprises through exchanges.
(3) Some companies will provide transportation subsidies to contracted brokers.
FarmerFarmers are the providers of biomass power generation raw materials in the industrial network.
Table 2. Stakeholder relationship matrix in the bioenergy industry.
S1S2S3S4S5S6
S1011200
S2101100
S3110200
S4312054
S5100504
S6000440
Table 3. Calculation results of the point centrality of stakeholders in the bioenergy industry.
OutDegreeInDegreeNrmOutDegNrmInDeg
S1461624
S2331212
S3441616
S415146056
S51094036
S6883232
Table 4. Calculation results of the closeness centrality of stakeholders in the bioenergy industry.
InFarnessOutFarnessInClosenessOutCloseness
S16.0007.00083.33371.429
S27.0007.00071.42971.429
S37.0007.00071.42971.429
S45.0005.000100.000100.000
S58.0007.00062.50071.429
S68.0008.00062.50062.500
Table 5. Calculation results of the betweenness centrality of stakeholders in the bioenergy industry.
BetweennessnBetweenness
S11.0005.000
S20.0000.000
S30.0000.000
S49.50047.500
S50.5002.500
S60.0000.000
Publisher’s Note: MDPI stays neutral with regard to jurisdictional claims in published maps and institutional affiliations.

