Article

Expediting the Cost Estimation Process for Aged-Housing Renovation Projects Using a Probabilistic Deep Learning Approach

Department of Architectural Engineering, Ajou University, Suwon-si 16499, Korea
*
Author to whom correspondence should be addressed.
Sustainability 2022, 14(1), 564; https://doi.org/10.3390/su14010564
Submission received: 30 October 2021 / Revised: 19 December 2021 / Accepted: 21 December 2021 / Published: 5 January 2022

Abstract

:
Since the early 1980s, the Korean government has rapidly boosted residential buildings to cope with substantial housing shortages. However, as buildings have been aging simultaneously, the performance of a large number of residential buildings has deteriorated. A government plan to upgrade poor housing performance through renovation is being adopted. However, the difficulty of accurate construction cost prediction in the early stages has a negative effect on the renovation process. Specifically, the relationship between renovation design elements and construction work items has not been clearly revealed. Thus, construction experts use premature intuition to predict renovation costs, giving rise to a large difference between planned and actual costs. In this study, a new approach links the renovation design elements with construction work items. Specifically, it effectively quantifies design factors and applies data-driven estimation using the simulation-based deep learning (DL) approach. This research contributes the following. First, it improves the reliability of cost prediction for a data-scarce renovation project. Moreover, applying this novel approach greatly reduces the time and effort required for cost estimation. Second, several design alternatives were effectively examined in an earlier stage of construction, leading to prompt decision-making for homeowners. Third, rapid decision-making can provide a more sustainable living environment for residents. With this novel approach, stakeholders can avoid a prolonged economic evaluation by selecting a better design alternative, and thus can maintain their property holdings in a smarter way.

1. Introduction

1.1. Research Background

The dominant type of residential building in Korea is the high-rise apartment. With the country’s rapid economic growth, a large number of apartments have been erected in urban areas over a short period. Currently, these apartments are aging, and housing performance is insufficient compared to that of newer apartments. Accordingly, many homeowners want to improve their housing’s performance by either renovating or reconstructing their apartment buildings. However, a renovation approach is not preferable due to the uncertain economic benefit. Therefore, the government provides additional benefits to renovation businesses in an effort to reduce the environmental burden of reconstruction. One of the key bottlenecks in renovation projects is prolonged decision-making among various stakeholders, such as homeowners, financiers, designers, engineers, and contractors. Consequently, increasing the reliability of cost prediction is a key solution. Currently, renovation cost is estimated by unreliable calculations based on the experiences of only a few construction experts. This does not properly explain how the calculated construction costs are linked to the design alternatives proposed by the owners [1]. The reasons for this are as follows. First, the accumulated cost data are not sufficient due to the limited number of cases. Second, no method has been identified for computing how each design element is linked with renovation and new construction work items [2,3,4]. Thus, it is essential to recognize the hidden relationship between design factors and cost items. In general, the construction cost per unit area decreases as the size of the construction increases. In contrast, the renovation cost per unit area increases as the work scope expands. This is because the amount of foundation reinforcement work increases, and additional load-bearing wall reinforcement work on lower floors may be extensively required. Therefore, it is essential to determine these design issues and their impacts on renovation cost [1].
Meanwhile, deep learning (DL) techniques have recently been introduced in various research areas [5]. When DL is applied to the field of cost estimation, the accuracy and speed increases significantly, compared to regression analysis and other approaches such as case-based reasoning [6,7]. However, it is unlikely that this approach will be widely used for renovation projects because of the difficulty of data acquisition. To overcome this issue, a probabilistic approach is adopted in the industry [8]. Yet, there remains a research gap in terms of how to guarantee the reliability of cost estimation with a scarce dataset when predicting the cost in the renovation project.
The purpose of this study is to present a new algorithm for effectively estimating the cost of apartment renovation in conjunction with a probabilistic DL approach. This would provide a framework to facilitate the renovation projects by supporting the rational decision-making of current renovation stakeholders at an earlier stage.

1.2. Research Process

This study was implemented using the following procedure. In the first stage, the problem that there is currently no practical method for calculating the construction cost of apartment renovation was revisited. In the second stage, a literature review was conducted in three areas: schematic estimation, cost relationship analysis, and DL. In the third stage, a concept for an estimation method using simulation-based DL was proposed based on previous research. In the fourth stage, a system algorithm was developed and data analysis was conducted using the Python language. Finally, the sustainable soundness of the developed model was confirmed through a validation process.

2. Preliminary Investigation

2.1. Schematic Estimation

Schematic cost estimation plays an important role in early decision-making for building renovation projects. There are various types of cost estimation. These techniques can be categorized into the parametric and analogue methods. The parametric method estimates the construction cost after designating a standard unit cost, that is, cost estimation relationships (CERs), while the analogous method calculates construction cost based on similar past project information [9].
Due to the scarcity of historical data, renovation cost estimation is dependent on the analogous method because it is very difficult to determine the appropriate CERs of the project [10]. The estimation of renovation projects requires both quantitative and qualitative information. The scope of work should be determined not only in renovation but also in new construction buildings, to guarantee the reliability of cost prediction. Compared to new building estimation, however, renovation cost is dependent on the existing building conditions; that is, structural deterioration, and vertical and/or horizontal expansion needs in conjunction with design factors.
The cost estimation method is also divided into the deterministic model (i.e., traditional percentage and/or expert judgement), the probabilistic model (i.e., regression, and/or simulation) and the modernized model (i.e., fuzzy technique and/or artificial neural network (ANN)) [11]. The deterministic model predicts the construction cost by specifying a single number. The probabilistic model uses probabilistic correction through a statistical method using a historical dataset [12]. The modernized model is a relatively newly developed data-driven method.
In this study, the parametric and analogous methods were combined. To determine the relationship between the design elements of the renovation and construction work types, the parametric approach is beneficial. Since the historical dataset is limited, expert judgement is also essential. Expert judgement must be used to analyze the relationship under more realistic project circumstances [1].

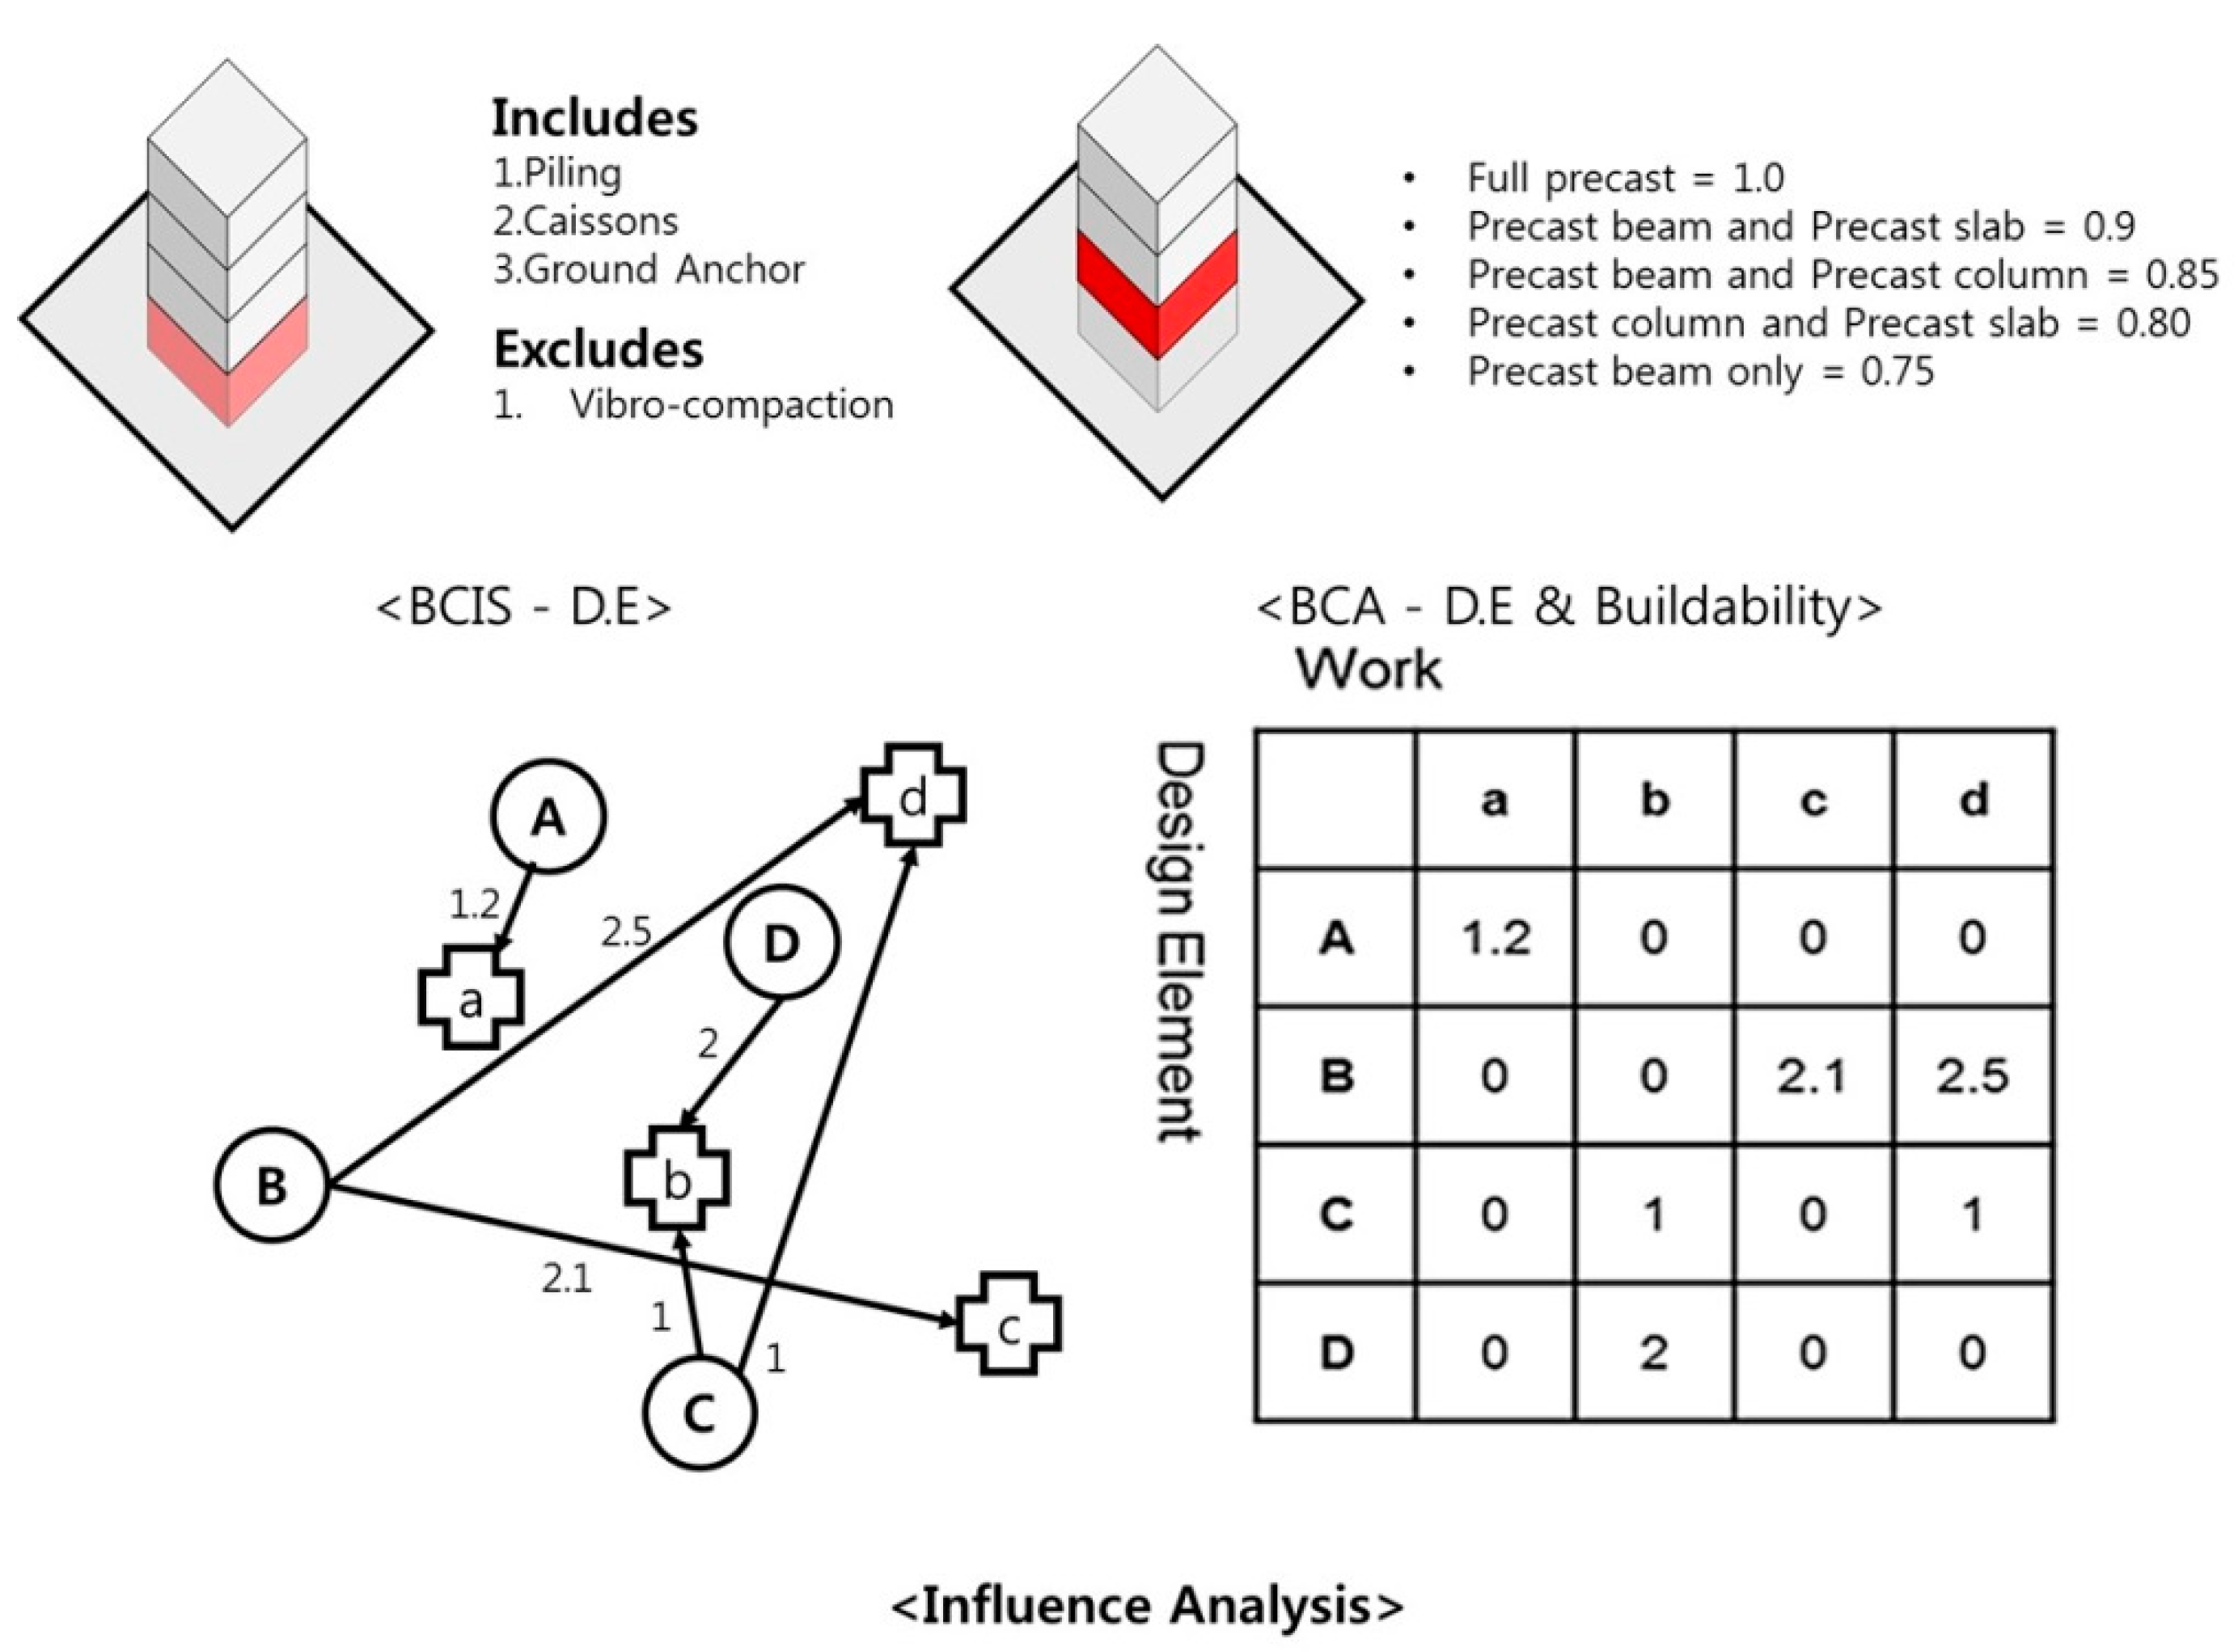
2.2. Relationship between Design Elements and Work Items

A study was conducted to investigate the relationship between design elements and construction work items, or to develop a methodology that can be used for such concepts. There are three types of methodologies in relation to this approach.
First, the Building Cost Information Service (BCIS) [13] published a report that identifies each design element of a building to provide a schematic estimation of it. They scrutinized candidate design factors for renovation projects using the concept of design elements. Each potential design element was then confirmed by reconsidering the relationship between design element and project cost.
Second, the Building and Construction Authority (BCA) published a report that scored each design element of a building [14]. Each design element was quantified in terms of project buildability. Thus, even for similar designs, buildability can be compared by referring to the total score, and the design can be modified or changed accordingly.
Thirdly, the Weighted Risk Structure Matrix (WRSM) has been studied and adapted in this study [15]. This method can easily express the relationship between a number of design elements and the quantities of work items. Although WRSM clearly indicates the relationship between stakeholders and risk items, it was modified in this study to indicate the relationship between design elements and work items. Figure 1 shows the concept of the WRSM. The matrix score indicates the magnitude of the influence between each design element and the construction work item. For example, design element “A” is related to the type of work “a”, and the magnitude of the association between them is “1.2”.

2.3. Deep Learning-Based Estimation

Construction cost estimation has long been a topic of research. A more sophisticated cost prediction method has been actively introduced in the industry, whereby the quality of cost estimation determines the success or failure of a project. Various methodologies, such as 5D CAD, rule-based expert systems, regression analysis, artificial neural networks (ANNs) and DL, have been rigorously applied. Parametric estimates and regression analyses that were developed in the 1970s are in use, not only in practical but also in academic areas [15,16,17]. In the 2010s, DL, which overcame the limitations of ANNs, has attracted much attention [18,19]. Because DL finds the relationships among data, it is regarded as a useful tool for cost estimation. It is also easy to update the algorithm by inputting the existing dataset.
Figure 2 depicts the two different types of estimation process. In the traditional method, the first step is to build an algorithm using a historical dataset. Second, the input data are provided and compared with the output data. Third, if there is a difference between the actual data and the output data, the proposed algorithm is revised to minimize the error. As mentioned earlier, this method is very time-consuming and it requires tremendous effort to modify the algorithm [20].
In contrast, the DL method follows the following procedure: (1) input and output data are collected at the same time, and (2) the computer builds a best-fit algorithm using the dataset. There is an advantage to this process in that it omits the output validation procedure. In addition, because a computer performs this process, a large amount of data can be quickly analyzed and a modified algorithm is obtained automatically.
DL-based estimation research has been in progress for several decades [11,12,13,14,15,16,17,18,19,20,21,22,23,24,25]. DL can also be used as a hybrid combined with other techniques [26,27]. The use of DL in developing an estimation process is advantageous in terms of accuracy. However, the internal operation algorithm remains undetermined, being referred to as a “black box”, because it only requires input and output values. To compensate for these shortcomings, a hybrid technique should be applied to determine the most appropriate output value by changing the various input variables.

2.4. Discussion from Preliminary Investigation

An estimate procedure is needed to reflect the characteristics of apartment building renovations. For this purpose, a variety of estimation methods have been investigated and categorized into parametric and analogous methods. To make an accurate estimate, an influential factor should be identified, and the relationship between the factors and work items must be determined [1,2,3,4,5,6,7,8,9,10,11,12,13,14,15]. If there are numerous cases, it is appropriate to build a traditional/manual estimation process. However, when project cases are scarce and not easy to accumulate, the level of experience required for the update is very high and the estimation process is time-consuming. Therefore, a new method for renovation projects should be developed to guarantee the reliability of cost estimation regardless of the number of accumulated cases.
A number of studies have proven that DL is an excellent method for predicting data- based construction costs [5,28]. Research on mixing various techniques in DL is emerging [29,30,31]. Various types of information is input in the construction cost prediction, but it is difficult to predict all possible cases because the input information is limited. Thus, it is plausible that the method of making various changes to the input value is applicable [32].
Specifically, this study aims to improve the interpretability of the estimation results. The DL approach is problematic and time-consuming because the relationship among the data is unclear. However, in this study, after dividing one project into work items, only information that has some degree of relationship with the relevant work item is designated as input data. As a result, the relationship can be effectively interpreted and the accuracy level improved. A detailed methodology is provided in the subsequent sections.

3. Deep Learning-Based Apartment Renovation Cost Estimation System
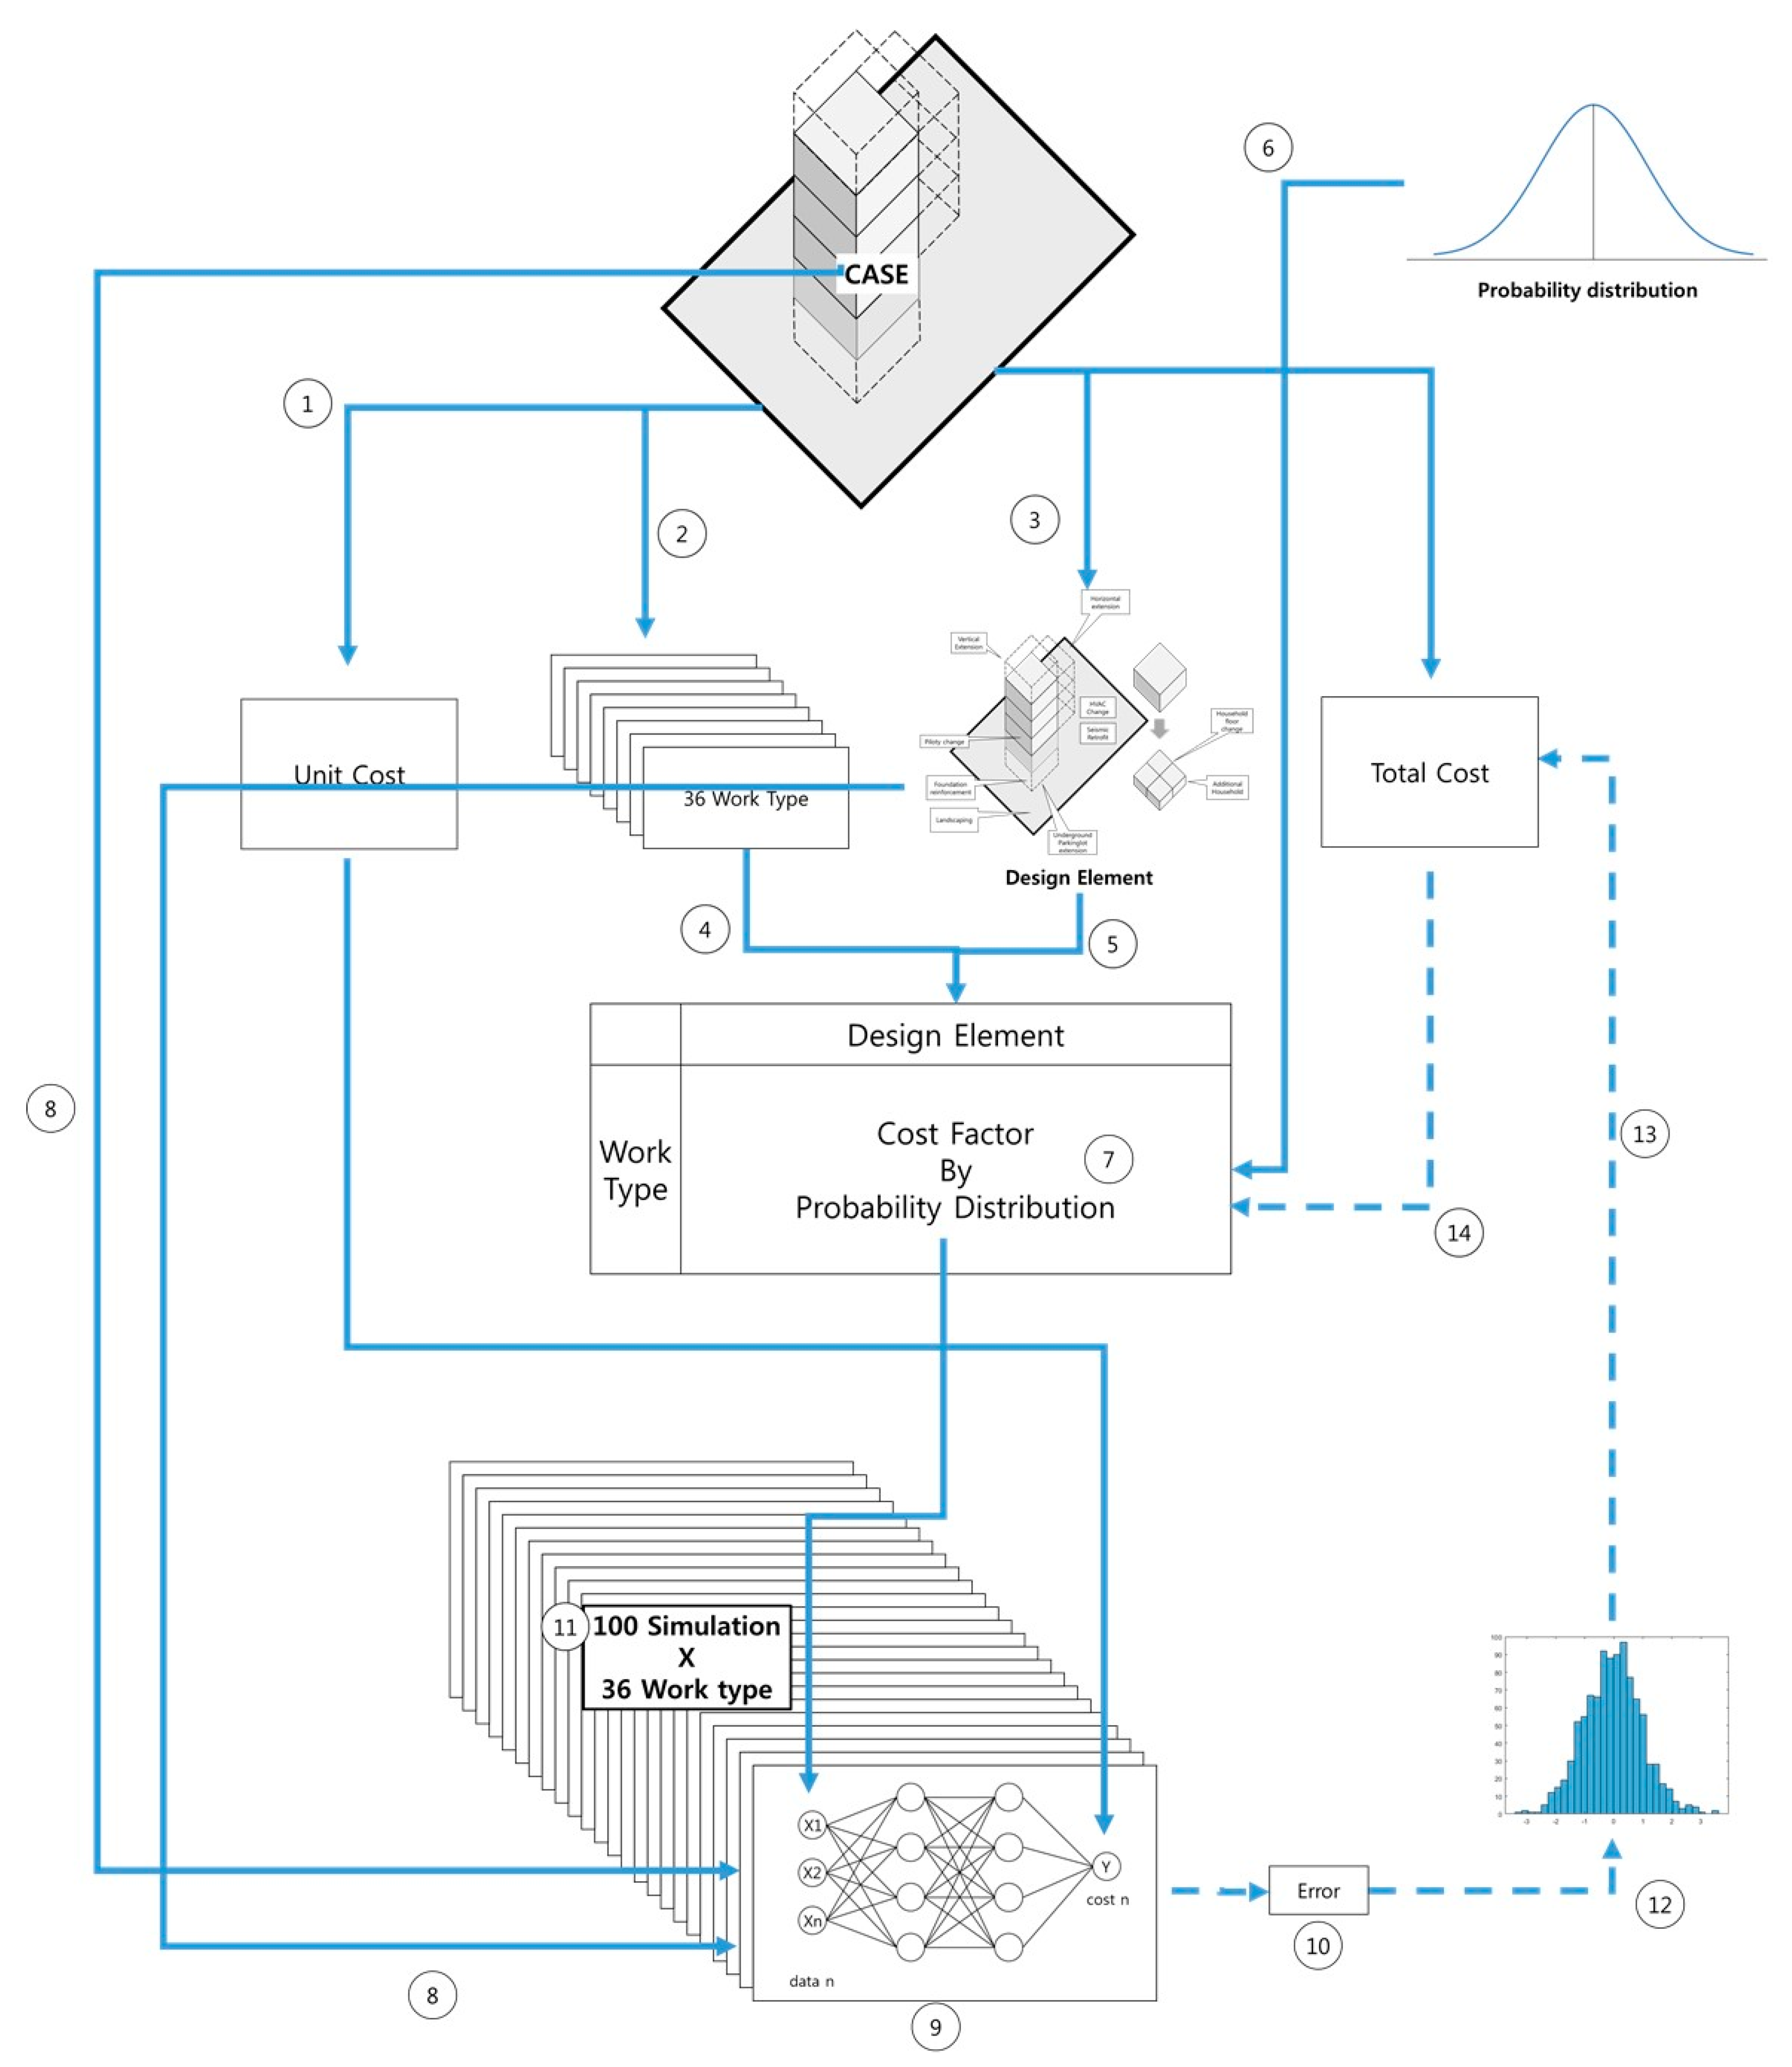
3.1. System Concept

The conceptual process model is provided in Figure 3. The system consists of four subsystems; that is, case treatment process (steps ①–③), case linking process (steps ④–⑦), simulation process (steps ⑧–⑪), and cost prediction process (steps ⑫–⑭).

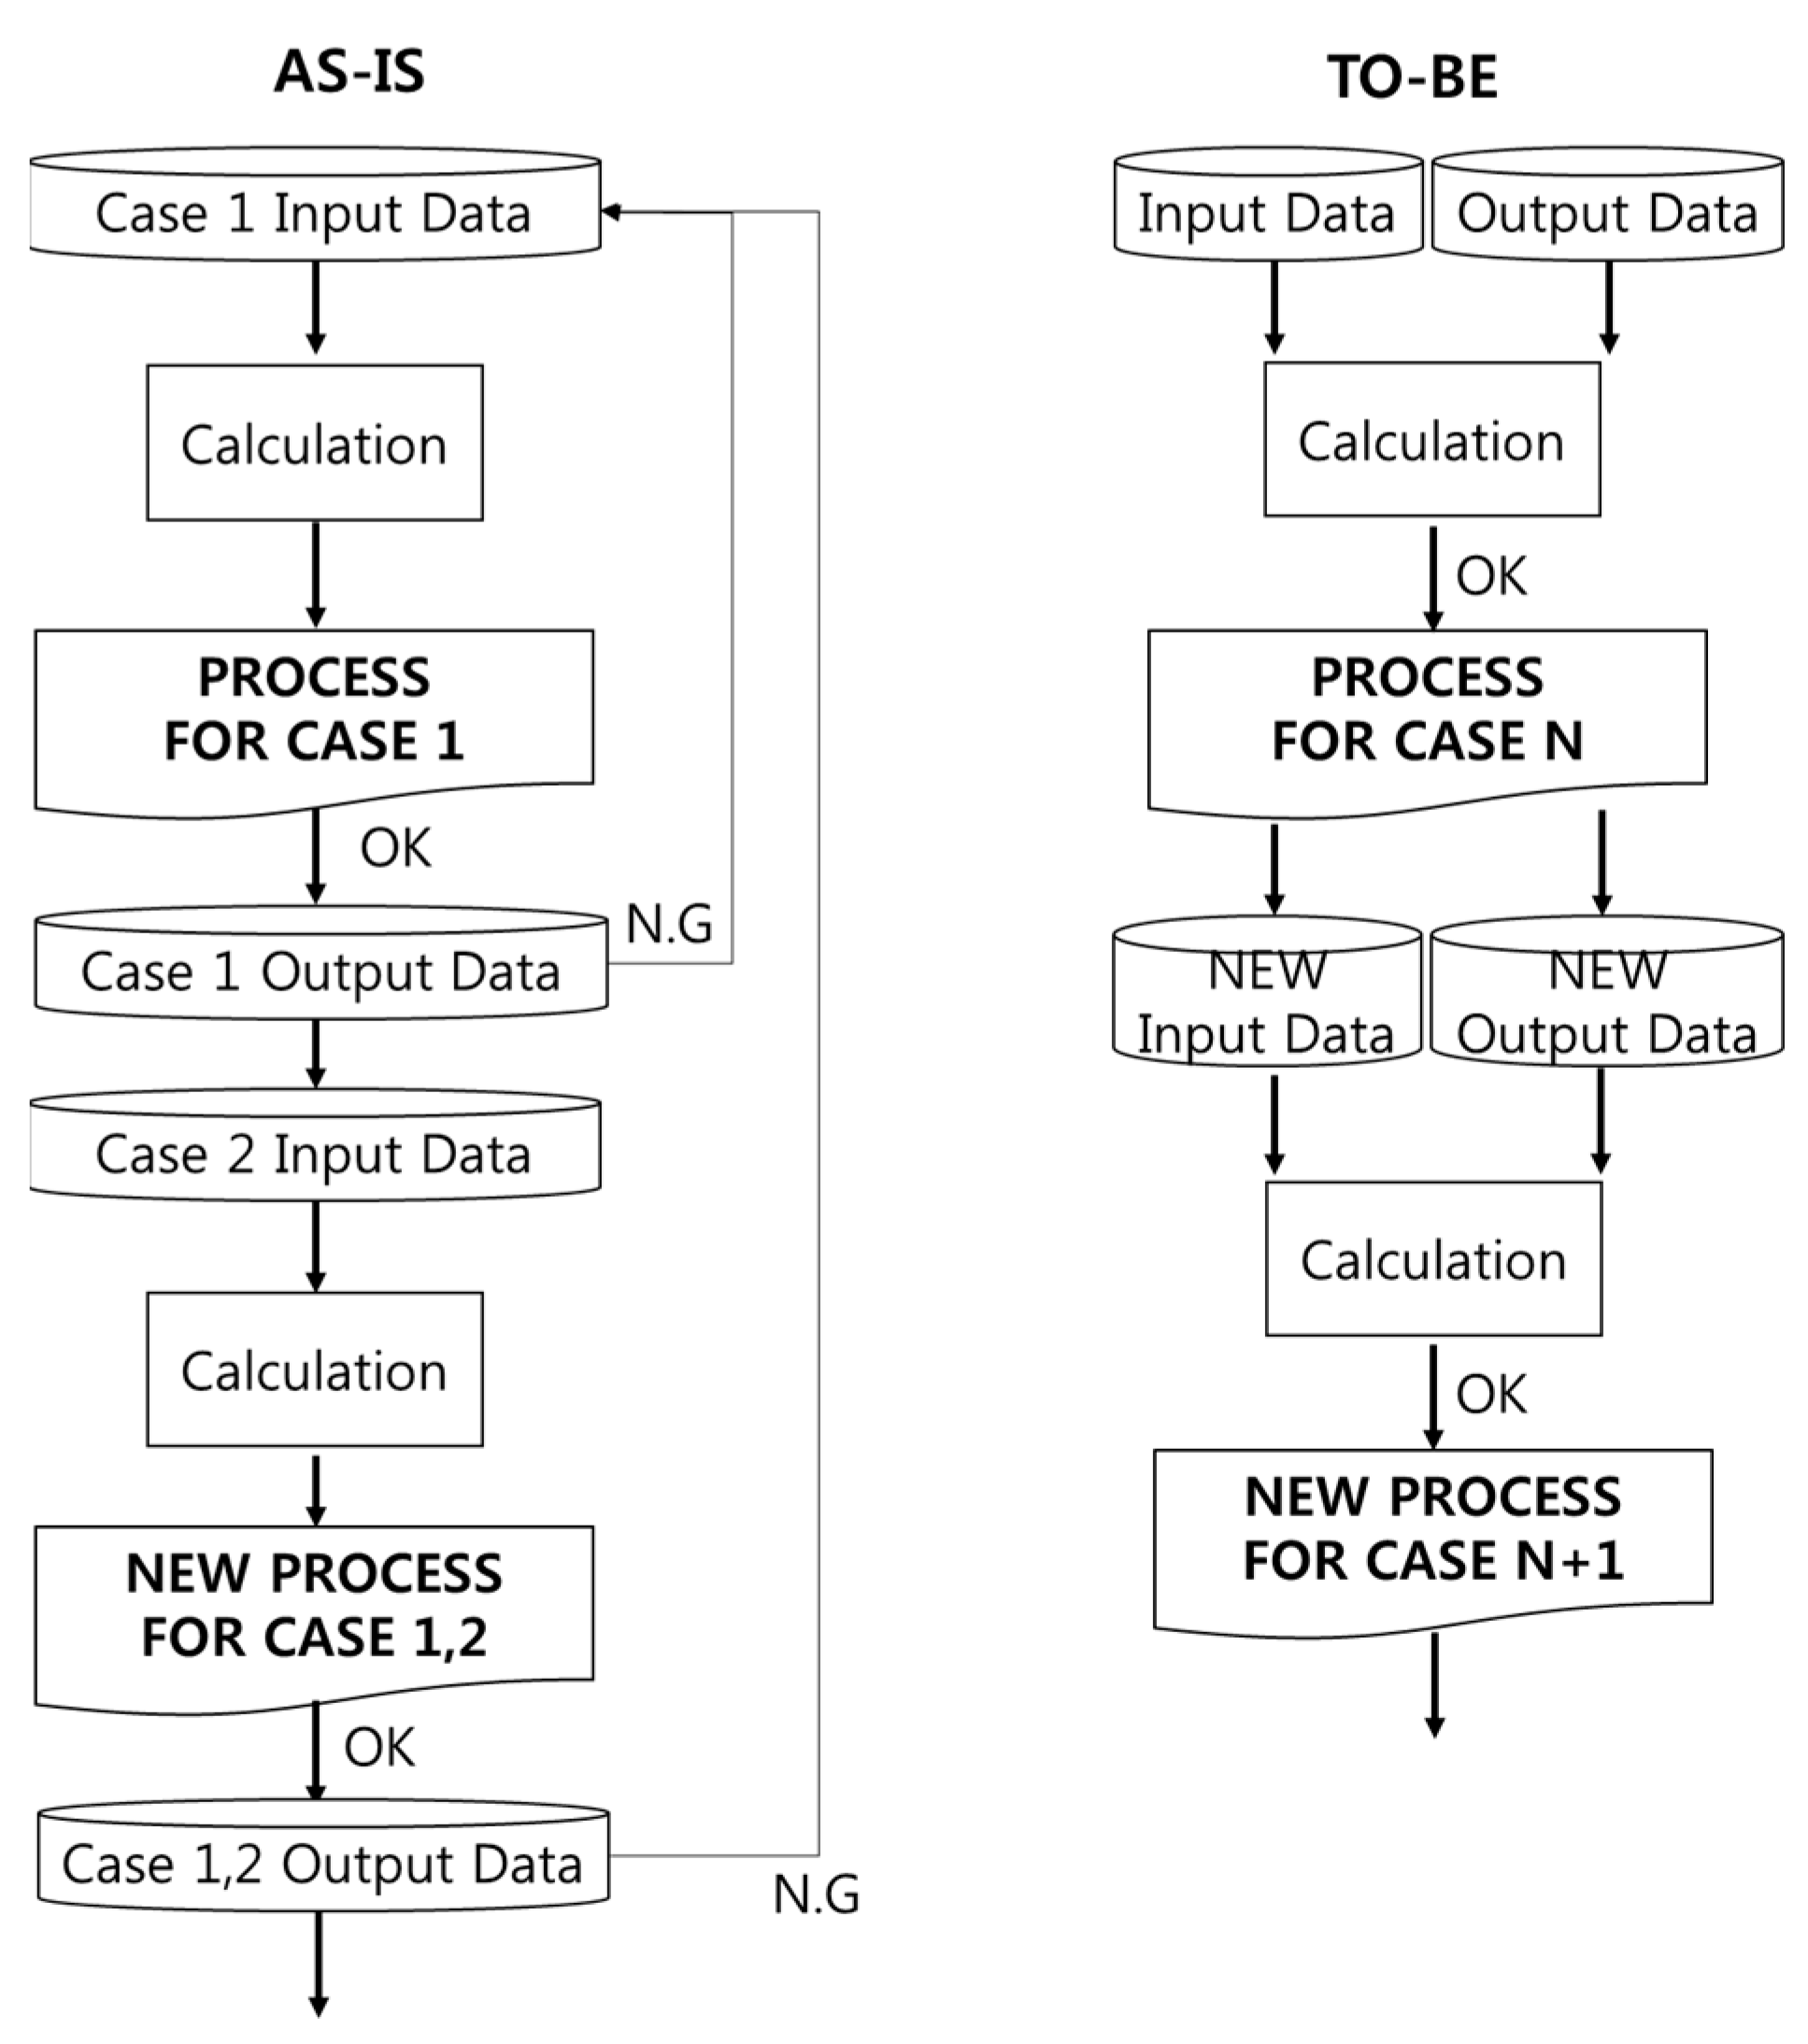
3.1.1. Case Treatment Process

Step ① checks the unit area cost and unit work cost by construction type in historical cases. For this study, 15 cases were used in the system. Table 1 provides the partial information. In step ②, 36 work items are classified. In step ③, a database is constructed using the design element information corresponding to each case project.

3.1.2. Case Linking Process

In step ④, a row in the data table is generated using the classified work type. Step ⑤ is configuring the column in the table created in step ④. After going through steps ④–⑤, the design element–work item matrix is completed. Step ⑥ encodes the probability distribution of the work type in the design element–work item matrix. This step was performed with the help of experts. If it is determined that a certain design factor and work item are interrelated, the probability distribution of the cost factor is input. For the purpose of this study, a triangular distribution was applied in this process, whereby there is an unclear relationship between design elements and work items. Step ⑦ produces the final set in the design element–work item probability distribution table.

3.1.3. Simulation Process

In step ⑧, a DL process is executed in conjunction with a Monte Carlo simulation. In this process, the bot project and design information are input. Using the pre-determined data from the previous matrix and the unit cost, a single DL input–output table is obtained. Step ⑨ shows the simulation operation using the DL approach. The Python program was adopted to execute the DL operation. Step ⑩ integrates the construction cost for each type of work calculated through the procedure up to step ⑨. By adding the 36 work types, the error for each simulation is obtained. Step ⑪ shows a 100-iterative simulation process using Monte Carlo simulation, and it creates 100-DL output. In this step, random simulated data are obtained from the probability distribution generated in step ⑦. All these DL output data are gathered to compute an error value for comparison with the real construction cost for each work item.

3.1.4. Cost Prediction Process

In step ⑫, the error values for all simulation operations are derived. Finally, steps ⑬ and ⑭ are the measurement and reflection steps, respectively. In step ⑬, the lowest error value is obtained from the calculated error values. In step ⑭, the data in the table of design element–work–probability distribution are corrected by selecting the value with the least error among those compared in step ⑬.

3.2. Design Element–Work Item Matrix

The partial design element–work item matrix is provided in Table 2. Out of 15 historical projects, 3 were used in this study (see Table 1). The quantity data, design elements, and unit costs of each case project are summarized in the table. The quantity data for each case, before and after renovation, can be compared. The design elements are broken down into five categories and then further divided into 16 sub-elements. These case projects, all located in metropolitan Seoul and nearby areas, were completed within the last ten years.
The following observations can be gathered from Table 2. First, a strong relationship can be easily inferred from the matrix. For example, there is a strong relationship between the data on the building area, building-to-land ratio, ground floor area, and underground floor area. Second, it is expected that there will be a proportional relationship between each data value, but there are some without. For example, it is expected that there will be a strong proportional relationship between the number of households and the unit area construction cost, but the data show no such relationship. Third, although there seems to be no proportional relationship with each data value, some data are expected to be proportional when considered in conjunction with experience. For example, the information contained in “features” offers the same data in most cases. However, in the case of exterior wall construction, the total construction cost is expected to vary considerably depending on exterior deterioration, but such content is not shown in relation to the construction cost.
In executing DL-based cost estimation, the input–output dataset is essential for developing the cost calculation formulas and algorithms. However, to improve the reliability of cost prediction for a renovation project, it is recommended that a unique cost calculation model be used by incorporating the specific relationships among the provided data. This study analyzes such relationships in connection with each type of renovation work item. To achieve this, the relationship between design elements and renovation work types was analyzed and the results are shown in Table 2.
As seen in Table 2, each work item in relation to renovation is divided into 36 types, and the design elements expected to be interrelated to each work type are linked. For this purpose, each work type is further classified into overground, underground, etc. For the design elements, the relationship between construction work types and design elements has been identified in a series of workshops with experienced industry practitioners.
The following can be inferred from Table 2. First, among 36 construction work types, 28 were analyzed in association with each design element. Apparently, it is appropriate to calculate the construction cost for each type of work. Second, in the case of structural demolition work, it is predicted that four design elements (A1, B3, D1, D2) are influenced by estimating aged housing renovation. Thus, it is necessary to consider several design factors simultaneously while calculating the construction cost for each type of construction. Third, in the case of the common type of overground construction, it is mainly related to the interior (E2) and exterior design (E3). It is difficult to determine the relationship between the design elements and construction types. Therefore, it is necessary to relate it to the quantity information (QI). The factor types are classified in Table 2, and are denoted in Figure 4.
There are three major types of construction cost: the type with no variation from the median value (types 3, 5, and 8), the type with slight variation (types 3, 6, and 9), and the type with large variation (types 1, 4, and 7). Nine probability types of design elements–work items were classified. Each probability distribution was used in this study.
It is noteworthy that the characteristics of probability types should be linked to individual design elements, as shown in Table 2. For types 1, 4, 6 and 7, significant difficulty is expected in predicting construction costs. Specifically, probability types belonging to underground renovation show many of type 4. In addition, it is expected that a wider range should be considered for construction cost prediction. Consequently, a Monte Carlo simulation was applied to the construction cost prediction in this study, by considering the uncertainty issue arising from DL and expert prediction.

3.3. Deep-Learning and Monte Carlo Simulation

Details of the use of DL and expert advice in the Monte Carlo simulation are shown in Figure 4. The columns in Figure 4 are divided into work factor distribution (type), quantity information, and proposed work unit area cost. “Work” is comprised of the 36 types of work presented above. The “Factor” distribution is the actual value applied to Case A. Because there are differences in the design elements applied in each case, this value also differs for each case. As with the design elements, quantity information was classified as related to construction type. In terms of quantity information, one to three pieces of information are associated with each type of work. Finally, the proposed work unit area cost is suggested. The most expensive construction type is the common electric construction type, and the cheapest is the underground paint construction type. It is important to note that this value is not calculated in conjunction with QI, but rather the construction cost for each construction type calculated for each ratio of the total construction cost. Therefore, it may be distorted when directly linked to QI.
The following can be inferred from Table 2. First, the work items, design elements, and QI must be considered simultaneously. For example, it can be seen that the “upper ground-renovation-demolition-structure” work is related to four design elements and to two general information elements (building area and floors). This is different from previous studies that correlated all data, and it is clearly more feasible to use DL by finding such a relationship. Through this, it is expected that some of the black box problems, the inherent problems of DL, can be solved [7]. Second, a probability distribution is set for each case. For example, in the case of the work mentioned in (1), it can be seen that values are set for each design element (0.8~1.2, 1.0~1.8, 2.0~2.2, 1.3~1.7). Therefore, it is possible to reflect the uncertainty of the specific design elements applied to each case. Third, the values are calculated for each type of work. As discussed in Figure 2, construction costs are calculated for each type of construction; hence, it is possible to analyze each calculated result in more detail.

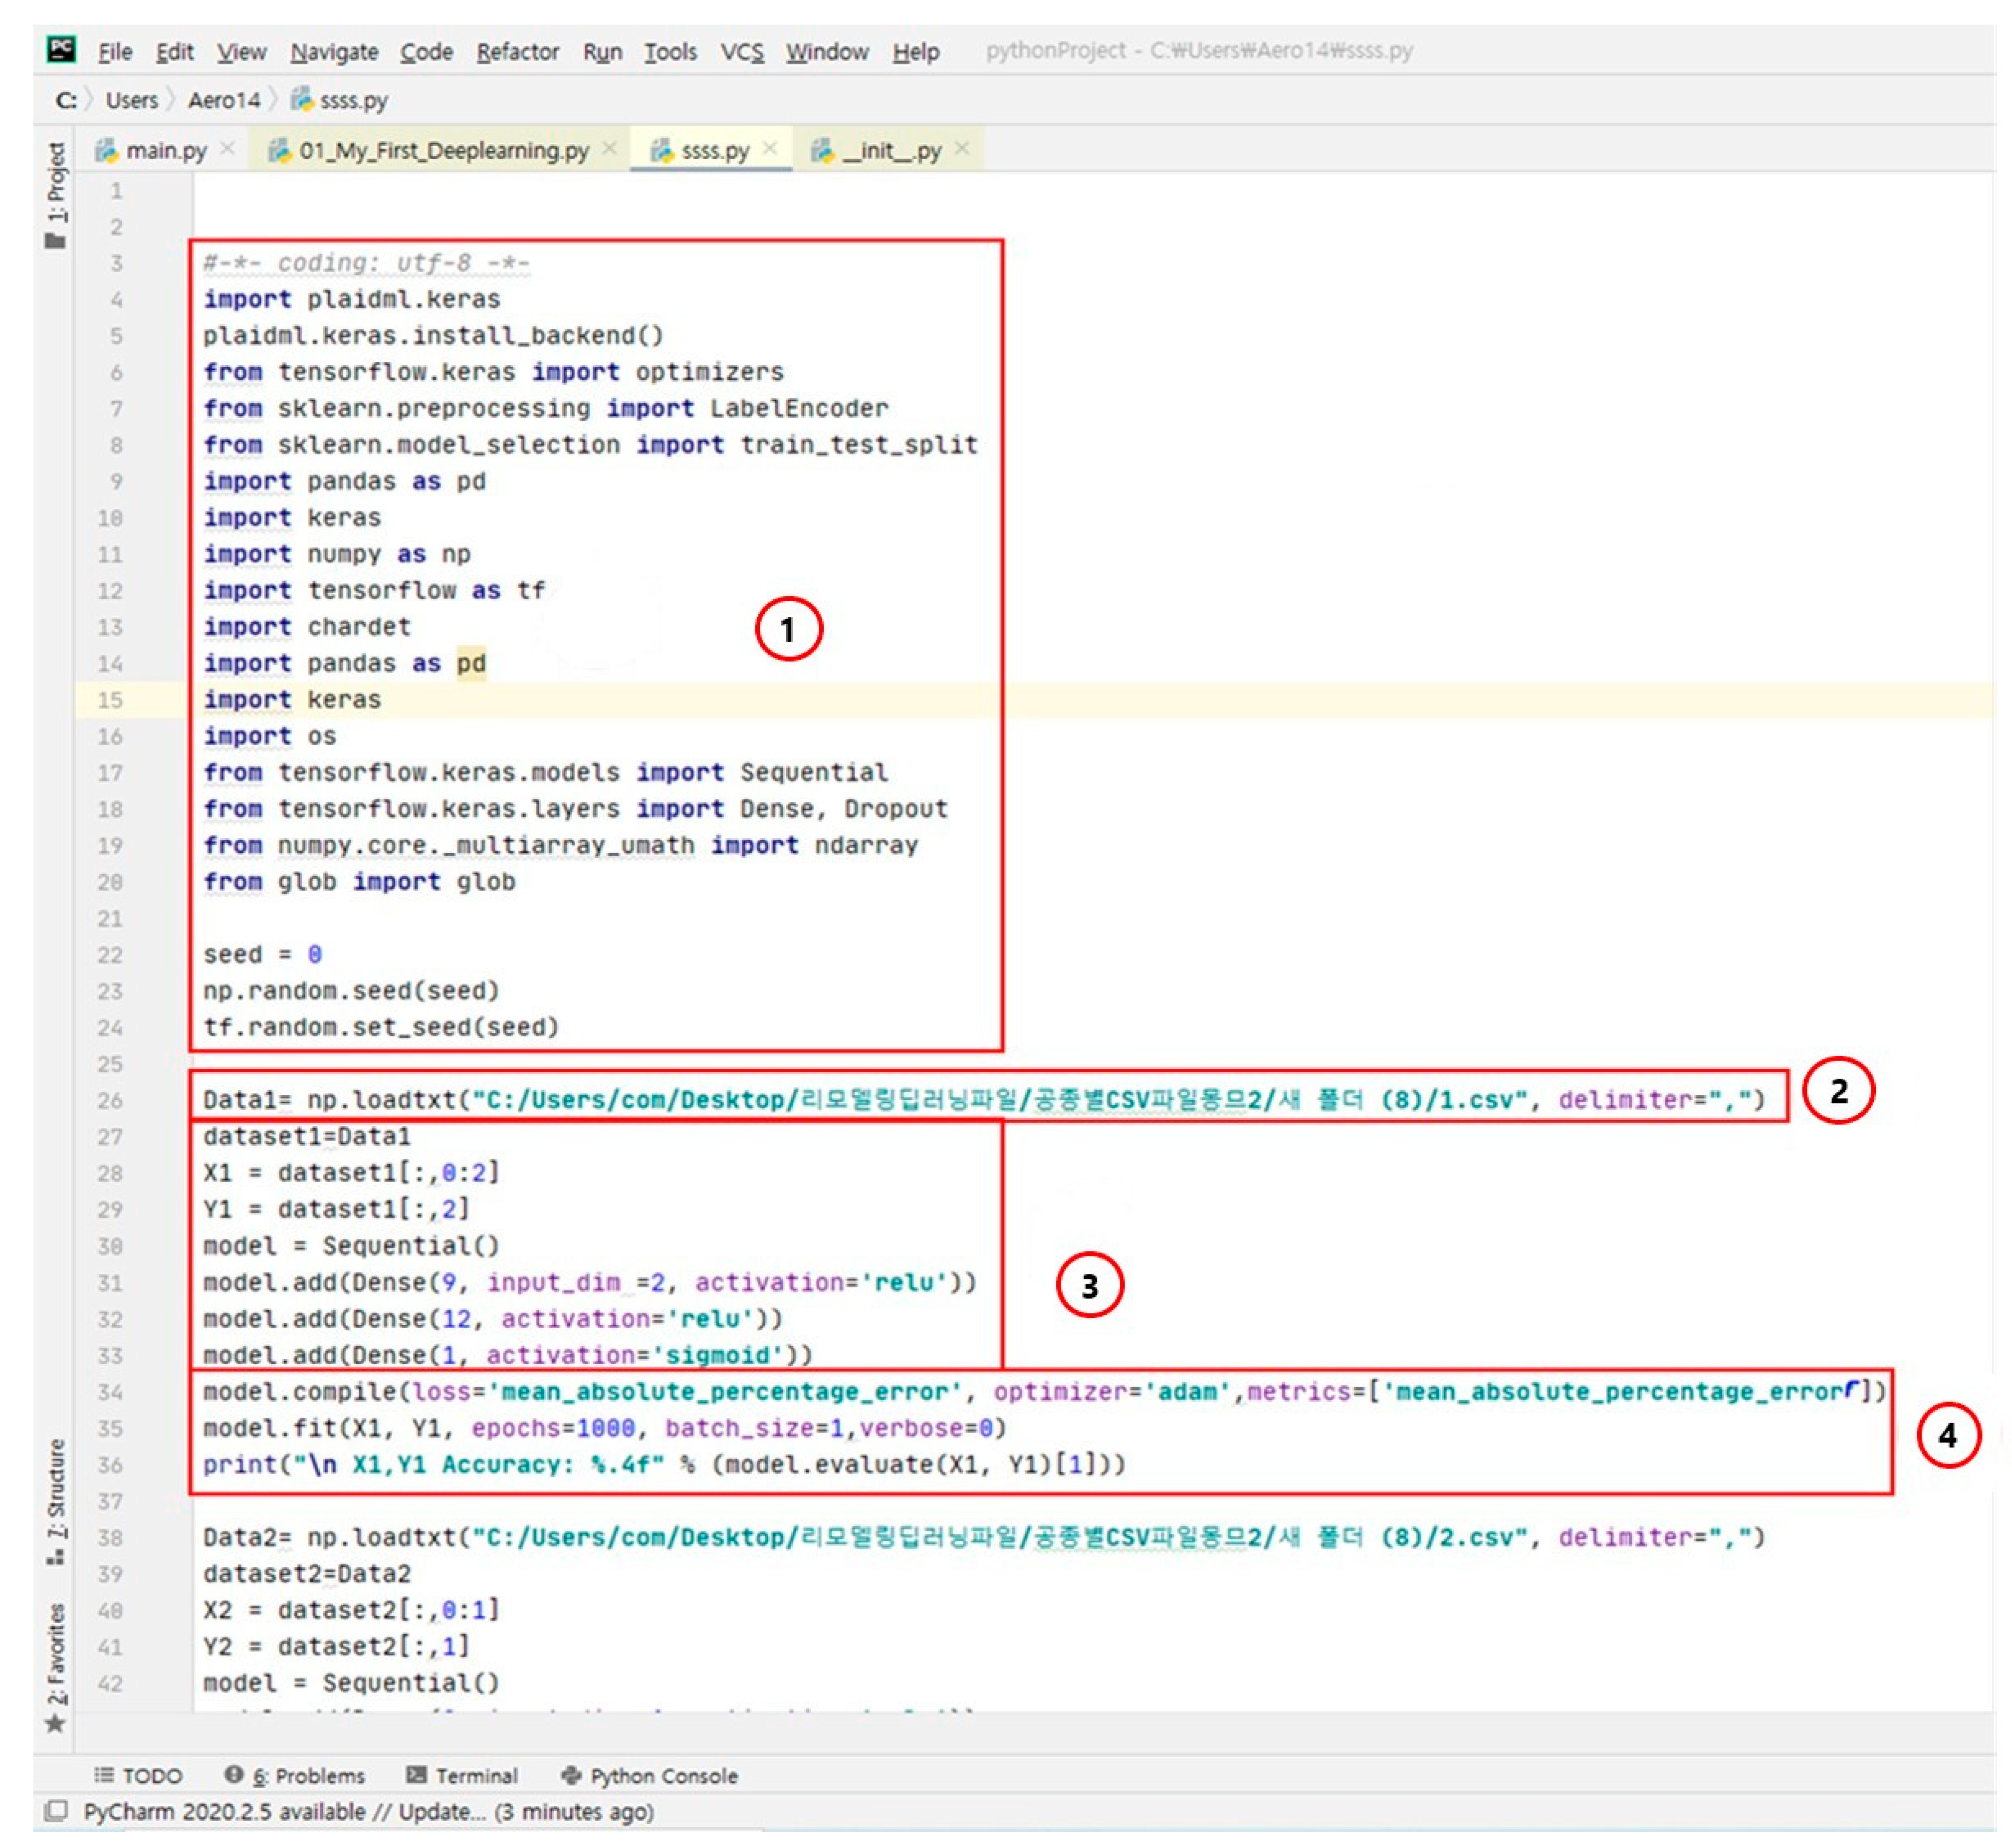
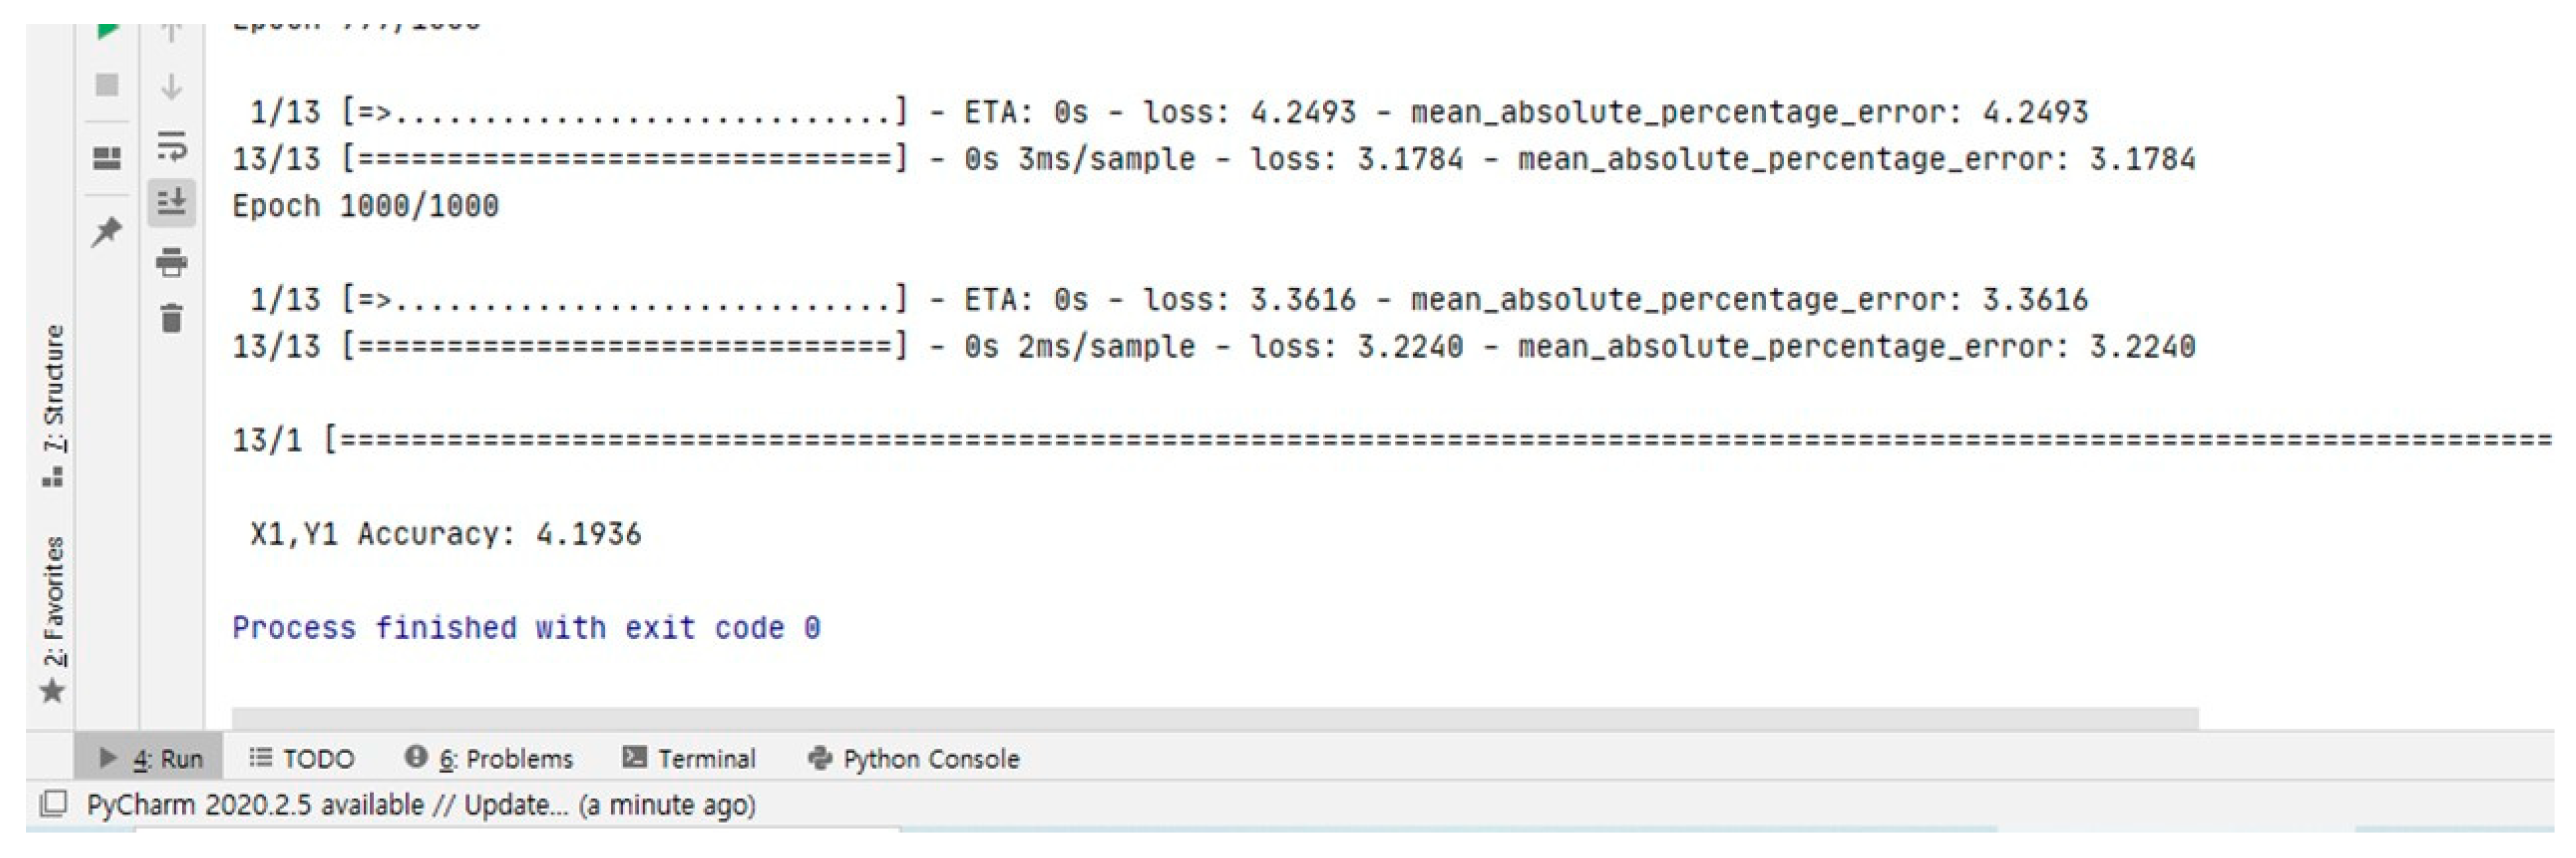
3.4. Deep Learning Coding

Python®, Tensorflow®, and Keras® were used to perform DL. A screenshot of the DL programming, Phycharm®, is depicted in Figure 5. The coding process was divided into four parts. As shown in Figure 5, part ① uploads the essential processing tools before executing the DL program. They are Numpy®, a tool for processing raw data, Pandas® for loading rows and columns in the database, and Chardet® for loading the CSV file format. In part ②, DL can be executed by entering the path where the CVS file exists. In part ③, the positions of input(x) and output(y) in the database are designated, and the use of the Sequential Neural Network is allocated. Next, the number of layers is specified. The function used in the layer is a mixture of a rectified linear unit (ReLU) and sigmoid. In part ④, the method used to calculate and display the value is entered. The Mean Absolute Percentage Error (MAPE) is employed as the system error value. It has been designed to study 1000 times, and although it takes a long time, each case is entered so that a more accurate value can be calculated.
Figure 6 depicts an example of the DL output obtained by the DL coding process. Thirteen historical projects were used. In predicting the renovation cost, the two real case projects failed to match the output of the DL approach. Although the accuracy level happens to be high (error value of 4.1936), this DL approach has limitations in predicting the renovation cost because this single DL process cannot guarantee the reliability of cost prediction, as discussed in Simulation-based DL Results.
To expand the dataset by combining the Monte Carlo simulations, each work item was simulated based on the probability type, as discussed earlier. Therefore, 3600 (=36 × 100) simulation runs were incorporated into the DL algorithm. Each simulation constructed 1000 deep learning sets and output the MAPE as the result. If the simulation runs were used for the previous DL program, the averaged error was calculated. In Table 3, the simulation-based DL approach cost prediction results are provided. Using 15 real case projects, most work items were effectively predicted in terms of cost estimation, with a marginal error value. Out of a total of 100 simulations, the least error simulation run was obtained with an averaged error of 7.7%. The standard deviation of the error was 14.1%, as shown in Table 3. Unfortunately, the best-fit simulation run does not guarantee the accuracy level of all work types.
For example, in the case of “indirect mobilization work”, the work item cost is predicted very accurately at 2.6%, but in the case of “pile construction”, the accuracy is as low as 80.0%. The authors found that there was a difference in the accuracy between the individual work items and the total cost. The main reason for this is that the number of historical cases was very small. Although 15 cases were used in the system, it is difficult to accurately predict the individual work item cost. This is an inherent limitation of this study. However, the data on pile construction work items may be insufficient. The pile work is associated with two QIs and one design element: building area (Q3), number of floors (Q7), and underground parking lot expansion (B2) (see Table 2). The authors found that 1 of the 15 case projects was regarded as an outlier due to existing underground conditions. Therefore, this limitation can be reduced when a sufficient amount of data is gathered in the proposed algorithm. Thus, the system can be further improved when the outlier issue is tackled with an in-depth statistical analysis.

4. System Validation

The validity of the proposed system was evaluated from two perspectives. First, to prove the effectiveness of the proposed algorithm, the accuracy level was compared with that of the manual method. Second, the estimation speed was analyzed by comparing the data processing time with that of the conventional approach. Third, experienced cost engineers evaluated the reliability of cost prediction.

4.1. Accuracy Comparison with Manual-Based Estimation

In a previous study [1], the authors proposed a novel estimation process for an aged housing renovation project. Similar to this study, a design element-based estimation was employed with an accuracy level of 88%; that is, an error of 12%. Although the error level is acceptable [33], this method requires a continuous manual update process when new historical data are added to the system.
Numerous attempts have been made to improve the accuracy by modifying the estimation algorithm in this method. However, when a new case is added, the accuracy level is significantly reduced, with no case being found below 12%. Presumably, the optimized value for some cases is not appropriate for the newly added case. In contrast, the method proposed in this study improves the accuracy, demonstrating an error rate of 7.7% for the 15 cases.
In addition, the purpose of this study is to provide a tool for early stage estimation. It is thus appropriate to guarantee an accuracy level of 15% during the study or feasibility stage (class 4), according to the AACE [34]. It was proven that the error rate of this system was less than 15%. Therefore, it can be said that this study presents a novel methodology with a high accuracy level, despite using very little information for automation estimation.

4.2. Time Requireed for Automation Estimation

To evaluate the efficiency of this system, it was theoretically compared with the optimization process. Given a linear programming with an objective function of “maximize, X × Y × Z” and constraint functions of variables X, Y, and Z, specific numbers can be generated, one by one, in a computerized process to find the optimum case by changing variables.
The number of all possible cases was analyzed as follows. The left side of Table 3 is part of the design element–work–probability table, as shown in Table 2. There are 43 design element–work item relationships. In each project, nine probability distribution types are used. Each probability distribution is calculated with 14 decimal places and used as raw data in the DL program. The total number of actual historical projects is 15. When there are five design element options, the number of all possible cases to be implemented is as follows:
(1)
No. of potential values for five design element options = 5 × 10¹³
(2)
No. of all design elements = (5 × 10¹³)43
(3)
No. of all project cases = ((5 × 10¹³)43)15
(4)
No. of all cases = 6.8 × 108835
The number in this case exceeds the computational power of current technology. For example, in 2016, Alpha-Go introduced a supercomputer in DL because it was impossible to search all the cases of Go (361! = 1.43 × 10768) [35]. Thus, the method proposed in this study can automatically proceed with an estimate faster than searching for the number of all cases. Compared with the conventional method, it takes approximately three days to find the best solution by adding only two cases into the system [33].

4.3. Reliability of Cost Prediction

The system’s results have been self-validated because real project data were used in the development of an algorithm with the minimum error value. A workshop with experienced industry practitioners was conducted to guarantee system reliability. They replied that the system was a useful tool for providing categorical cost items. Because project stakeholders (i.e., homeowners) are highly concerned about economic feasibility, it is a prerequisite to assure reliable cost prediction for the project. In addition, many renovation projects have been suspended because of poor cost estimation prediction. Furthermore, it is very time-consuming to determine the relationship between project cost and design alternatives. In the opinion of the experienced practitioners present in the workshop, this system has successfully revealed the relationship between these two elements in an explicit way.

5. Conclusions

This study proposes a new cost estimation methodology that expedites decision-making for project stakeholders at an earlier stage. Fifteen historical renovation projects were analyzed to derive 20 design elements with three or four detailed options. These design elements were then linked with 36 work items.
Using the current manual method, the update process is time-consuming. Therefore, even if cases accumulate, an additional method is required to determine the optimal relationship. Deep learning was employed for this optimization issue, and an error distribution analysis was performed by applying Monte Carlo simulation to improve the accuracy level of the total cost prediction. In particular, this model is characterized by its ease of use and higher accuracy and reliability compared to the manual method. Through the proposed system, project stakeholders can effectively and efficiently calculate renovation costs at an earlier stage.
The academic and practical contributions of this study are summarized as follows.
(1)
Although various estimation methods in conjunction with design elements are widely used in the industry, a limited approach is employed for renovation projects due to the lack of information. In this study, design elements are interlinked with work-sorted items so that project stakeholders can change the design variables to estimate the total cost.
(2)
There is a limited number of estimation methods that include cost influence factors because they are mainly operated based on “after-the-fact” data generated in the construction stage. In this study, a new method is developed by predicting the design information that may develop during the construction stage, and estimating the project cost.
(3)
In the existing DL study, numerous “black box” problems are created by conducting research without data classification. To minimize this, a new method is proposed that analyzes the data in a prospective manner and that links only the relevant data to the DL input.
(4)
In an apartment renovation project, the project cost is estimated without considering its characteristics. This study presents a practical tool to incorporate project characteristics with design alternatives to accurately calculate renovation cost in the planning stage.
(5)
Based on the existing manual method, the estimation is applied to provide a more rapid and accurate result. The method introduced in this study substantially reduces the time required for theoretical and practical estimation work.
The limitations of this study and suggestions for future research are as follows.
(1)
The scope of this study is limited to apartment renovation projects. Compared to other buildings, apartments have a regular shape, and thus their design elements are easily extracted. In the case of future research using other buildings, it is necessary to analyze and research design elements that are common between such buildings and which significantly affect their construction cost.
(2)
This study attempted to determine the relationship between design elements, construction work items, and quantity information simultaneously by applying a simulation-based DL approach. Regarding DL, new techniques are continuously being developed. If more advanced techniques are used in the future, the accuracy and calculation speed are expected to be greatly improved.
(3)
To alleviate the uncertainty in the calculation of construction cost in this study, the distribution of construction cost by design element–work type was determined with the help of experts. It is believed that the accuracy will be further improved if the case is reset after a sufficient accumulation of data.
(4)
The system’s results can also be made more reliable when the outlier data are statistically analyzed and detected from the dataset automatically.
If further research is conducted, system robustness can be greatly improved. One of the main benefits of this study is the improvement of the existing estimation process for renovation projects. If this type of state-of-the art approach can expedite decision-making for renovation building projects, it can certainly contribute to the sustainability of the built environment in the future.

Author Contributions

Conceptualization, H.S.C.; methodology, J.K. and H.S.C.; software, J.K.; validation, J.K. and H.S.C.; formal analysis, J.K. and H.S.C.; investigation, J.K. and H.S.C.; resources, J.K. and H.S.C.; data curation, J.K. and H.S.C.; writing—original draft preparation, J.K. and H.S.C.; writing—review and editing, H.S.C.; visualization, J.K. and H.S.C.; supervision, H.S.C.; project administration, H.S.C.; funding acquisition, H.S.C. All authors have read and agreed to the published version of the manuscript.

Funding

This work was supported by the Korea Agency for Infrastructure Technology Advancement (KAIA) grant funded by the Ministry of Land, Infrastructure and Transport (Grant 22ORPS-B158109-03).

Informed Consent Statement

Not applicable.

Conflicts of Interest

The authors declare no conflict of interest.

References

  1. Kim, J.; Cha, H. Development of estimation system for housing remodeling cost through influence analysis by design elements. Korean J. Constr. Eng. Manag. 2018, 19, 65–78. [Google Scholar]
  2. Whiteman, W.E.; Irvvig, H.G. Disturbance Scheduling Technique for Managing Renovation Work. J. Constr. Eng. Manag. 1988, 114, 191–213. [Google Scholar] [CrossRef]
  3. Daoud, O.E.K. The Architect/Engineer’s Role in Rehabilitation Work. J. Constr. Eng. Manag. 1997, 123, 1–5. [Google Scholar] [CrossRef]
  4. Su, X.; Andoh, A.r.; Cai, H.; Pan, J.; Kandil, A.; Said, H.M. GIS-based dynamic construction site material layout evaluation for building renovation projects. Autom. Constr. 2012, 27, 40–49. [Google Scholar] [CrossRef]
  5. Akinosho, T.; Oyedele, L.; Bilal, M.; Ajayi, A.; Degado, M.; Davila, M.; Akinade, O.; Ahmed, A. Deep learning in the construction industry: A review of present status and future innovations. J. Build. Eng. 2020, 32, 101827. [Google Scholar] [CrossRef]
  6. Kim, G.H.; An, S.H.; Kang, K.I. Comparison of construction cost estimating models based on regression analysis, neural networks, and case-based reasoning. Build. Environ. 2004, 39, 1235–1242. [Google Scholar] [CrossRef]
  7. Karaca, I.; Gransberg, D.D.; Jeong, H.D. Improving the Accuracy of Early Cost Estimates on Transportation Infrastructure Projects. J. Manag. Eng. 2020, 36, 04020063. [Google Scholar] [CrossRef]
  8. Bortolini, R.; Forcada, N. A probabilistic performance evaluation for buildings and constructed assets. Build. Res. Inf. 2020, 48, 838–855. [Google Scholar] [CrossRef]
  9. Riquelme, P.; Serpell, A. Adding qualitative context factors to analogy estimation of construction projects. Procedia Soc. Behav. Sci. 2013, 74, 190–202. [Google Scholar] [CrossRef] [Green Version]
  10. Ji, S.; Park, M.; Lee, H. Data preprocessing-based parametric cost model for building projects: Case studies of Korean construction projects. ASCE J. Constr. Engr. Manag. 2010, 136, 844–853. [Google Scholar] [CrossRef]
  11. Payam, B.; Touran, A. An overview of budget contingency calculation methods in construction industry. Procedia Eng. 2014, 85, 52–60. [Google Scholar]
  12. Khamooshi, H.; Cioffi, D.F. Uncertainty in task duration and cost estimates: Fusion of probabilistic forecasts and deterministic scheduling. ASCE J. Constr. Engr. Manag. 2013, 139, 488–497. [Google Scholar] [CrossRef]
  13. BCIS. Elemental Standard Form of Cost Analysis–Principles, Instructions, Elements and Definitions, 4th ed.; RICS Building Cost Information Service: London, UK, 2012. [Google Scholar]
  14. BCA. Code of Practice on Buildability; Building and Construction Authority: Singapore, 2017. [Google Scholar]
  15. Wang, X.; Xia, N.; Zhang, Z.; Wu, C.; Liu, B. Human Safety Risks and Their Interactions in China’s Subways: Stakeholder Perspectives. J. Manag. Eng. 2017, 33, 05017004. [Google Scholar] [CrossRef]
  16. Choi, J.; Kim, H.; Kim, I. Open BIM-based quantity take-off system for schematic estimation of building frame in early design stage. J. Comput. Des. Eng. 2015, 2, 16–25. [Google Scholar] [CrossRef] [Green Version]
  17. Rafiei, M.H.; Adeli, H. Novel machine-learning model for estimating construction costs considering economic variables and indexes. J. Constr. Eng. Manag. 2018, 144, 04018106. [Google Scholar] [CrossRef]
  18. Jafarzadeh, R.; Ingham, J.M.; Wilkinson, S.; González, V.; Aghakouchak, A.A. Application of artificial neural network methodology for predicting seismic retrofit construction costs. J. Constr. Eng. Manag. 2014, 140, 04013044. [Google Scholar] [CrossRef]
  19. Elmousalami, H.H. Artificial intelligence and parametric construction cost estimate modeling: State-of-the-art review. J. Constr. Eng. Manag. 2020, 146, 03119008. [Google Scholar] [CrossRef]
  20. Al-Tabtabai, H. A framework for developing an expert analysis and forecasting system for construction projects. Expert Syst. Appl. 1998, 14, 259–273. [Google Scholar] [CrossRef]
  21. Hegazy, T.; Ayed, A. Neural network model for parametric cost estimation of highway projects. J. Constr. Eng. Manag. 1998, 124, 210–218. [Google Scholar] [CrossRef]
  22. Günaydın, H.M.; Doğan, S.Z. A neural network approach for early cost estimation of structural systems of buildings. Int. J. Proj. Manag. 2004, 22, 595–602. [Google Scholar] [CrossRef] [Green Version]
  23. Hola, B.; Schabowicz, K. Estimation of earthworks execution time cost by means of artificial neural networks. Autom. Constr. 2010, 19, 570–579. [Google Scholar] [CrossRef]
  24. Gunduz, M.; Ugur, L.O.; Ozturk, E. Parametric cost estimation system for light rail transit and metro trackworks. Expert Syst. Appl. 2011, 38, 2873–2877. [Google Scholar] [CrossRef]
  25. Lhee, S.C.; Issa, R.R.; Flood, I. Prediction of financial contingency for asphalt resurfacing projects using artificial neural networks. J. Constr. Eng. Manag. 2012, 138, 22–30. [Google Scholar] [CrossRef]
  26. Kim, G.H.; Seo, D.S.; Kang, K.I. Hybrid models of neural networks and genetic algorithms for predicting preliminary cost estimates. J. Comput. Civ. Eng. 2005, 19, 208–211. [Google Scholar]
  27. Cheng, M.Y.; Tsai, H.C.; Hsieh, W.S. Web-based conceptual cost estimates for construction projects using Evolutionary Fuzzy Neural Inference Model. Autom. Constr. 2009, 18, 164–172. [Google Scholar] [CrossRef]
  28. Attalla, M.; Hegazy, T. Predicting cost deviation in reconstruction projects: Artificial neural networks versus regression. J. Constr. Eng. Manag. 2003, 129, 405–411. [Google Scholar] [CrossRef]
  29. Koo, C.; Hong, T.; Hyun, C.; Koo, K. A CBR-based hybrid model for predicting a construction duration and cost based on project characteristics in multi-family housing projects. Can. J. Civ. Eng. 2010, 37, 739–752. [Google Scholar] [CrossRef]
  30. Marzouk, M.M. Integrated Monte Carlo/ANN Model for Markup Estimating. In Proceedings of the Annual Conference of the Canadian Society for Civil Engineering, Montréal, QB, Canada, 5–8 June 2002. [Google Scholar]
  31. Son, H.; Kim, C.; Kim, C. Hybrid principal component analysis and support vector machine model for predicting the cost performance of commercial building projects using pre-project planning variables. Autom. Constr. 2012, 27, 60–66. [Google Scholar] [CrossRef]
  32. Lu, M.; AbouRizk, S.M.; Hermann, U.H. Sensitivity analysis of neural networks in spool fabrication productivity studies. J. Comput. Civ. Eng. 2001, 15, 299–308. [Google Scholar] [CrossRef]
  33. Kim, J.; Cha, H. Development of LD-MCS Hybrid expert system for automatic estimation of apartment remodeling. Korea Inst. Constr. Eng. Manag. 2020, 21, 113–124. [Google Scholar]
  34. Association for the Advancement of Cost Engineers (AACE). Cost Estimation Classification System, AACE 17R-97; AACE: Morgantown, WV, USA, 2020. [Google Scholar]
  35. Chen, Z.; Suen, C.Y. Measuring the complexity of rule-based expert systems. Expert Syst. Appl. 1994, 7, 467–481. [Google Scholar] [CrossRef]
Figure 1. Various means of linking design elements to work items [13,14,15].
Sustainability 14 00564 g001
Figure 2. Traditional vs. DL-based estimation process.
Sustainability 14 00564 g002
Figure 3. Process map of the DL-based estimation system [33].
Sustainability 14 00564 g003
Figure 4. Probability distribution type [1].
Sustainability 14 00564 g004
Figure 5. Deep learning coding (Partial).
Sustainability 14 00564 g005
Figure 6. One example of simulation result from DL.
Sustainability 14 00564 g006
Table 1. Historical apartment renovation data (partial).
Project Characteristics/Design ElementCase Project
ABC
Quantity/Cost informationQ1. LocationSeoulSeoulSung-Nam
Q2. No. of households120–1381753–2015770–877
Q3. Building area (m2)1037–17258294–14,8835672–8722
Q4. Building-to-land ratio21.4–35.615.6–2815.1–23.2
Q5. Total ground area11,490–18,78797,362–153,98764,734–95,683
Q6. Total underground area1094–71108018–93,4537893–53,200
Q7. No. of floors15–1815–1818–20
Q8. No. of parking lot floors0–21–31–3
Q9. Unit cost (KRW/m2)1484 K1296 K2078 K
AreaA1. No. of core expansion001
A2. Degree of balcony expansion101010
Parking lotB1. Ground parking lot expansion000
B2. Underground parking lot expansion222
B3. Elevator hall extension to underground233
Existing structural featureC1. Structural safety ratingBBB
C2. Structure typewallwallwall
New structural featureD1. Bearing wall demolition201010
D2. Piloti utilizationnoyesno
D3. Degree of seismic reinforcementlargelargelarge
Other featuresE1. Foundation typePHC pilePHC pilePHC pile
E2. Degree of interior renovationhighhighhigh
E3. Degree of exterior renovationhighhighhigh
E4. Degree of landscapinghighhighhigh
E5. Building facilitieshighhighhigh
E6. Insulation work typehighhighhigh
E7. Pit layer changechangechangechange
E8. Anti-noise improvementhighhighmedium
E9. HVAC changechangechangechange
Table 2. Design element–work item relationship.
Work ItemProject InformationUnit Cost (KRW/m2)
Level 1Level 2Level 3Level 4Quantity InformationDesign Element (Prob. Type, Range)
Upper-groundRenovationDemolitionInteriorQ5E2 (3, 2.0~3.0)8.22
StructureQ3, Q7A1 (5, 0.8~1.2), B3 (6, 1.0~1.4), D1(1, 2.0~2.2), D2 (5, 1.3~1.7)8.22
MEPQ3, Q7E5 (6, 1.0~1.4)8.22
ExteriorQ5, Q7E3 (8, 1.0~1.2)8.22
Structural enforcementFoundationQ3C1 (4, 1.0~1.2) C2 (4, 1.0~1.2)10.49
StructureQ3, Q7C1 (6, 1.3~1.7)10.49
SeismicQ3, Q7D3 (4, 2.0~3.0)10.49
CommonMobilizationIndirectQ3N/A13.35
DirectQ3, Q7N/A13.35
New constructionStructureQ3, Q7A2 (3, 2.0~3.0), B1 (5, 0.8~1.2), B3 (1, 1.0~1.4)10.49
MasonryQ3, Q7E2 (8, 2.0~2.5)3.81
PlasterQ3, Q7A2 (9, 2.0~3.0), E2 (9, 2.0~3.0), E8 (9, 2.0~3.0)9.06
Water proofQ3, Q7E2 (5, 2.4~2.6)2.86
TileQ3, Q7A2 (5, 2.4~2.6), E2 (5, 2.4~2.6)6.2
SteelQ3, Q7E2 (2, 2.5~3.0)12.87
StoneQ3, Q7E2 (2, 2.5~3.0)23.84
ExteriorQ3, Q5, Q7E3 (6, 0.9~1.5), E6 (6, 0.9~1.5)6.68
WindowQ3, Q7E2 (8, 2.0~2.5)36.24
PaintQ3, Q7E2 (8, 2.0~2.5)1.91
FinishingQ3, Q7E2 (8, 2.0~2.5)9.06
UndergroundRenovationDemolitionStructure-relatedQ6A1 (5, 0.9~1.1), B3 (6, 1.0~1.4)8.34
MEP-relatedQ6N/A8.34
Structural enforcementStructure typeQ3, Q7C1 (4, 1.0~12.0), C2 (4, 1.2~1.8)4.2
Current conditionQ3, Q7C1 (4, 1.0~2.0)4.2
Seismic Q3, Q7D3 (4, 1.0~20)4.2
FoundationQ3, Q7E1 (3, 1.7~2.3)4.2
EarthworkPileQ3, Q7B2 (1, 1.5~2.0)43.39
ShoringQ3B2 (1, 1.5~2.0)32.42
CommonStructural workQ6B2 (3, 1.7~2.3), B3 (1, 0.9~1.4), E7 (5, 1.4~1.6)4.20
MasonryQ6N/A1.91
PlastererQ6N/A4.77
PaintQ6N/A0.95
OthersCommonMechanicalQ5E9 (5, 1.4~1.7)52.45
ElectricQ5N/A55.79
LandscapeQ5B1 (5, 0.9~1.1), E4 (5, 1.1~1.3)12.87
MISCQ5, Q6N/A20.50
Table 3. Simulation-based DL result.
Work ItemMAPE (%)
Level 1Level 2Level 3Level 4
Upper GroundRenovat’nDemolit’nInterior3.4
Structure4.1
MEP3.1
Exterior3.8
Strct. EnforcemtFoundation3.1
Structure3.4
Seismic3.5
CommonMobilizt’nIndirect2.6
Direct2.7
New Construct’nStructure2.6
Masonry8.7
Plaster24.8
Waterproof1.6
Tile10.9
Steel2.6
Stone2.6
Exterior3.5
Window2.5
Paint3.0
Finishing2.8
Under GroundRenovat’nDemolit’nStructure-related4.0
MEP-related3.5
Struct. EnforcemtStructure Type3.5
Current condition3.4
Seismic3.4
Foundation3.6
EarthworkPile80.0
Shoring3.1
CommonStructural3.8
Masonry5.3
Plasterer5.1
Paint41.4
OthersCommonMechanical4.7
Electrical7.3
Landscape3.1
MISC6.2
Average Error = 7.7%.
Publisher’s Note: MDPI stays neutral with regard to jurisdictional claims in published maps and institutional affiliations.

