
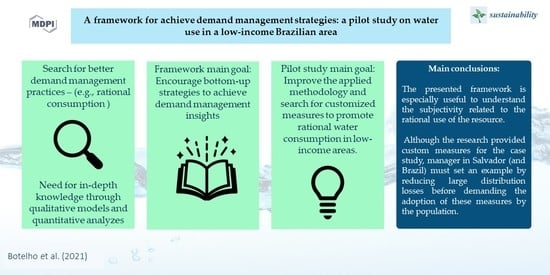
A Framework for Archive Demand Management Strategies: A Pilot Study on Water Use in a Low-Income Brazilian Area


Abstract
:
1. Introduction
2. Models for Understanding Consumption Motivations
- It has been described that the human psychosocial tendency is to believe that by performing one pro-environmental action previously, one is “authorized” to commit actions that cause environmental damage [11].
- There is also a propensity to reduce rational use measures when natural resources are or become more abundant, as in Israel, where demand control restrictions were relaxed owing to the scale of desalination use [12]. This could also indicate suppressed demand.
- Psychosocial factors are also mentioned as one of the causes of the rebound effect that occurs when a product’s efficiency improves, resulting in increased demand, canceling out the benefit gained. For example, it has been reported that increased car energy efficiency leads to increased car use, which results in increased congestion and greenhouse gas emissions [13].
- Hardin [14] described the “tragedy of the commons” in this context, which states that individual demand for finite resources leads to depletion of the resource. Corral-Verdugo et al. [15] developed a model based on questionnaires to measure the influence of the “tragedy of the commons” on the motivation for water conservation, identifying a trend of individual increases in consumption when individuals perceived that others wasted water.
- Steg [16] asserted that the personal values of individuals are the primary motivators of pro-environmental actions and that strategies that access and instigate these values through, for example, laws and regulations or technological instruments (such as a green light that turns on when consumption is low), or even feedback comparing consumption with that of neighbors, are the most effective.
- Ajzen and Cote [17] sought a method to assess attitudes, which are defined as the proclivity to evaluate a psychological object favorably or unfavorably and to relate these attitudes to the individual’s manifest behavior. He also cites the theory of planned behavior, which describes human behavior as being determined by three major factors: how the behavior is assessed (attitude toward the behavior), perception of social pressure on behavior (subjective norm), and the ability to perform the behavior (perceived behavioral control).
2.1. The Social Practices Approach
2.2. Conceptual Model of the Rationalization of Consumption
3. Comparison of Water Consumption Studies
4. Residential End Use Case Study Information
4.1. Research Context
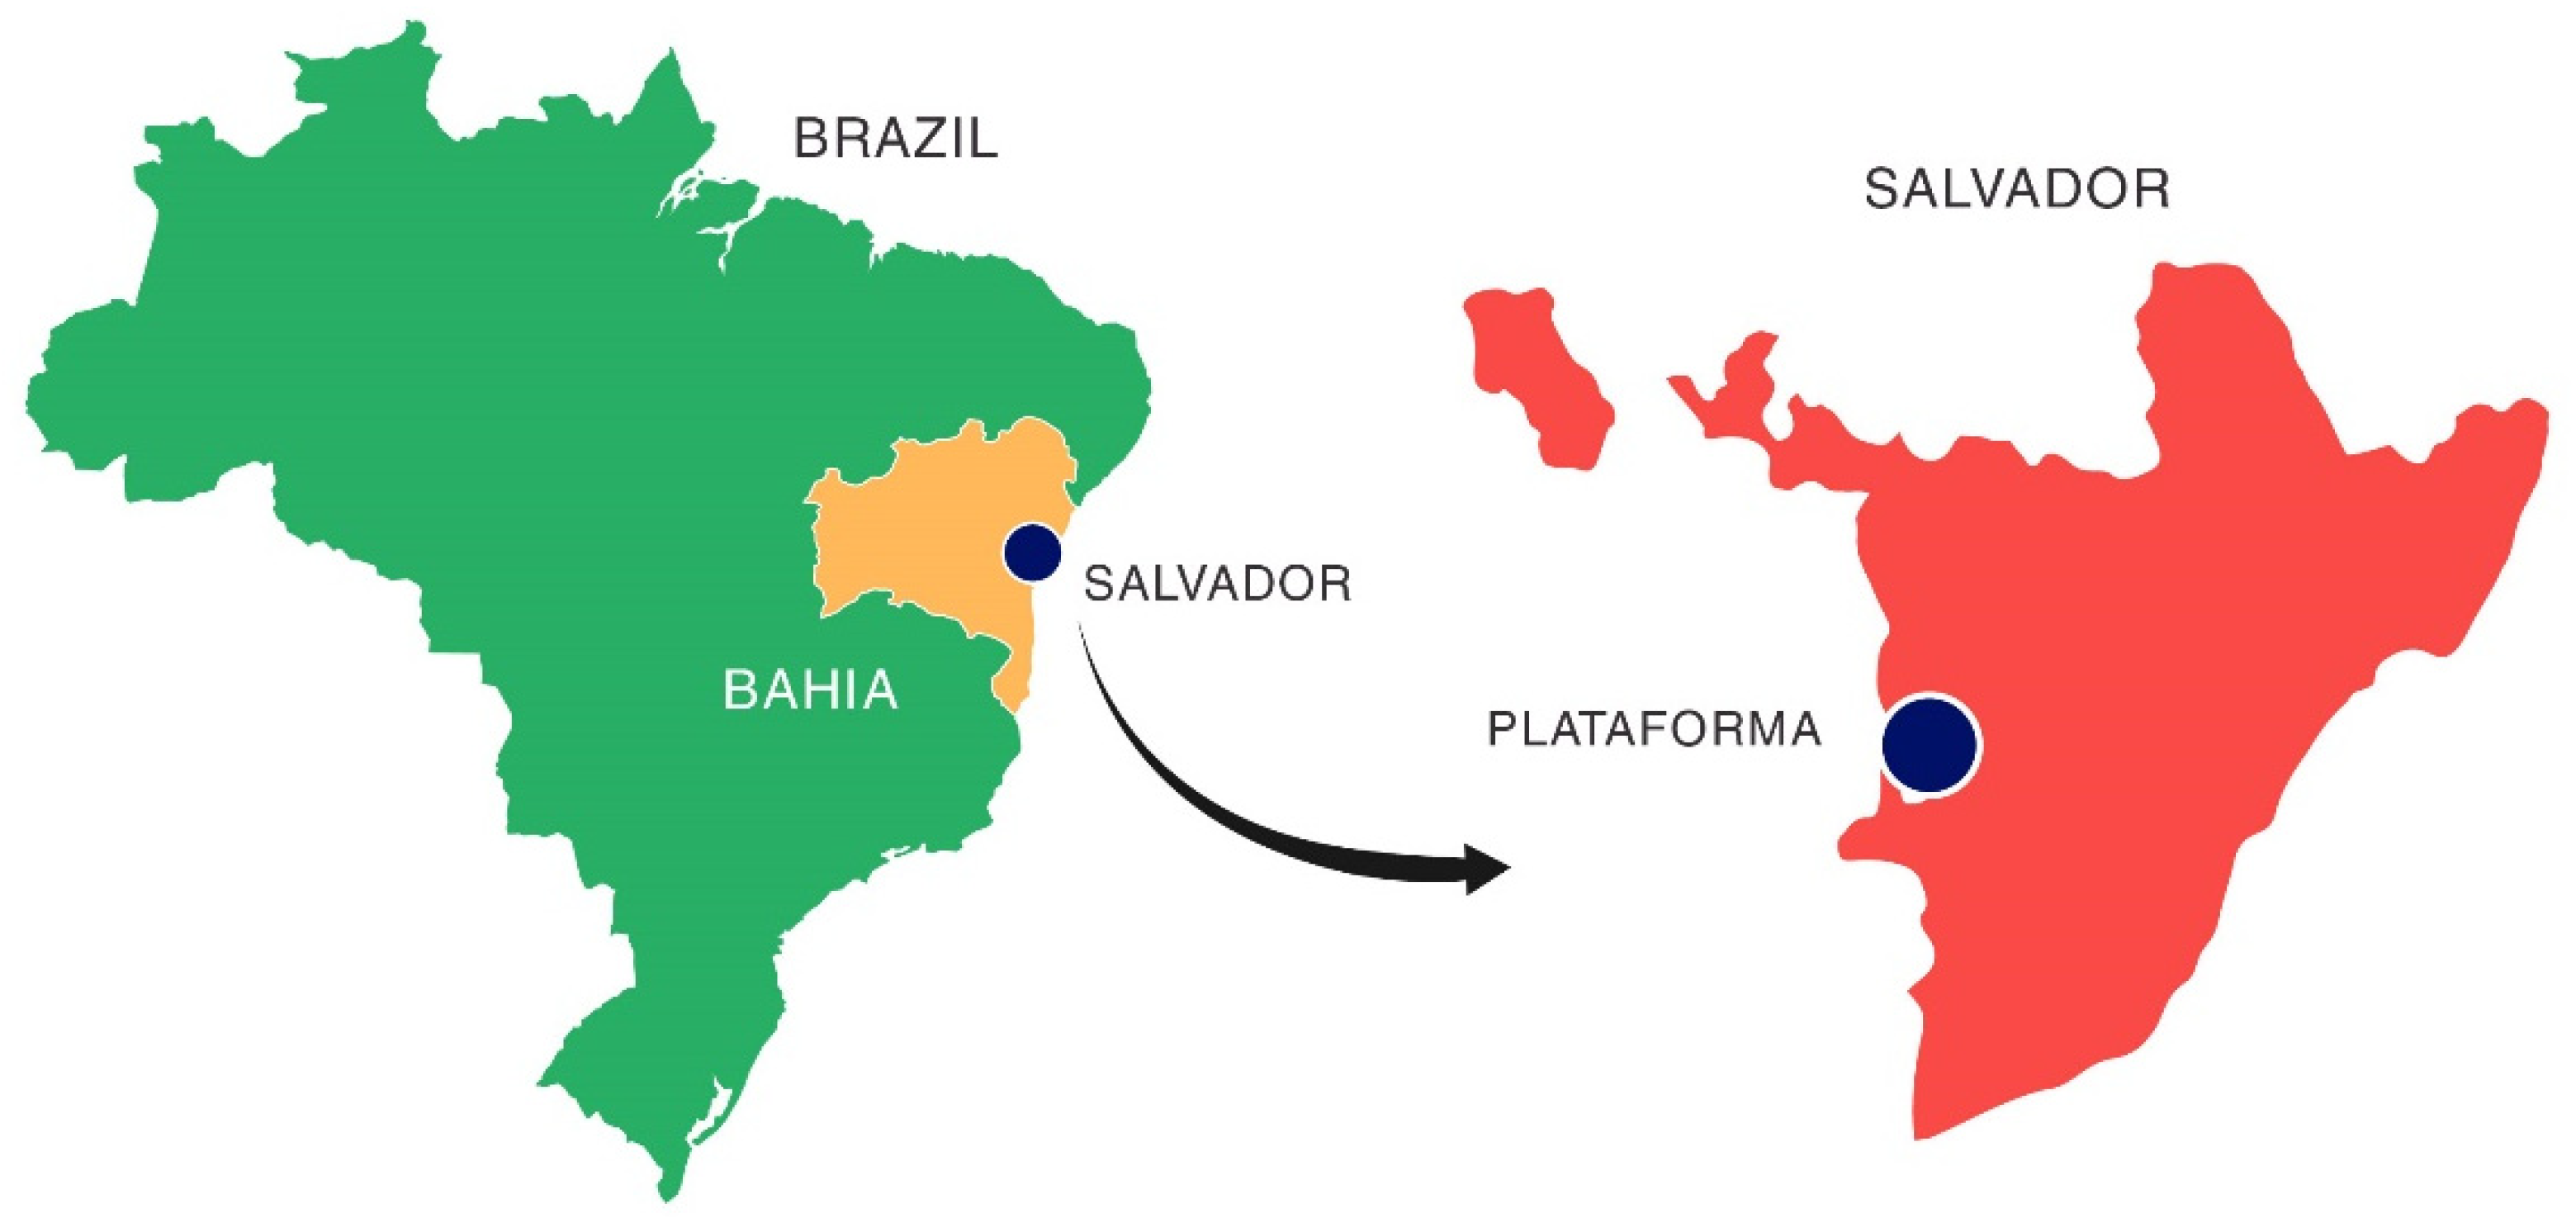
4.1.1. Salvador’s Characterization
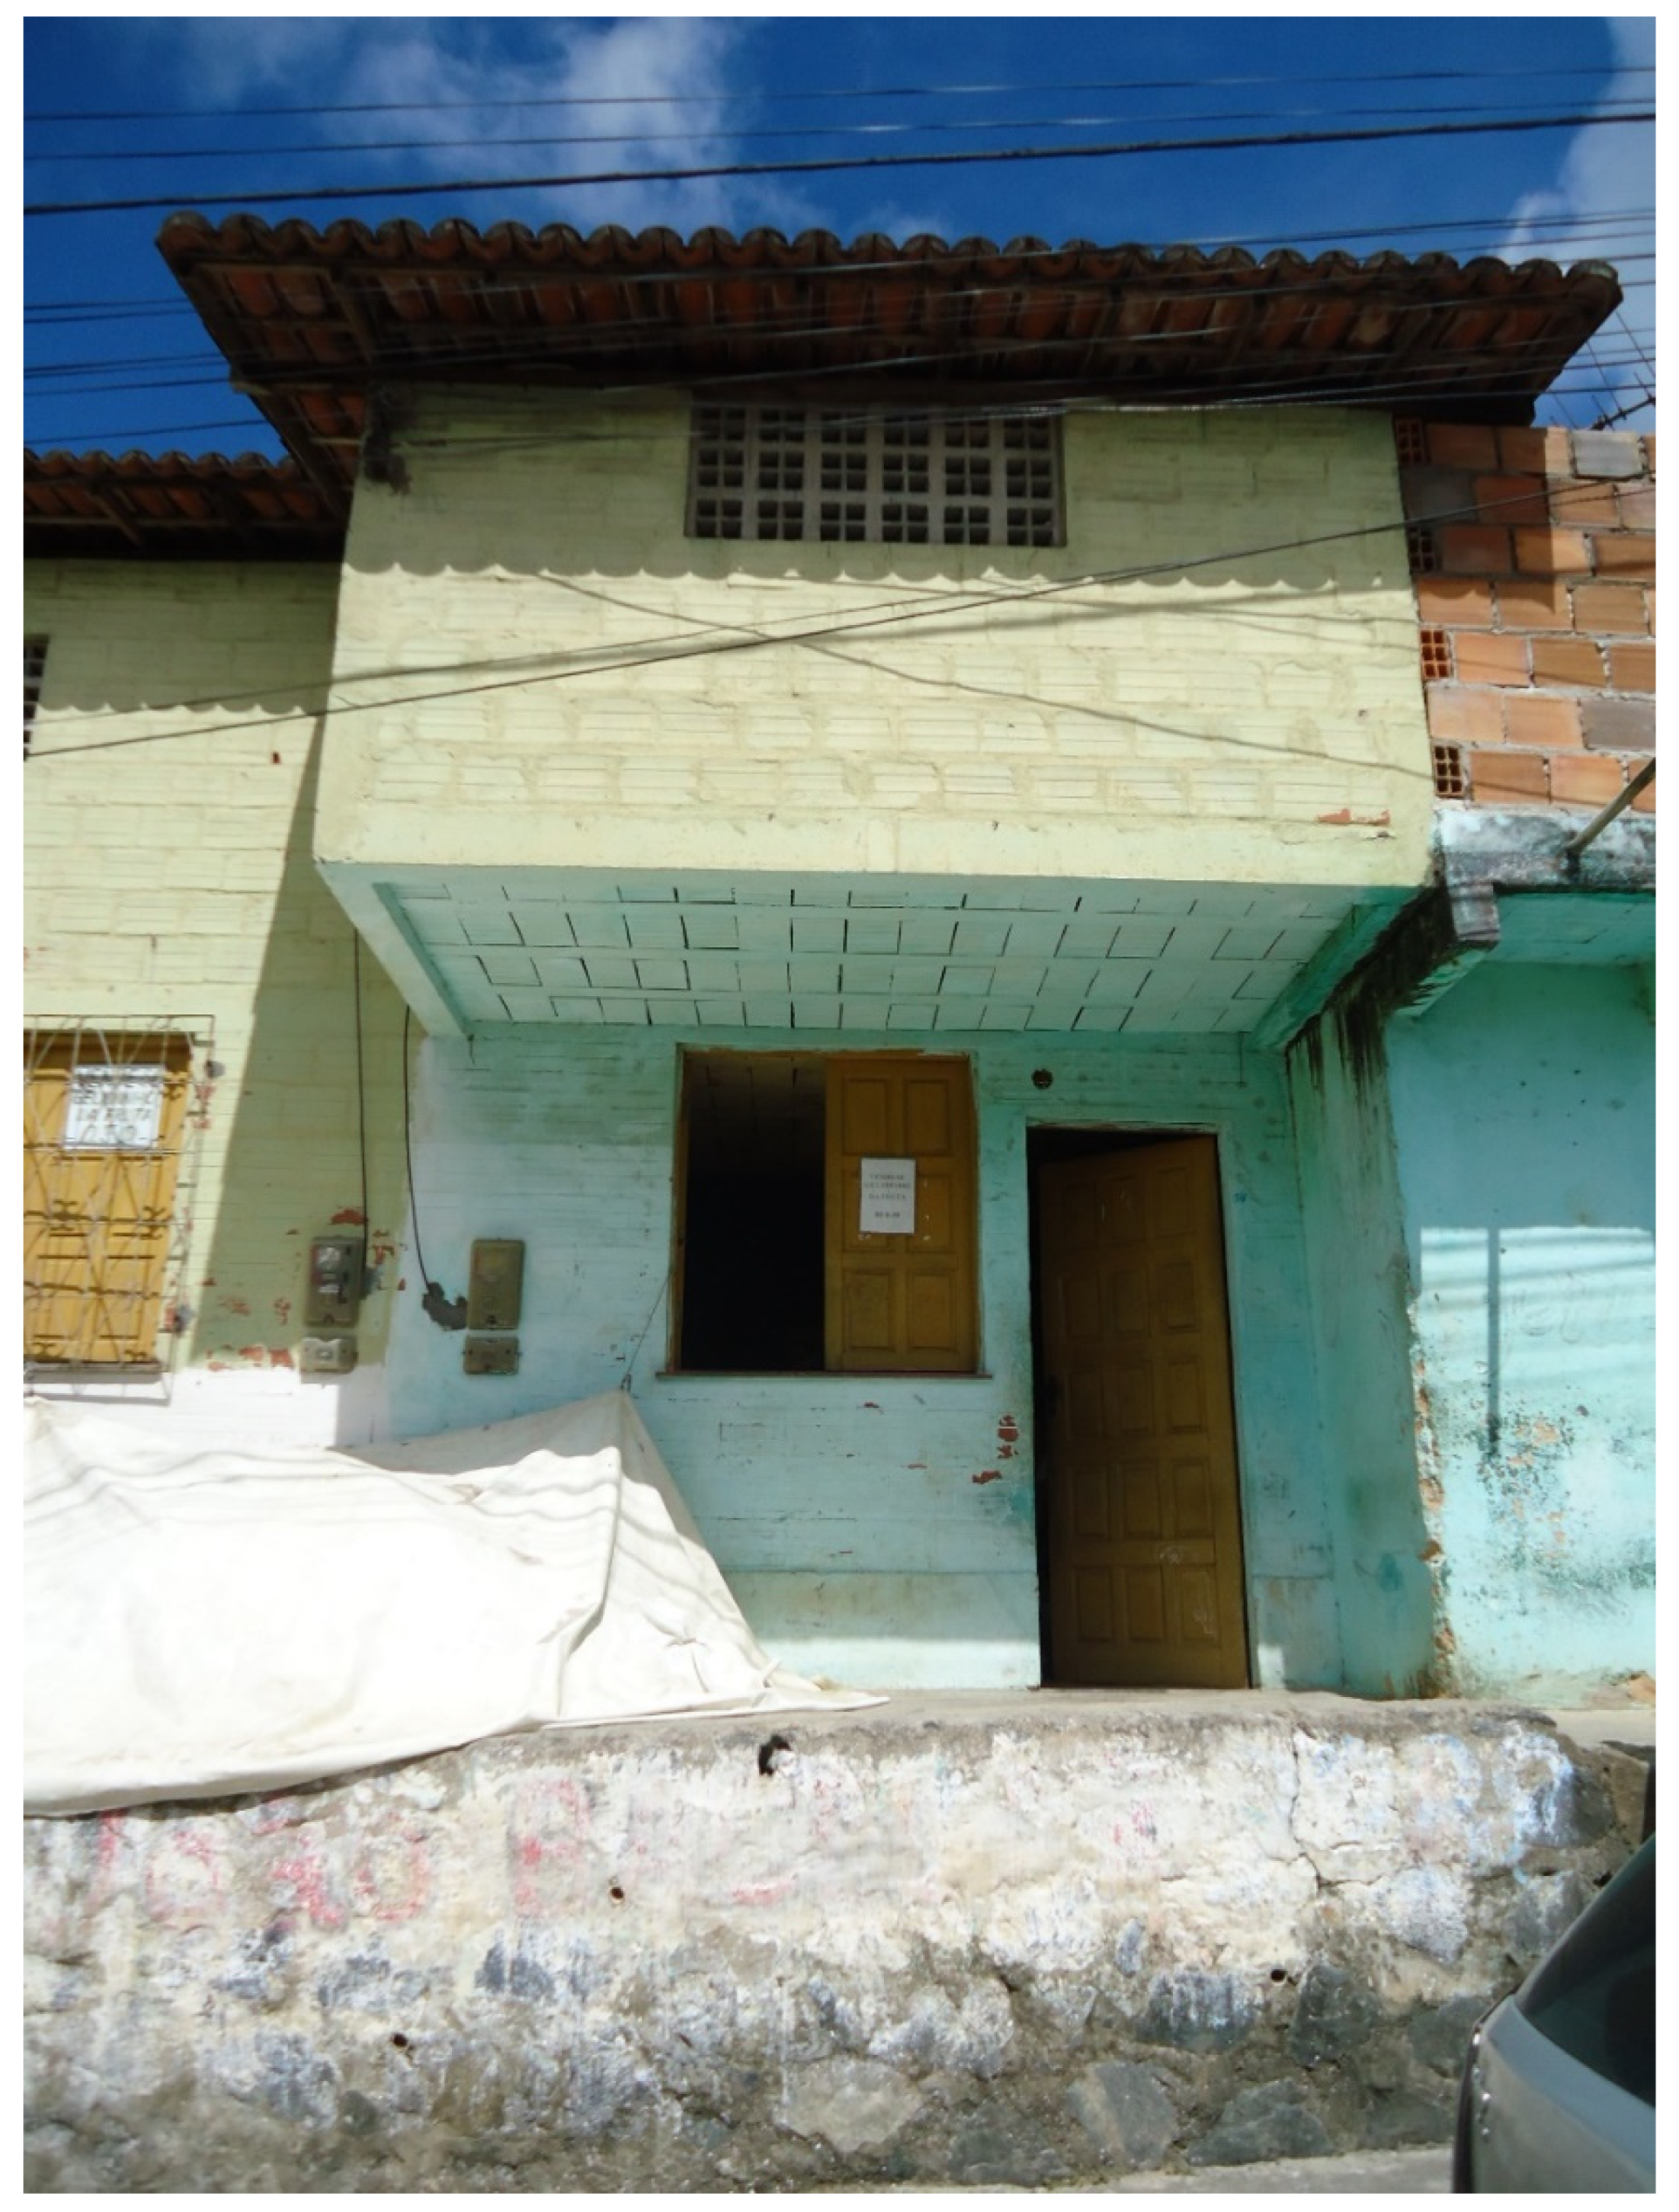
4.1.2. Study Area Information
4.2. Materials and Methods
4.2.1. Monitoring and Data Processing System
4.2.2. Semi-Structured Interviews
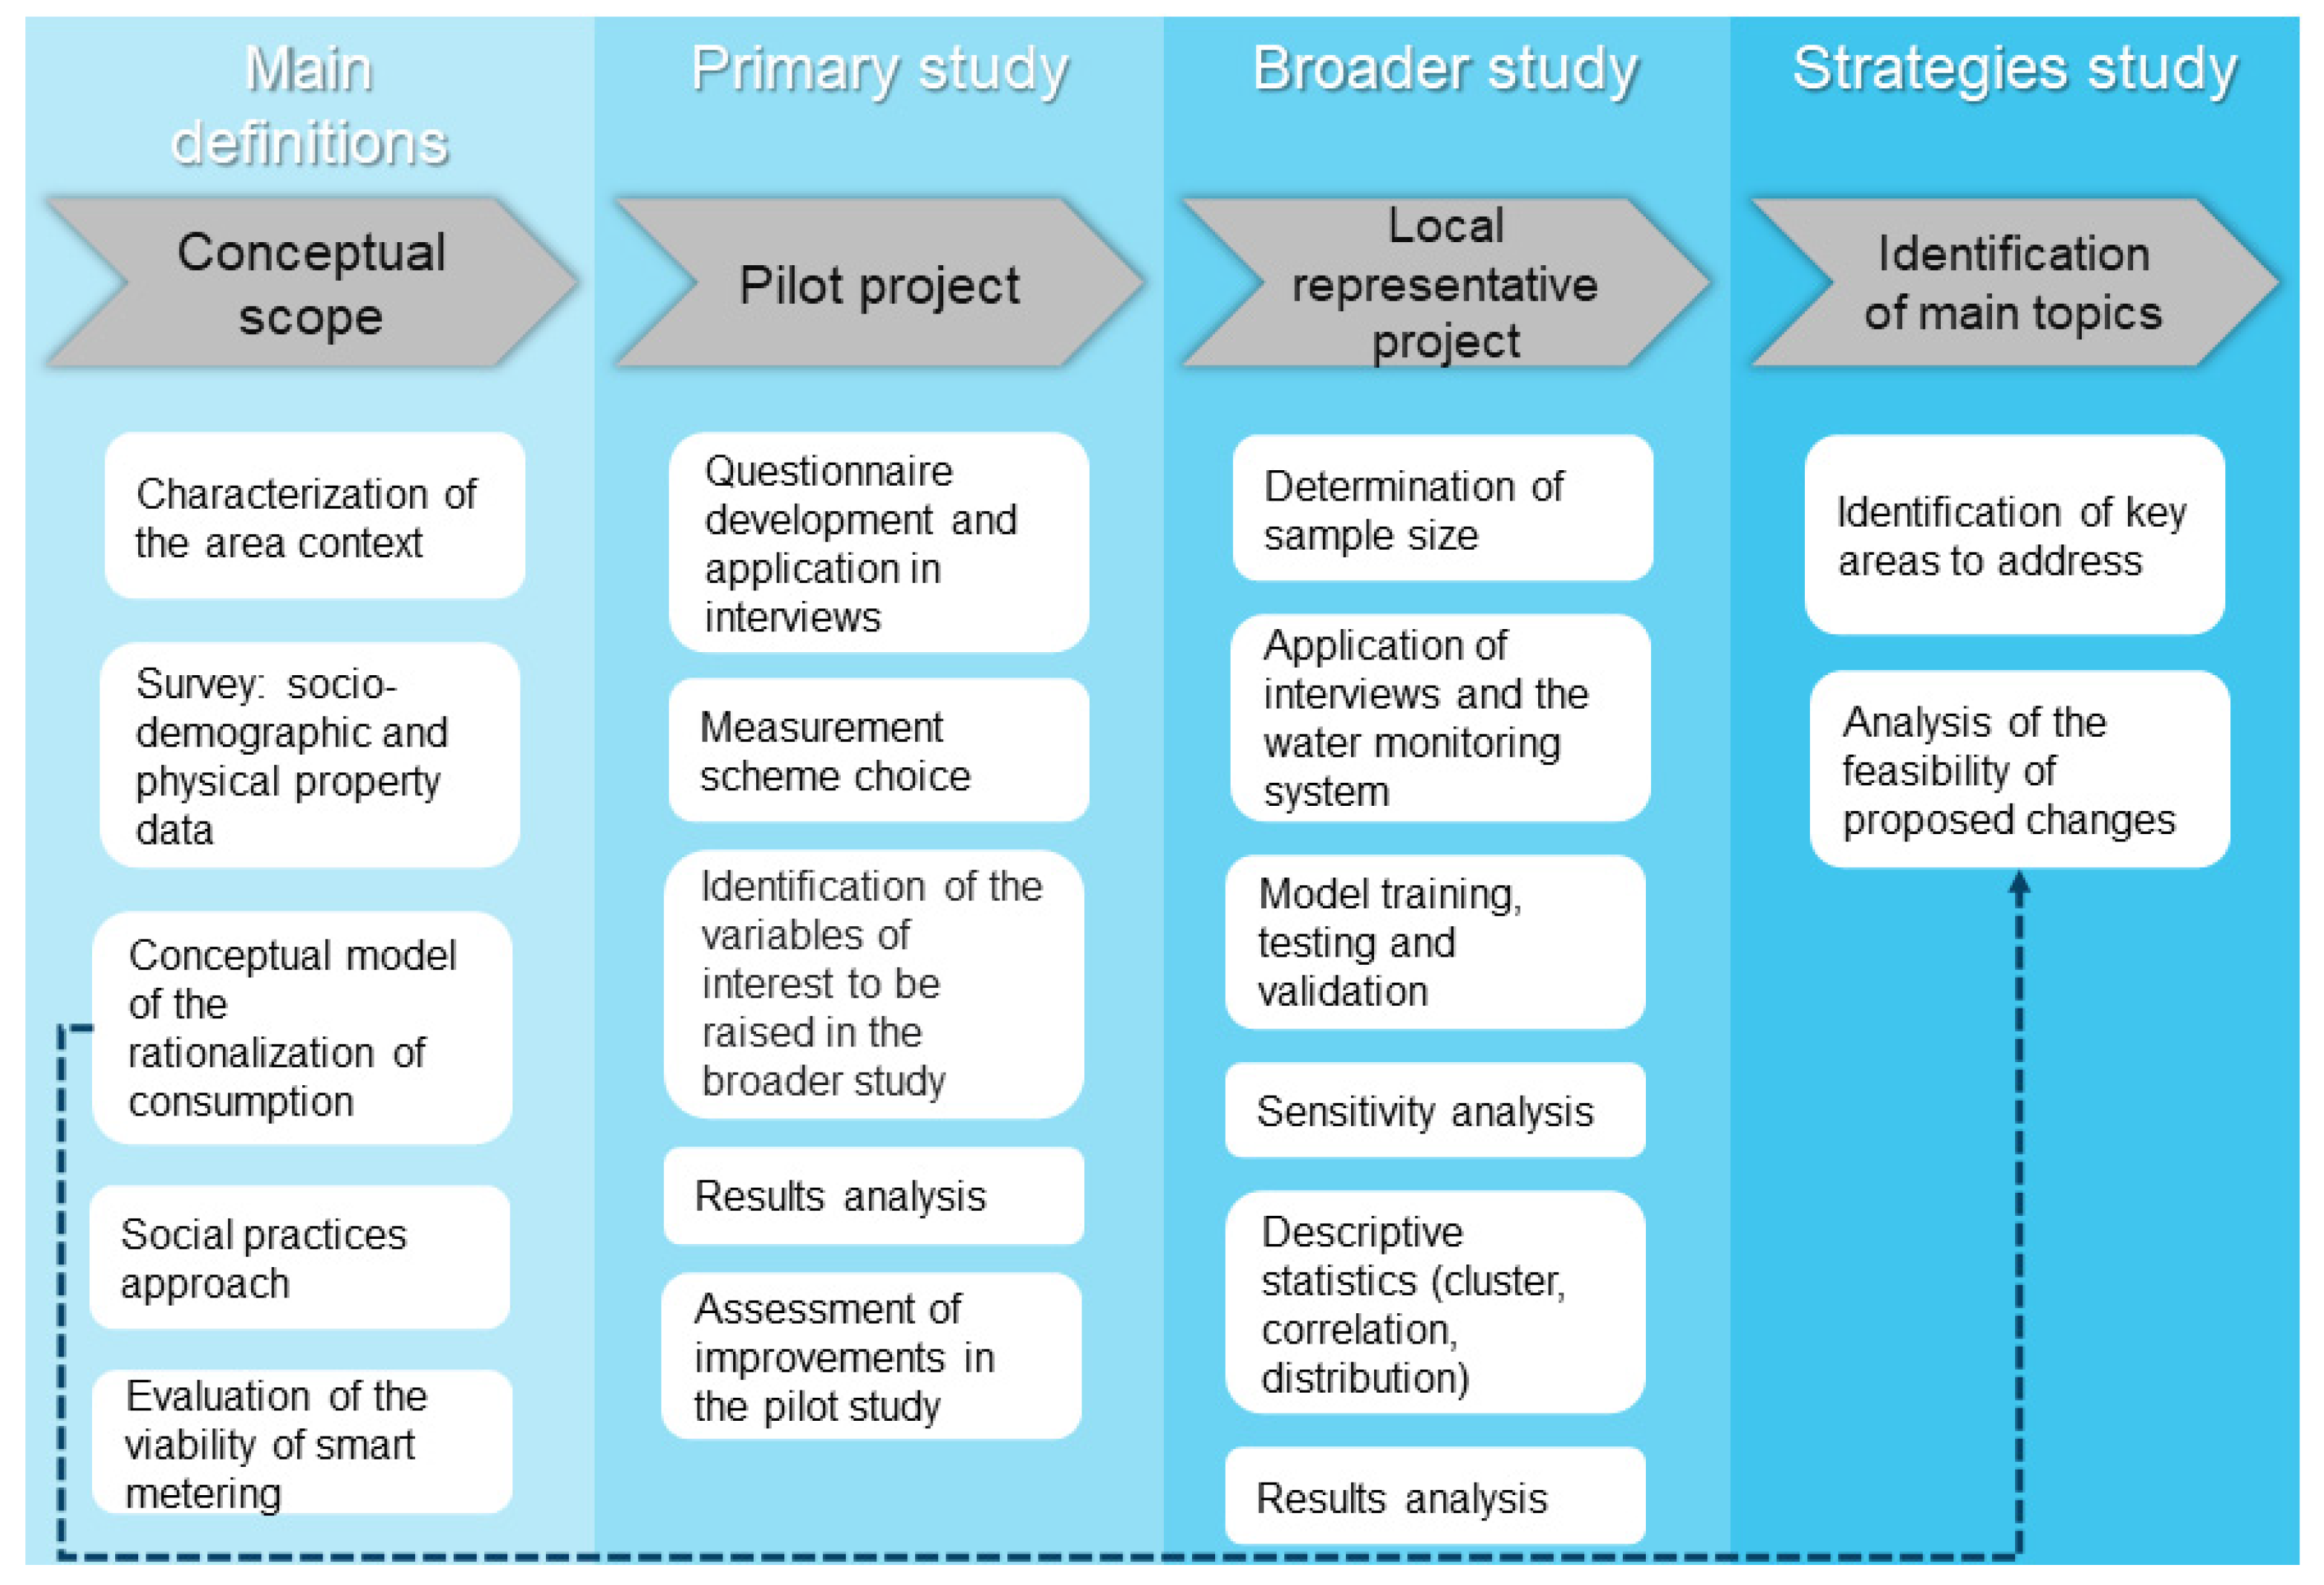
4.2.3. Procedure of the Pilot Study Analyses
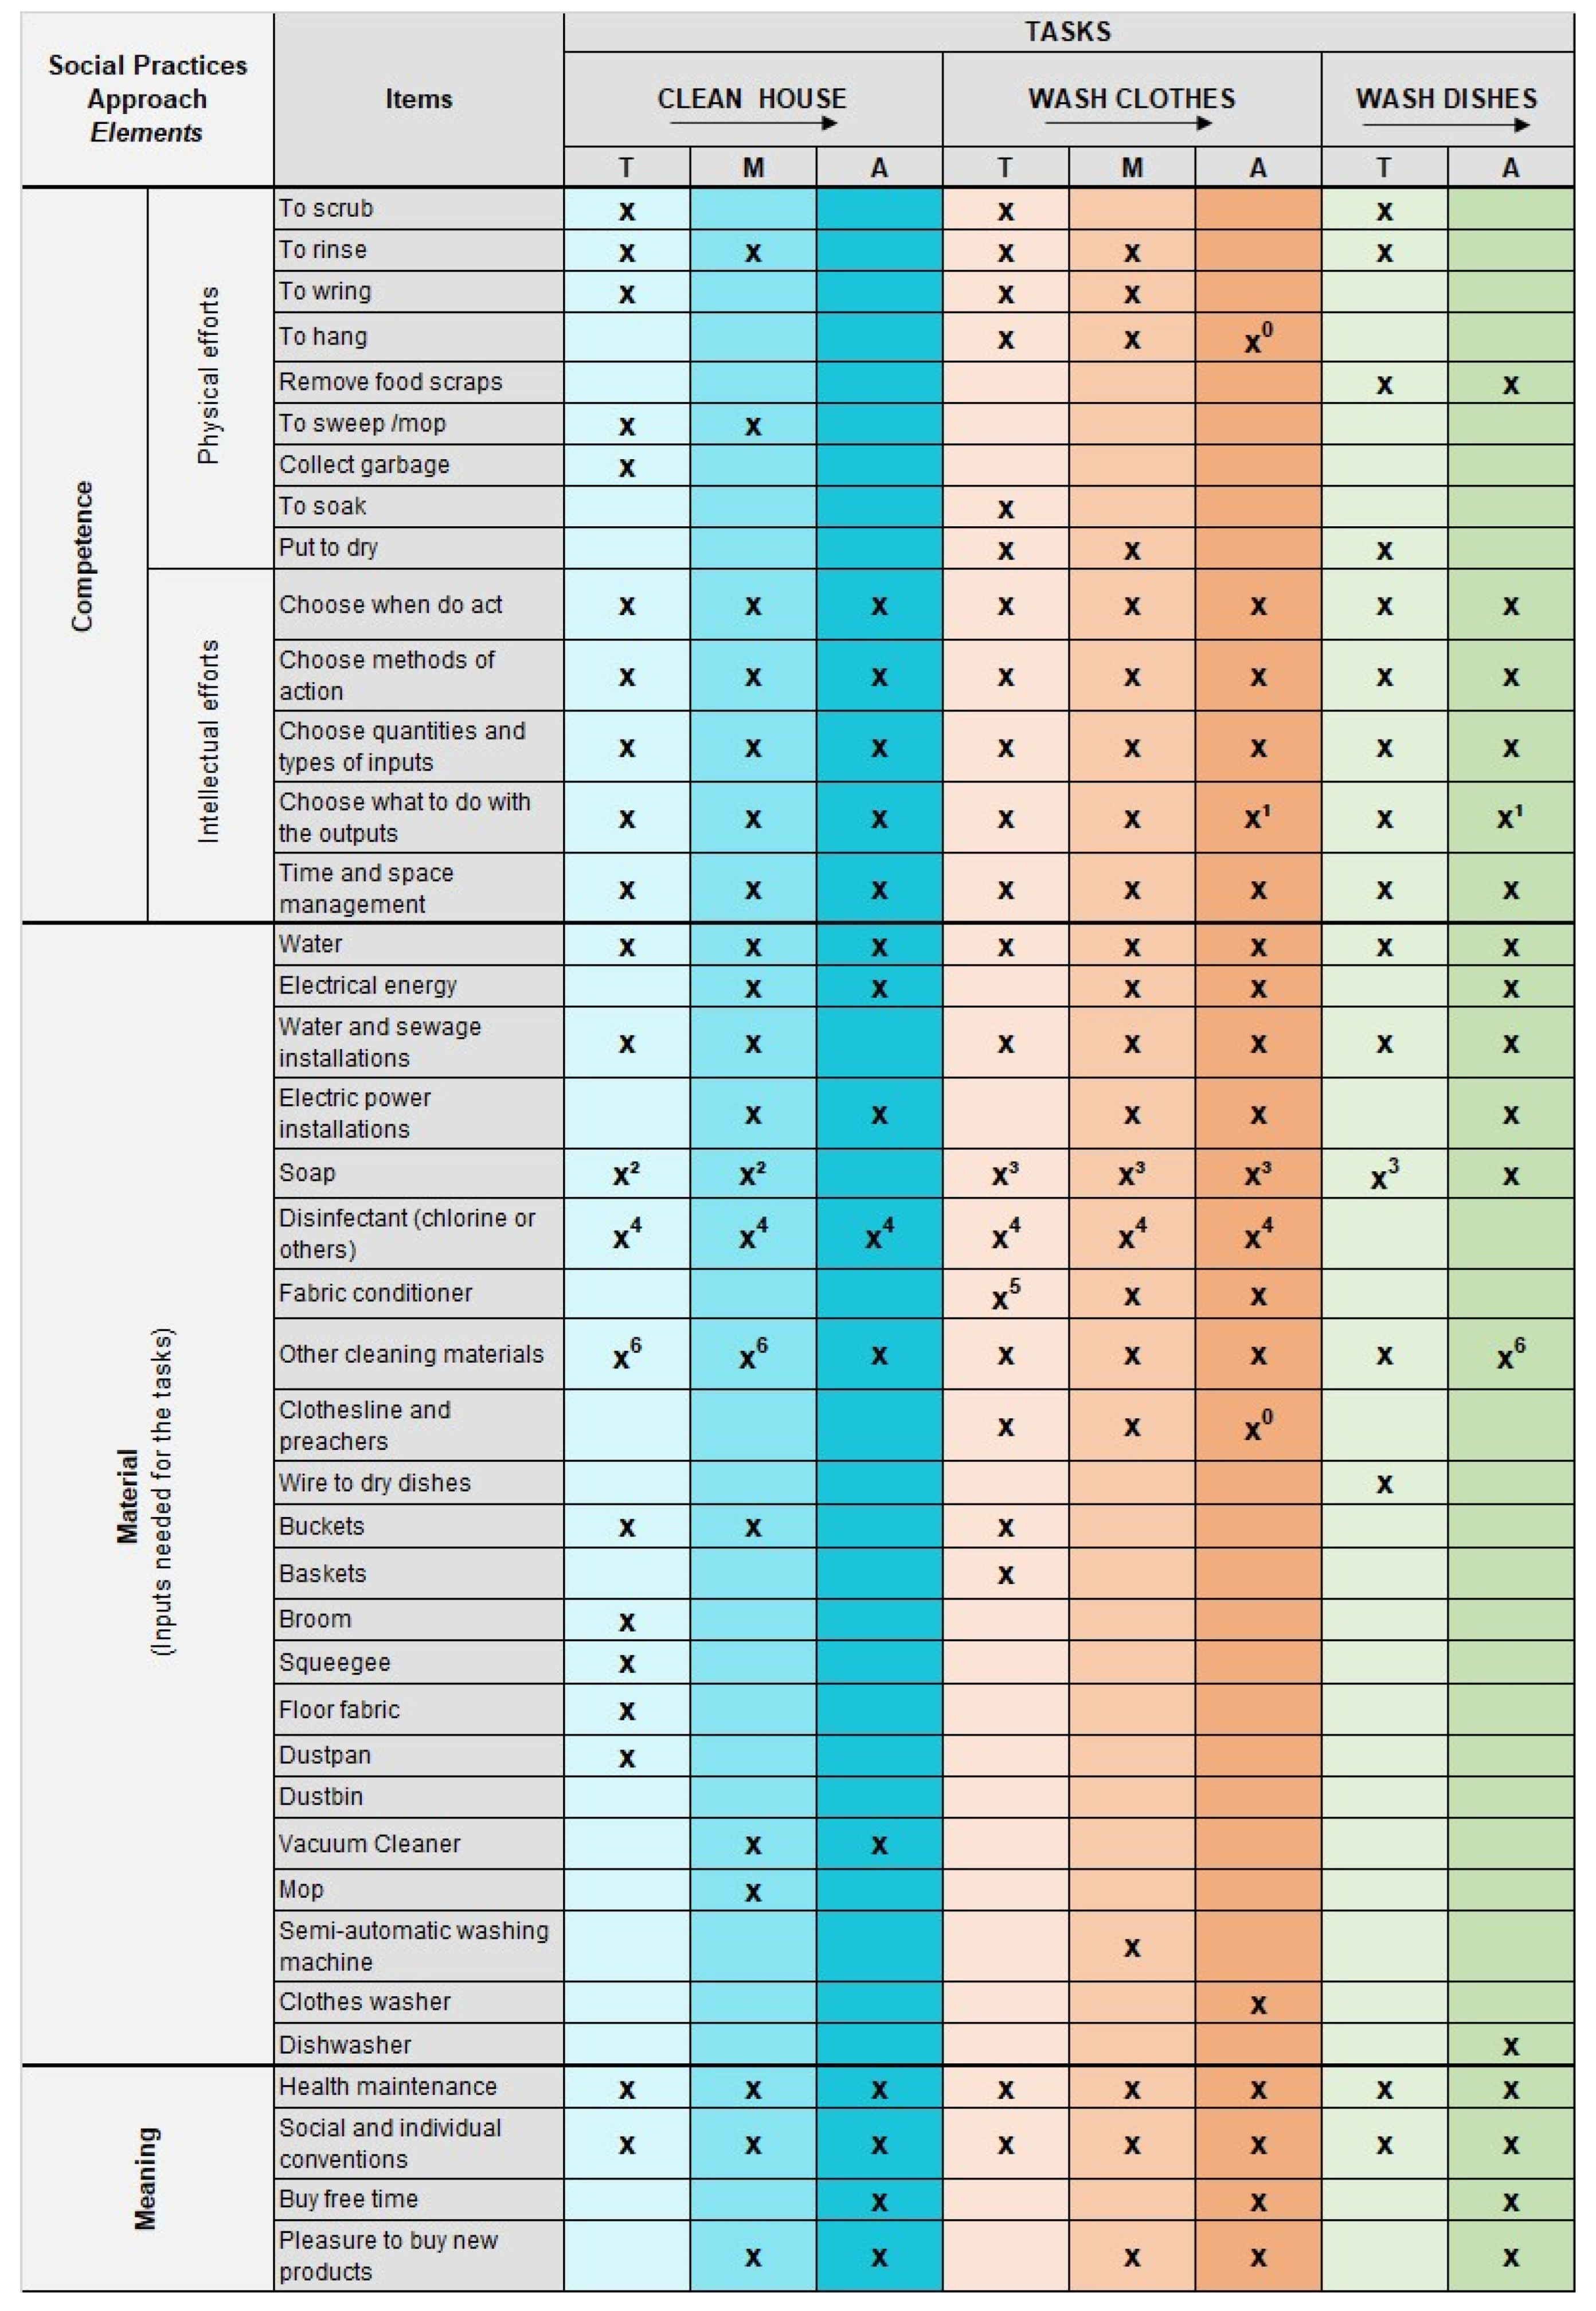
- The meaning of each activity, with the goal of understanding what constitutes a need, desire, or waste.
- Material used directly and indirectly in these activities.
- Competencies indirectly discovered through an examination of user habits and the evolution of practices.
5. Results
5.1. Qualitative Analysis: Evaluation of Interviews under the Models
5.1.1. Interview Analysis Based on the Conceptual Model of Rationalization of Consumption
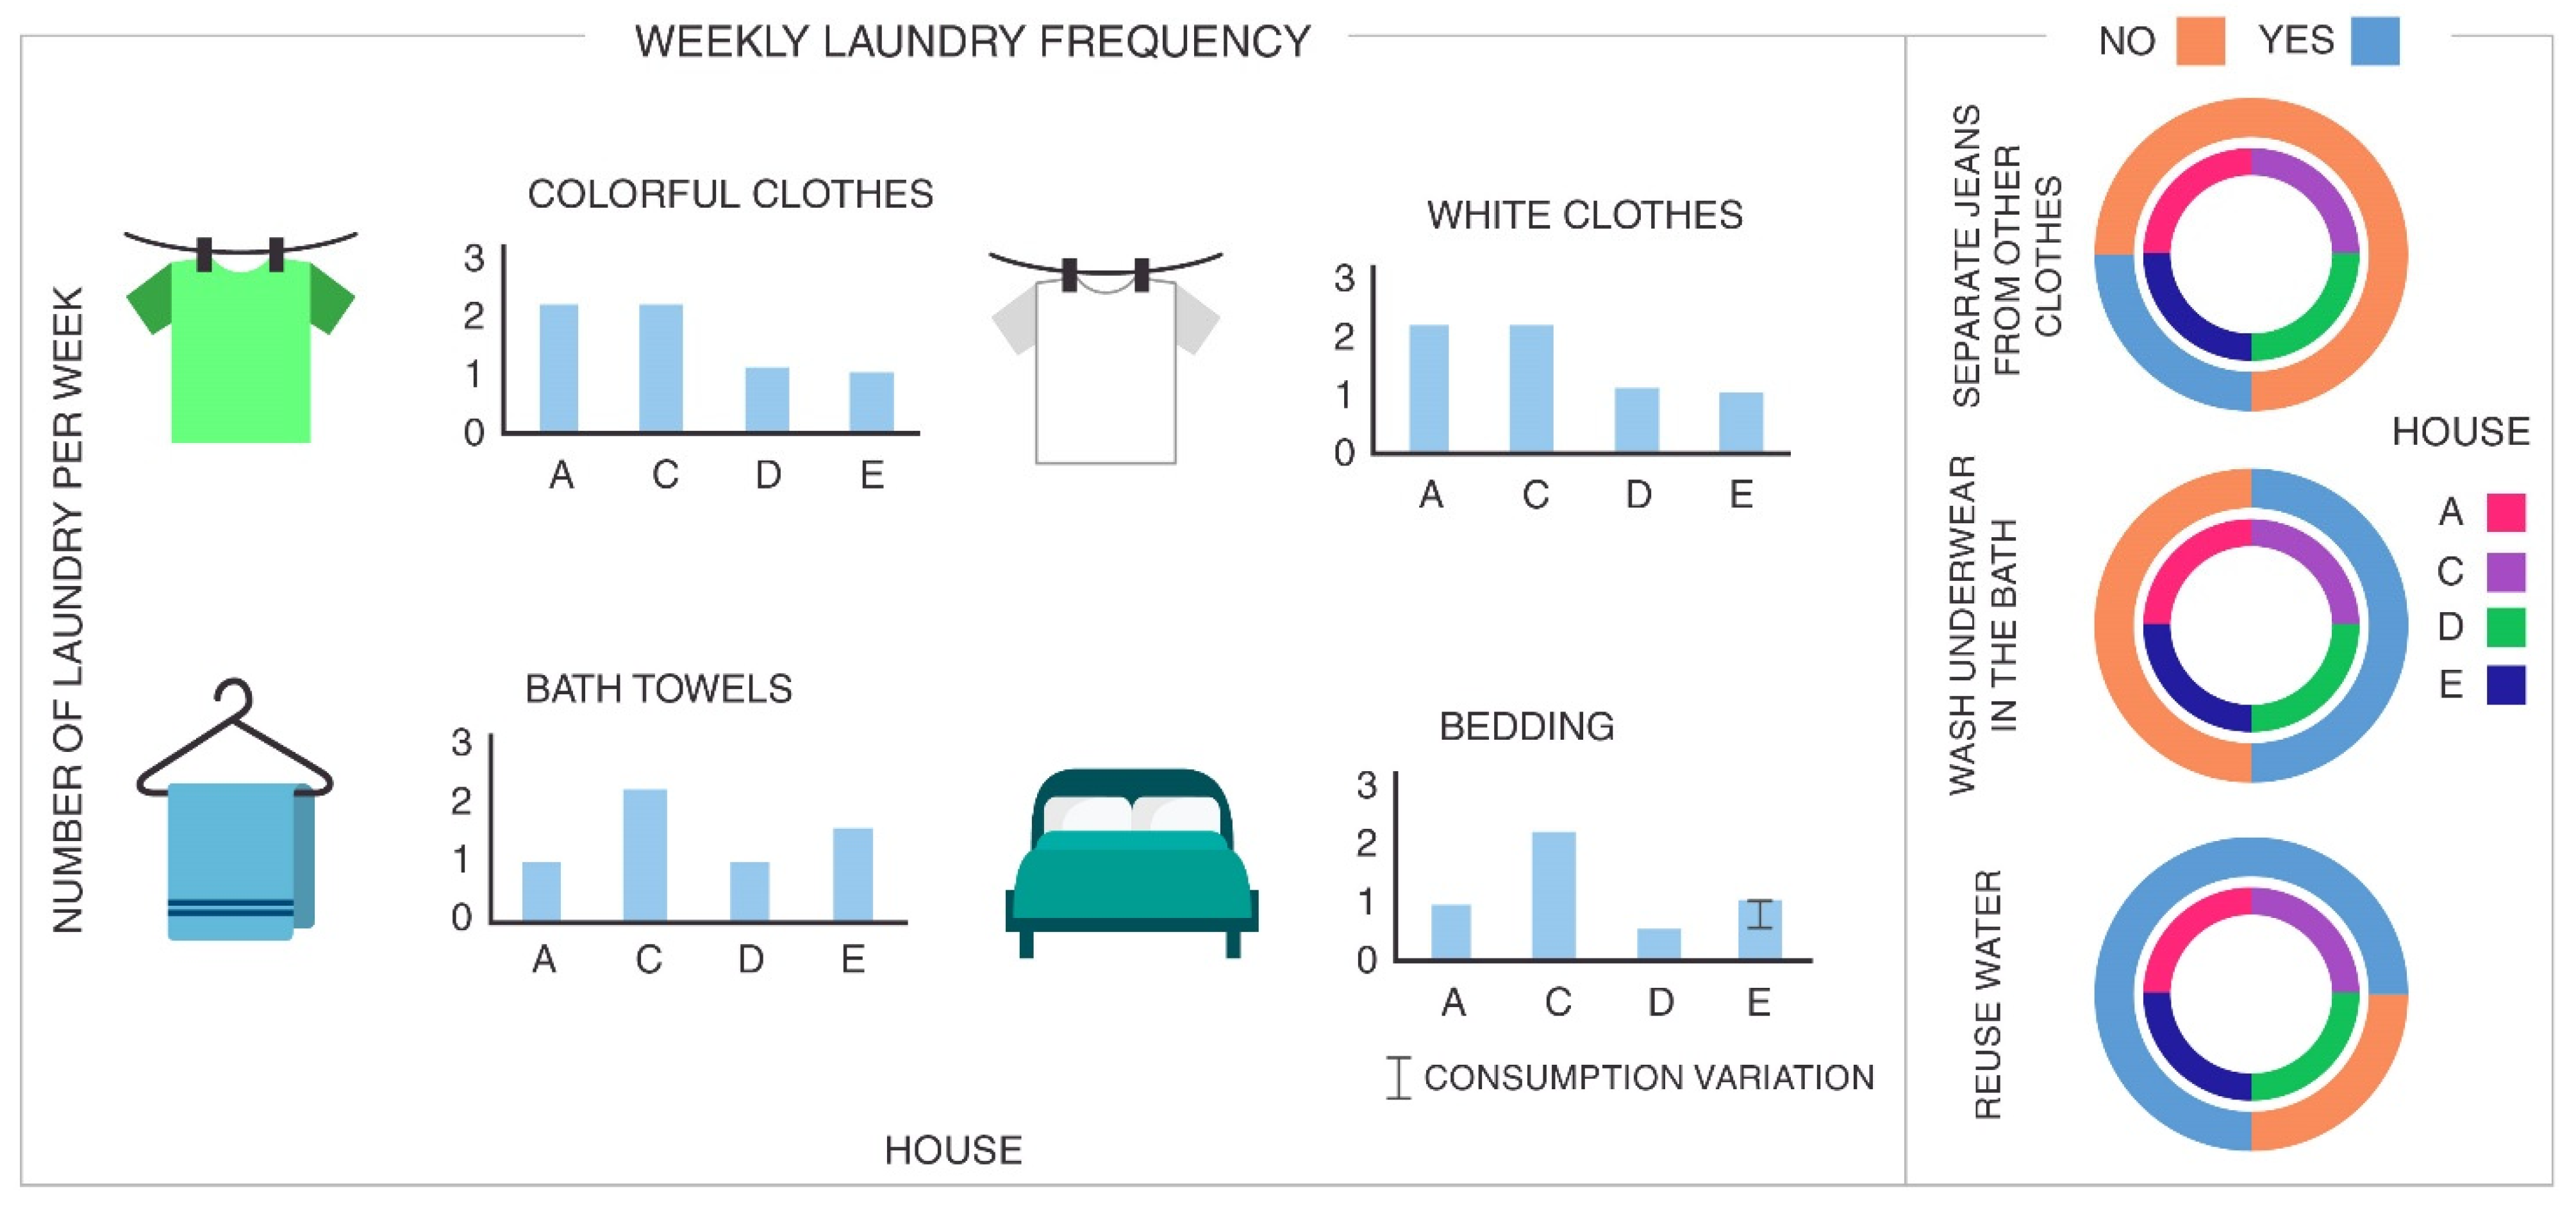
Laundry Practices
- House A: The external faucet in this house was shared, and it was defective during the measurement period. If the shower was used because of the defect, an alternative would be to repair the faucet; if the shower was used because the resident was uncomfortable sharing it with the neighbor, an alternative would be to install a faucet in the shower box at a height appropriate for the resident’s habit of washing clothes and filling buckets.
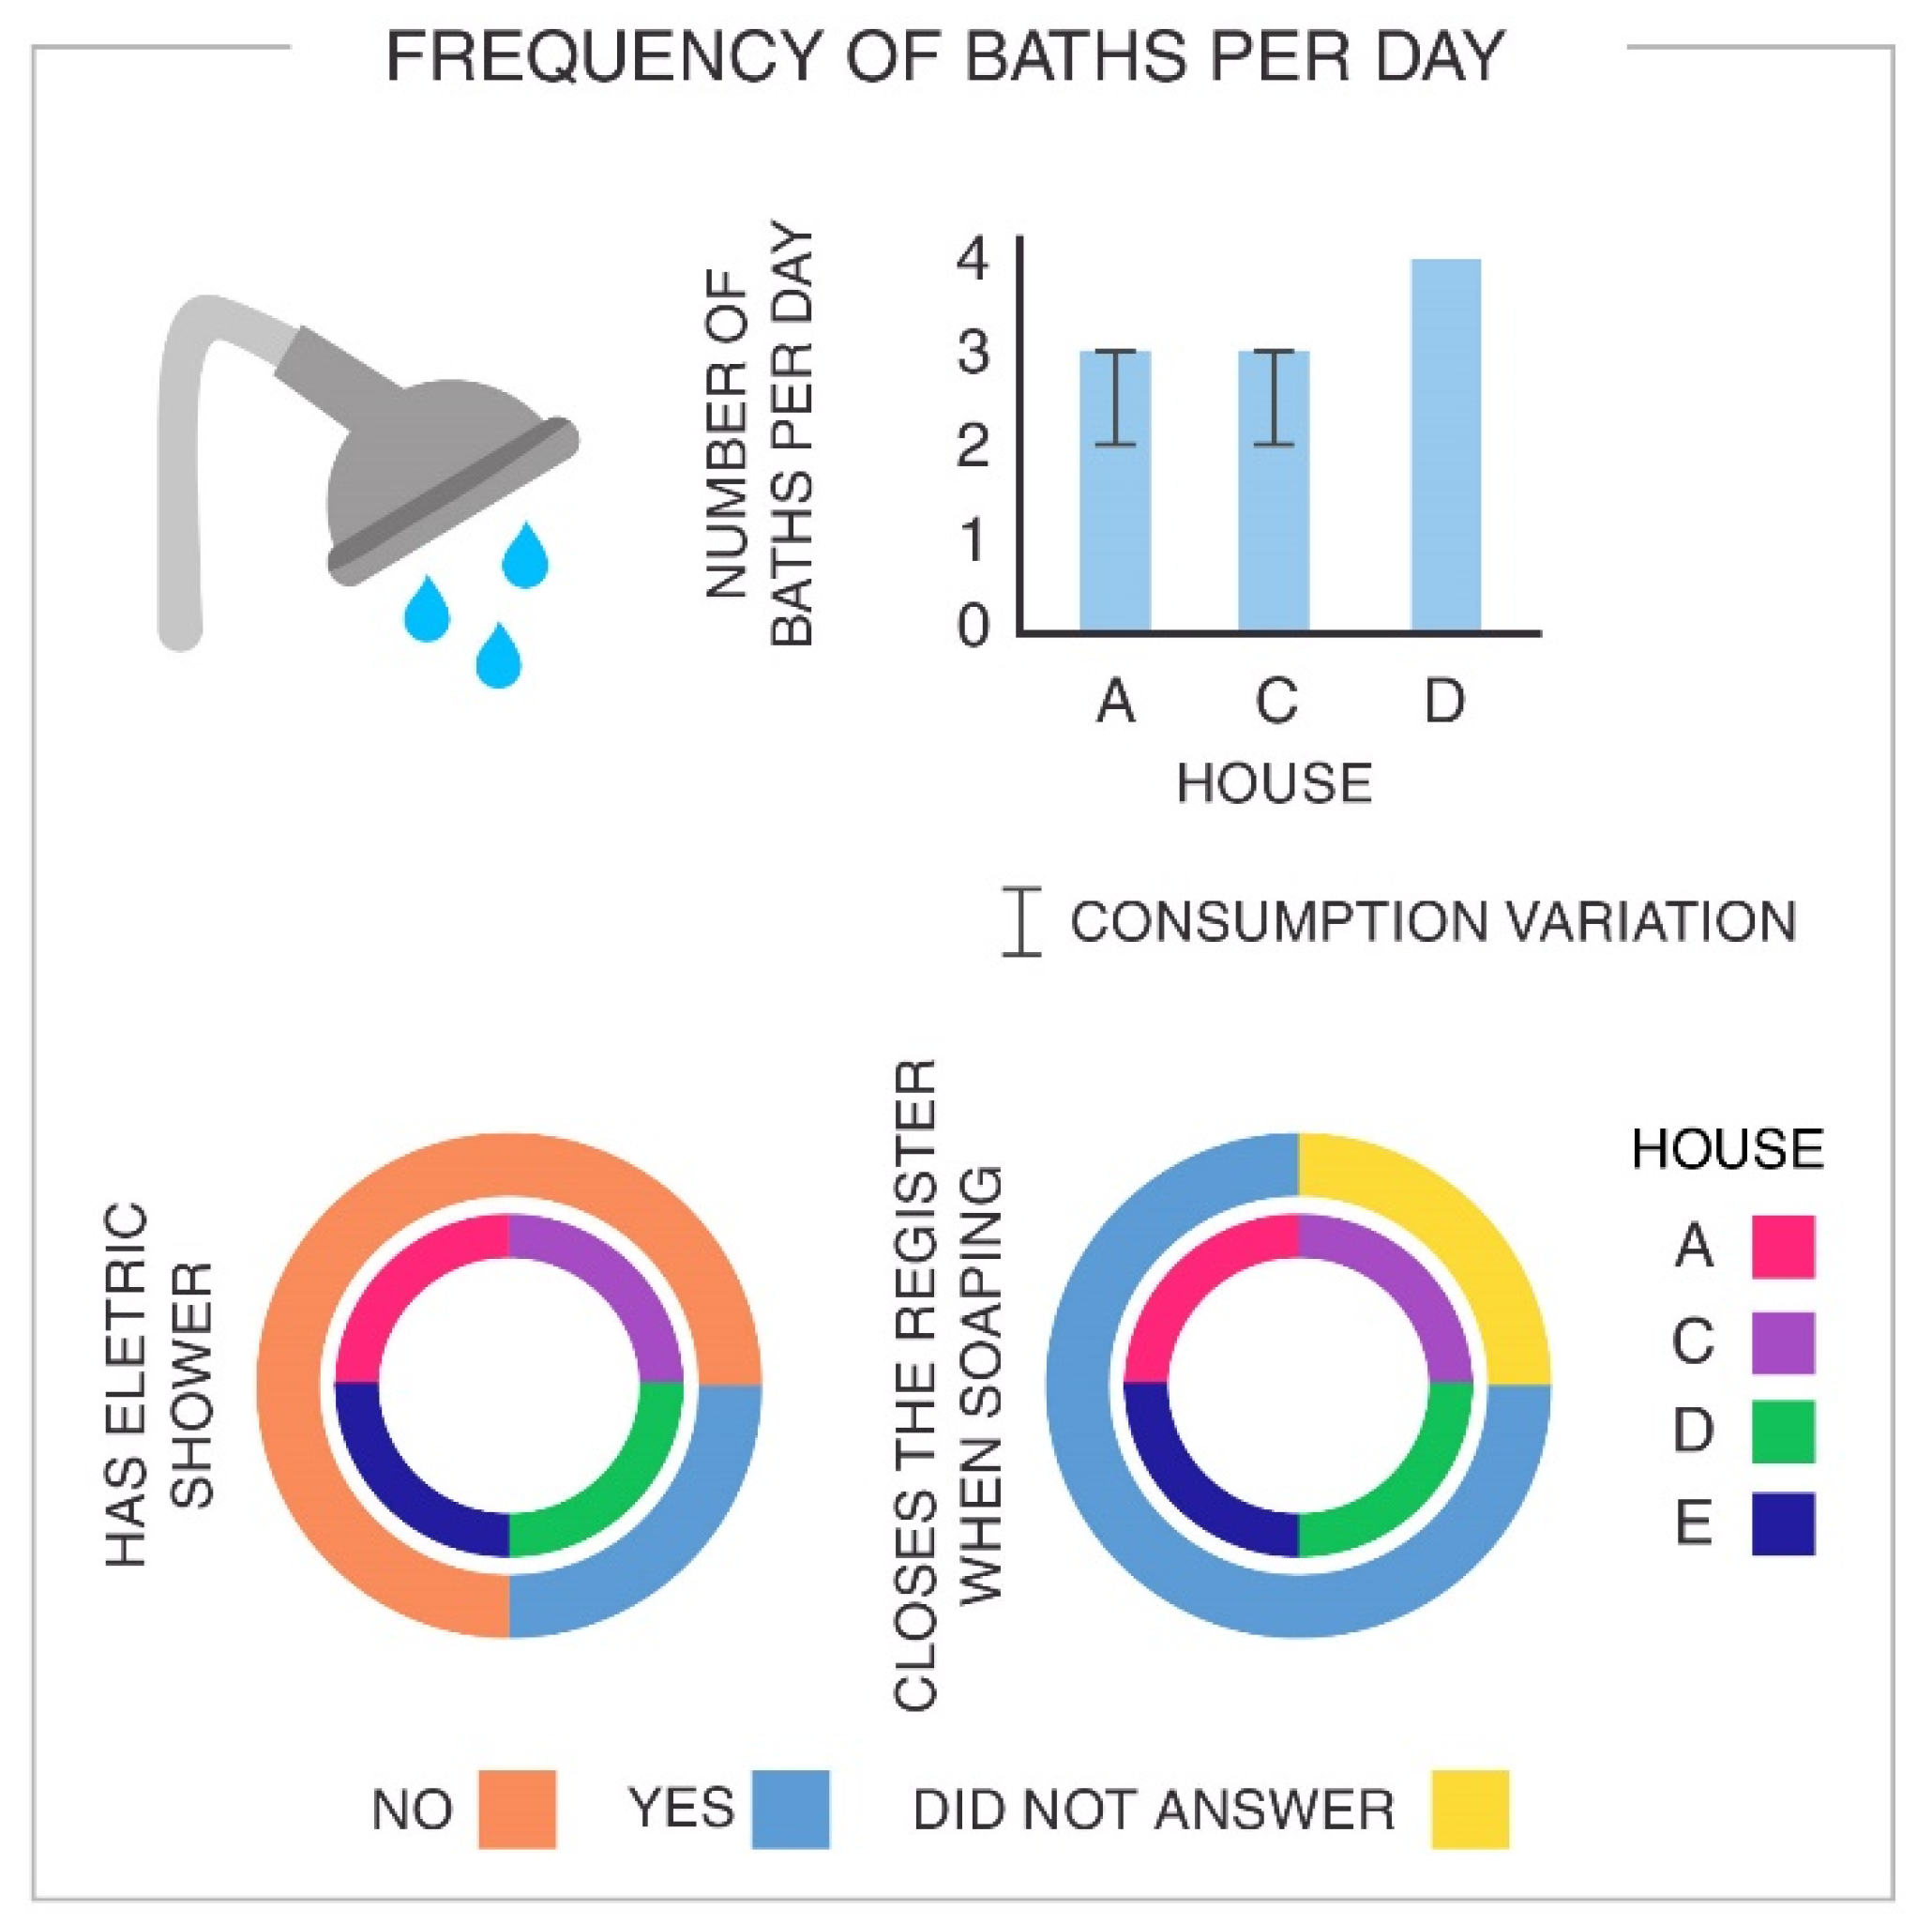
- Houses C and D: Residents’ care to reduce excess water consumption, such as turning off the shower while soaping and the use of a shower model with low dispersion, can improve the activity of washing underwear in the shower.
- House D: The final water discharged from the washing machine could be used for other purposes, such as toilet flushing and cleaning the outside area.
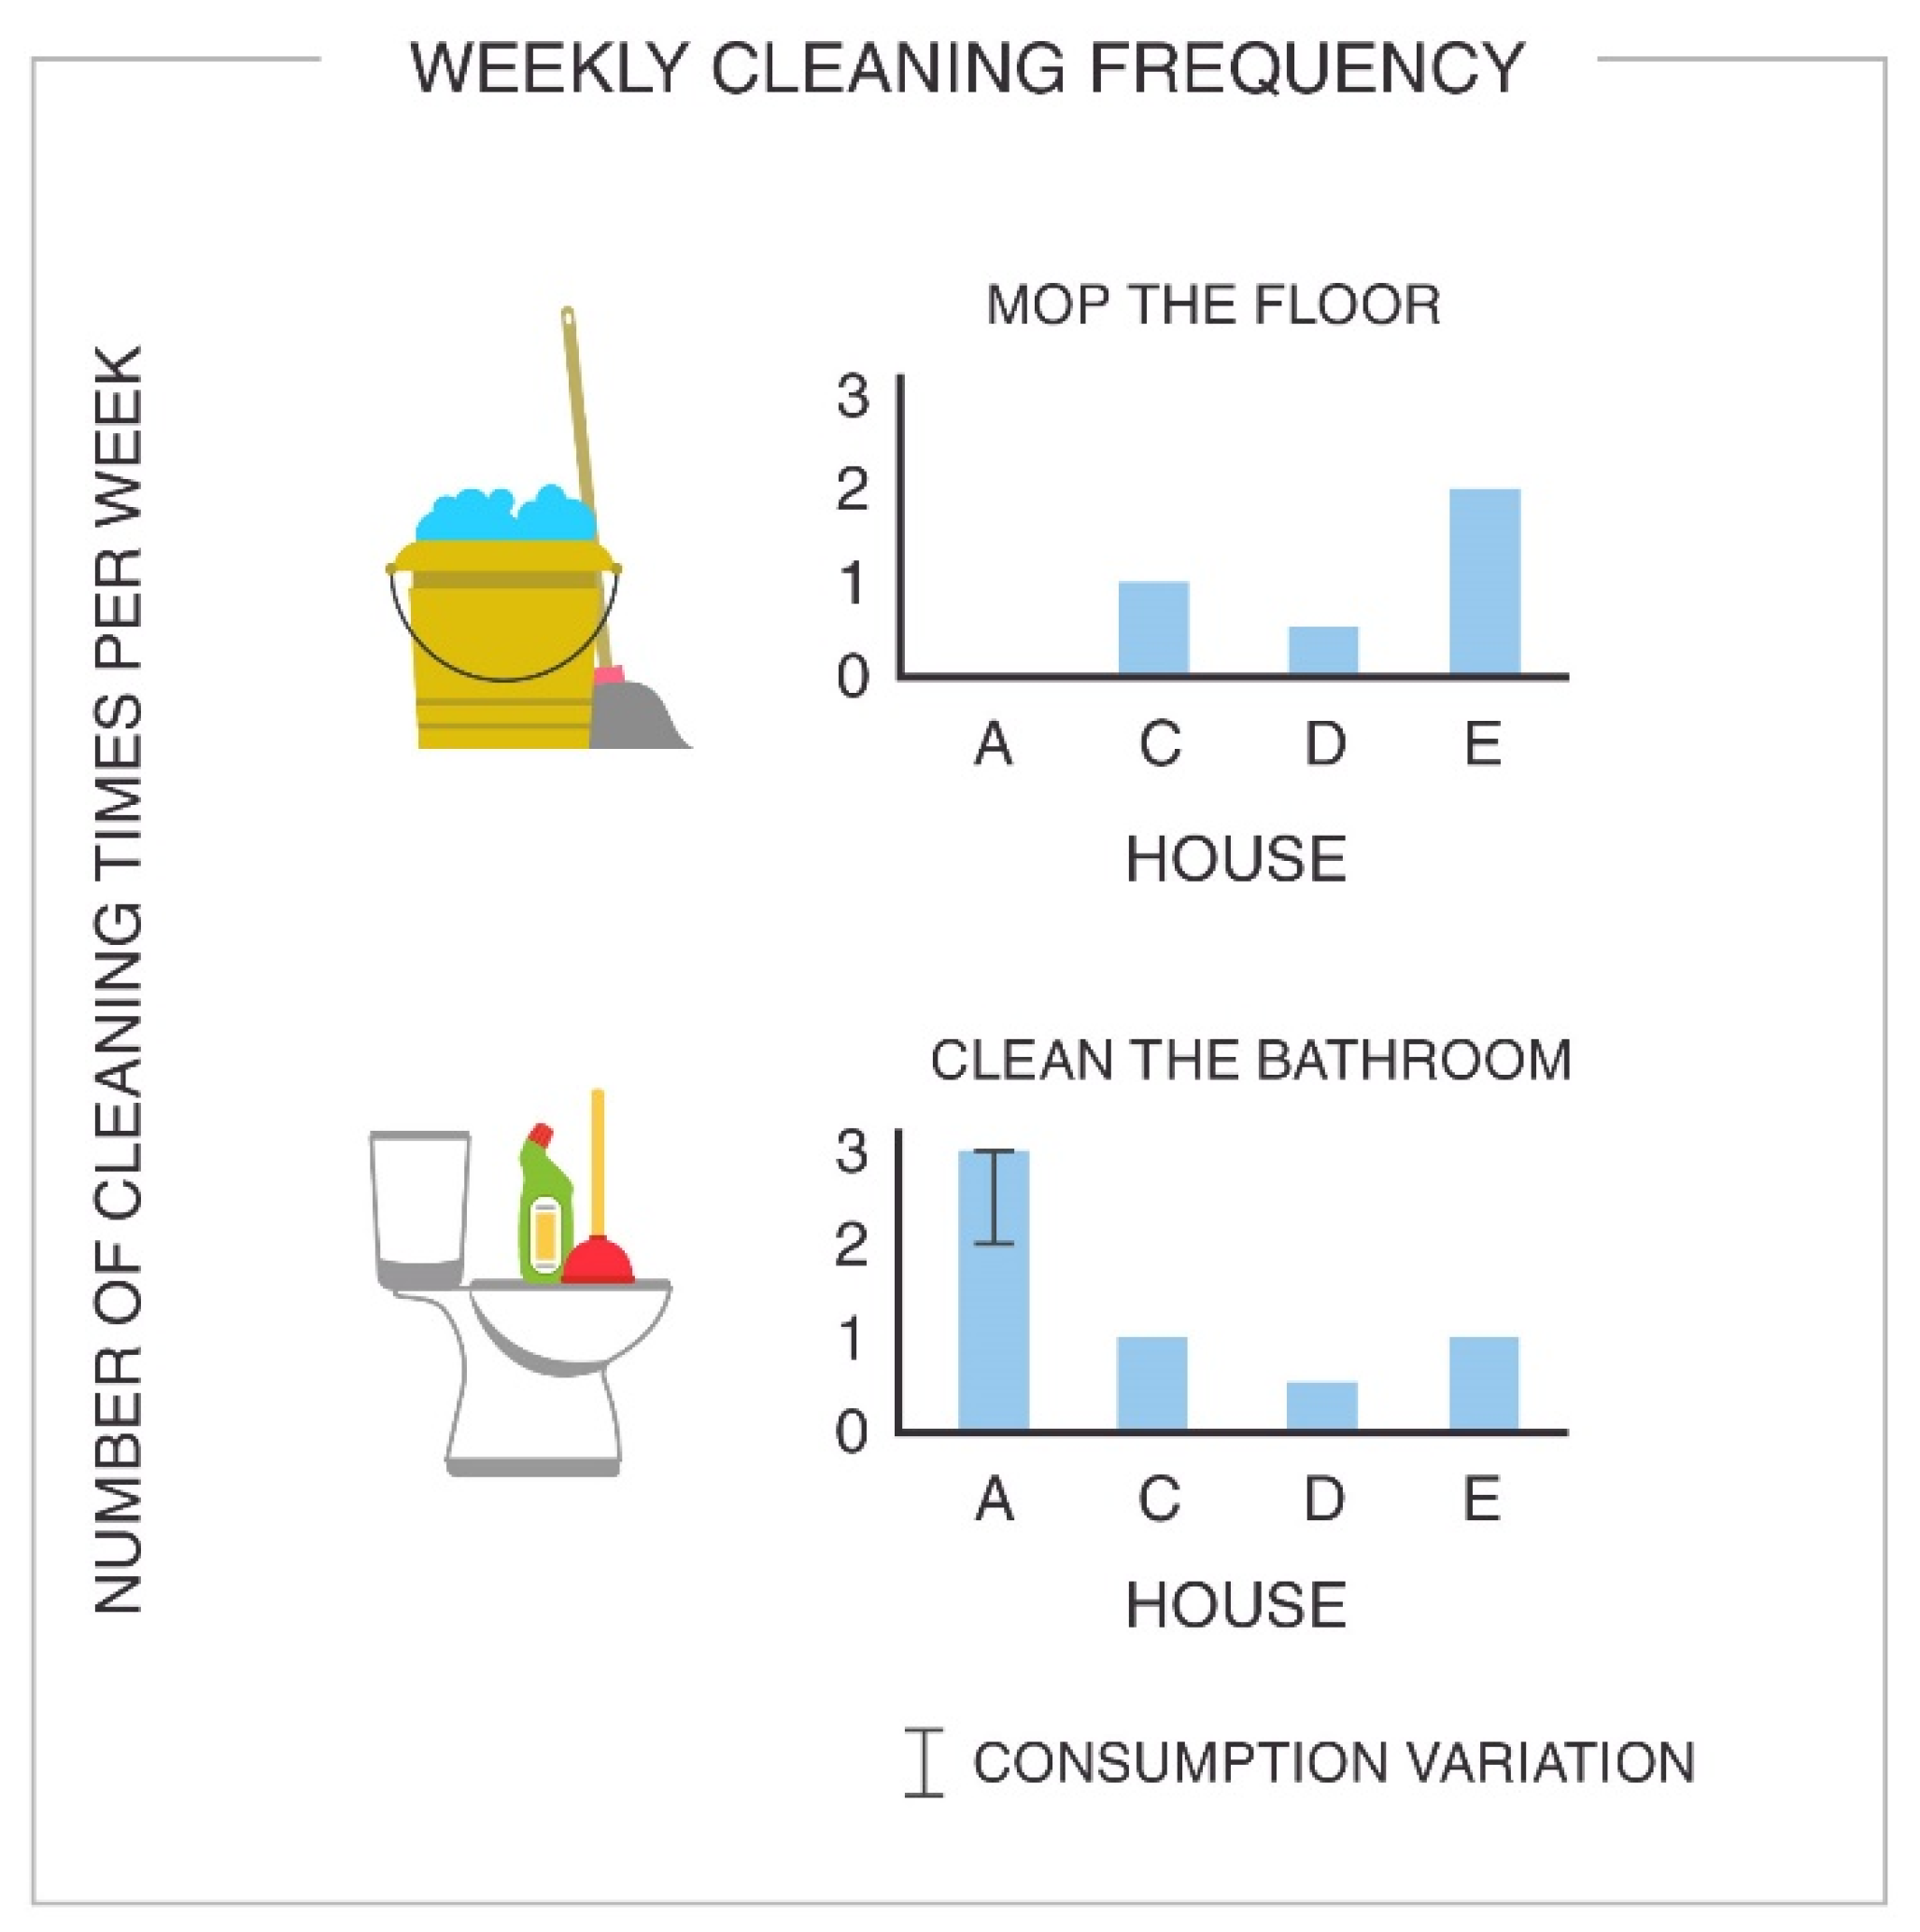
Cleaning the House
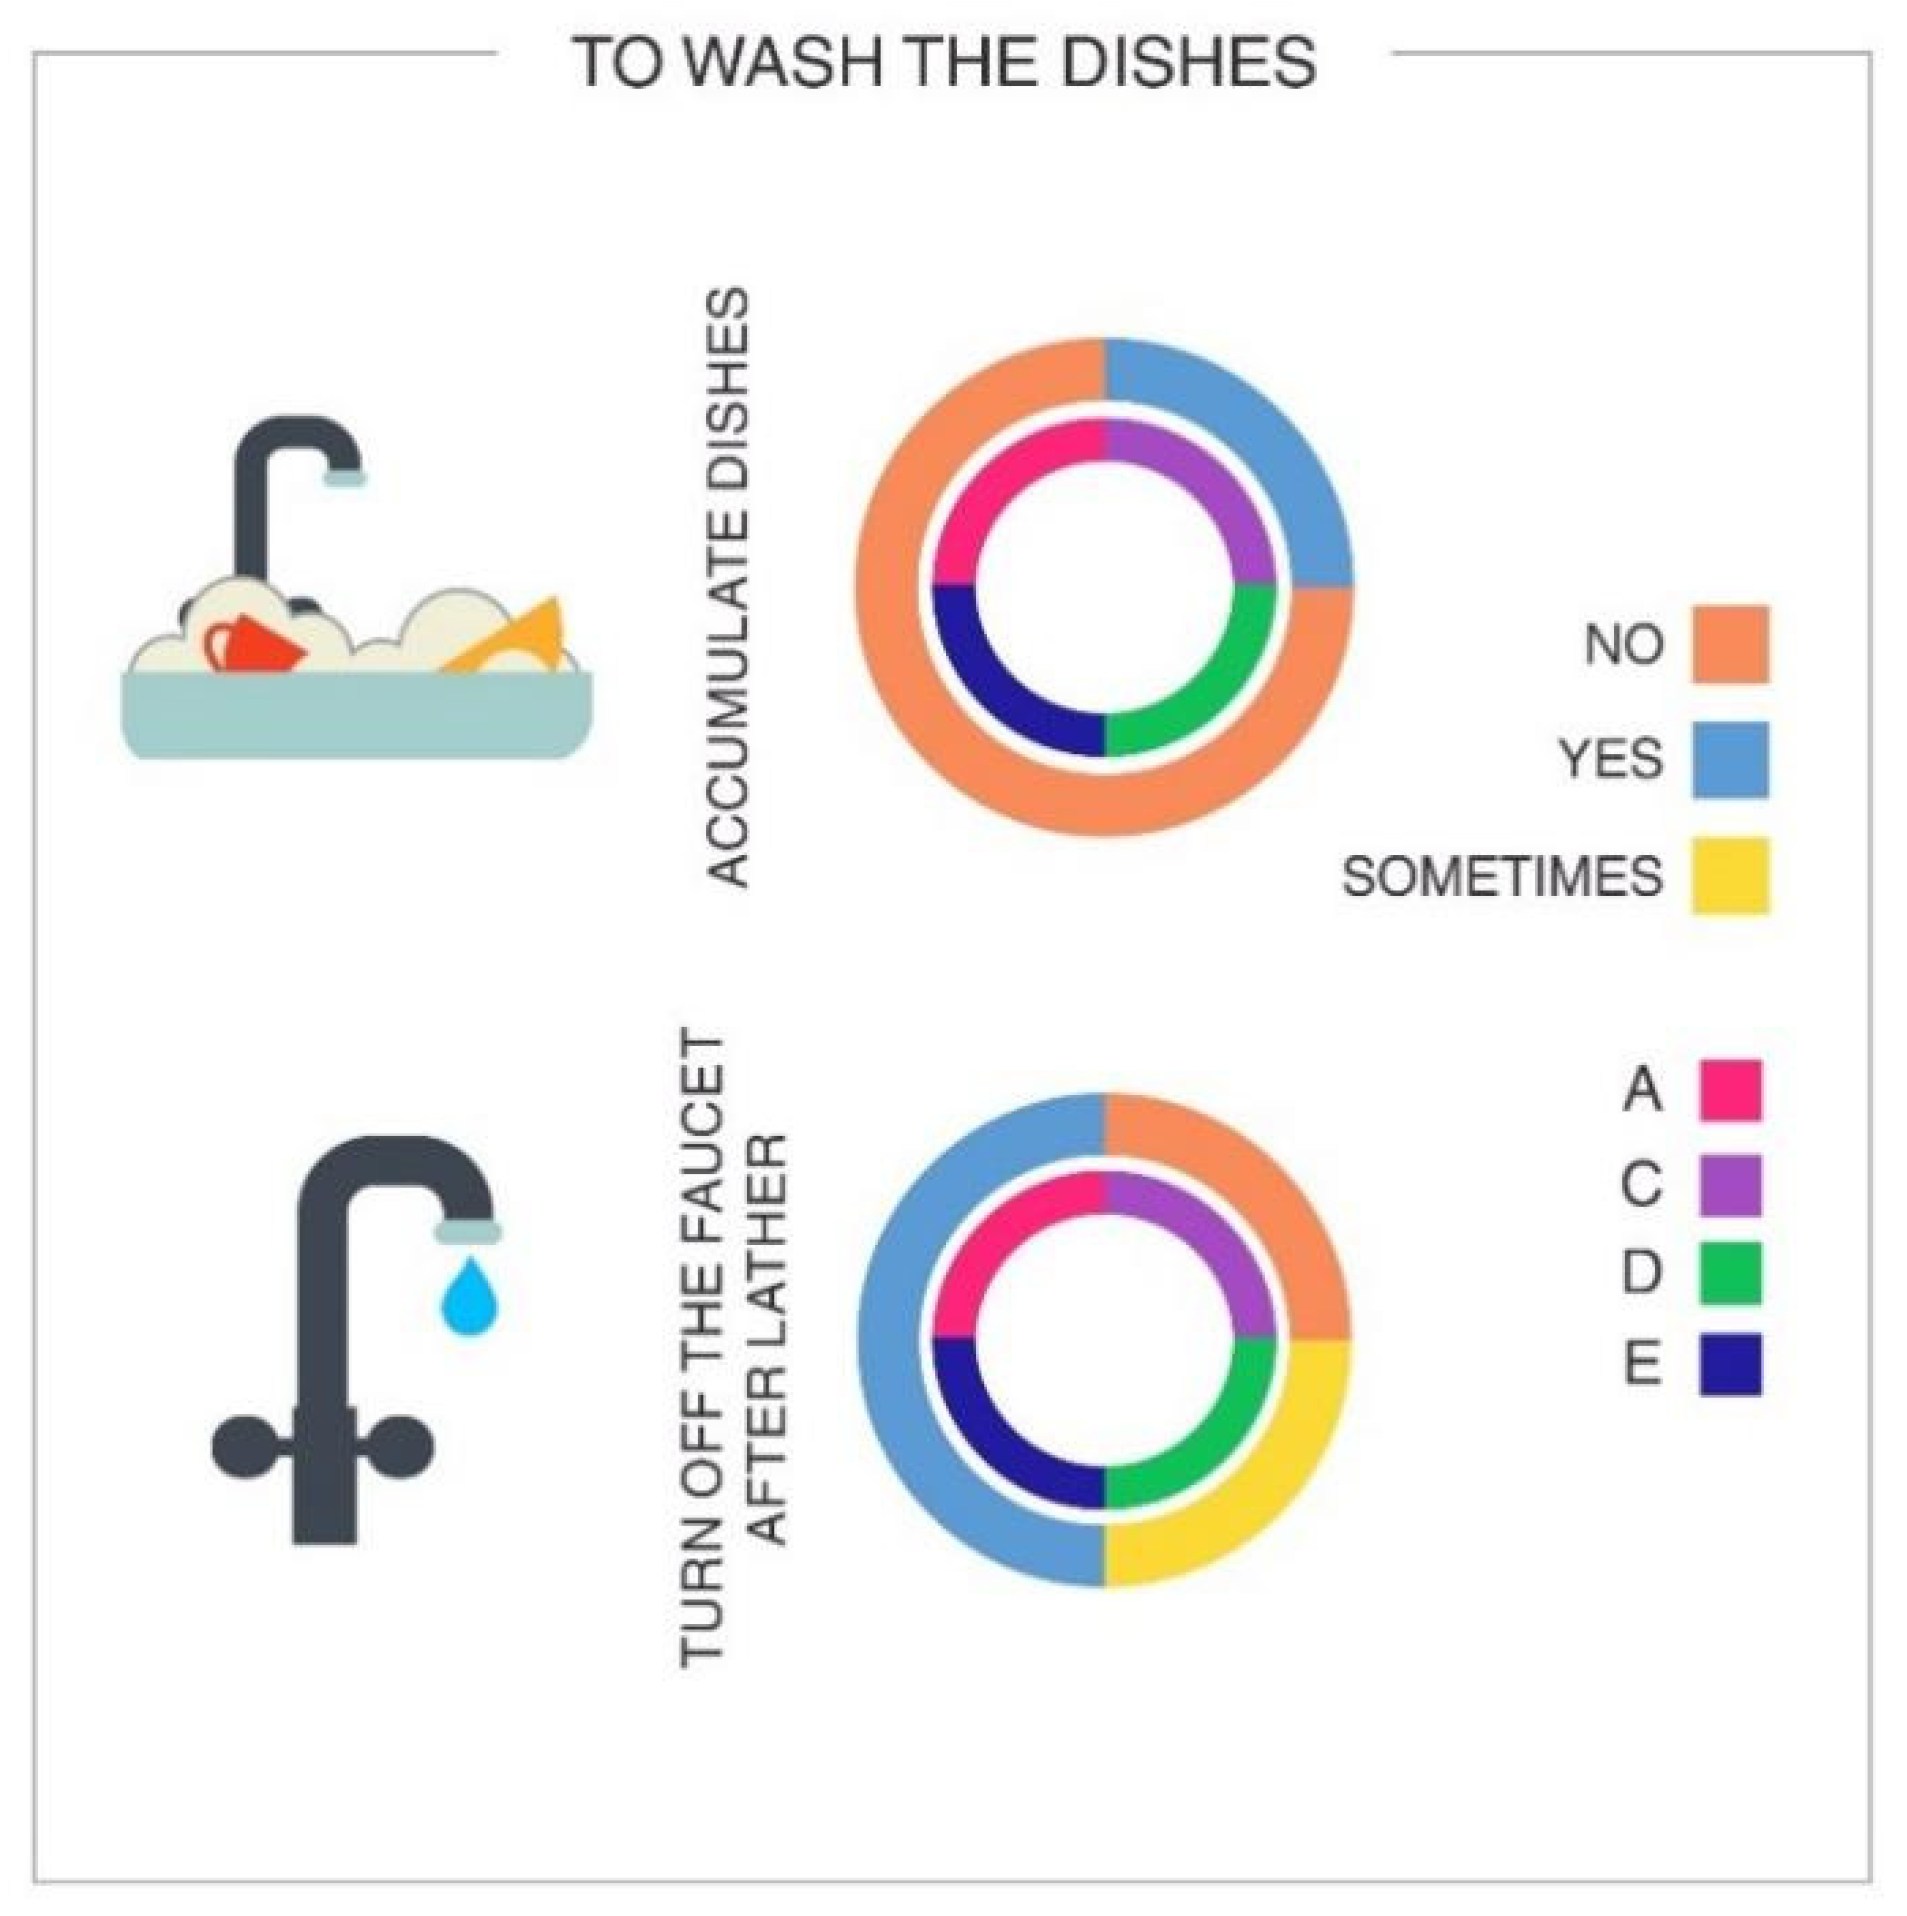
Washing Dishes
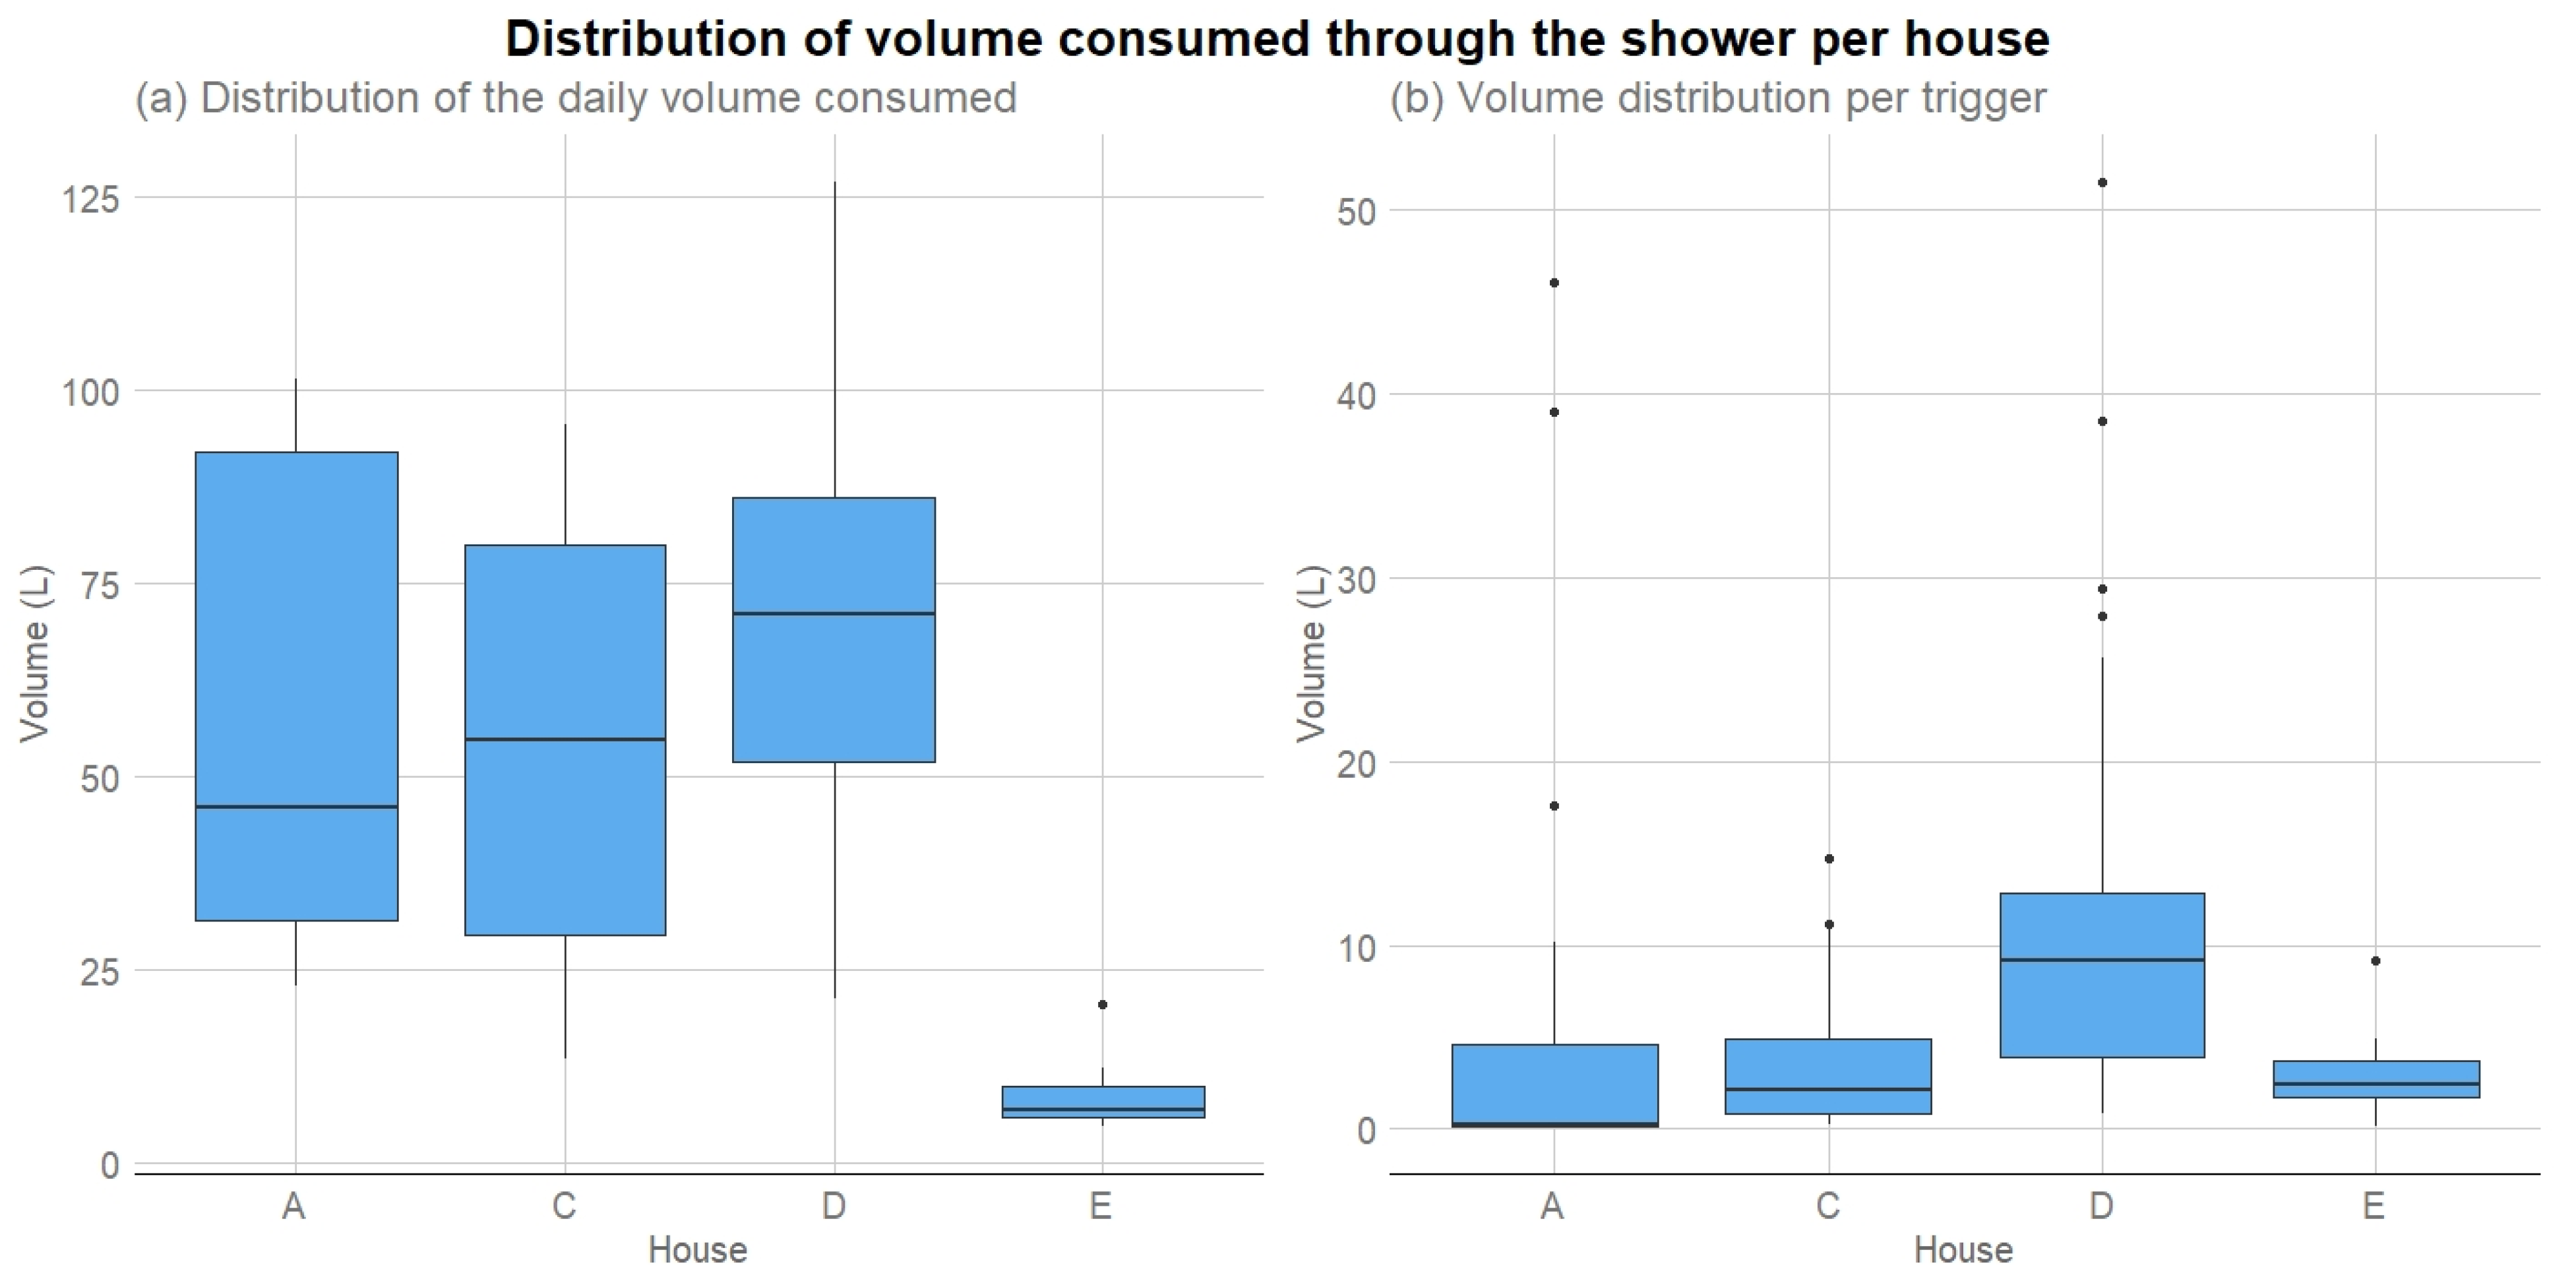
Bathing
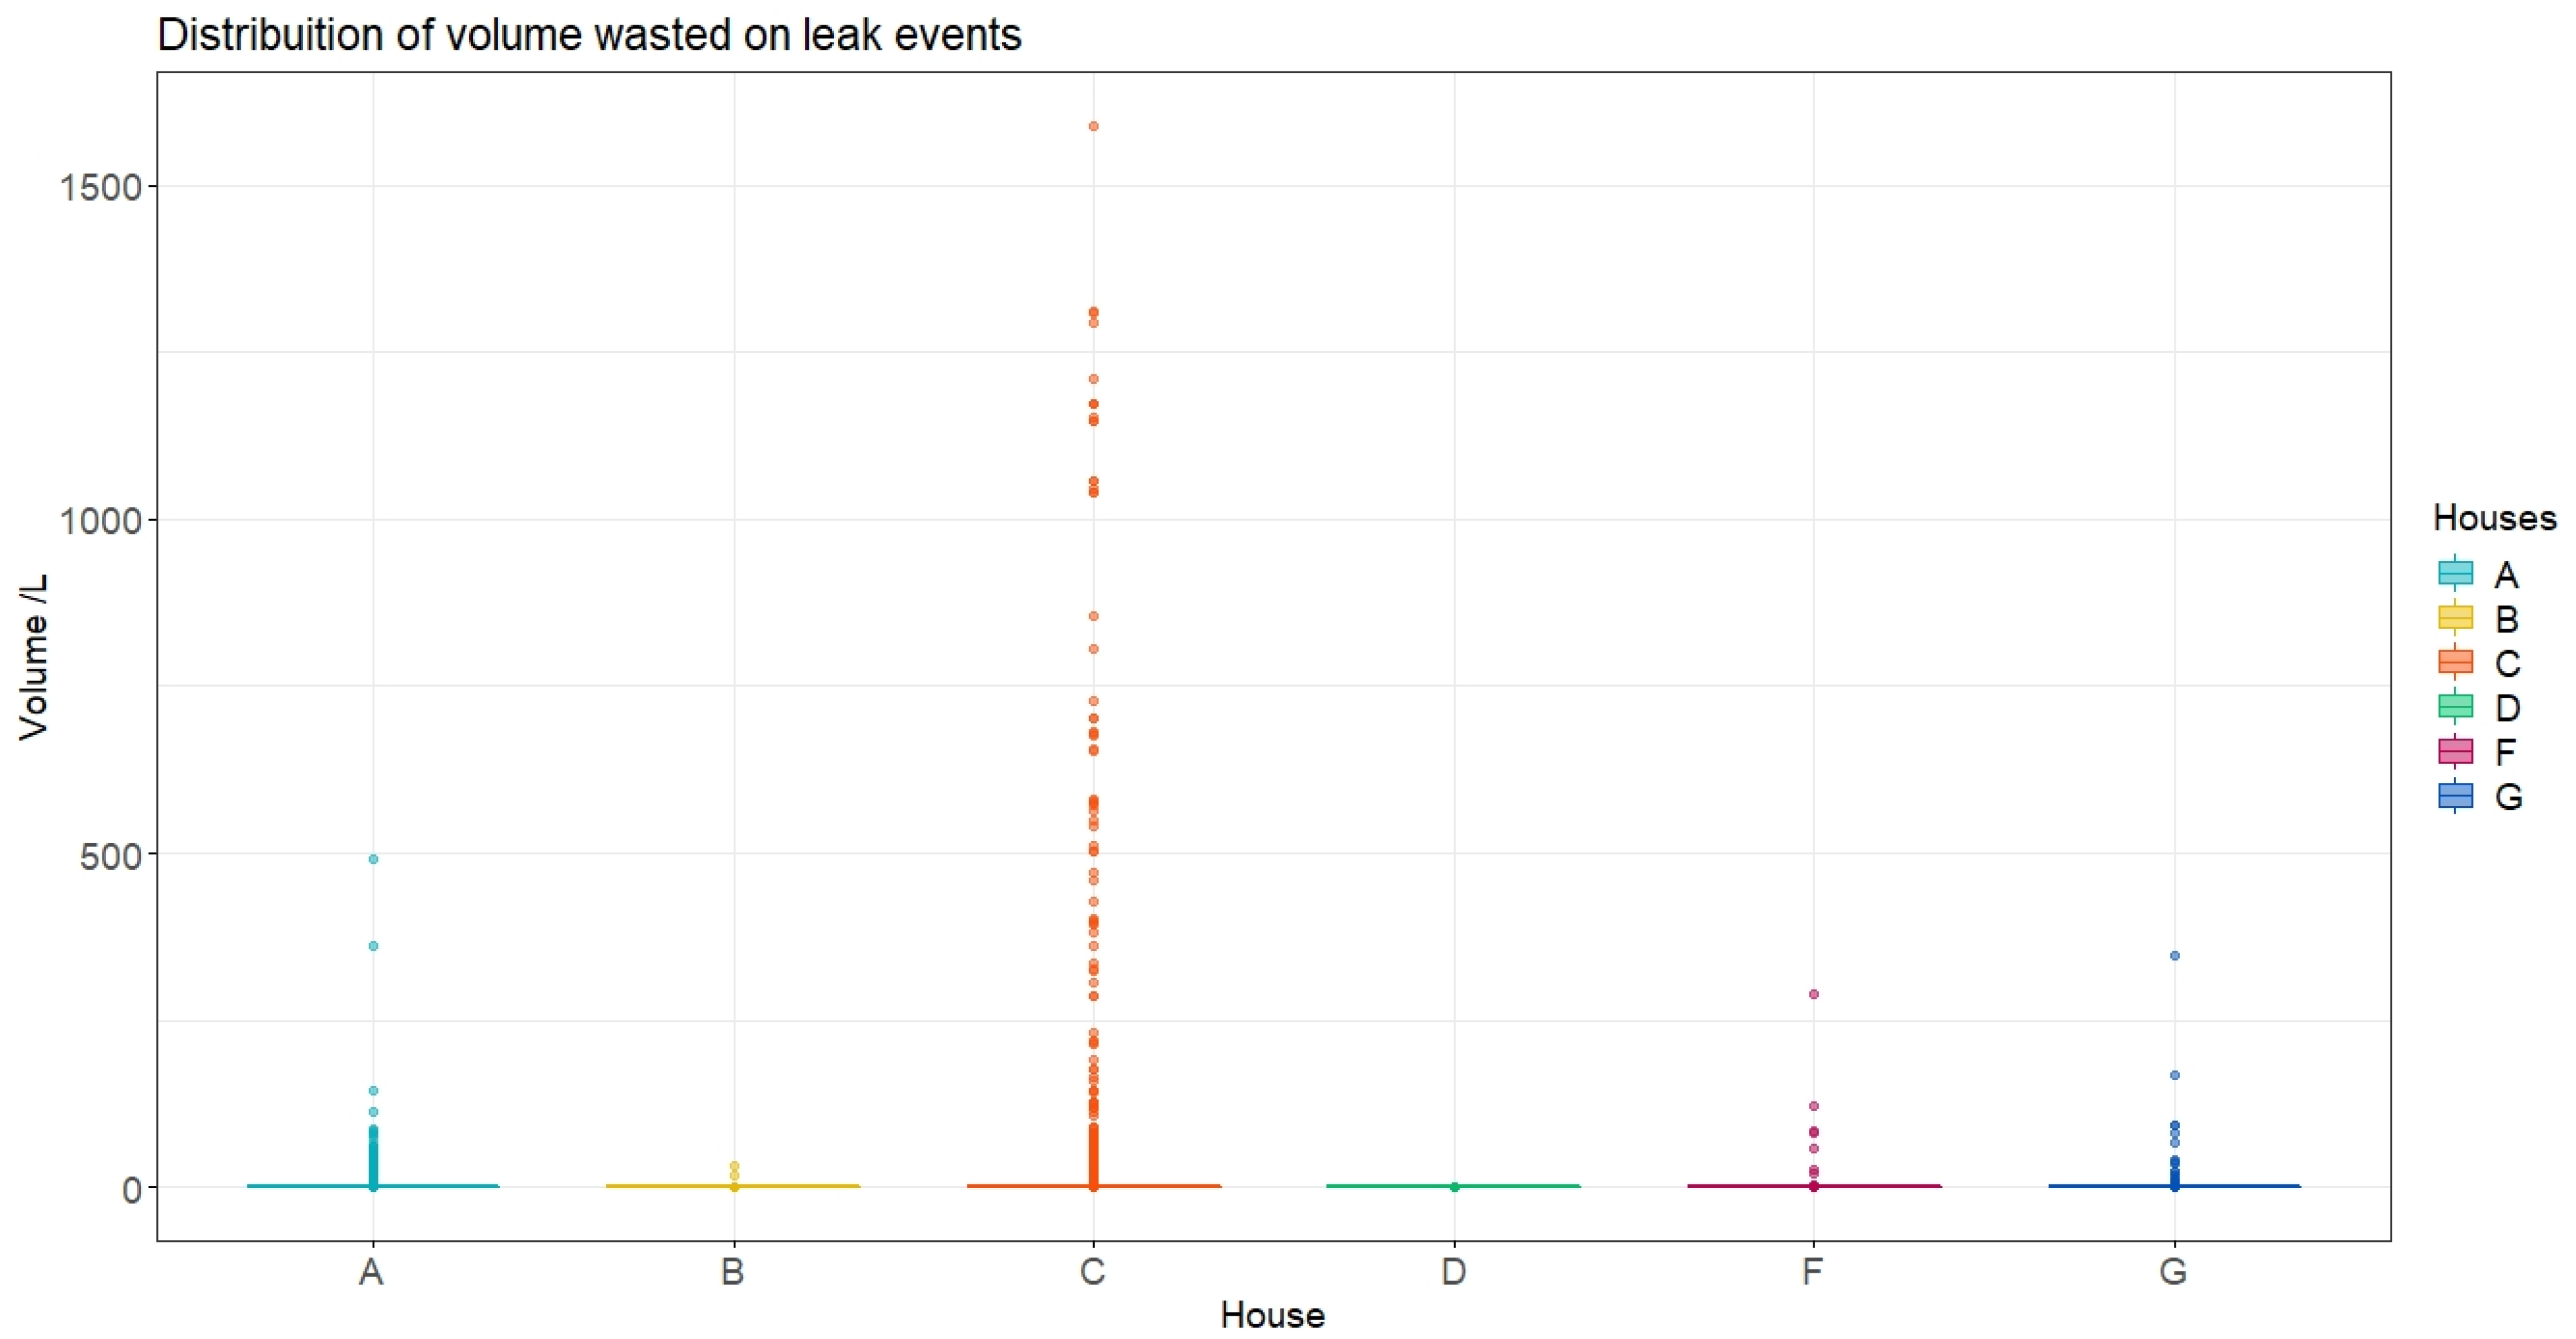
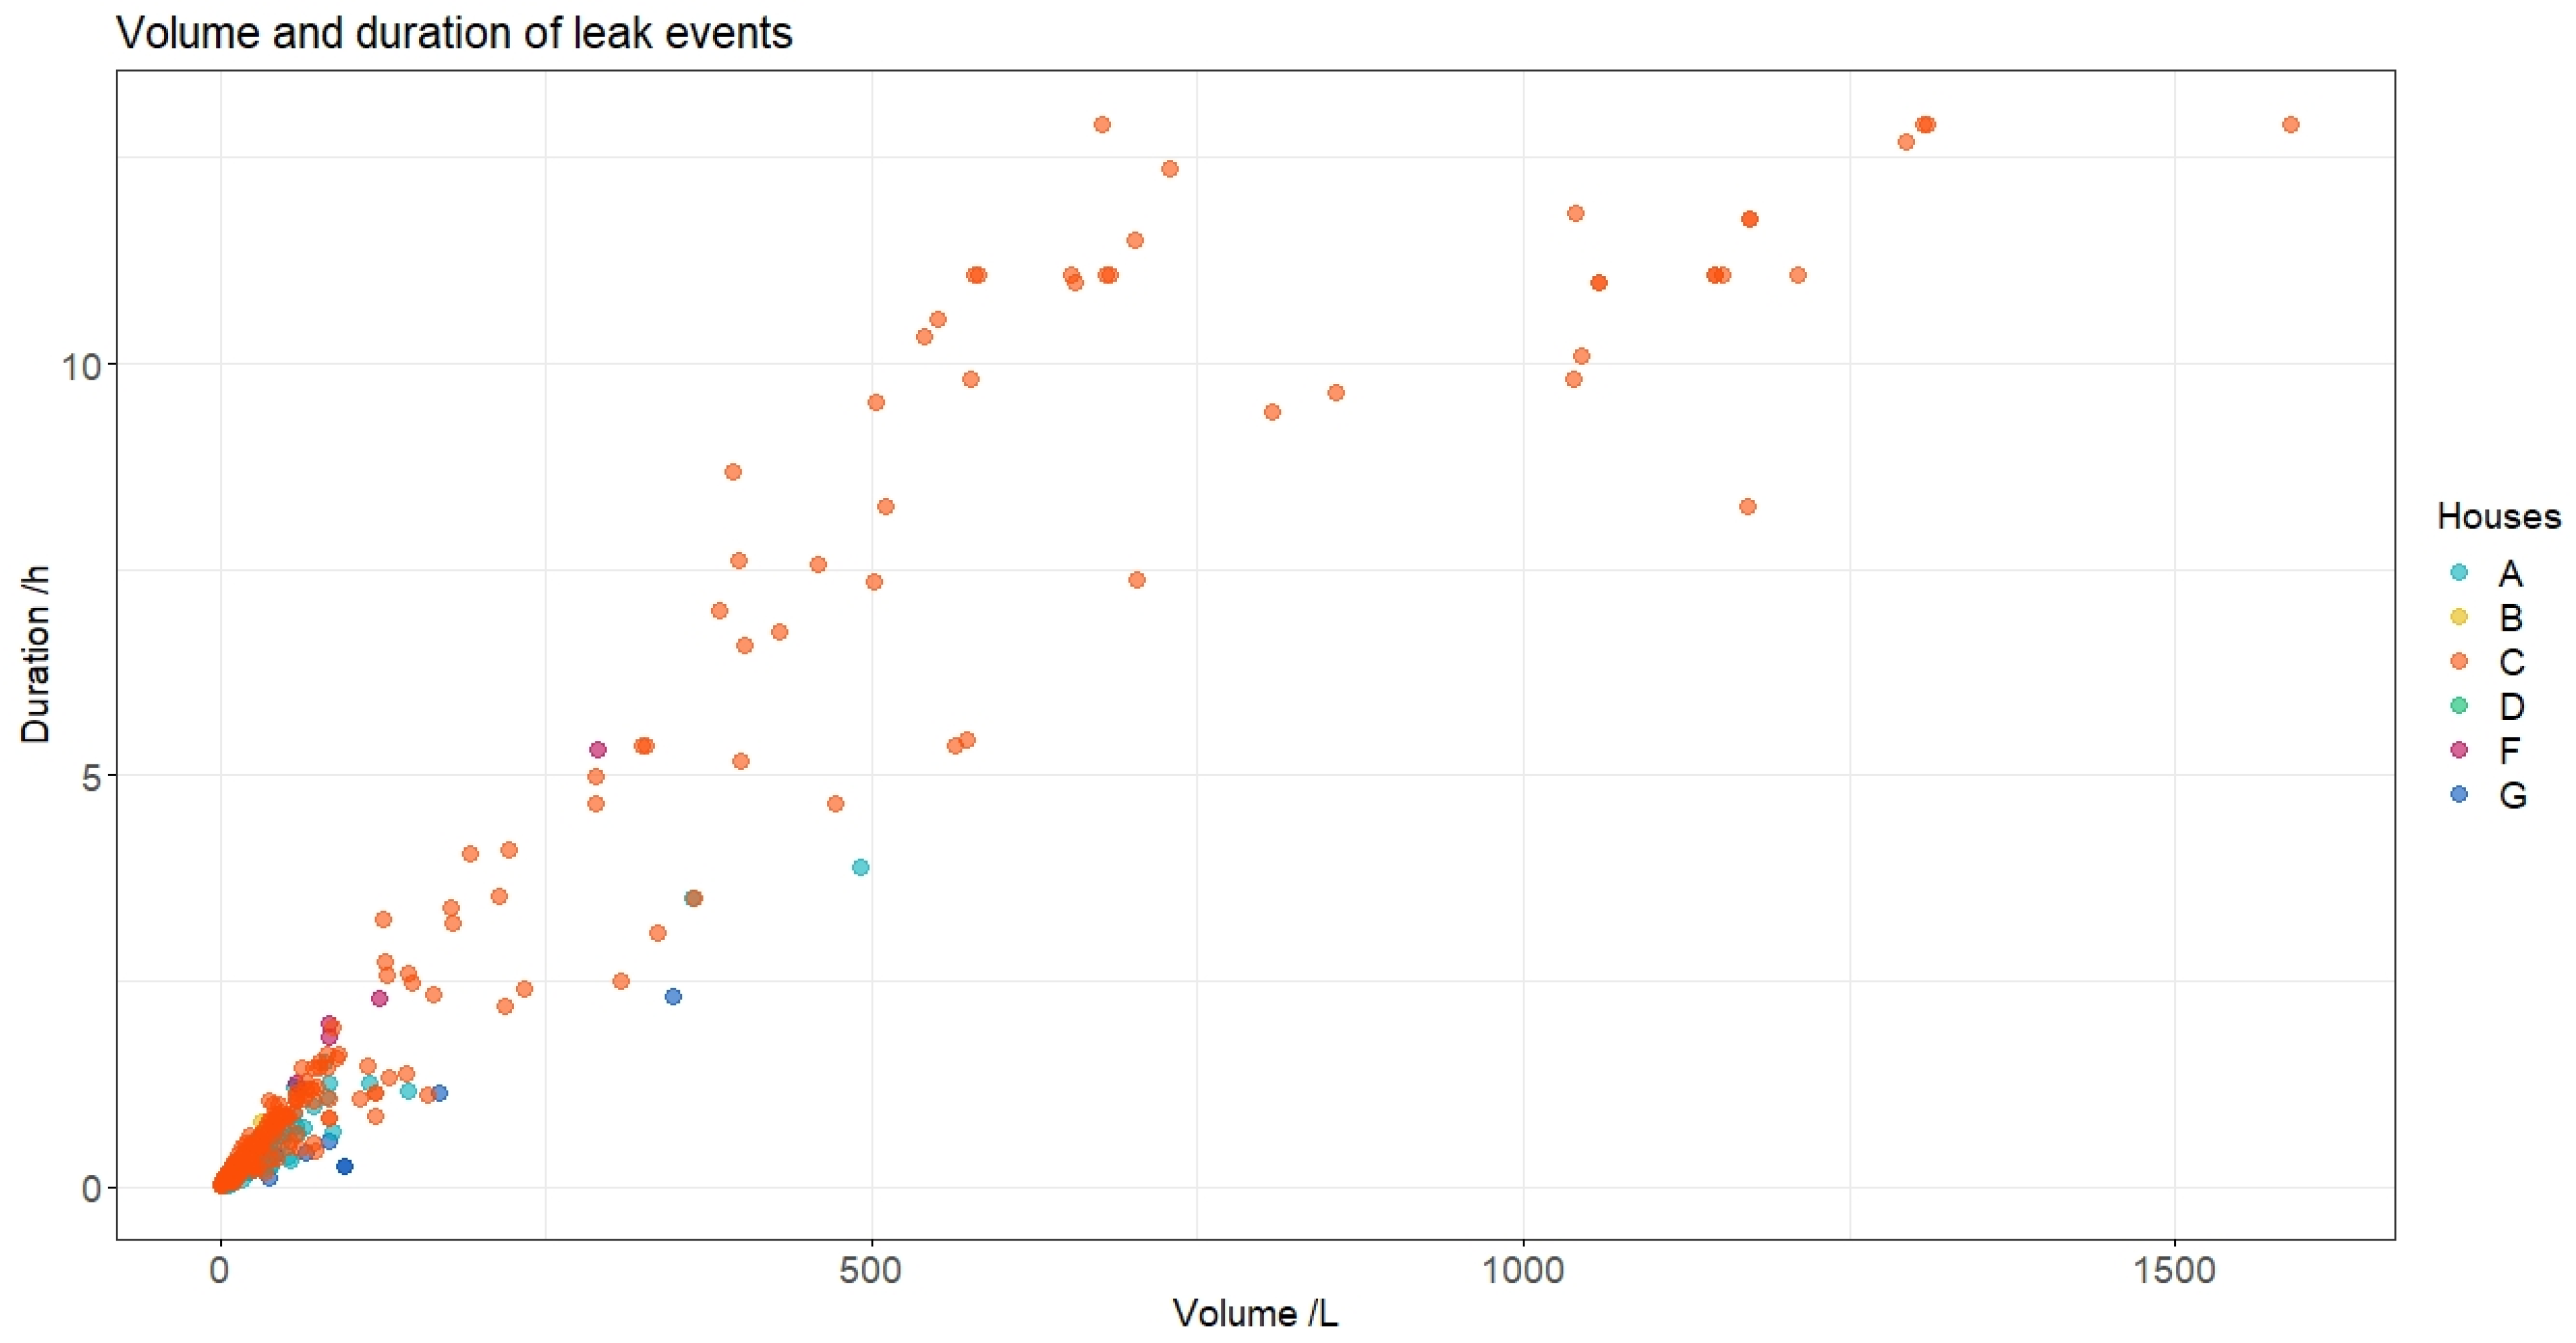
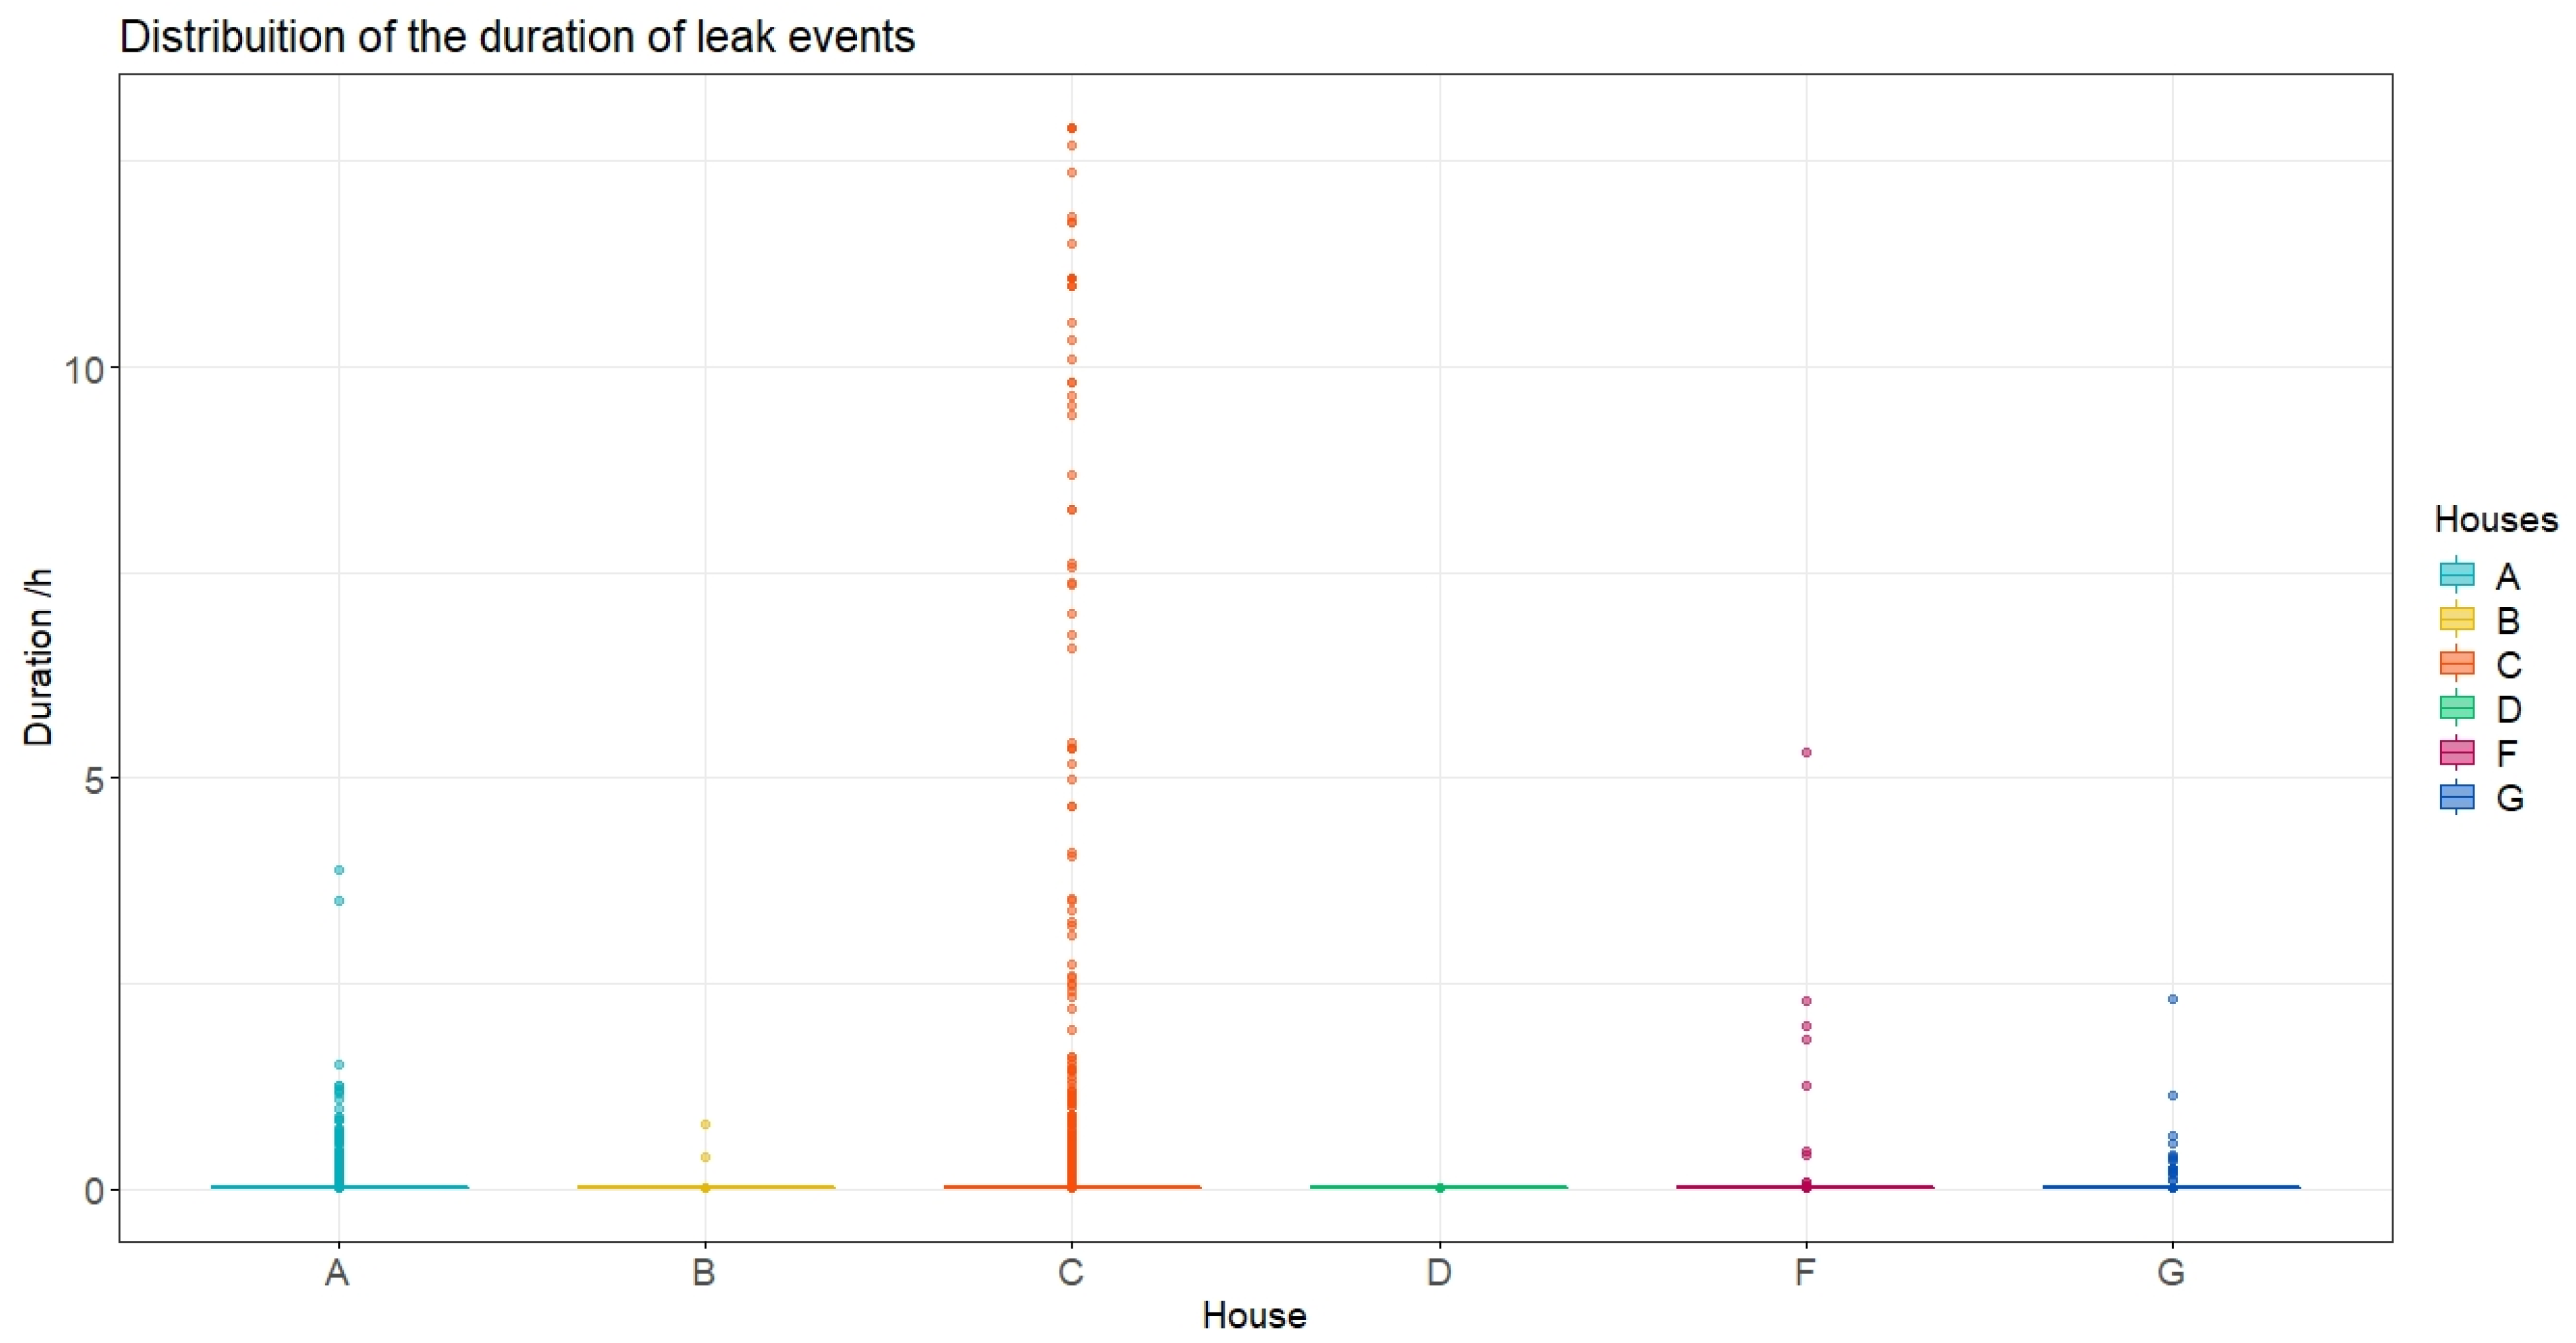
Leaks
5.1.2. Interview Results Considering the Social Practices Approach Conceptual Model
5.1.3. Final Considerations
5.1.4. Customized Measures to Promote Rational Water Consumption
- Use clothes more times before washing;
- Do not wear worn shoes indoors;
- Do not use soapy water to clean the floor, but rather a damp cloth;
- Cook in larger quantities and store food in the refrigerator or freezer;
- Accumulate dishes to be washed all at once, reusing the washing water to “soften” the dirt on others.
- Fill the washing machine to its maximum load;
- Avoid washing underwear in the shower;
- Reuse laundry water;
- Choose floors that are a little darker to avoid the quick perception of dirt;
- Turn off the taps at intervals of use;
- Remove excess dirt from dishes before washing;
- Prefer cold baths (applicable to places like Salvador, which has high temperatures most of the year);
- Use the shower only for hygiene; although, a longer bath can sometimes be a rational choice, for example, to satisfy a desire for relaxation. Individuals may have other relaxation options, and depending on the options, the longer bath may be the most environmentally friendly option.
- Provide preventative maintenance;
- Avoid activities that use water in non-ergonomic positions;
- Check the water meter periodically (preferably daily) [26];
- Check if the water pressure is too high or too low [51];
- Watering plants in the early morning and late evening [51]; despite the fact that gardens are uncommon in low-income neighborhoods.
- Check for any open water pipe before leaving the house [51].
- Using collected rainwater to external uses [51] or other uses inside the home;
- Using reuse water for less prestigious uses (e.g., flushing the toilet);
- Invest in more efficient hydraulic devices.
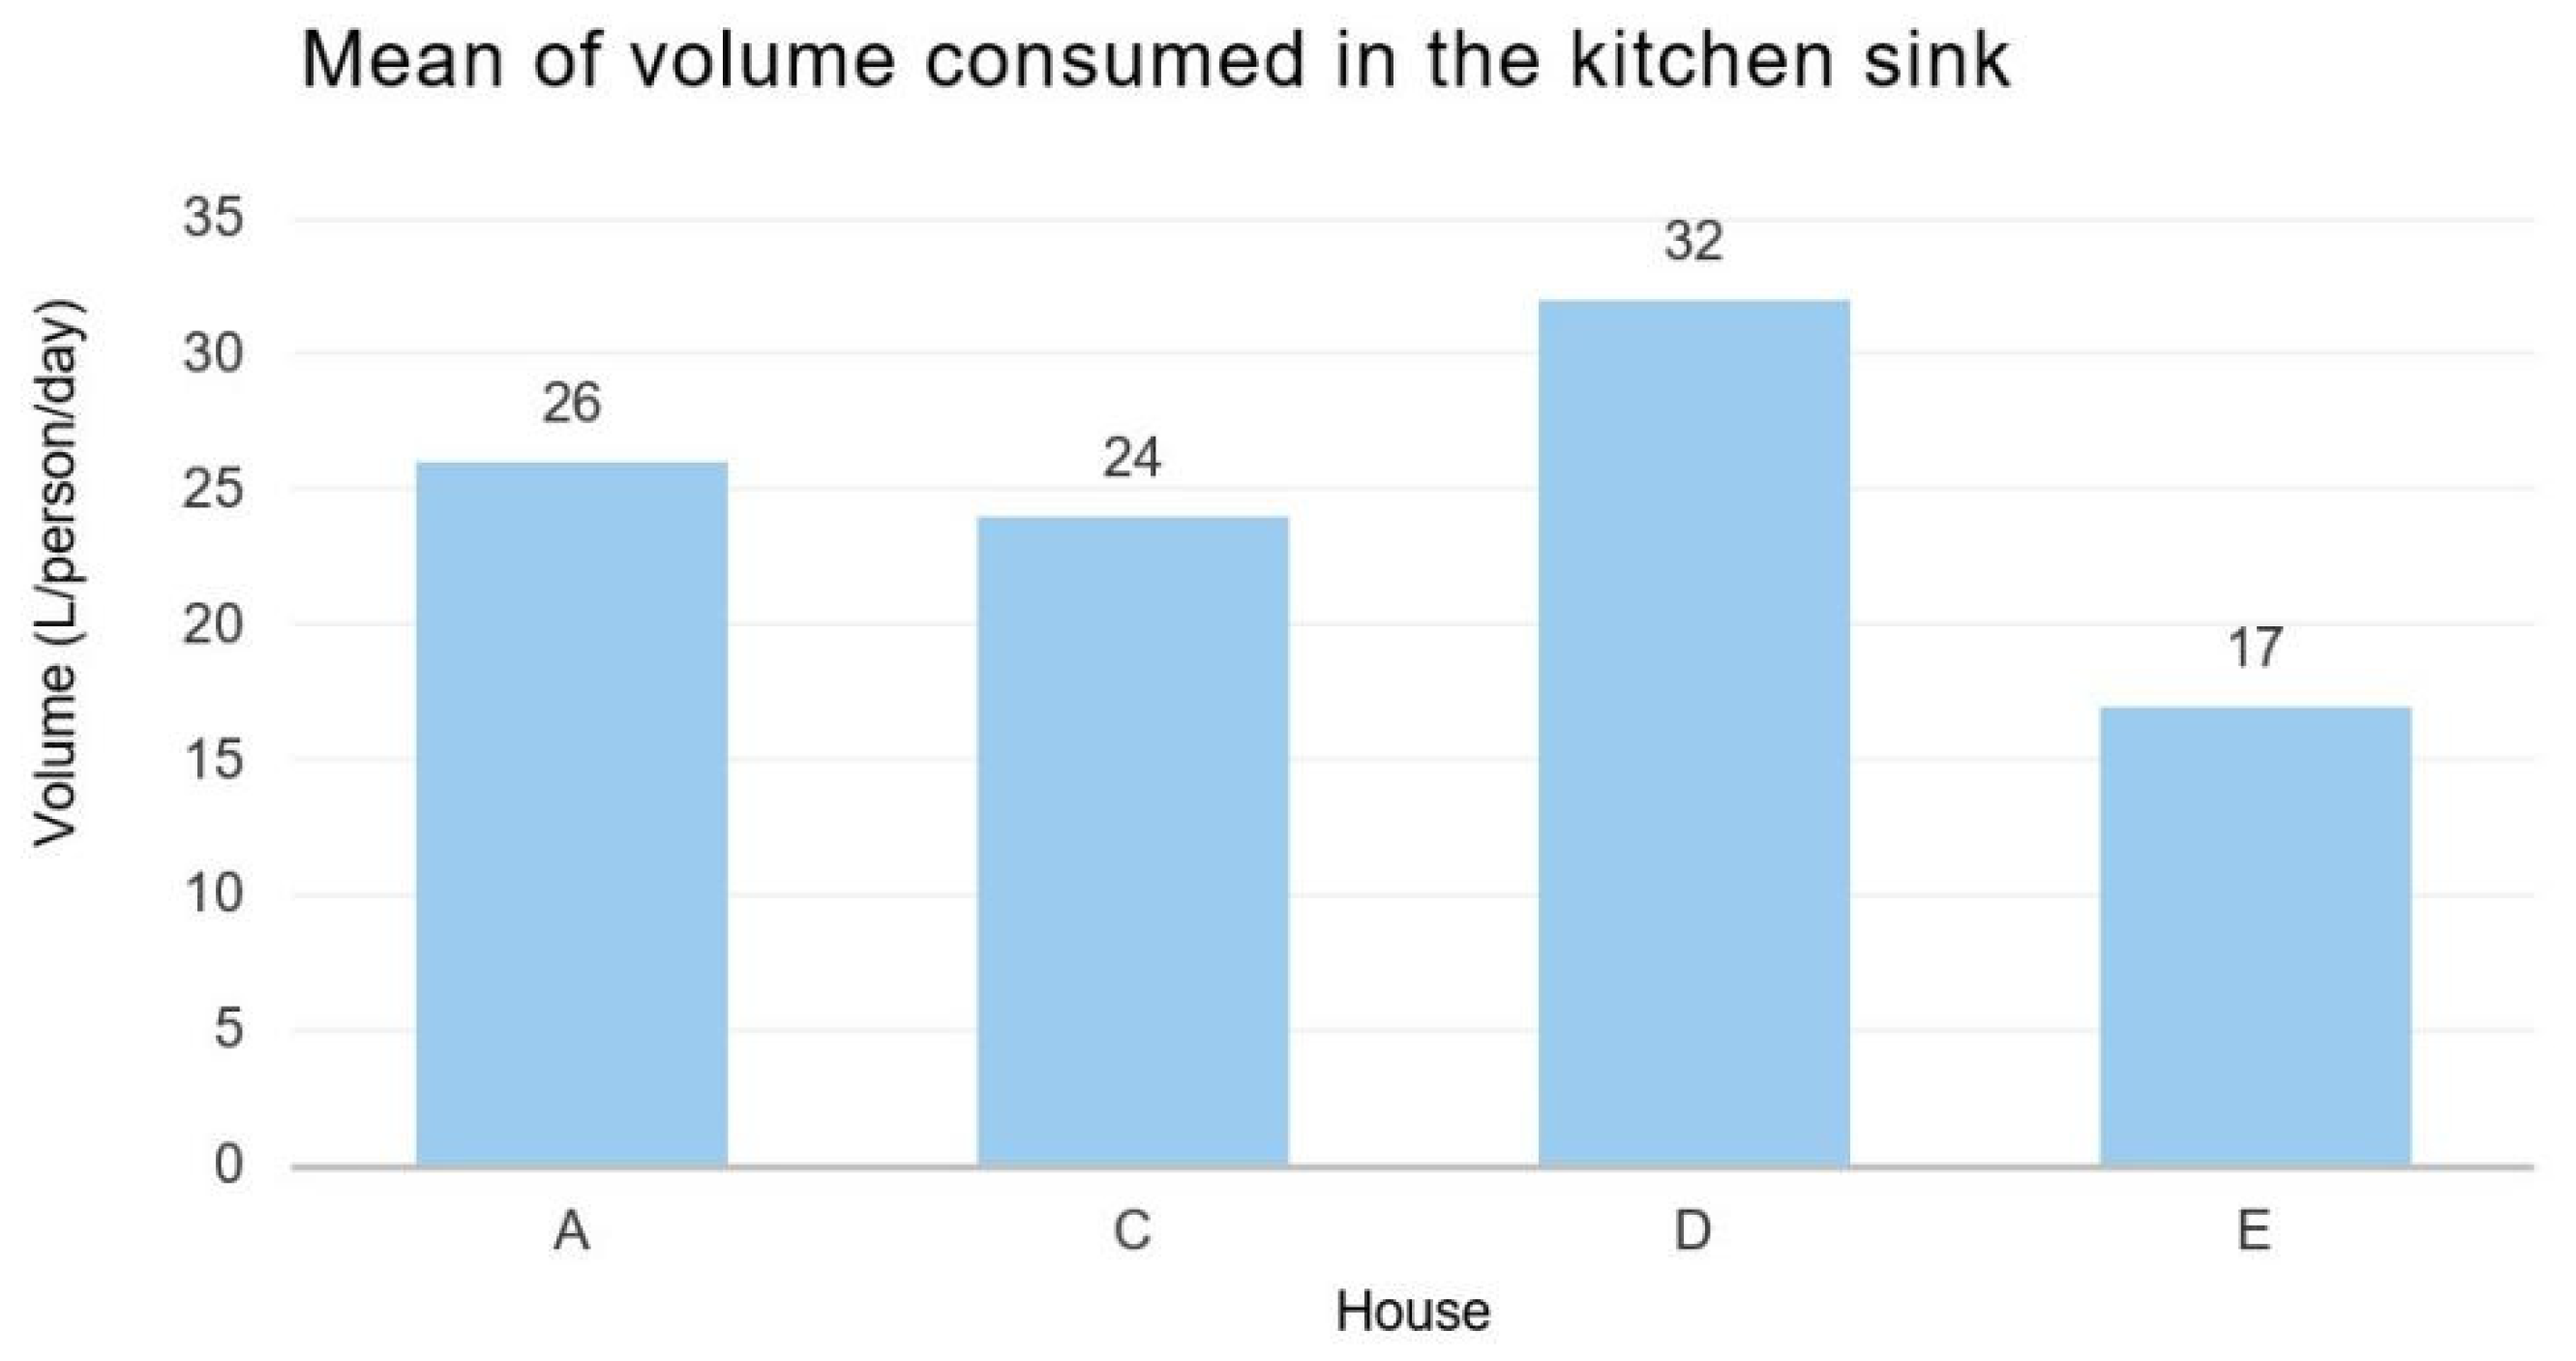
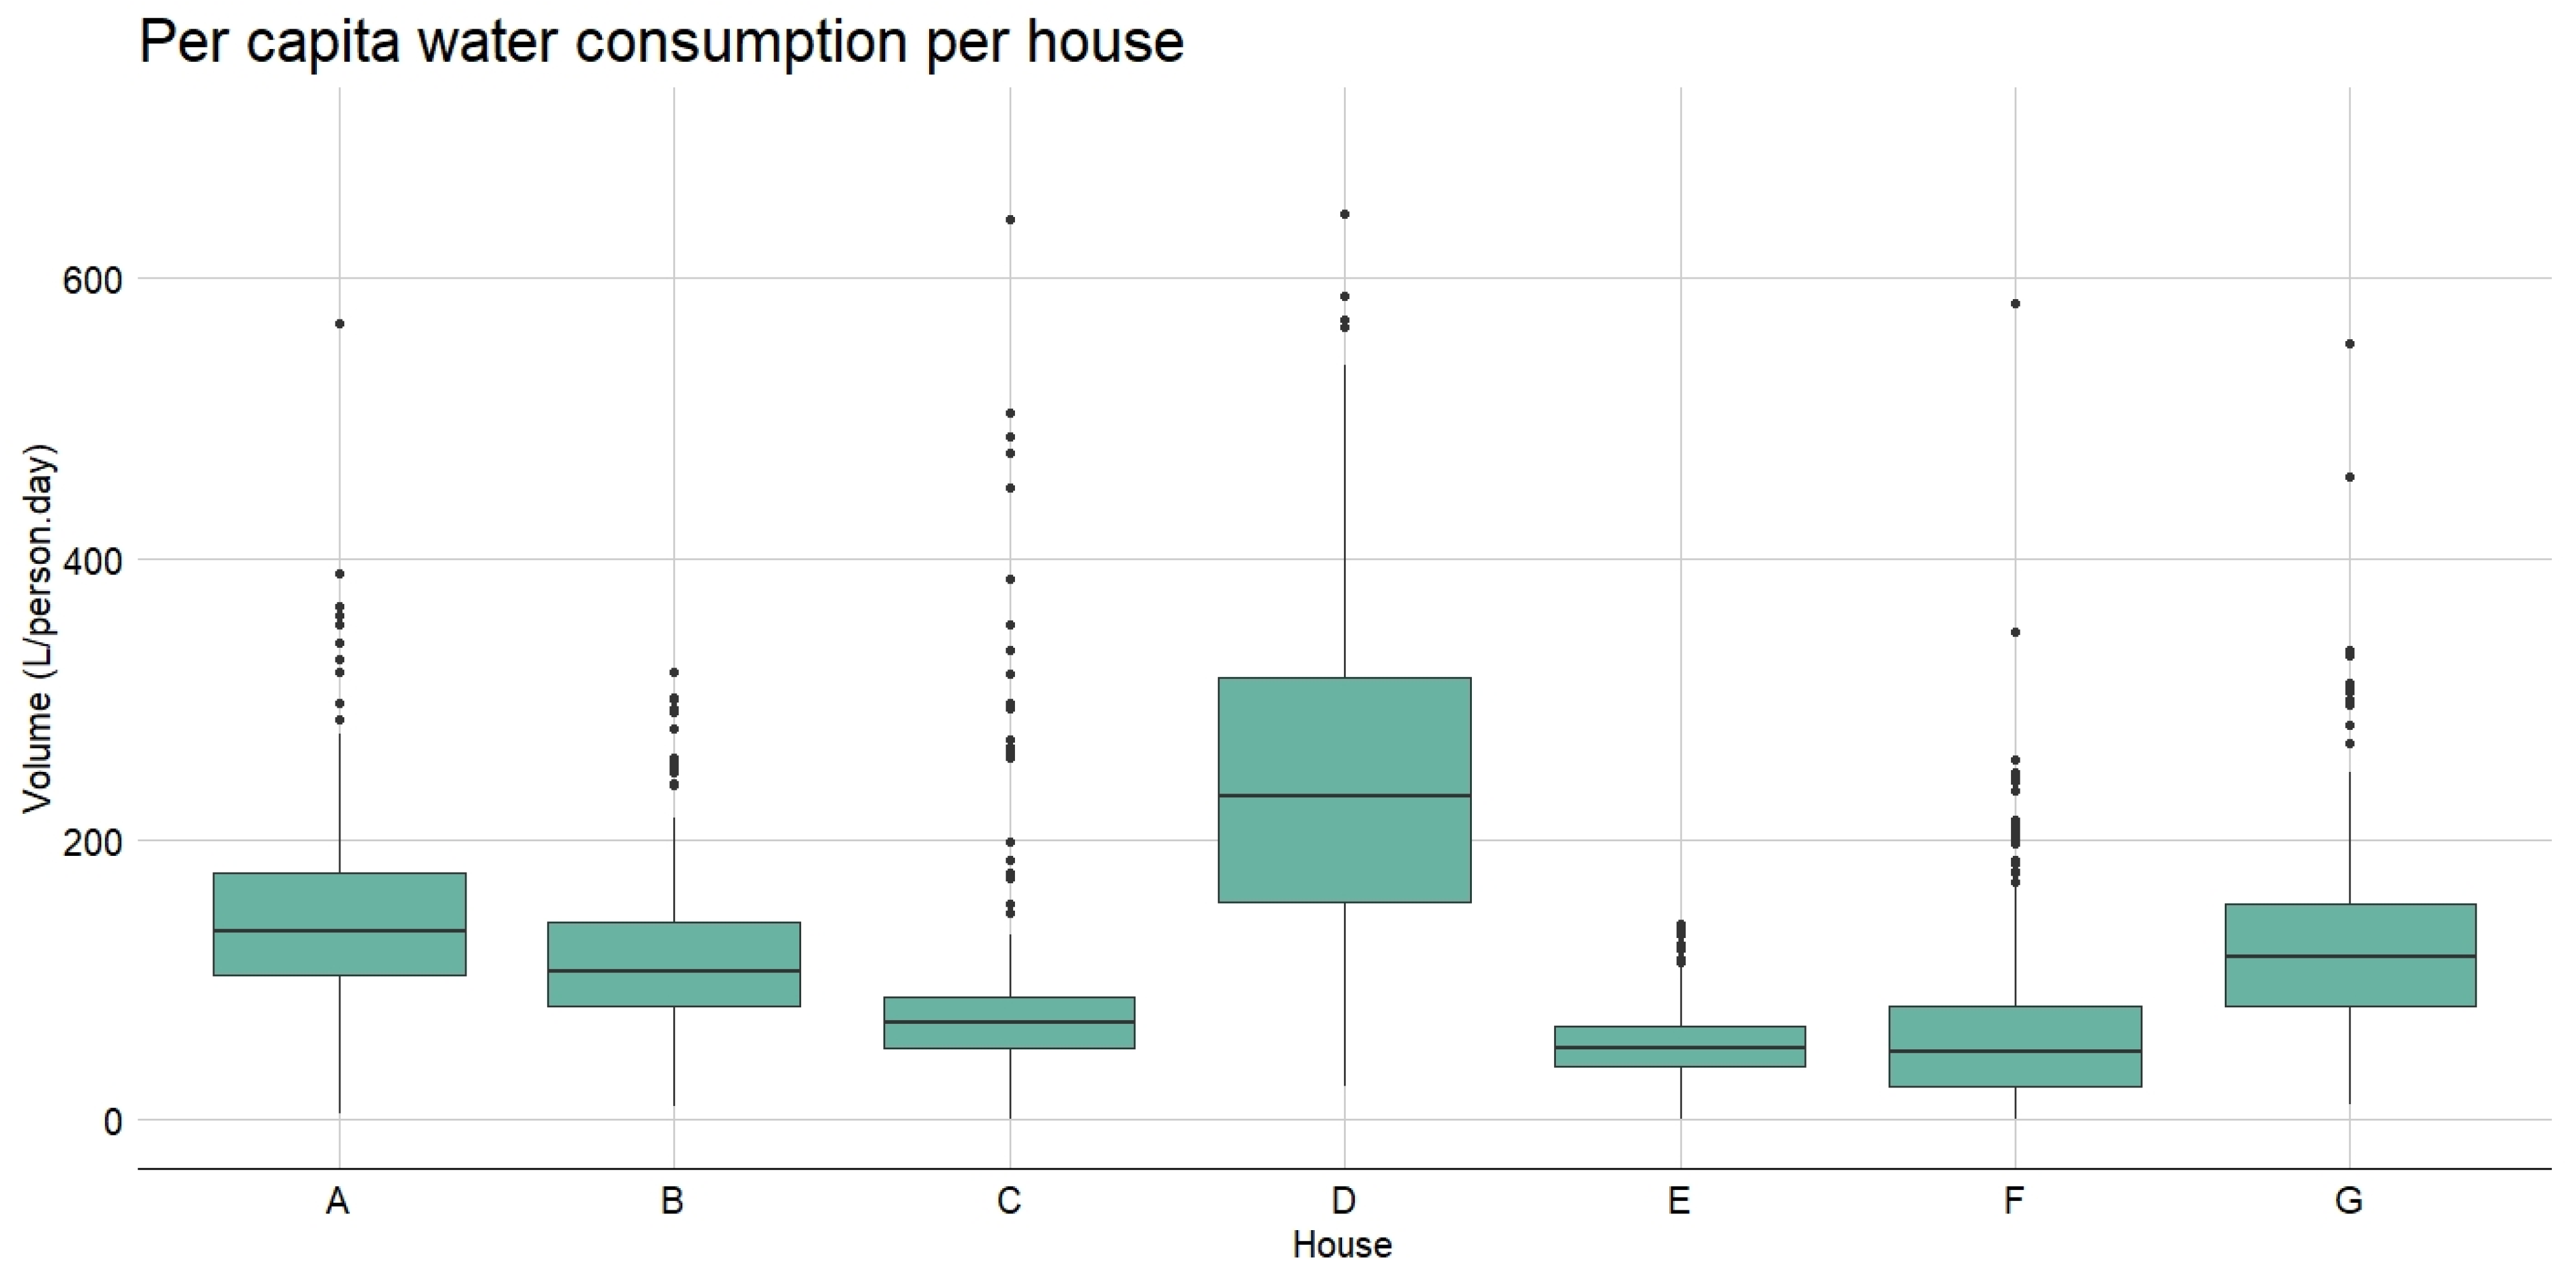
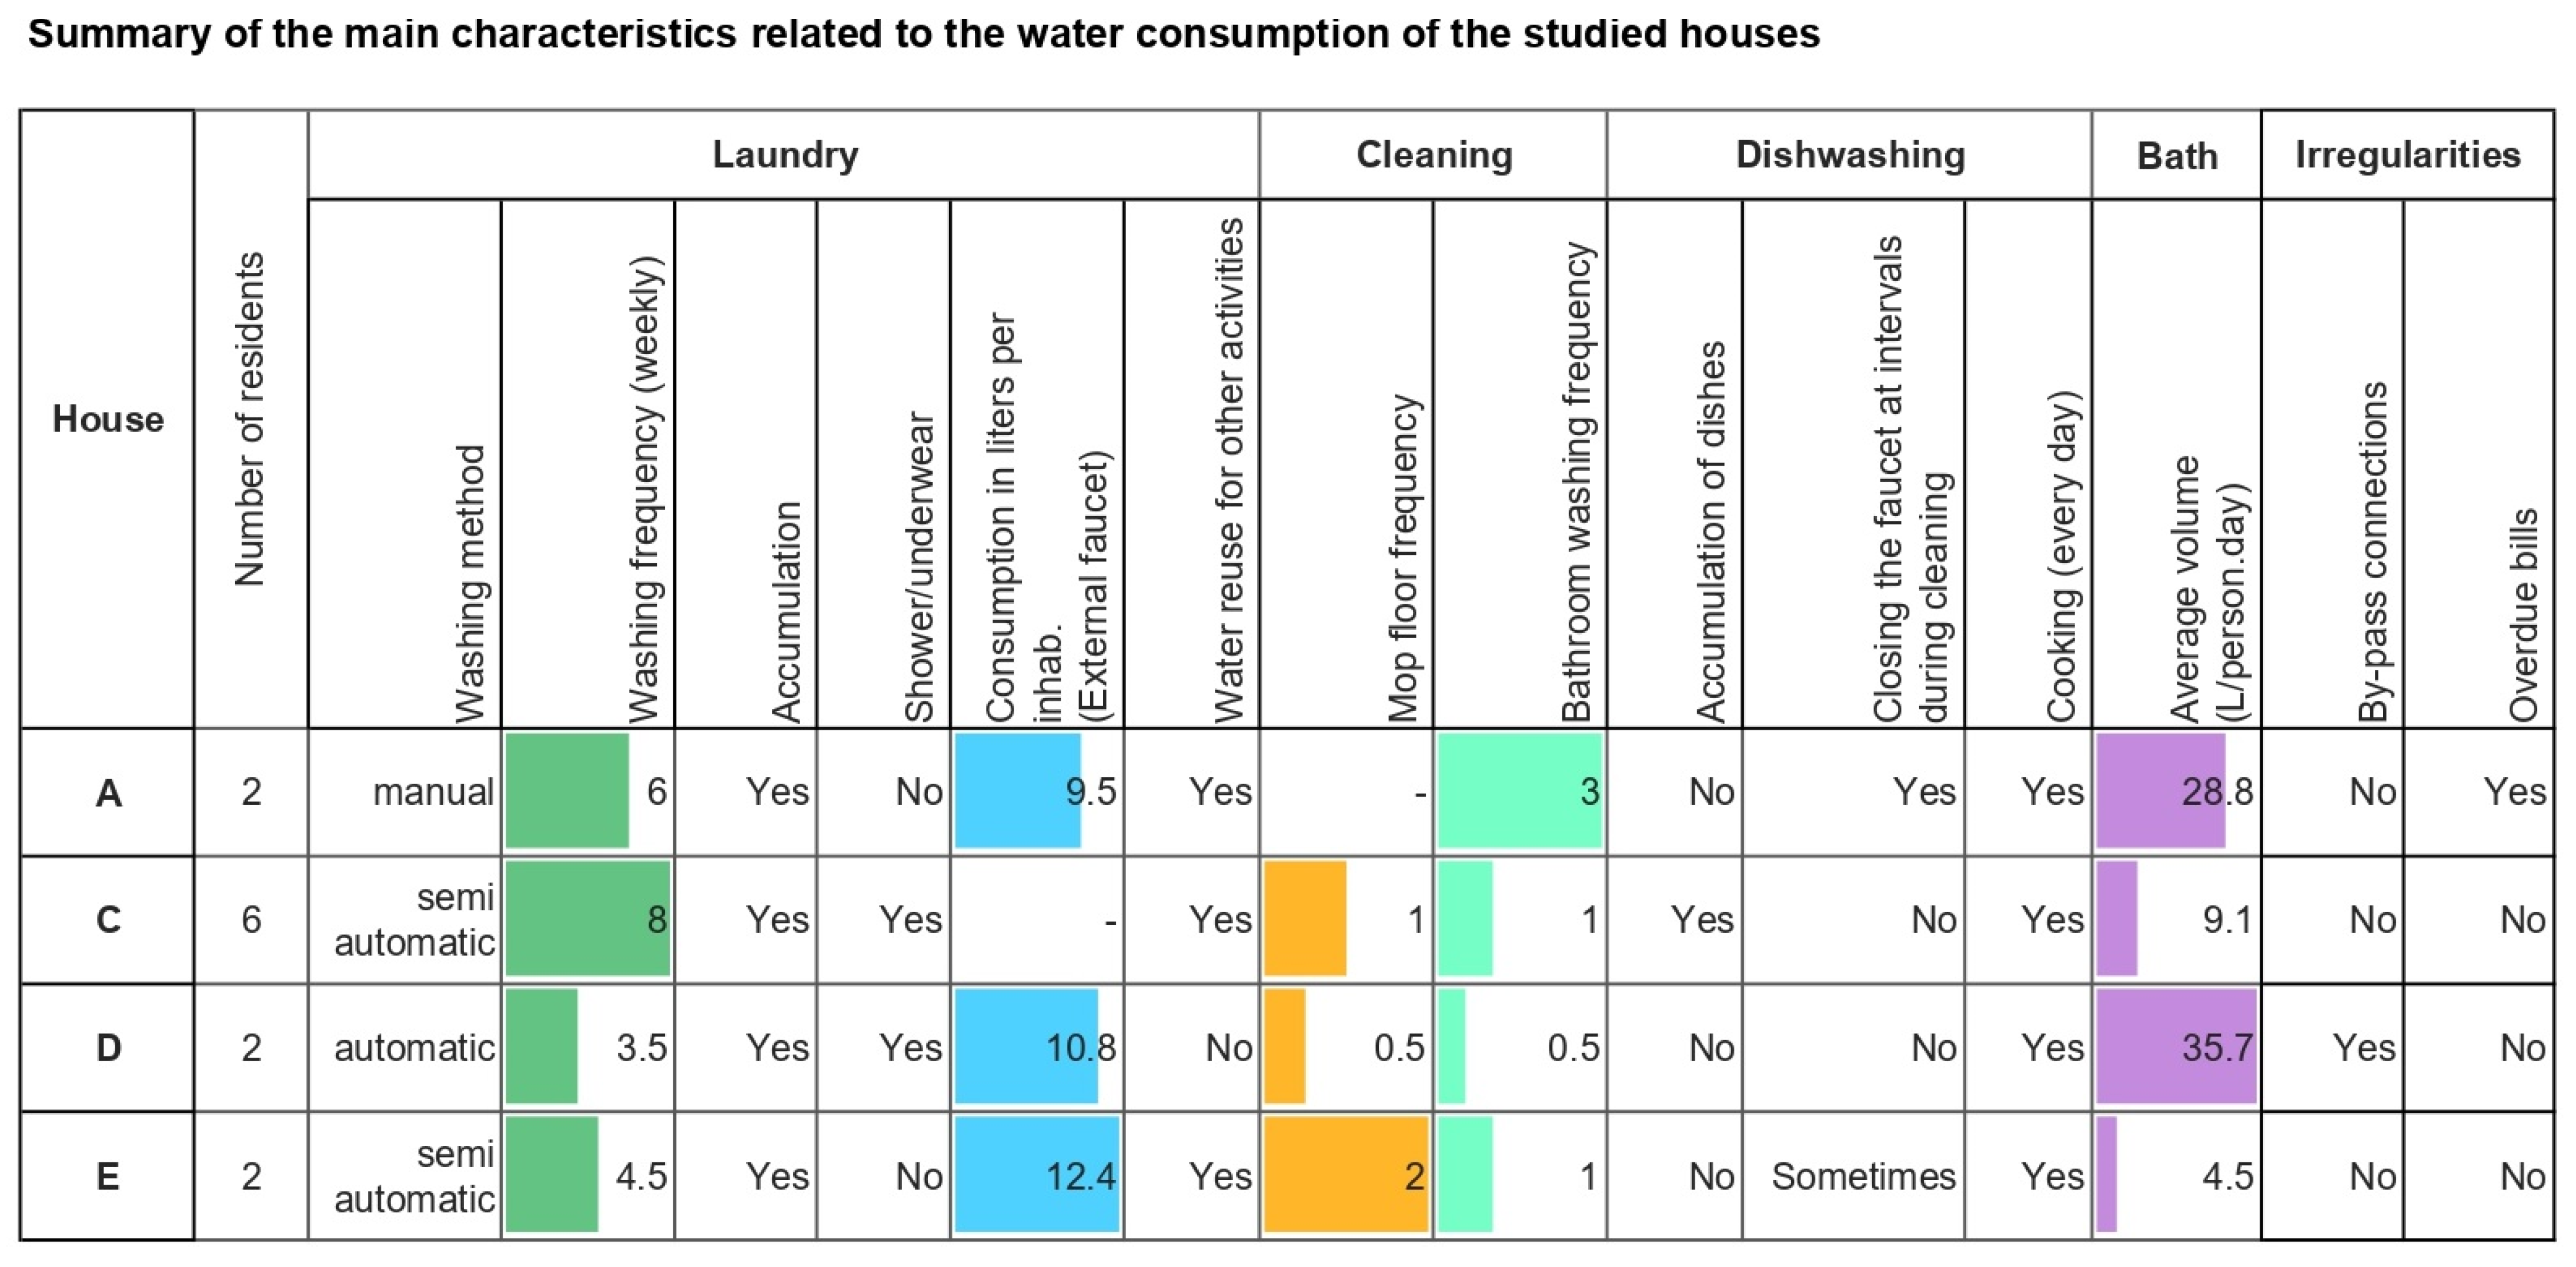
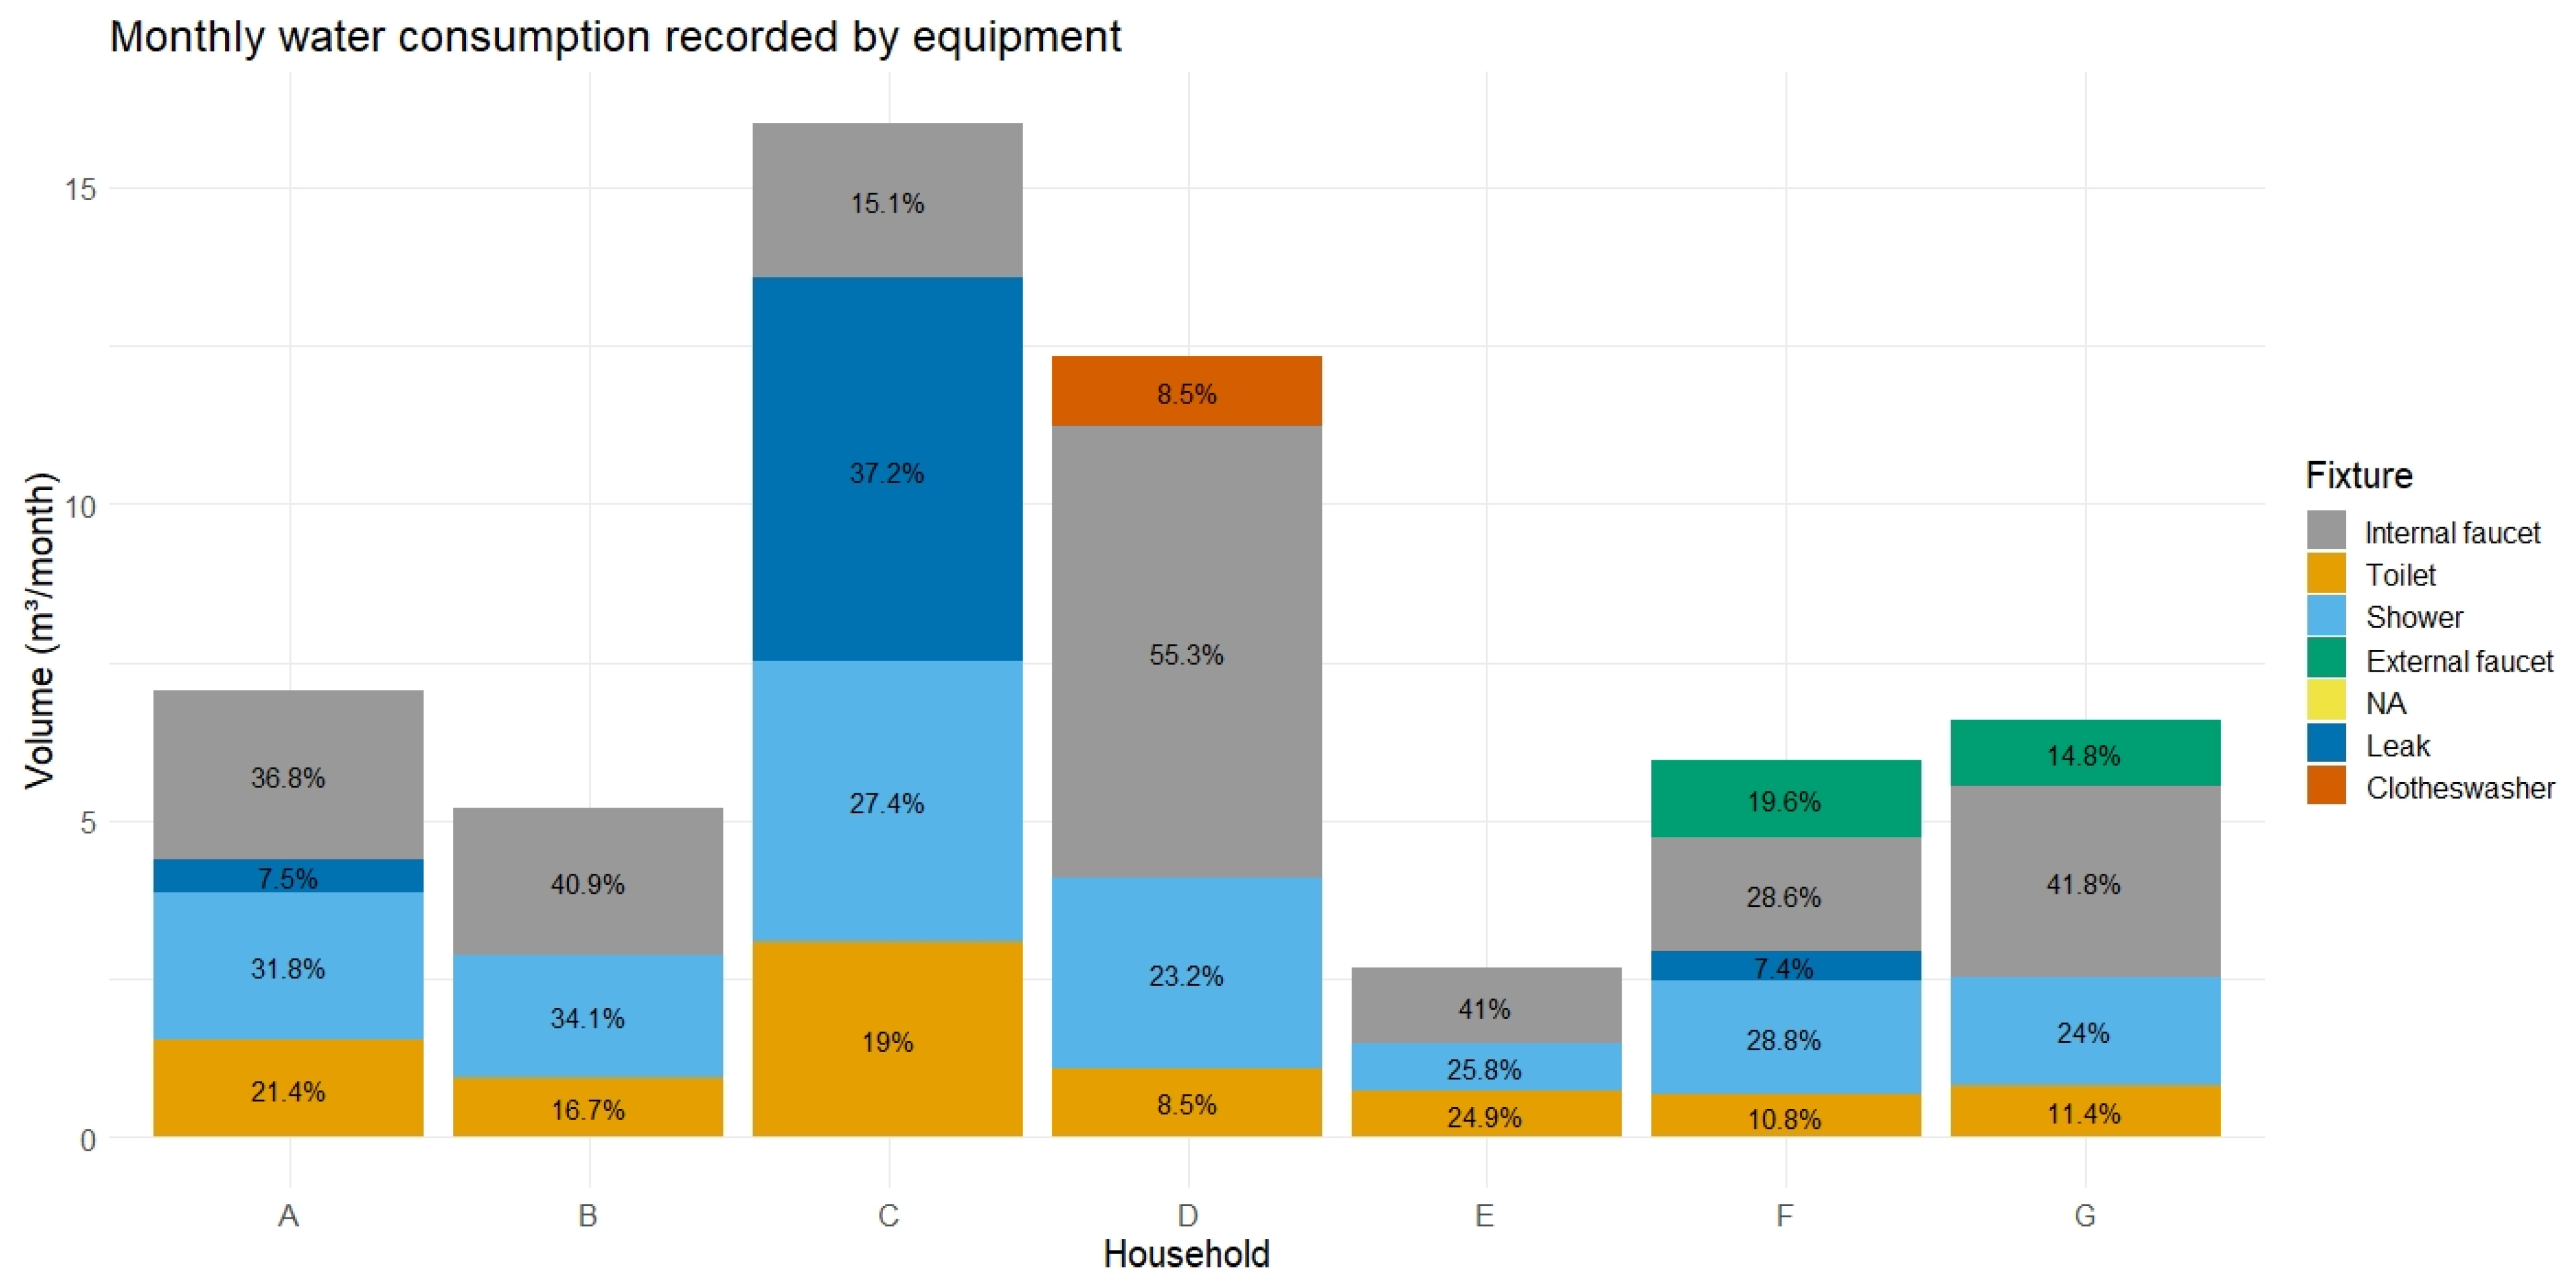
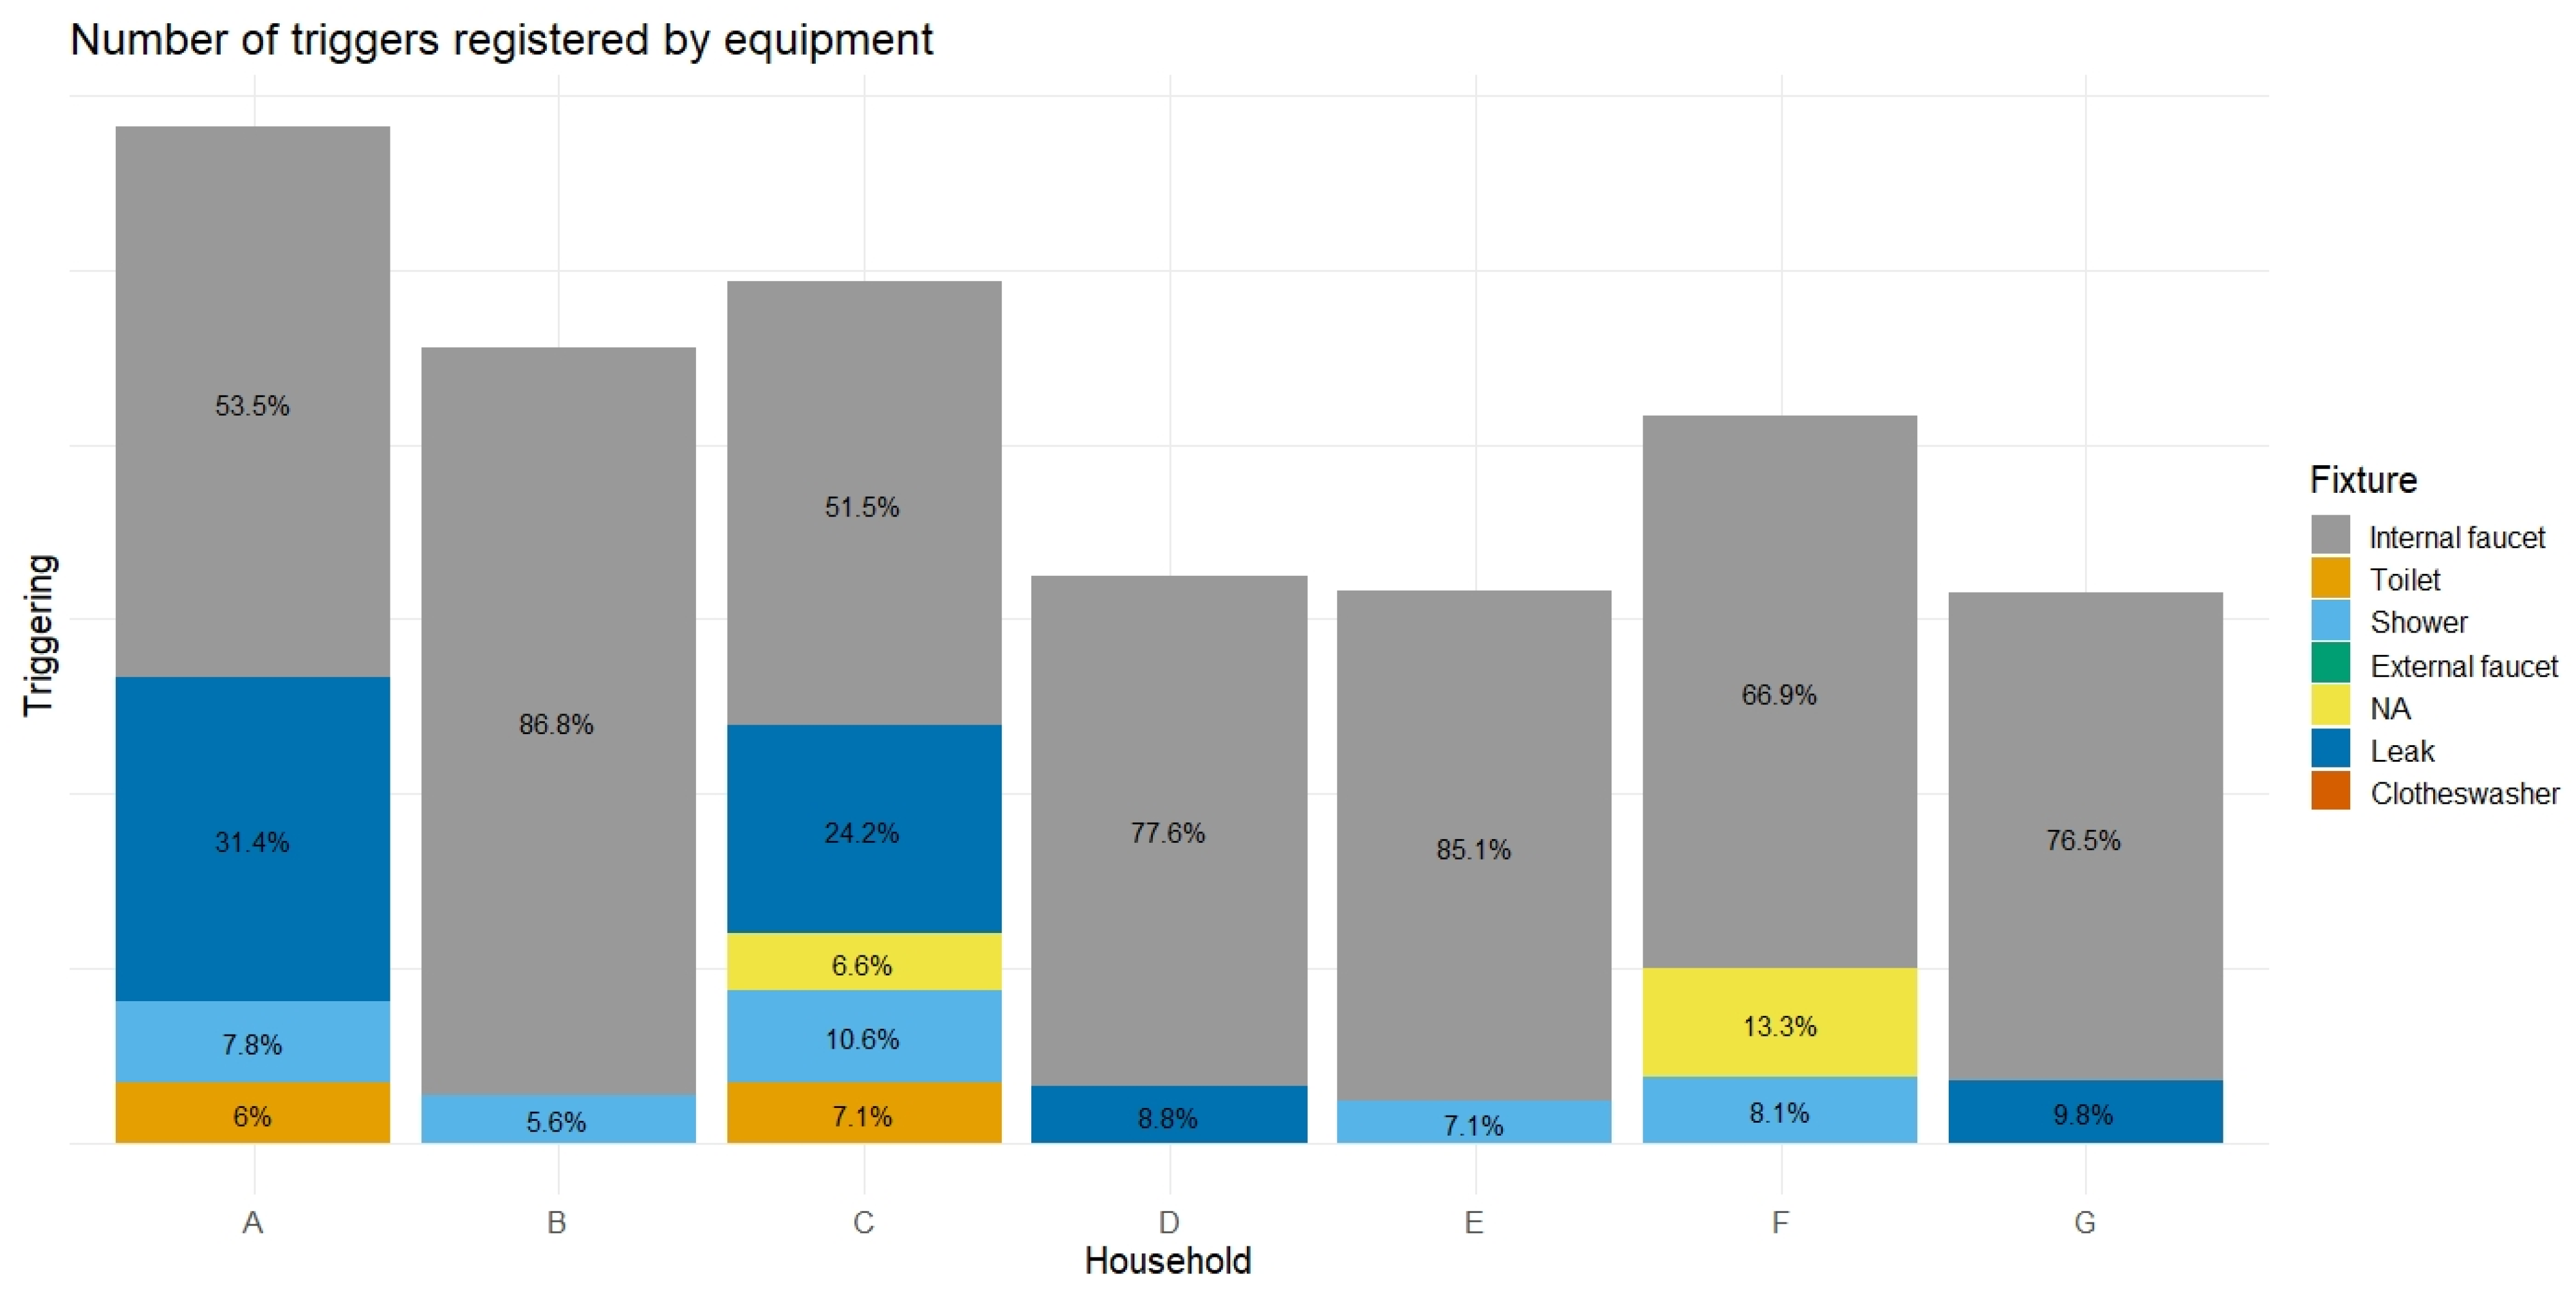
5.2. Quantitative Analysis: General Consumption of Studied Residences
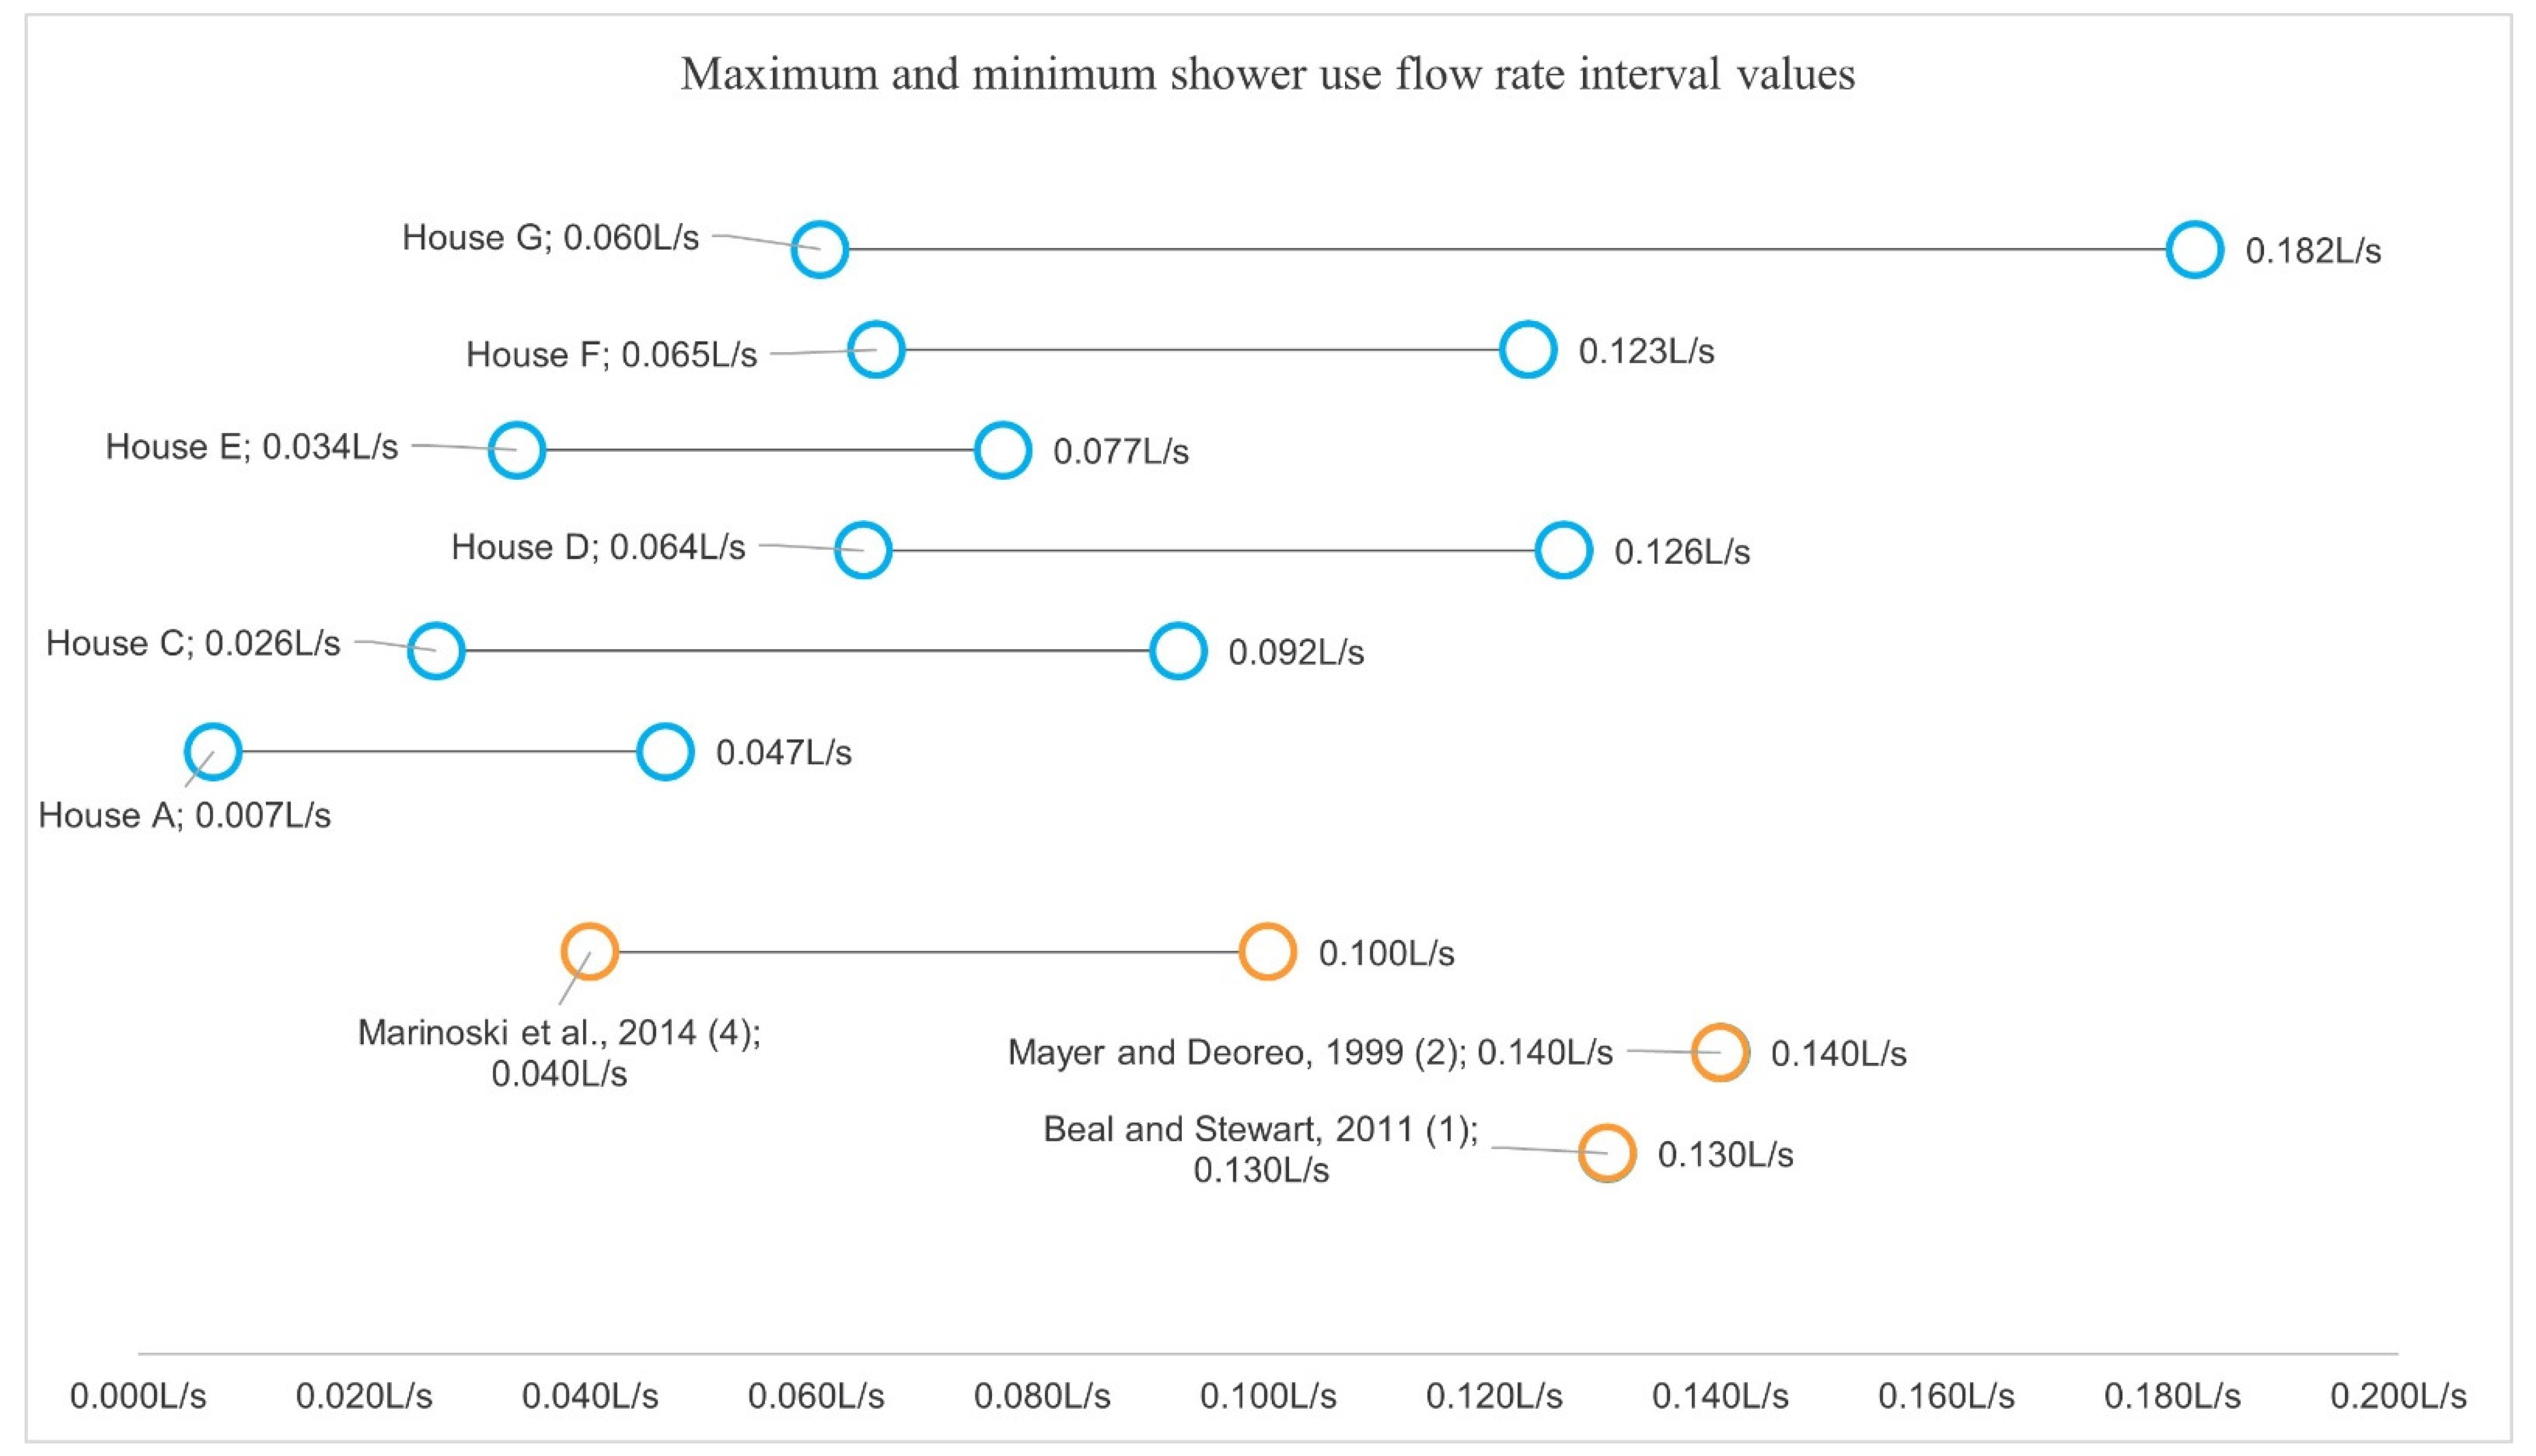
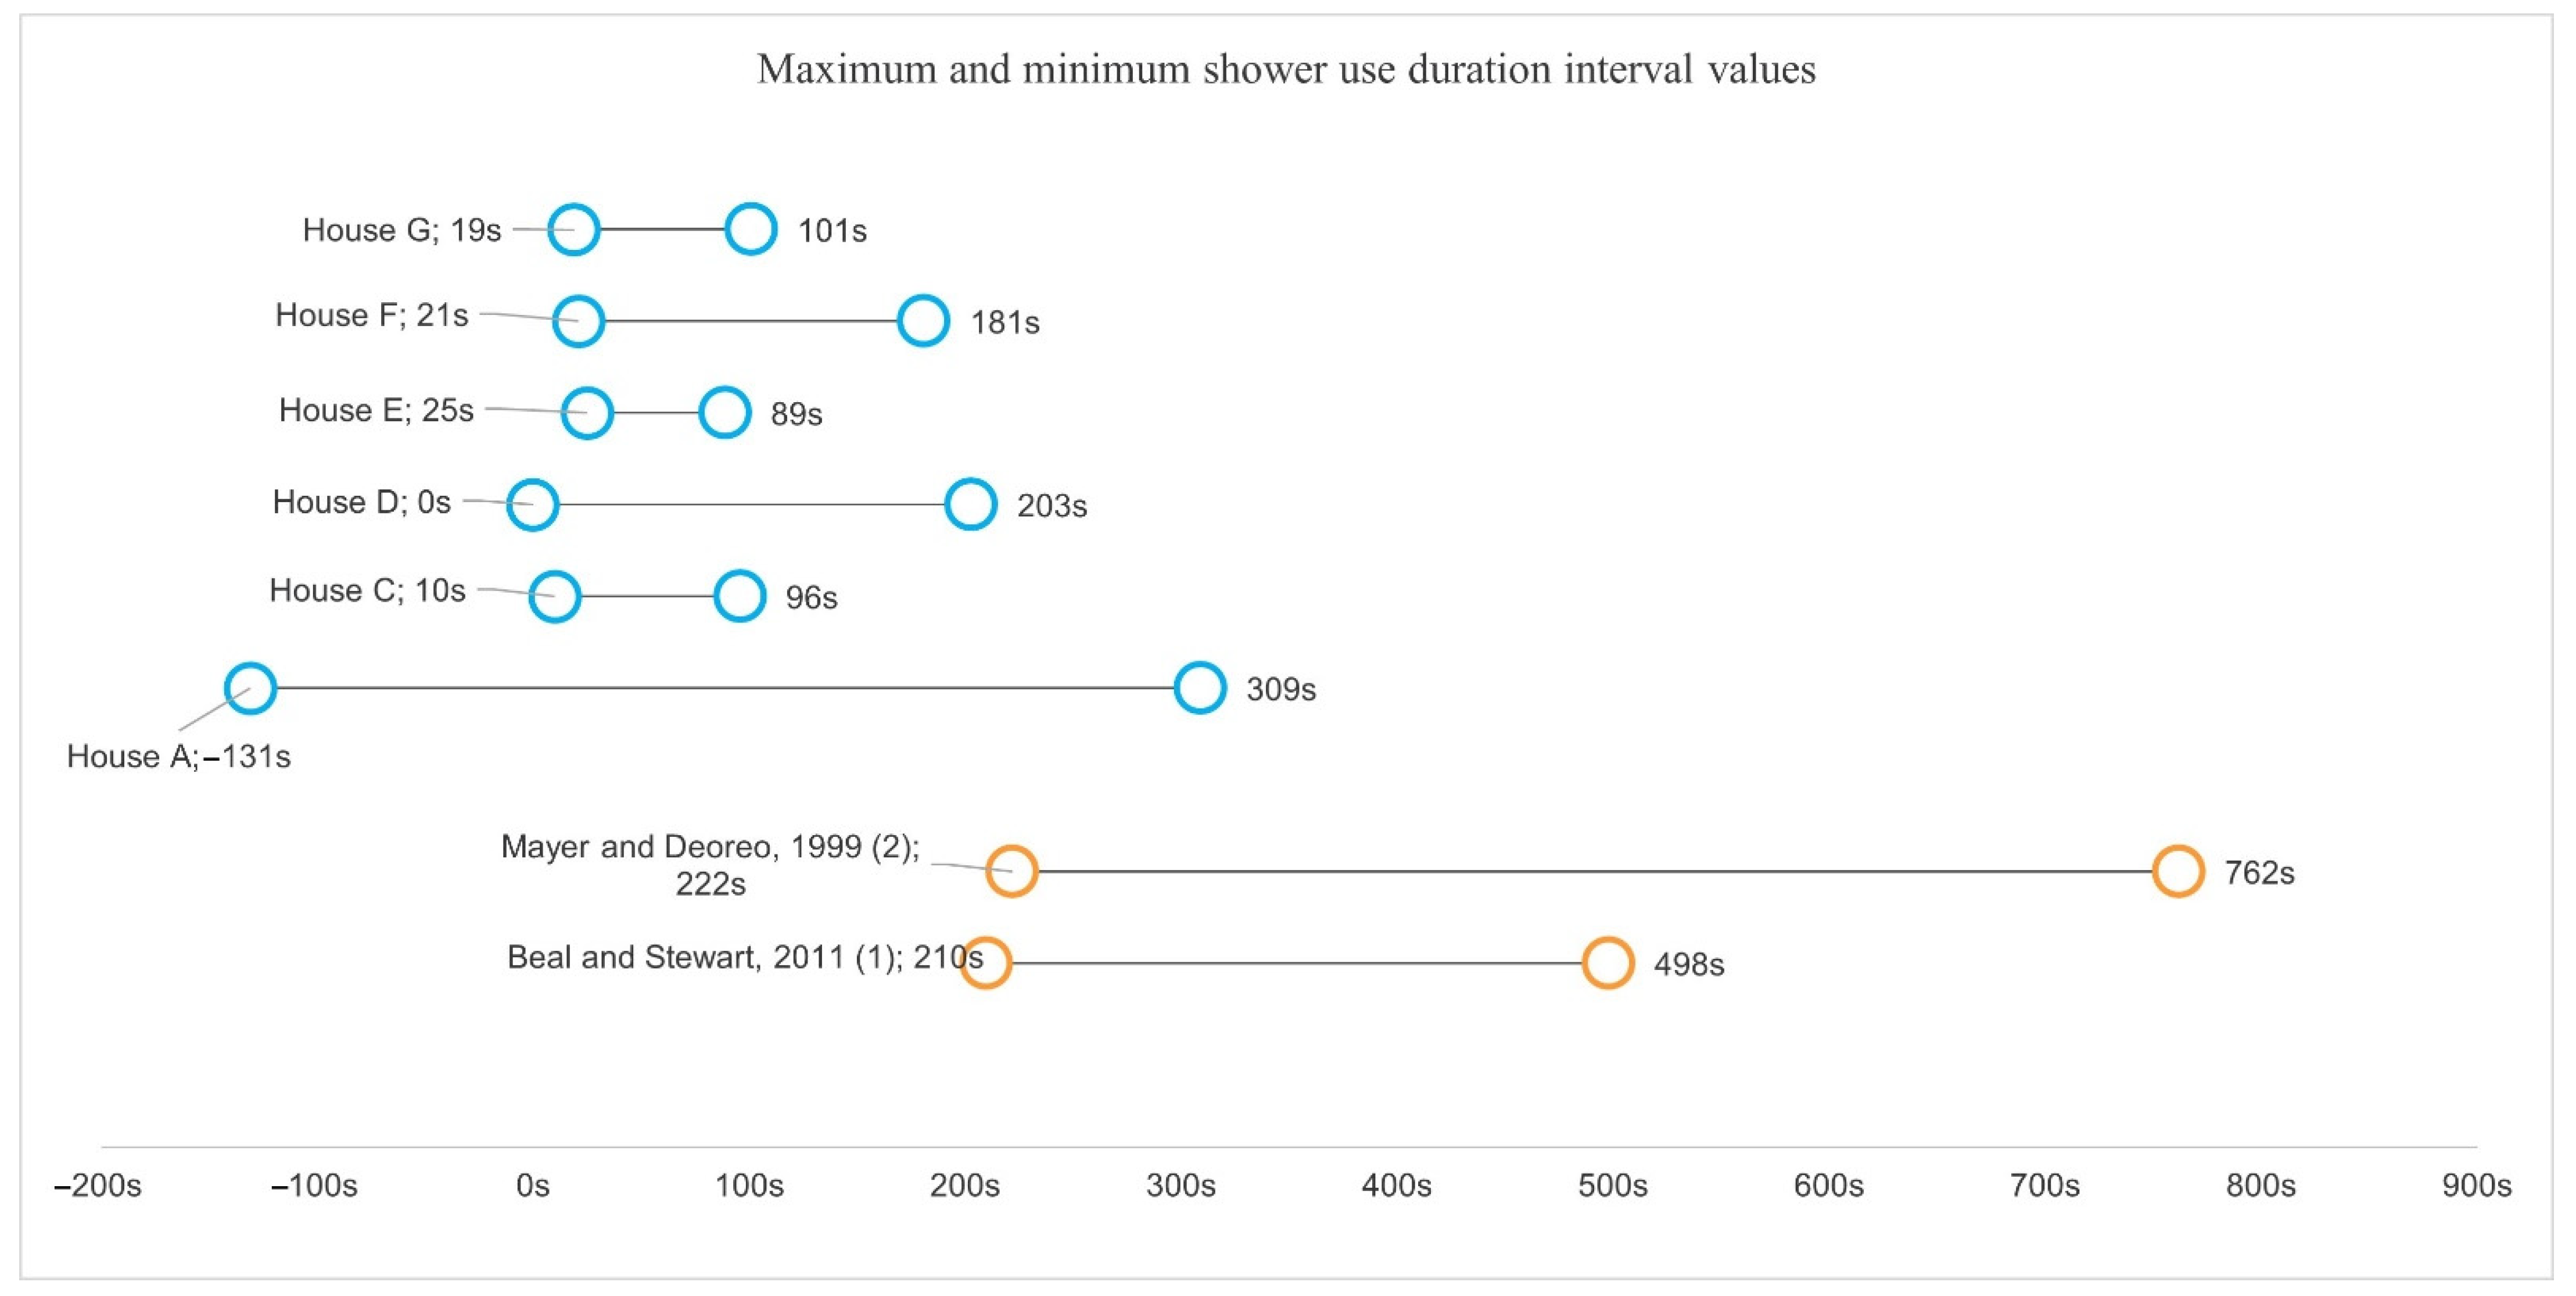
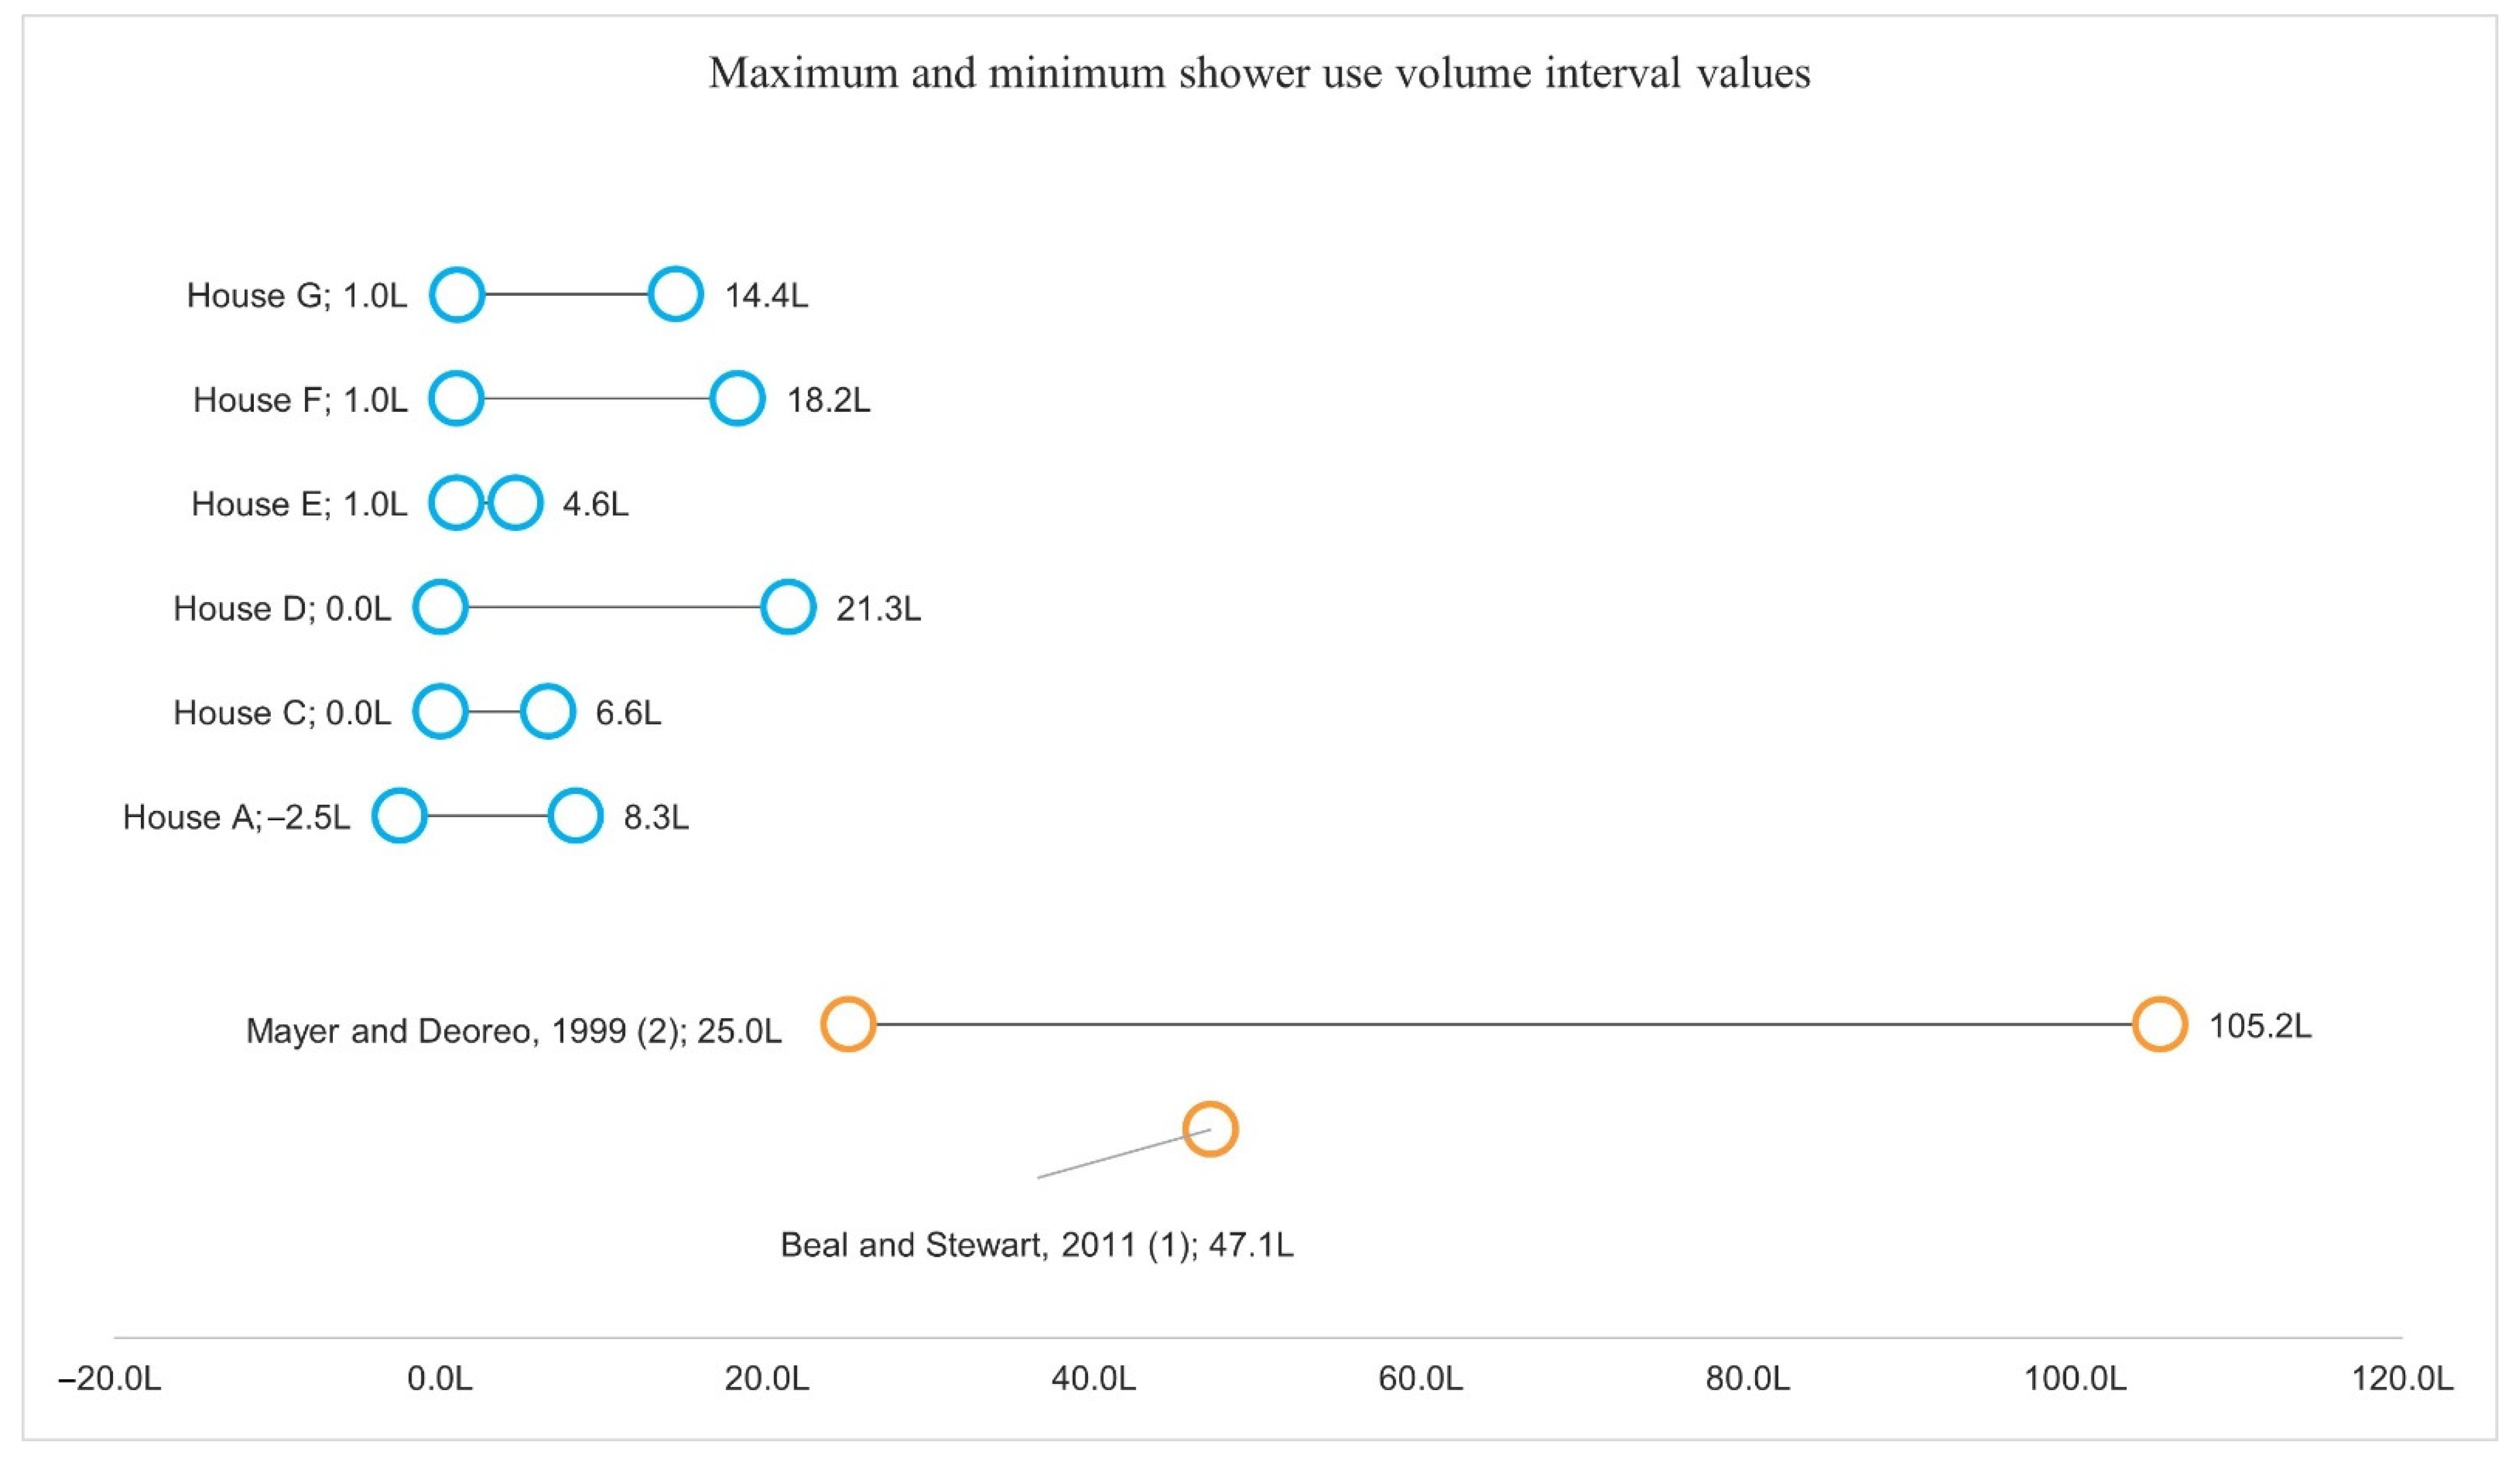
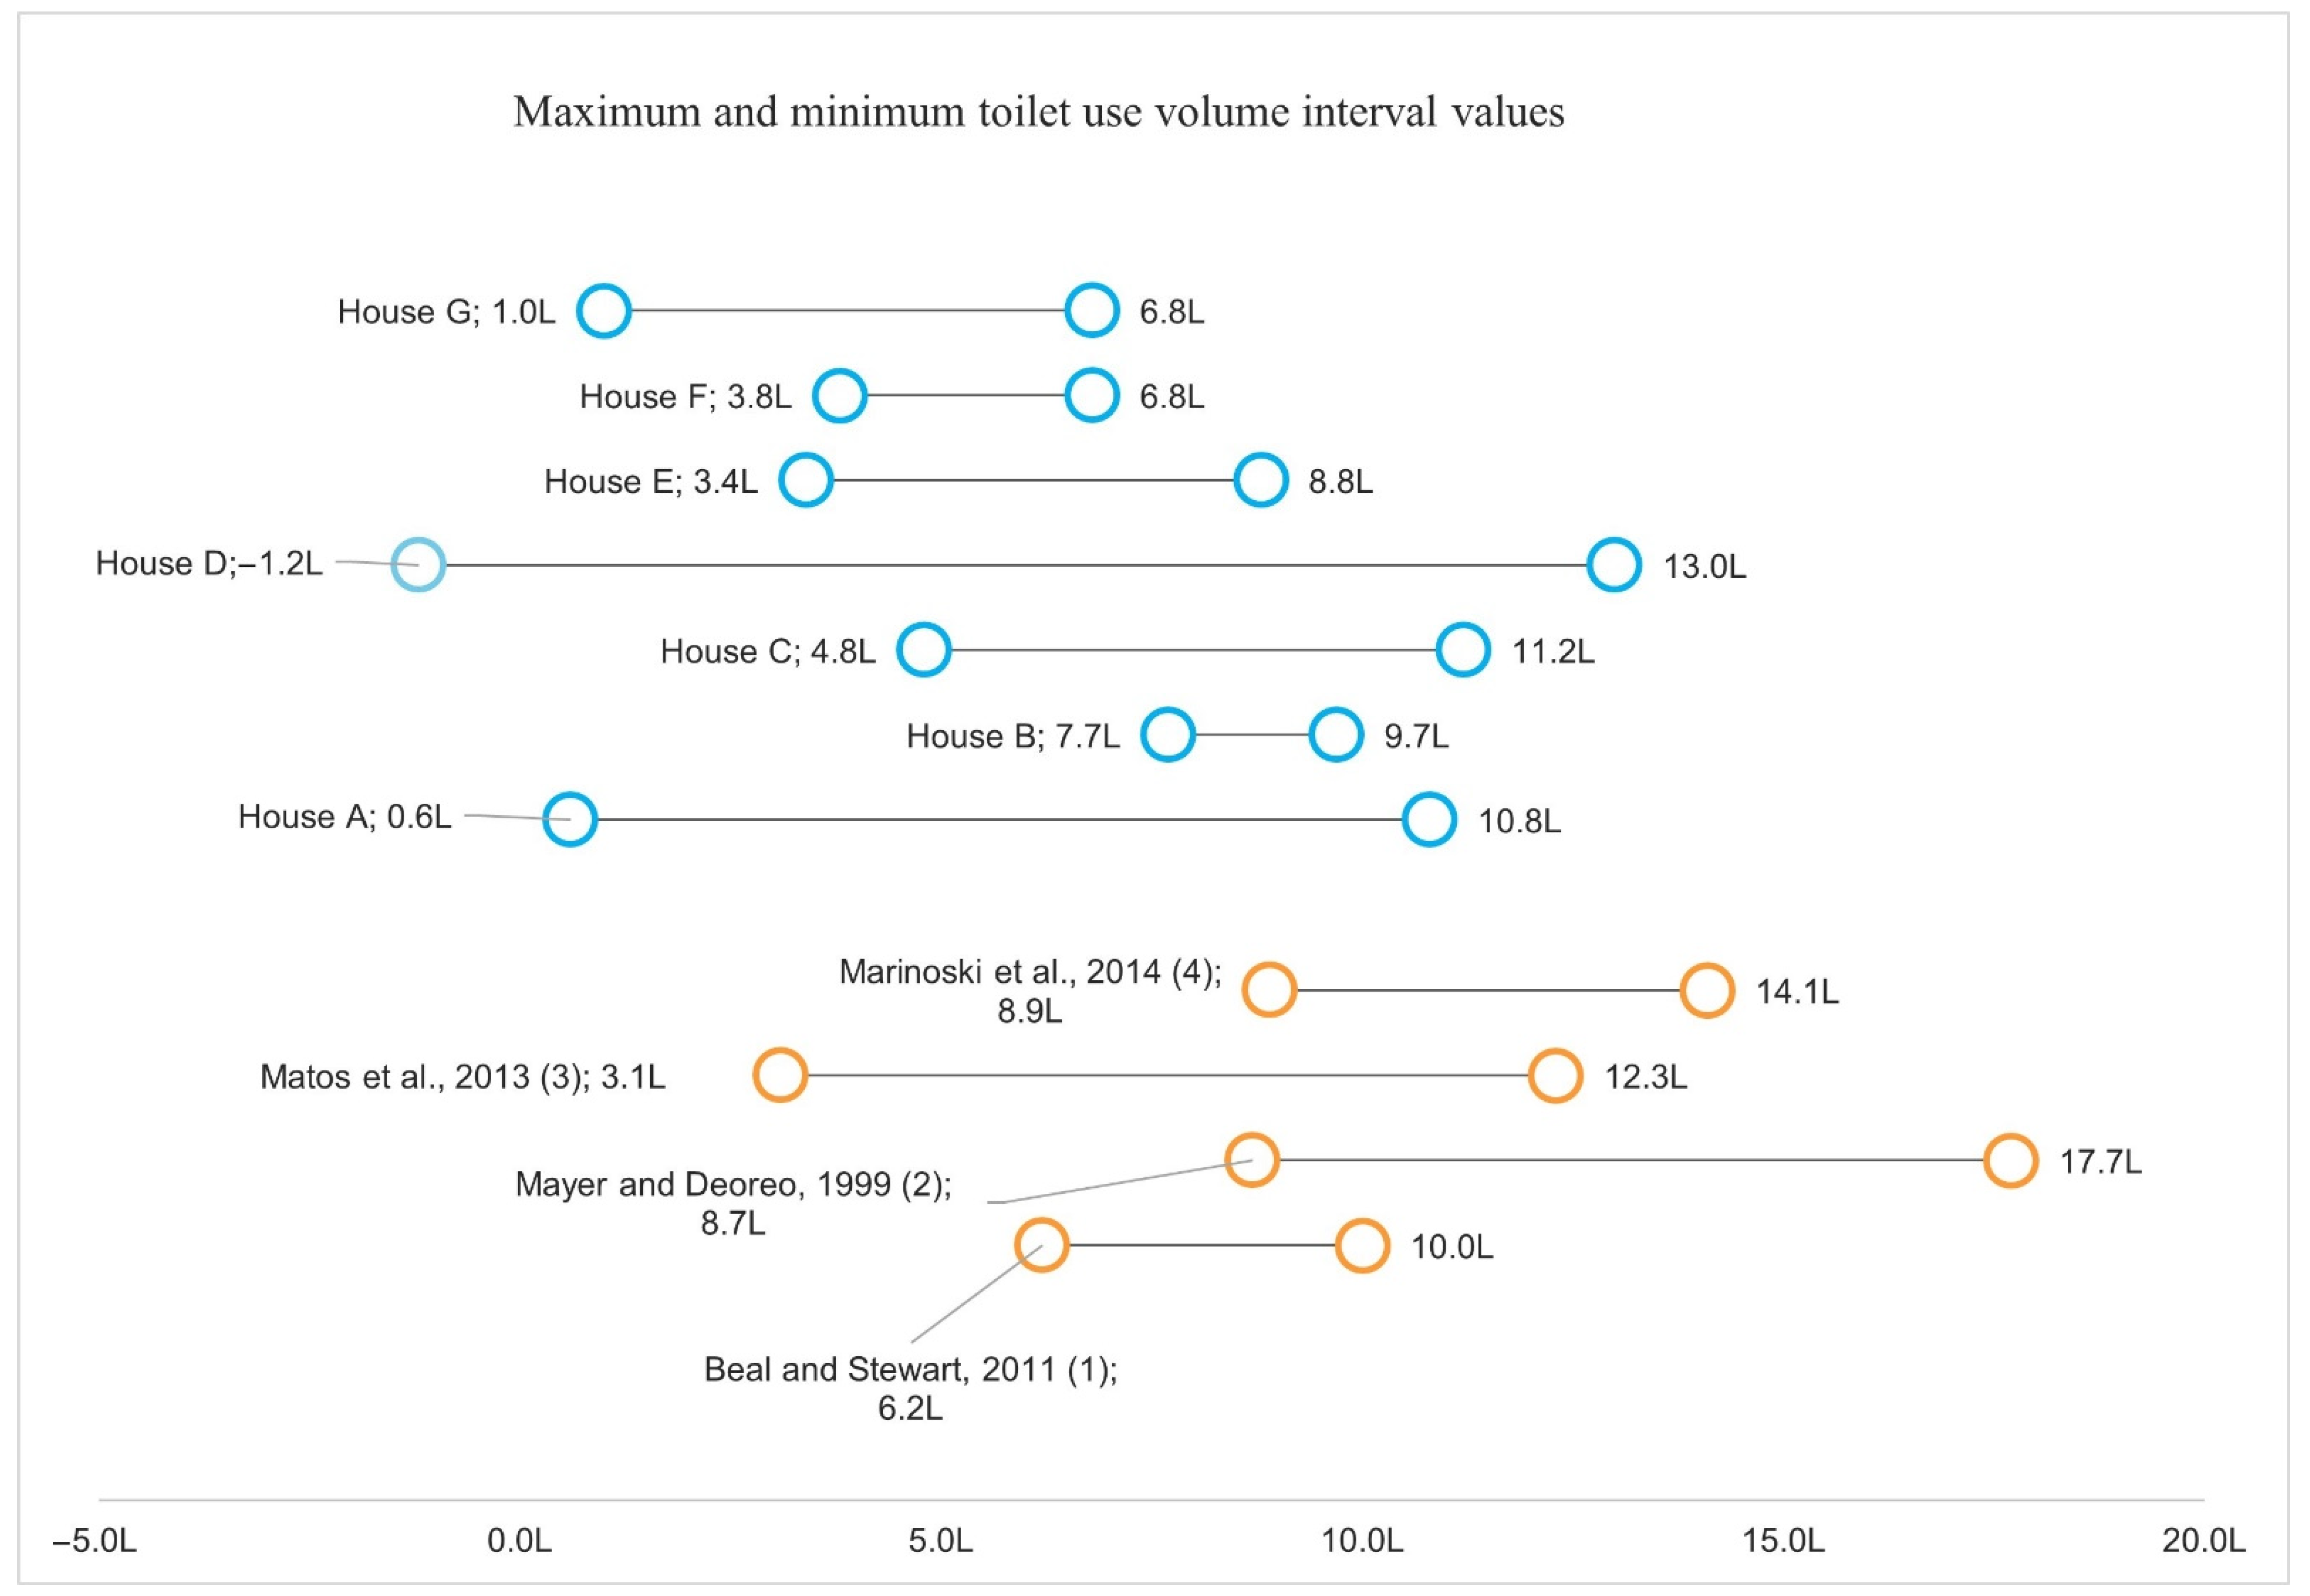
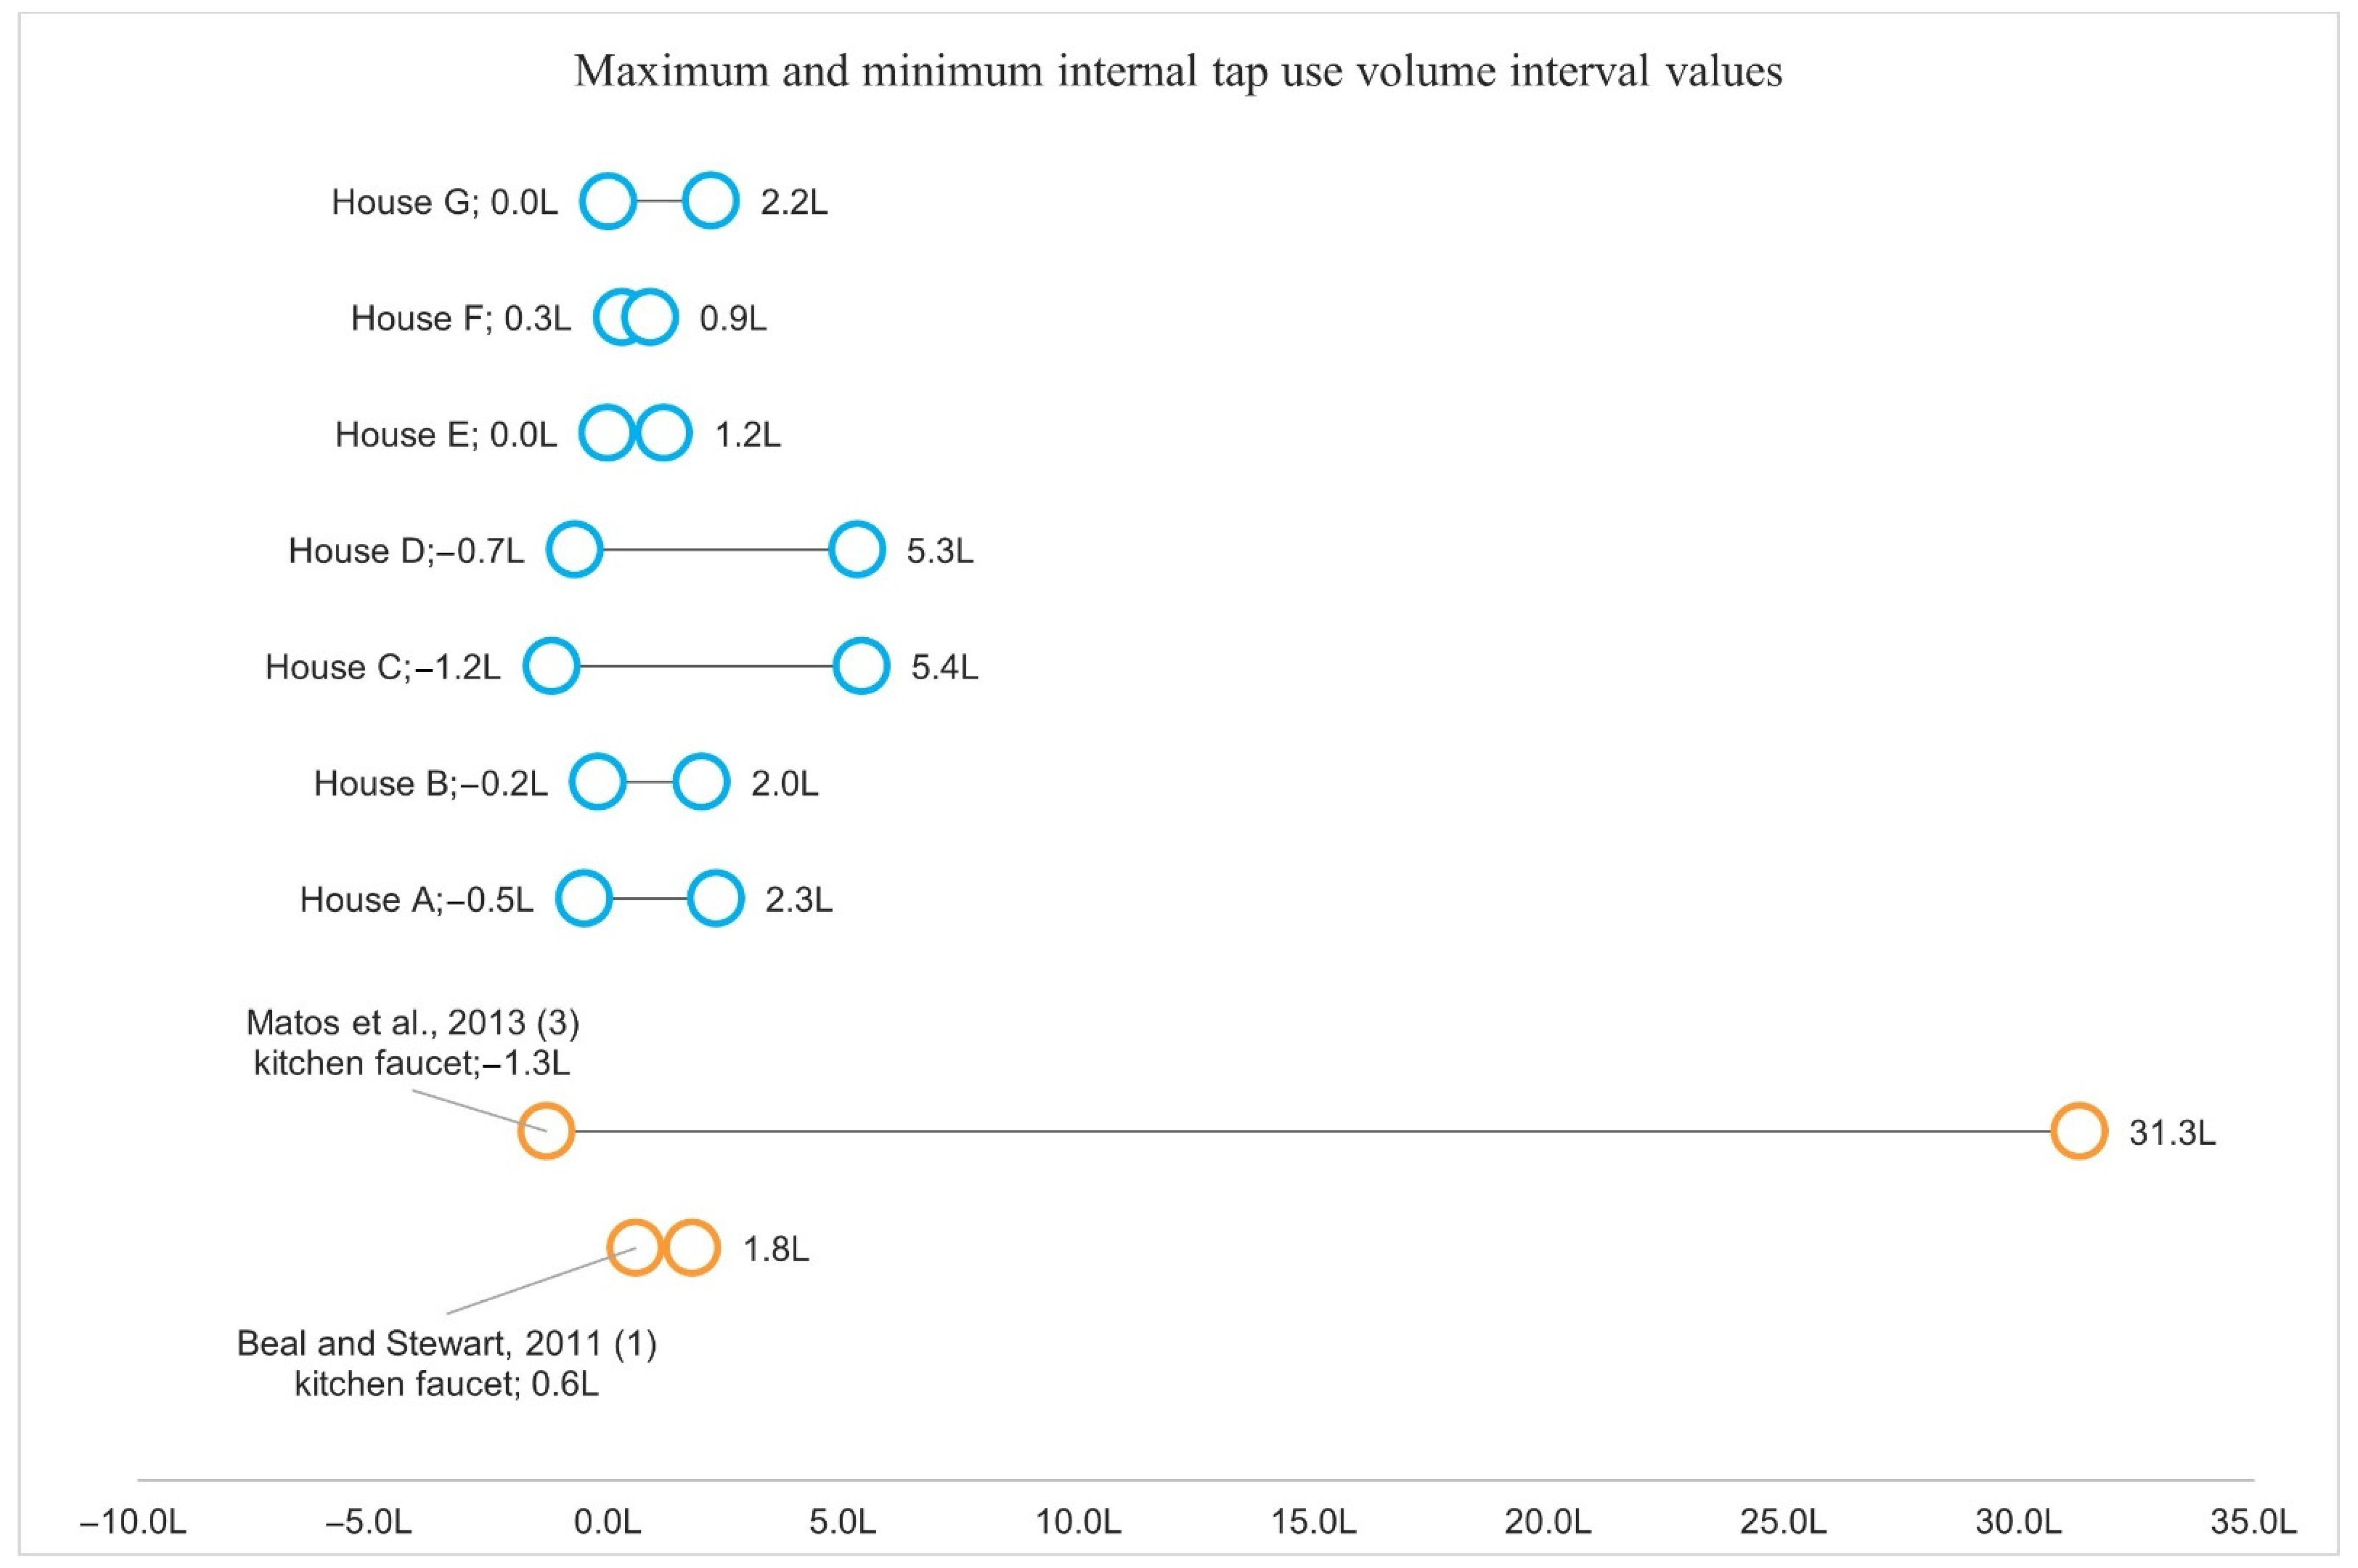
5.3. Comparison of Consumption with Reported Values
5.4. Discussion
- Possibility of relating qualitative information on micro (user behavior) and macro scales to quantitative data
- Possibility of addressing cultural and climate issues through habit evaluation
- Water use practices in households are universal, and the local peculiarities reported in a specific study can allow for the promotion of insights by people from other cultures when changing their own habits.
- Possibility of highlighting possible excessive consumption or waste
- Requires the user to answer numerous questions.
- Demands a significant amount of time to interpret the answers.
- Care must be taken when preparing the interview script and its application to avoid bias.
- Smart metering infrastructure and a team are required for data processing and model creation.
- An identification of all materials involved in the practice, both directly and indirectly (e.g., types and brands of hygiene products, brands, and shower models).
- Details of the procedure performed in practice and its frequency.
- Specifics about triggers that lead to practice (e.g., relaxation and sweat).
- Details on the times of day when the practice is carried out (and if they are linked to other daily activities, such as bathing before bed).
- Duration of stay at home for each inhabitant.
- Each family member’s activities, which may lead to increased consumption (e.g., exercise and heavy work).
- A history of diseases (some diseases imply a higher frequency of urine, for example, which increases the amount of water used in flushing).
5.5. Implementation of Policies on Water Rationing and Water Use
6. Conclusions
Author Contributions
Funding
Institutional Review Board Statement
Informed Consent Statement
Data Availability Statement
Acknowledgments
Conflicts of Interest
References
- McDonald, R.I.; Douglas, I.; Revenga, C.; Hale, R.; Grimm, N.; Grönwall, J.; Fekete, B. Global urban growth and the geography of water availability, quality, and delivery. Ambio 2011, 40, 437–446. [Google Scholar] [CrossRef] [Green Version]
- Vairavamoorthy, K.; Gorantiwar, S.D.; Pathirana, A. Managing urban water supplies in developing countries—Climate change and water scarcity scenarios. Phys. Chem. Earth Parts A/B/C 2008, 33, 330–339. [Google Scholar] [CrossRef]
- Masson-Delmotte, V.; Zhai, P.; Pirani, A.; Connors, S.L.; Péan, C.; Berger, S.; Caud, N.; Chen, Y.; Goldfarb, L.; Gomis, M.I.; et al. (Eds.) IPCC, 2021: Climate Change 2021: The Physical Science Basis. In Contribution of Working Group I to the Sixth Assessment Report of the Intergovernmental Panel on Climate Change; Cambridge University Press: Cambridge, UK, 2022; in press. [Google Scholar]
- Perez, L.P.; Rodrigues-Filho, S.; Marengo, J.A.; Santos, D.V.; Mikosz, L. Climate change and disasters: Analysis of the Brazilian regional inequality. Sustain. Debate 2020, 11, 260–296. [Google Scholar] [CrossRef]
- Hardwig, J. Ownership, possession, and consumption: On the limits of rational consumption. J. Soc. Philos. 2015, 46, 281–296. [Google Scholar] [CrossRef]
- Maslow, A.H. A theory of human motivation. Psychol. Rev. 1943, 50, 370–396. [Google Scholar] [CrossRef] [Green Version]
- IBGE. Brazilian Institute of Geography and Statistics Censo Demográfico (Demographic Census). 2010. Available online: http://www.ibge.gov.br (accessed on 2 December 2021).
- IBGE. Brazilian Institute of Geography and Statistics Pesquisa Nacional por Amostra de Domicílios Contínua—PNAD Contínua. (Brazilian National Household Sample Survey). 2021. Available online: https://www.ibge.gov.br/ (accessed on 2 December 2021).
- Liu, W.; Oosterveer, P.; Spaargaren, G. Promoting sustainable consumption in China: A conceptual framework and research review. J. Clean. Prod. 2016, 134, 13–21. [Google Scholar] [CrossRef]
- Davoudi, S.; Dilley, L.; Crawford, J. Energy consumption behaviour: Rational or habitual? disP-Plan. Rev. 2014, 50, 11–19. [Google Scholar] [CrossRef] [Green Version]
- Sörqvist, P.; Langeborg, L. Why people harm the environment although they try to treat it well: An evolutionary-cognitive perspective on climate compensation. Front. Psychol. 2019, 10. [Google Scholar] [CrossRef]
- Katz, D. Undermining demand management with supply management: Moral hazard in Israeli water policies. Water 2016, 8, 159. [Google Scholar] [CrossRef] [Green Version]
- Alfawzan, Z.; Gasim, A.A. An empirical analysis of the welfare implications of the direct rebound effect. Energy Effic. 2019, 12, 1987–2010. [Google Scholar] [CrossRef] [Green Version]
- Hardin, G. The tragedy of the commons. Science 1968, 162, 1243–1248. [Google Scholar] [CrossRef] [Green Version]
- Corral-Verdugo, V.; Frías-Armenta, M.; Pérez-Urias, F.; Orduña-Cabrera, V.; Espinoza-Gallego, N. Residential water consumption, motivation for conserving water and the continuing tragedy of the commons. Environ. Manag. 2002, 30, 527–535. [Google Scholar] [CrossRef]
- Steg, L. Values, norms, and intrinsic motivation to act proenvironmentally. Annu. Rev. Environ. Resour. 2016, 41, 277–292. [Google Scholar] [CrossRef]
- Ajzen, I.; Cote, N.G. Attitudes and The Prediction of Behavior. In Attitudes and Attitude Change; Cran, W.D., Ed.; Psychology Press: New York, NY, USA, 2008; pp. 289–311. [Google Scholar]
- Diekmann, A.; Preisendörfer, P. Green and greenback: The behavioral effects of environmental attitudes in low-cost and high-cost situations. Ration. Soc. 2003, 15, 441–472. [Google Scholar] [CrossRef]
- Stancu, C.M.; Grønhøj, A.; Lähteenmäki, L. Meanings and motives for consumers’ sustainable actions in the food and clothing domains. Sustainability 2020, 12, 10400. [Google Scholar] [CrossRef]
- Willis, R.M.; Stewart, R.A.; Panuwatwanich, K.; Jones, S.; Kyriakides, A. Alarming visual display monitors affecting shower end use water and energy conservation in Australian residential households. Resour. Conserv. Recycl. 2010, 54, 1117–1127. [Google Scholar] [CrossRef] [Green Version]
- Stewart, R.A.; Willis, R.M.; Panuwatwanich, K.; Sahin, O. Showering behavioural response to alarming visual display monitors: Longitudinal mixed method study. Behav. Inf. Technol. 2011, 32, 1–17. [Google Scholar] [CrossRef]
- Mylan, J. Understanding the diffusion of Sustainable Product-Service Systems: Insights from the sociology of consumption and practice theory. J. Clean. Prod. 2015, 97, 13–20. [Google Scholar] [CrossRef]
- Watson, M. How theories of practice can inform transition to a decarbonised transport system. J. Transp. Geogr. 2012, 24, 488–496. [Google Scholar] [CrossRef] [Green Version]
- Shove, E.; Pantzar, M.; Watson, M. The Dynamics of Social Practice Everyday Life and How It Changes; SAGE: London, UK, 2012; ISBN 978-0-85702-042-0. [Google Scholar]
- Stirk, N. Wittgenstein and social practices. Environ. Plan. D Soc. Space 1999, 17, 35–50. [Google Scholar] [CrossRef] [Green Version]
- Silva, S.F.; Britto, V.; Azevedo, C.; Kiperstok, A. Rational consumption of water in administrative public buildings: The experience of the Bahia administrative center, Brazil. Water 2014, 6, 2552–2574. [Google Scholar] [CrossRef] [Green Version]
- Marinho, M.; Gonçalves, M.D.S.; Kiperstok, A. Water conservation as a tool to support sustainable practices in a Brazilian public university. J. Clean. Prod. 2014, 62, 98–106. [Google Scholar] [CrossRef]
- Kiperstok, A.; Kiperstok, A.C. Technology improvements or influencing user behaviour for water savings in administrative and university buildings: Which one should come first? In Frontiers in Civil Engineering; Ghisi, E., Ed.; Bentham Science Publishers: Sharjah, United Arab Emirates, 2017; Volume 2, pp. 153–202. ISBN 9781681084831. [Google Scholar]
- Rahim, M.S.; Nguyen, K.A.; Stewart, R.A.; Giurco, D.; Blumenstein, M. Machine learning and data analytic techniques in digitalwater metering: A review. Water 2020, 12, 294. [Google Scholar] [CrossRef] [Green Version]
- Liu, A.; Giurco, D.; Mukheibir, P. Urban water conservation through customised water and end-use information. J. Clean. Prod. 2016, 112, 3164–3175. [Google Scholar] [CrossRef]
- Gleick, P.H. Basic water requirements for human activities: Meeting basic needs. Water Int. 1996, 21, 83–92. [Google Scholar] [CrossRef]
- Inocencio, A.; Padilla, J.; Javier, E. Determination of Basic Household Water Requirements (Revised). Philippines 1999, 99–102, 1–59. [Google Scholar]
- Beal, C.D.; Stewart, R.A. South East Queensland Residential End Use Study: Final Report; Urban Water Security Research Alliance: City East, QLD, Australia, 2011. [Google Scholar]
- Mayer, P.W.; DeOreo, W.B. Residential End Uses of Water, 1st ed.; AWWA Research Foundation: Denver, CO, USA, 1999; ISBN 1583210164. [Google Scholar]
- Matos, C.; Teixeira, C.A.; Duarte, A.A.L.S.; Bentes, I. Domestic water uses: Characterization of daily cycles in the north region of Portugal. Sci. Total Environ. 2013, 460, 444–450. [Google Scholar] [CrossRef] [PubMed]
- Marinoski, A.; Vieira, A.; Silva, A.; Ghisi, E. Water end-uses in low-income houses in southern Brazil. Water 2014, 6, 1985–1999. [Google Scholar] [CrossRef] [Green Version]
- Santos, E.; de Pinho, J.A.G.; Moraes, L.R.S.; Fischer, T. O Caminho das Águas em Salvador: Bacias Hidrográficas, Bairros e Fontes (Salvador’s Waterways: Hydrographic Basins, Rivers, and Fountains); CIAGS/UFBA; SEMA: Salvador, Brazil, 2010; ISBN 978-85-60660-08-7. [Google Scholar]
- OECD. Water Governance in Cities. In OECD Studies on Water; OECD: Paris, France, 2016; ISBN 9789264251083. [Google Scholar]
- Genz, F.; Tanajura, C.A.S. Projeções do clima para a região metropolitana de Salvador no período de 2011 a 2040—Cenário A1B (Climate projections for the metropolitan region of Salvador in the period 2011 to 2040—Scenario A1B). In Proceedings of the II Congresso Baiano de Engenharia Sanitária e Ambiental, Feira de Santana, Brazil, 8–13 July 2012. [Google Scholar]
- Chou, S.C.; Marengo, J.; Lyra, A.; Sueiro, G.; Pesquero, J.F.; Alves, L.M.; Kay, G.; Betts, R.; Chagas, D.J.; Gomes, J.L.; et al. Downscaling of South America present climate driven by 4-member HadCM3 runs. Clim. Dyn. 2011, 38, 635–653. [Google Scholar] [CrossRef]
- Heikkila, E.J. Environmentalism with Chinese characteristics? Urban river revitalization in Foshan. Plan. Theory Pract. 2011, 12, 33–55. [Google Scholar] [CrossRef]
- Mutikanga, H.E.; Sharma, S.; Vairavamoorthy, K. Water loss management in developing countries: Challenges and prospects. J. Am. Water Work. Assoc. 2009, 101, 57–68. [Google Scholar] [CrossRef]
- Vairavamoorthy, K.; Mansoor, M.A.M. Demand management in developing countries. In Water Demand Management; Buttler, D., Memon, F.A., Eds.; IWA Publishing: London, UK; Seattle, WA, USA, 2006; pp. 180–214. ISBN 1843390787. [Google Scholar]
- SNIS—National Sanitation Information System Diagnóstico dos Serviços de Água e Esgoto (Diagnosis of Water and Sewage Services). 2019. Available online: http://www.snis.gov.br/ (accessed on 2 December 2021).
- Kiperstok, A.; Garcia, A. Mudanças climáticas e o abastecimento de água: Uma reflexão sobre o papel da gestão da demanda na Bahia (Climate change and water supply: A reflection on the role of demand management in Bahia). Bahia Análise Dados 2011, 21, 465–480. [Google Scholar]
- Cominola, A.; Giuliani, M.; Piga, D.; Castelletti, A.; Rizzoli, A.E. Benefits and challenges of using smart meters for advancing residential water demand modeling and management: A review. Environ. Model. Softw. 2015, 72, 198–214. [Google Scholar] [CrossRef] [Green Version]
- Oliveira-Esquerre, K.; Mello, M.; Botelho, G.; Deng, Z.; Koushanfar, F.; Kiperstok, A. Water end-use consumption in low-income households: Evaluation of the impact of preprocessing on the construction of a classification model. Expert Syst. Appl. 2021, 185, 115623. [Google Scholar] [CrossRef]
- Nguyen, K.; Stewart, R.; Zhang, H.; Giurco, D.; Blumenstein, M.; Rahim, S. Next generation machine learning for urban water management. Water e-J. 2020, 5, 1–7. [Google Scholar] [CrossRef]
- Lüdtke, D.U.; Luetkemeier, R.; Schneemann, M.; Liehr, S. Increase in daily household water demand during the first wave of the COVID-19 pandemic in germany. Water 2021, 13, 260. [Google Scholar] [CrossRef]
- Balacco, G.; Totaro, V.; Iacobellis, V.; Manni, A.; Spagnoletta, M.; Piccinni, A.F. Influence of COVID-19 spread on water drinking demand: The case of Puglia region (southern Italy). Sustainability 2020, 12, 5919. [Google Scholar] [CrossRef]
- Hasan, H.H.; Razali, S.F.M.; Razali, N.H.M. Does the household Save water? evidence from behavioral analysis. Sustainability 2021, 13, 641. [Google Scholar] [CrossRef]
- World Health Organization (WHO). How much water is needed in emergencies. Tech. Notes Drink. Sanit. Hyg. Emergencies 2013, 9, 1–4. [Google Scholar]
- Cominola, A.; Nguyen, K.; Giuliani, M.; Stewart, R.A.; Maier, H.R.; Castelletti, A. Data mining to uncover heterogeneous water use behaviors from smart meter data. Water Resour. Res. 2019, 55, 9315–9333. [Google Scholar] [CrossRef] [Green Version]


| Household | Hydrometer Brand | Factor | Nominal Flow of Hydrometer | Datalogger Brand and Model Datalogger Model |
|---|---|---|---|---|
| A, B, C e E | LAO® | K = 0.1 L/pulse | 1.5 m3/h | NOVUS®—FieldLogger |
| D, F, e G | LAO® | K = 0.1 L/pulse | 1.5 m3/h | NOVUS®—LogBox-DA-64k IP65 |
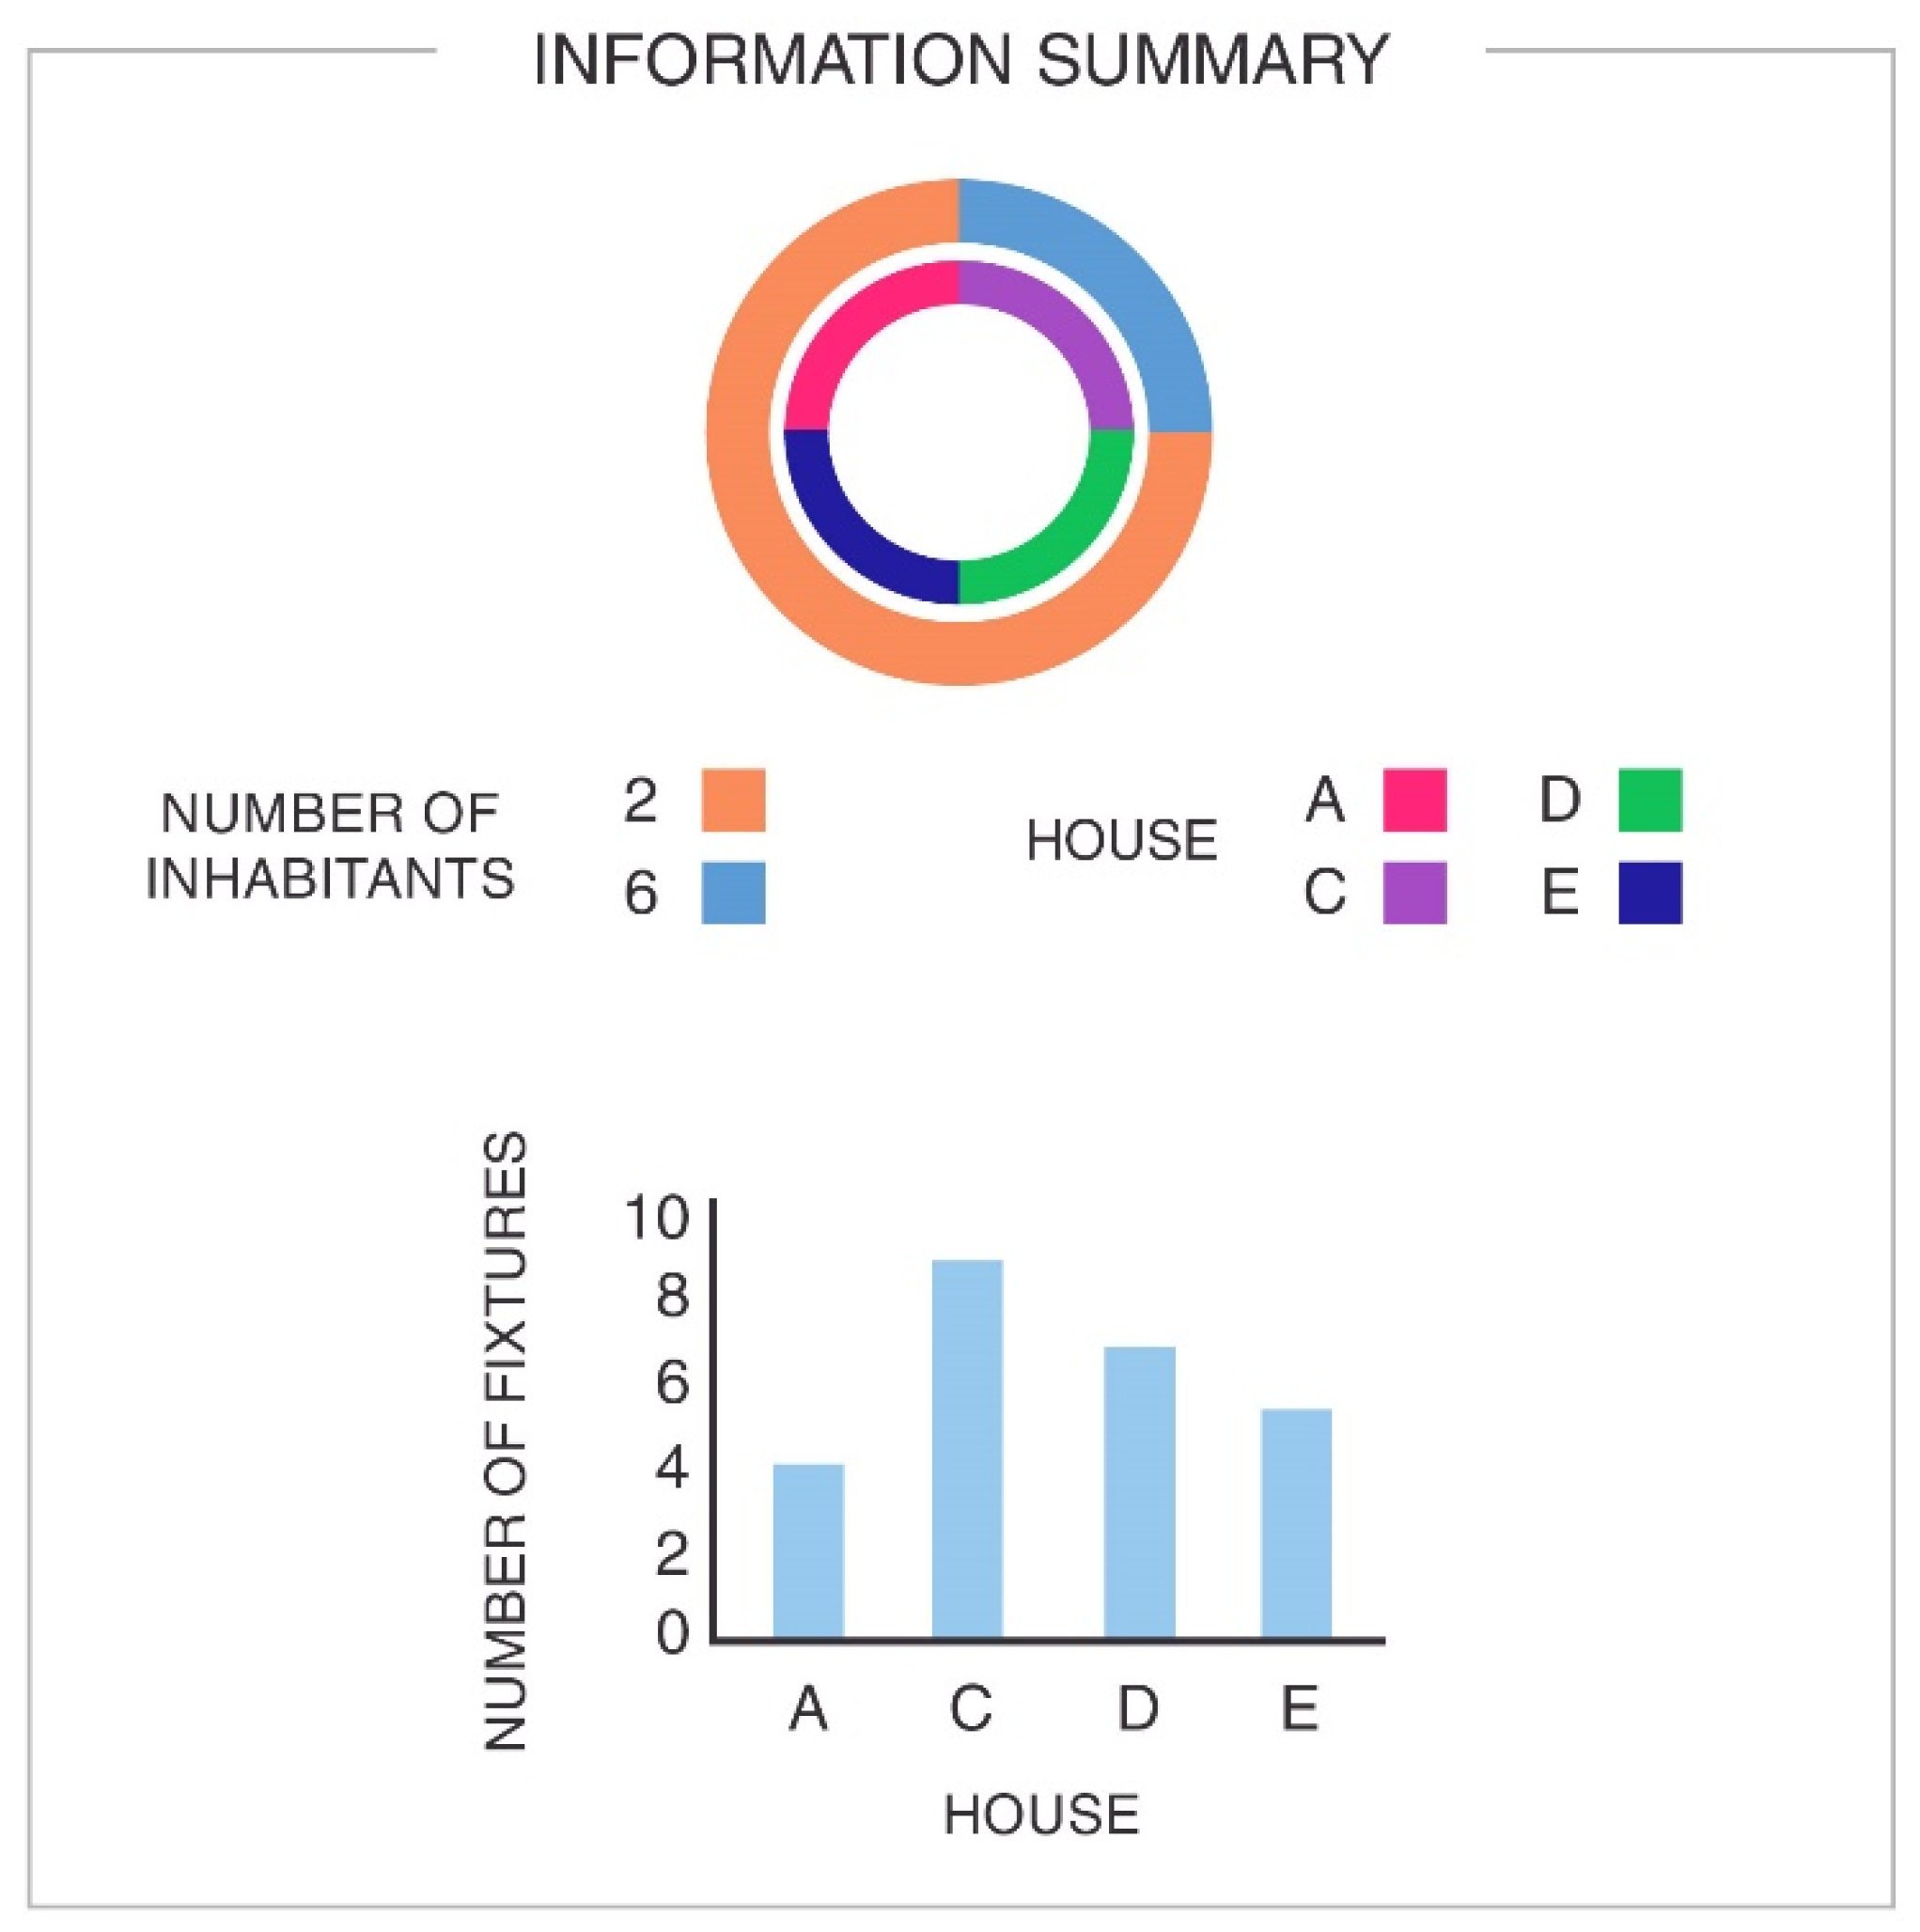
| House | Number of Inhabitants | Number of Fixtures | Number of Monitored Days | Number of Days in Investigative Week | Overdue Water Bills | Water Meter Situation |
|---|---|---|---|---|---|---|
| A | 2 | 4 | 328 | 8 | Yes | N |
| B | 2 | 5 | 412 | 9 | Yes | R |
| C | 6 | 9 | 244 | 5 | No | I |
| D | 2 | 7 | 230 | 8 | No | I |
| E | 2 | 5 | 316 | 9 | No | N |
| F | 3 | 4 | 355 | 14 | No | N |
| G | 2 | 6 | 257 | 11 | No | I |
| Reference | [33] | [34] | [36] | [35] |
| Local | South East Queensland (SEQ) Australia | 12 study sites across the United States and Canada | Florianópolis (SC)—Brazil | North region of Portugal |
| Sample size | 252 residences | 1188 residences | 48 residences | 52 dwellings |
| Description | High income | High income | Low income | High income |
Publisher’s Note: MDPI stays neutral with regard to jurisdictional claims in published maps and institutional affiliations. |
© 2021 by the authors. Licensee MDPI, Basel, Switzerland. This article is an open access article distributed under the terms and conditions of the Creative Commons Attribution (CC BY) license (https://creativecommons.org/licenses/by/4.0/).
Share and Cite
Botelho, G.; Mello, M.; Kiperstok, A.; Oliveira-Esquerre, K. A Framework for Archive Demand Management Strategies: A Pilot Study on Water Use in a Low-Income Brazilian Area. Sustainability 2022, 14, 406. https://doi.org/10.3390/su14010406
Botelho G, Mello M, Kiperstok A, Oliveira-Esquerre K. A Framework for Archive Demand Management Strategies: A Pilot Study on Water Use in a Low-Income Brazilian Area. Sustainability. 2022; 14(1):406. https://doi.org/10.3390/su14010406
Chicago/Turabian StyleBotelho, Gabriella, Mariza Mello, Asher Kiperstok, and Karla Oliveira-Esquerre. 2022. "A Framework for Archive Demand Management Strategies: A Pilot Study on Water Use in a Low-Income Brazilian Area" Sustainability 14, no. 1: 406. https://doi.org/10.3390/su14010406