Article

Optimization of Grouting Material Mixture Ratio Based on Multi-Objective Optimization and Multi-Attribute Decision-Making

1
School of Mines, China University of Mining & Technology, Xuzhou 221116, China
2
Key Laboratory of Deep Coal Resource Mining, China University of Mining & Technology, Ministry of Education of China, Xuzhou 221116, China
*
Authors to whom correspondence should be addressed.
These authors contributed equally to this work.
Sustainability 2022, 14(1), 399; https://doi.org/10.3390/su14010399
Submission received: 24 November 2021 / Revised: 25 December 2021 / Accepted: 27 December 2021 / Published: 31 December 2021

Abstract

:
As a solid waste produced by coal combustion, fly ash will cause serious environmental pollution. However, it can be considered as a sustainable and renewable resource to replace partial cement in grouting materials. Fly ash grouting materials re-cement the broken rock mass and improve the mechanical properties of the original structure. It can reinforce the broken surrounding rock of mine roadway. The utilization of fly ash also reduces environmental pollution. Therefore, this paper establishes a new material mixture ratio optimization model to meet the requirement of material property through combining the methods of experimental design and numerical analysis. Based on the Box–Behnken design with 3 factors and 3 levels, a mathematical model is constructed to fit the nonlinear multiple regression functions between material properties and raw materials ratios. The influence of raw materials is analyzed on material properties (the material’s 7-day uniaxial compressive strength, initial setting time, and slurry viscosity). Then, 80 Pareto solutions are obtained through NASG-II algorithm which takes the regression functions as the objective functions for multi-objective optimization of the grouting material ratio. Finally, the best ratio solution of water-cement ratio—0.71, silica fume content—1.73%, and sodium silicate content—2.61% is obtained through the NNRP-TOPSIS method.

1. Introduction

Coal is the major fossil fuel in the planet Earth. It plays a significant role in the energy structure of the world. However, the massive exploitation and utilization of coal has caused severe environmental pollution. Coal combustion generates several harmful byproducts and has become a global issue. As a solid waste produced by coal combustion, the accumulation of fly ash not only occupies land, but also causes serious pollution to the surrounding environment such as water sources, the atmosphere, and soil [1]. This problem has attracted many scholars to study the sustainable management and efficient use of fly ash. It is helpful to achieve the twelfth target of Sustainable Development Goals proposed by United Nations, which is to “ensure sustainable consumption and production patterns” committed to reducing substantially waste generation through prevention, reduction, and recycling by 2030 [2]. At present, fly ash has been widely studied and applied in road construction [3], engineering backfilling [4], fly ash concrete [5], and fly ash cement [6].
With the depletion of shallow coal resources, deep coal mining in China is becoming more and more prevalent [7,8]. However, the deep mining of coal resources usually comes with more mine pressure, more complex surrounding rock stress state, greater deformation, and more roof and rib falling risks, which threatens coal mine workers’ lives and safety and affects mine production [9,10,11,12,13]. The stability of the roadway surrounding rock is of great significance to the safe production of coal mines. Lagging grouting is an effective method to improve its stability, which improves its strength and limits its deformation [14,15,16]. At present, grouting technology has become a common reinforcement method in various geotechnical engineering applications [17,18,19,20,21]. Grouting material that matches working condition is very important in grouting engineering. Its properties significantly affect the final grouting effect. To better maintain the stability of the surrounding rock, the raw materials mix ratio should be determined by the required properties of the surrounding rock.
Reasonable experimental design is helpful to analyze the relationship between material properties and mix ratios. Using Portland cement, emery, and fly ash as main raw materials, Chenliang Hao et al. [22] and Cong Zhang et al. [23] carried out a grouting material ratio test though uniform design. The relationship was obtained between different material properties and material ratios through the regression model. Then, the optimal ratio was determined, satisfying the geological conditions of the coal mine through qualitative analysis and the establishment of a new objective programming model. Jiahua Mao et al. [24] and Shuai Zhang et al. [25] studied the effects on its physical properties through an orthogonal test. The former [24] optimized the formulation of each material through linear regression analysis, and concluded that setting time was mainly affected by the cement–fly ash ratio; the latter [25] optimized the micro-fracture grouting material containing microfine fly ash through analyzing the experimental data with gray correlation. Related optimization experimental methods have also been widely developed in other fields [26,27,28,29]. In recent years, the response surface methodology (RSM) has been gradually used in the optimization of grouting materials [30,31,32,33]. Iman and Aires [30] studied the influence of silica fume, ultra-fine fly ash, and sand as the three main variables of ultra-high property concrete on flow diameter and compressive strength through RSM. The model gave us a good description of the relationship between multiple variables and response parameters through multiple linear regression. Generally speaking, the solution of multi-objective optimization problem is transforming it into a single-objective optimization problem through weighting. This transformation comes with the problem of the weight-setting of each objective. Only a unique solution can be obtained after transformation. It is in contrast to the result of a multi-objective optimization problem which is a group of non-dominated solution set. Therefore, it is necessary to develop a new mix ratios optimization method that can meet the needs of surrounding rock for mining roadway maintenance.
Therefore, this paper studies the influence of different material mix ratios on grouting material properties under the fixed content of 20% fly ash. It is helpful to reduce the environment pollution by increasing the utilization of fly ash. The mix ratio optimization method is provided based on the requirement of material property, which combines the methods of experimental design and numerical analysis. Firstly, the polynomial approximate implicit limit state equation is fitted using the Box–Behnken design (BBD) method. It takes the parameters affecting the property of the grouting material such as water-cement ratio (w/c), silica fume content, and sodium silicate content as independent variables. The response surface regression model is established between the 7-day uniaxial compressive strength (7dUCS), viscosity, initial setting time, and the ratio of raw materials. The influence of raw materials is analyzed on the properties of fly ash grouting materials. Then, multi-objective optimization algorithm is used to find a group of non-dominated solution set of the grouting material mix ratios. The meta-heuristic algorithm takes the regression functions of properties as the optimization objective functions. Finally, the optimal ratio of grouting materials is obtained through multi-attribute decisions method NNRP-TOPSIS which ranked the three attributes of grouting materials non-numerically.

2. Materials and Methods

2.1. Raw Materials

In this work, the cement used was OPC 42.5 composite Portland cement produced by Xuzhou Zhonglian Co., Ltd. (Xuzhou, China). The fly ash was Class F fly ash produced by Shenhua Dananhu Thermal Power Plant of Hami (Hami, China) and its content was analyzed through XRF. Sodium silicate, serving as the alkaline activator, came from Shandong Yousuo Chemical Technology Co., Ltd. of Linyi (Linyi, China). All the main performance indexes of these three raw materials are shown in Table 1. As for the reinforcing agent, the silica fume was purchased from Chengdu Jinhe Technology Co., Ltd. (Chengdu, China). and its main component is silica.

2.2. Testing Methods

2.2.1. Uniaxial Compressive Strength

The uniaxial compressive strength of fly ash grouting material was measured through a testing machine. The specimens were demolded as 70 mm cubes after being cured at room temperature for 24 h, and then they were cured in the standard curing box for 7 days. In order to reduce experimental error, 3 samples with different mixture ratios were made. The final 7dUCS was determined by 1.3 times the arithmetic mean value of the three specimens.

2.2.2. Initial Setting Time

The initial setting time of the slurry was measured through the standard Vicat meter according to Chinese Code GB/T1346 2011. The cement–fly ash paste was prepared with water of the standard consistency. The paste was poured into the mold to vibrate and scrape and then it was left. This moment was marked as the starting time when all the raw materials were added into water. The testing needle was lowered until resting on the surface of the cement–fly ash paste. Then, the screw was suddenly loosened to allow the testing needle to sink vertically and freely into the paste. When the testing needle was 3–5 mm away from the bottom plate, the time was recorded again. The span between this time and the starting time was considered as the initial setting time.

2.2.3. Viscosity

The viscosity of the grouting materials was measured through a rotary viscometer. The measuring means was as follows. The rotation of the rotor generated a viscosity torque acting on the rotor by the liquid, and then the viscosity torque was detected by the sensor.

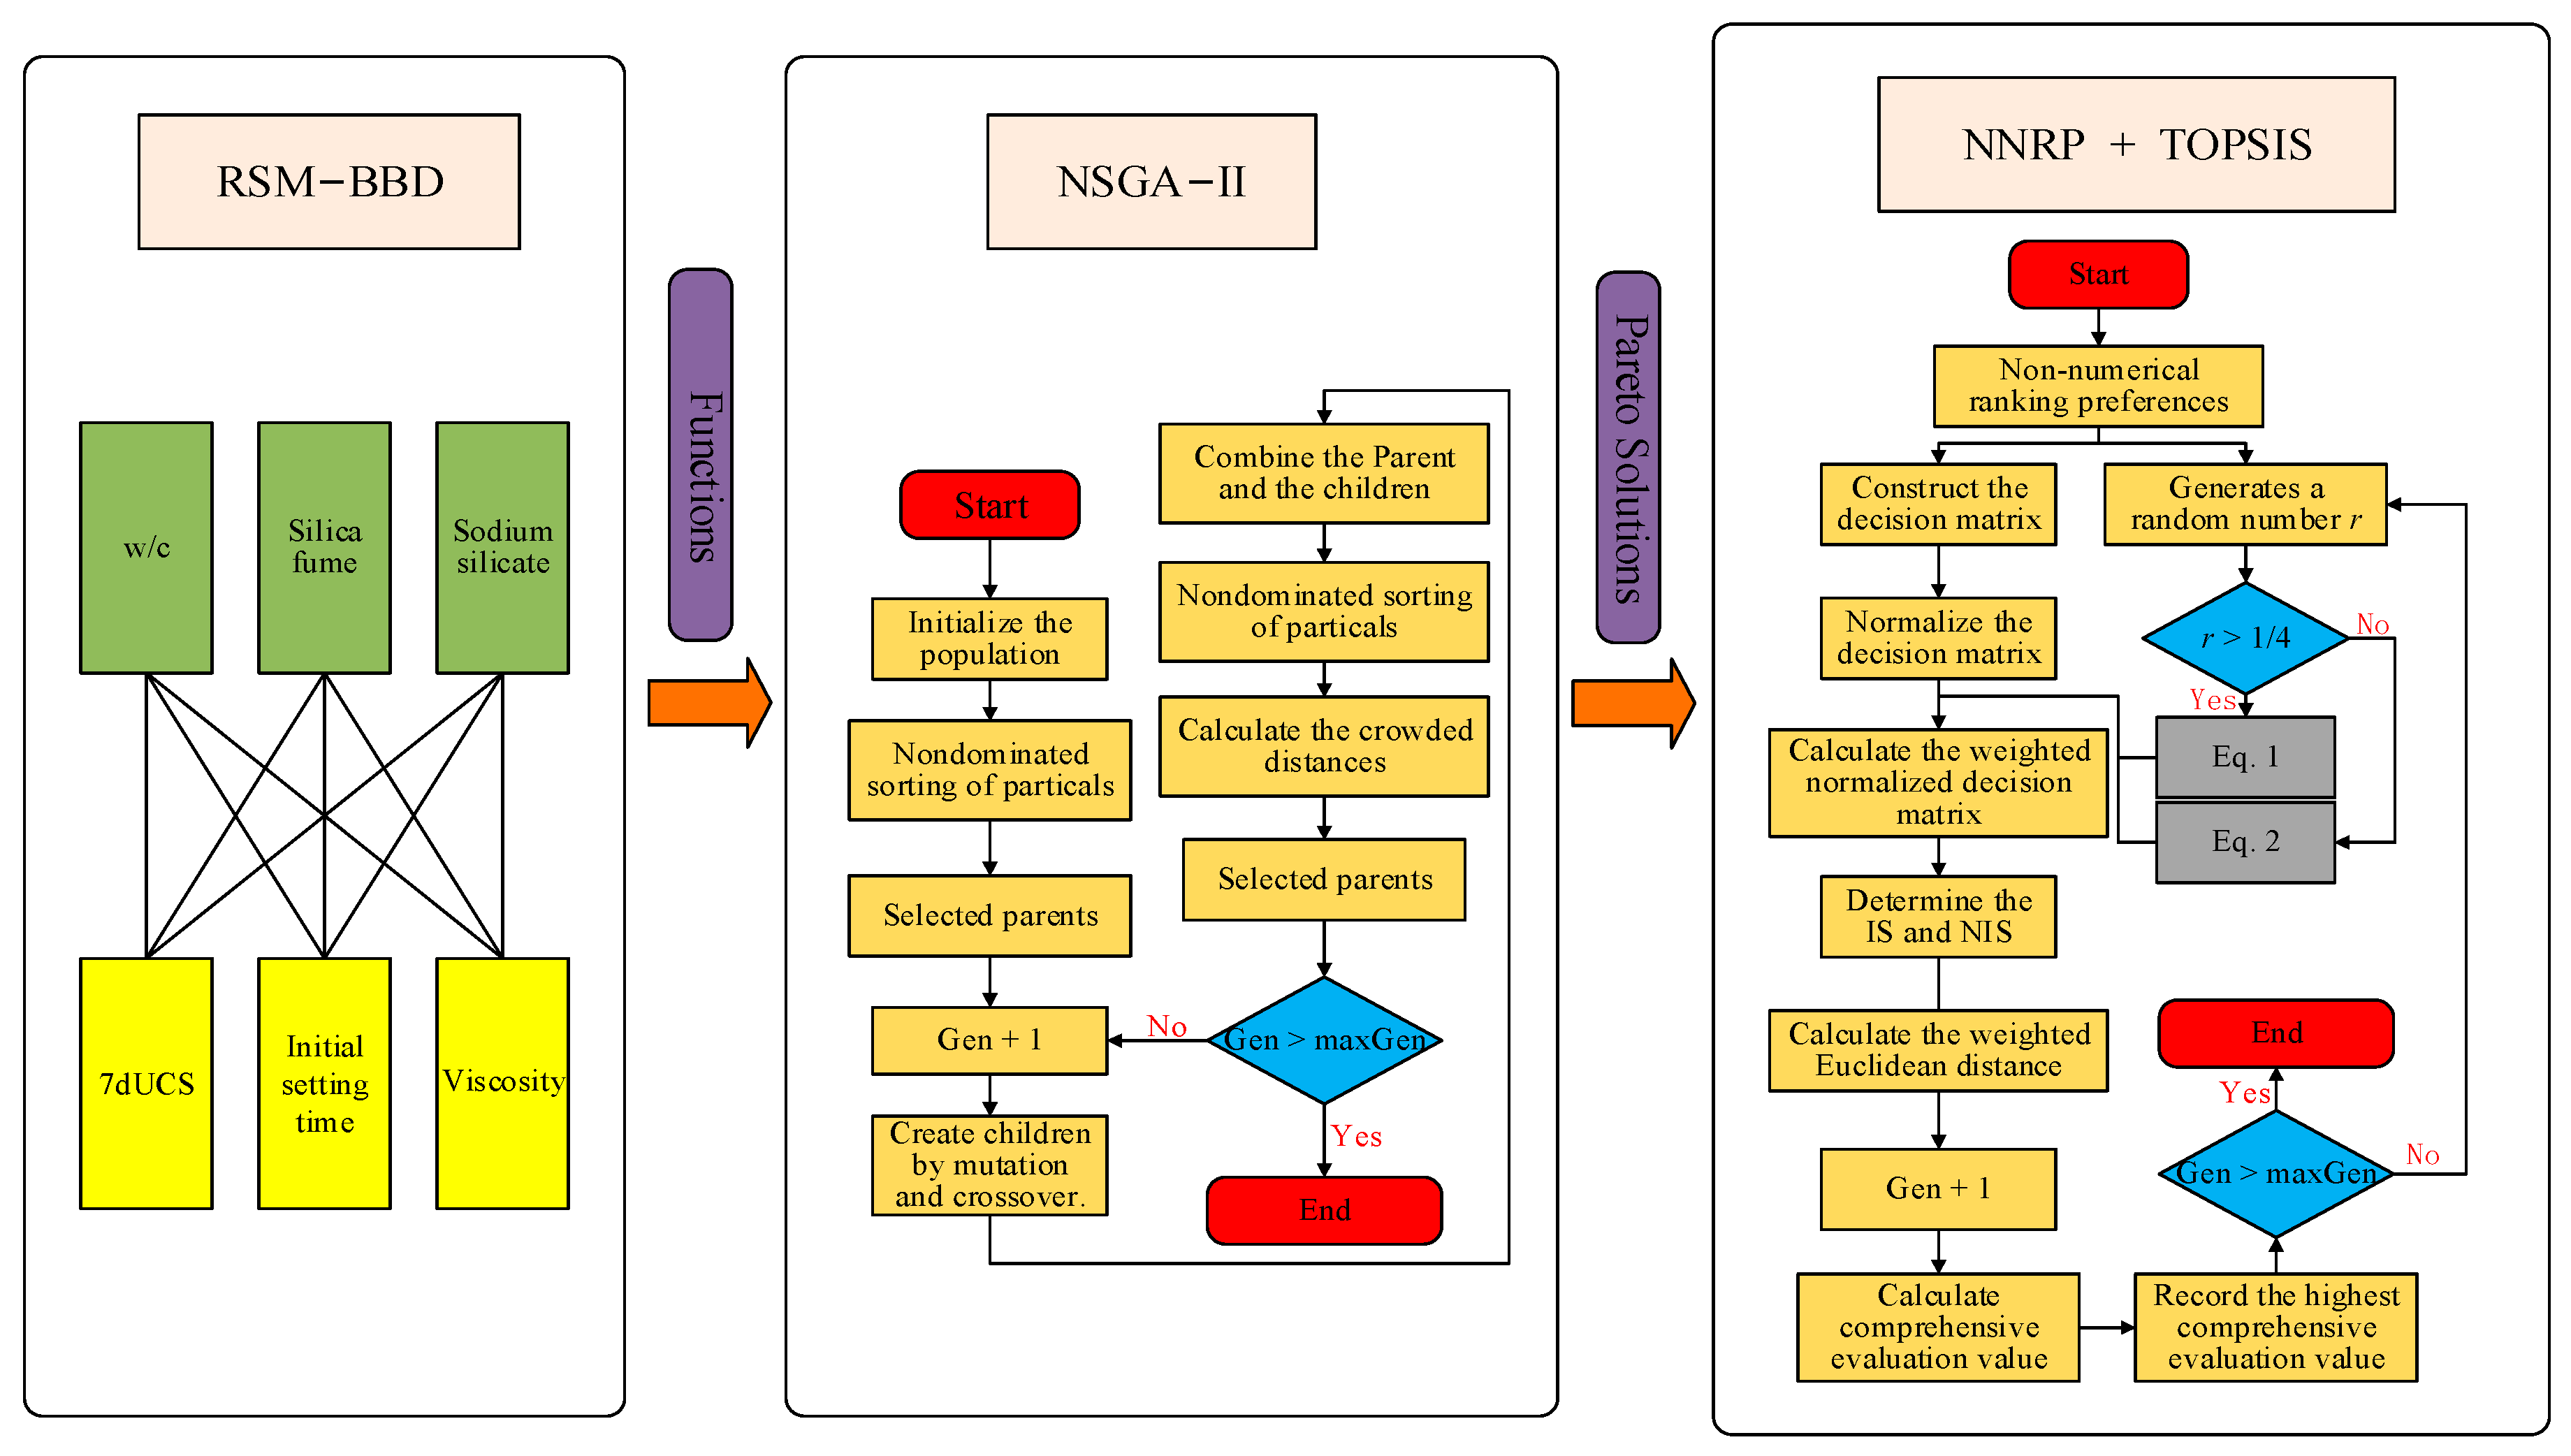
2.3. Research Framework

To realize the optimization research on the proportion of fly ash grouting materials, a regression model was established between multiple material properties and raw materials based on the experimental design. Then, the metaheuristic algorithm was used for multi-objective optimization. Finally, the optimal solution was selected through the improved multi-attribute decision-making method. As shown in Figure 1, the study is divided into three parts. In the first part, the multi-factor and multi-level experimental design of grouting materials was carried out using the RSM-BBD method. The multiple nonlinear regression model was constructed between response values and influencing factors. In the second part, multiple optimization objective functions were established based on the regression equations. The non-dominated solutions of multi-objective optimization were obtained for grouting materials through the metaheuristic algorithm NSGA-II. In the third part, multi-attribute decision-making through the combination of non-numerical ranking preferences method (NNRP) and technique for order preference by similarity to ideal solution (TOPSIS) was carried out. The NNRP generated random weights to construct a weighting matrix and determine the ideal solution. Then, the relative approximate degree was calculated between each solution and the ideal solution, and the solutions in the non-dominated solutions were sorted according to the relative approximate degree to obtain the optimal solution.

2.3.1. Response Surface Methodology

Response surface methodology (RSM) is a methodology that combines the advantages of specific mathematical and statistical methods. Compared with orthogonal design, which cannot guarantee the accuracy and predictability of the mathematical model, RSM has higher reliability. It ensures the reasonable distribution of data points in the studied area. The unknown relationship can be fitted with polynomial function between the response value and the multi-variable within the internal error of the experiment [34]. RSM can realize multivariable nonlinear regression to fit the relationship between variable values and response values with limited experiments. Box–Behnken design might be better for geopolymer materials with various ingredients and several performance requirements [28].
In the experiment, the experimental design software Design-Export10 was used to carry out the RSM-BBD method. Considering the effects of w/c, silica fume content, and sodium silicate content on the three properties of grouting material, the response surface experimental design was the following. The fixed content of fly ash was 20% and the content of calcium chloride was 3%. w/c (X1), silica fume content (X2), and sodium silicate content (X3) were chosen as three influencing factors, while 7dUCS, initial setting time, and viscosity were chosen as the influencing factors, coded with −1, 0, and 1, respectively. According to previous experience, the w/c should not be less than 0.6, so the designed w/c ranged from 0.6 to 1. According to previous test results, the content of silica fume ranged from 1% to 3%, and the content of sodium silicate ranged from 1% to 5%. The input values are shown in Table 2.

2.3.2. Non-Dominated Sorting Genetic Algorithm-II

Non-dominated Sorting Genetic Algorithm-II (NSGA-II) was improved by Deb et al. [35] based on the non-dominated sorting genetic algorithm (NSGA). (1) A fast non-dominated sorting algorithm was proposed. (2) Elite strategy was introduced. (3) Crowding-distance and crowded-comparison operator were used. It reduced the complexity of NSGA with the advantages of fast running speed and good convergence of solution set. Thus, it has become a commonly used method to solve multi-objective optimization problems [36,37,38].

2.3.3. TOPSIS Based on Non-Numerical Ranking Preferences Method

The result of the multi-objective optimization problem is usually a large number of Pareto solutions. The decision-maker should make further decisions to determine the final solution by tailoring the Pareto solution set. Technique for order preference by similarity to ideal solution [39] (TOPSIS) is a commonly used comprehensive evaluation method for multi-attribute decision-making methods. Positive ideal solution and negative ideal solution are selected as the decision-making standard after the data matrix is normalized that eliminates the dimensional influence. The solutions are sorted and selected through comparing the distance between the solution to be evaluated and the positive and negative ideal solution.
The calculation of attribute weight is a significant problem in multi-attribute decision-making. At present, many studies have been carried out on how to determine the attribute weight of TOPSIS. However, not all weights must be assured in decision-making problems. The advantage of the NNRP proposed by Taboada et al. [40] is that the decision-maker only needs to sort the objective functions according to the relative importance without selecting the specific weight values. Therefore, this paper improved TOPSIS based on the NNRP method. Firstly, multiple attributes were sorted non-numerically, and their weights corresponded to w1, w2, w3 (w1 > w2 > w3). Then, the weights of the three attributes were calculated according to the following formulas derived by Carrillo [41] and substituted into TOPSIS to calculate the comprehensive evaluation value of each solution. Finally, the highest comprehensive evaluation value of each solution was recorded in the process of multiple iterations. All solutions were sorted and tailored after the iteration was completed.
{ 1     { w 1 = 1 1 r 3 w 2 = ( 1 w 1 ) ( r + 1 ) 2 w 3 = 1 w 1 w 2 , 1 4 r 1 2 { w 1 = r + 1 3 w 2 = ( 3 w 1 1 ) r + 1 w 1 2 w 3 = 1 w 1 w 2 , 0 r 1 4
where r is a random number ranging from 0 to 1.

3. Results and Discussion

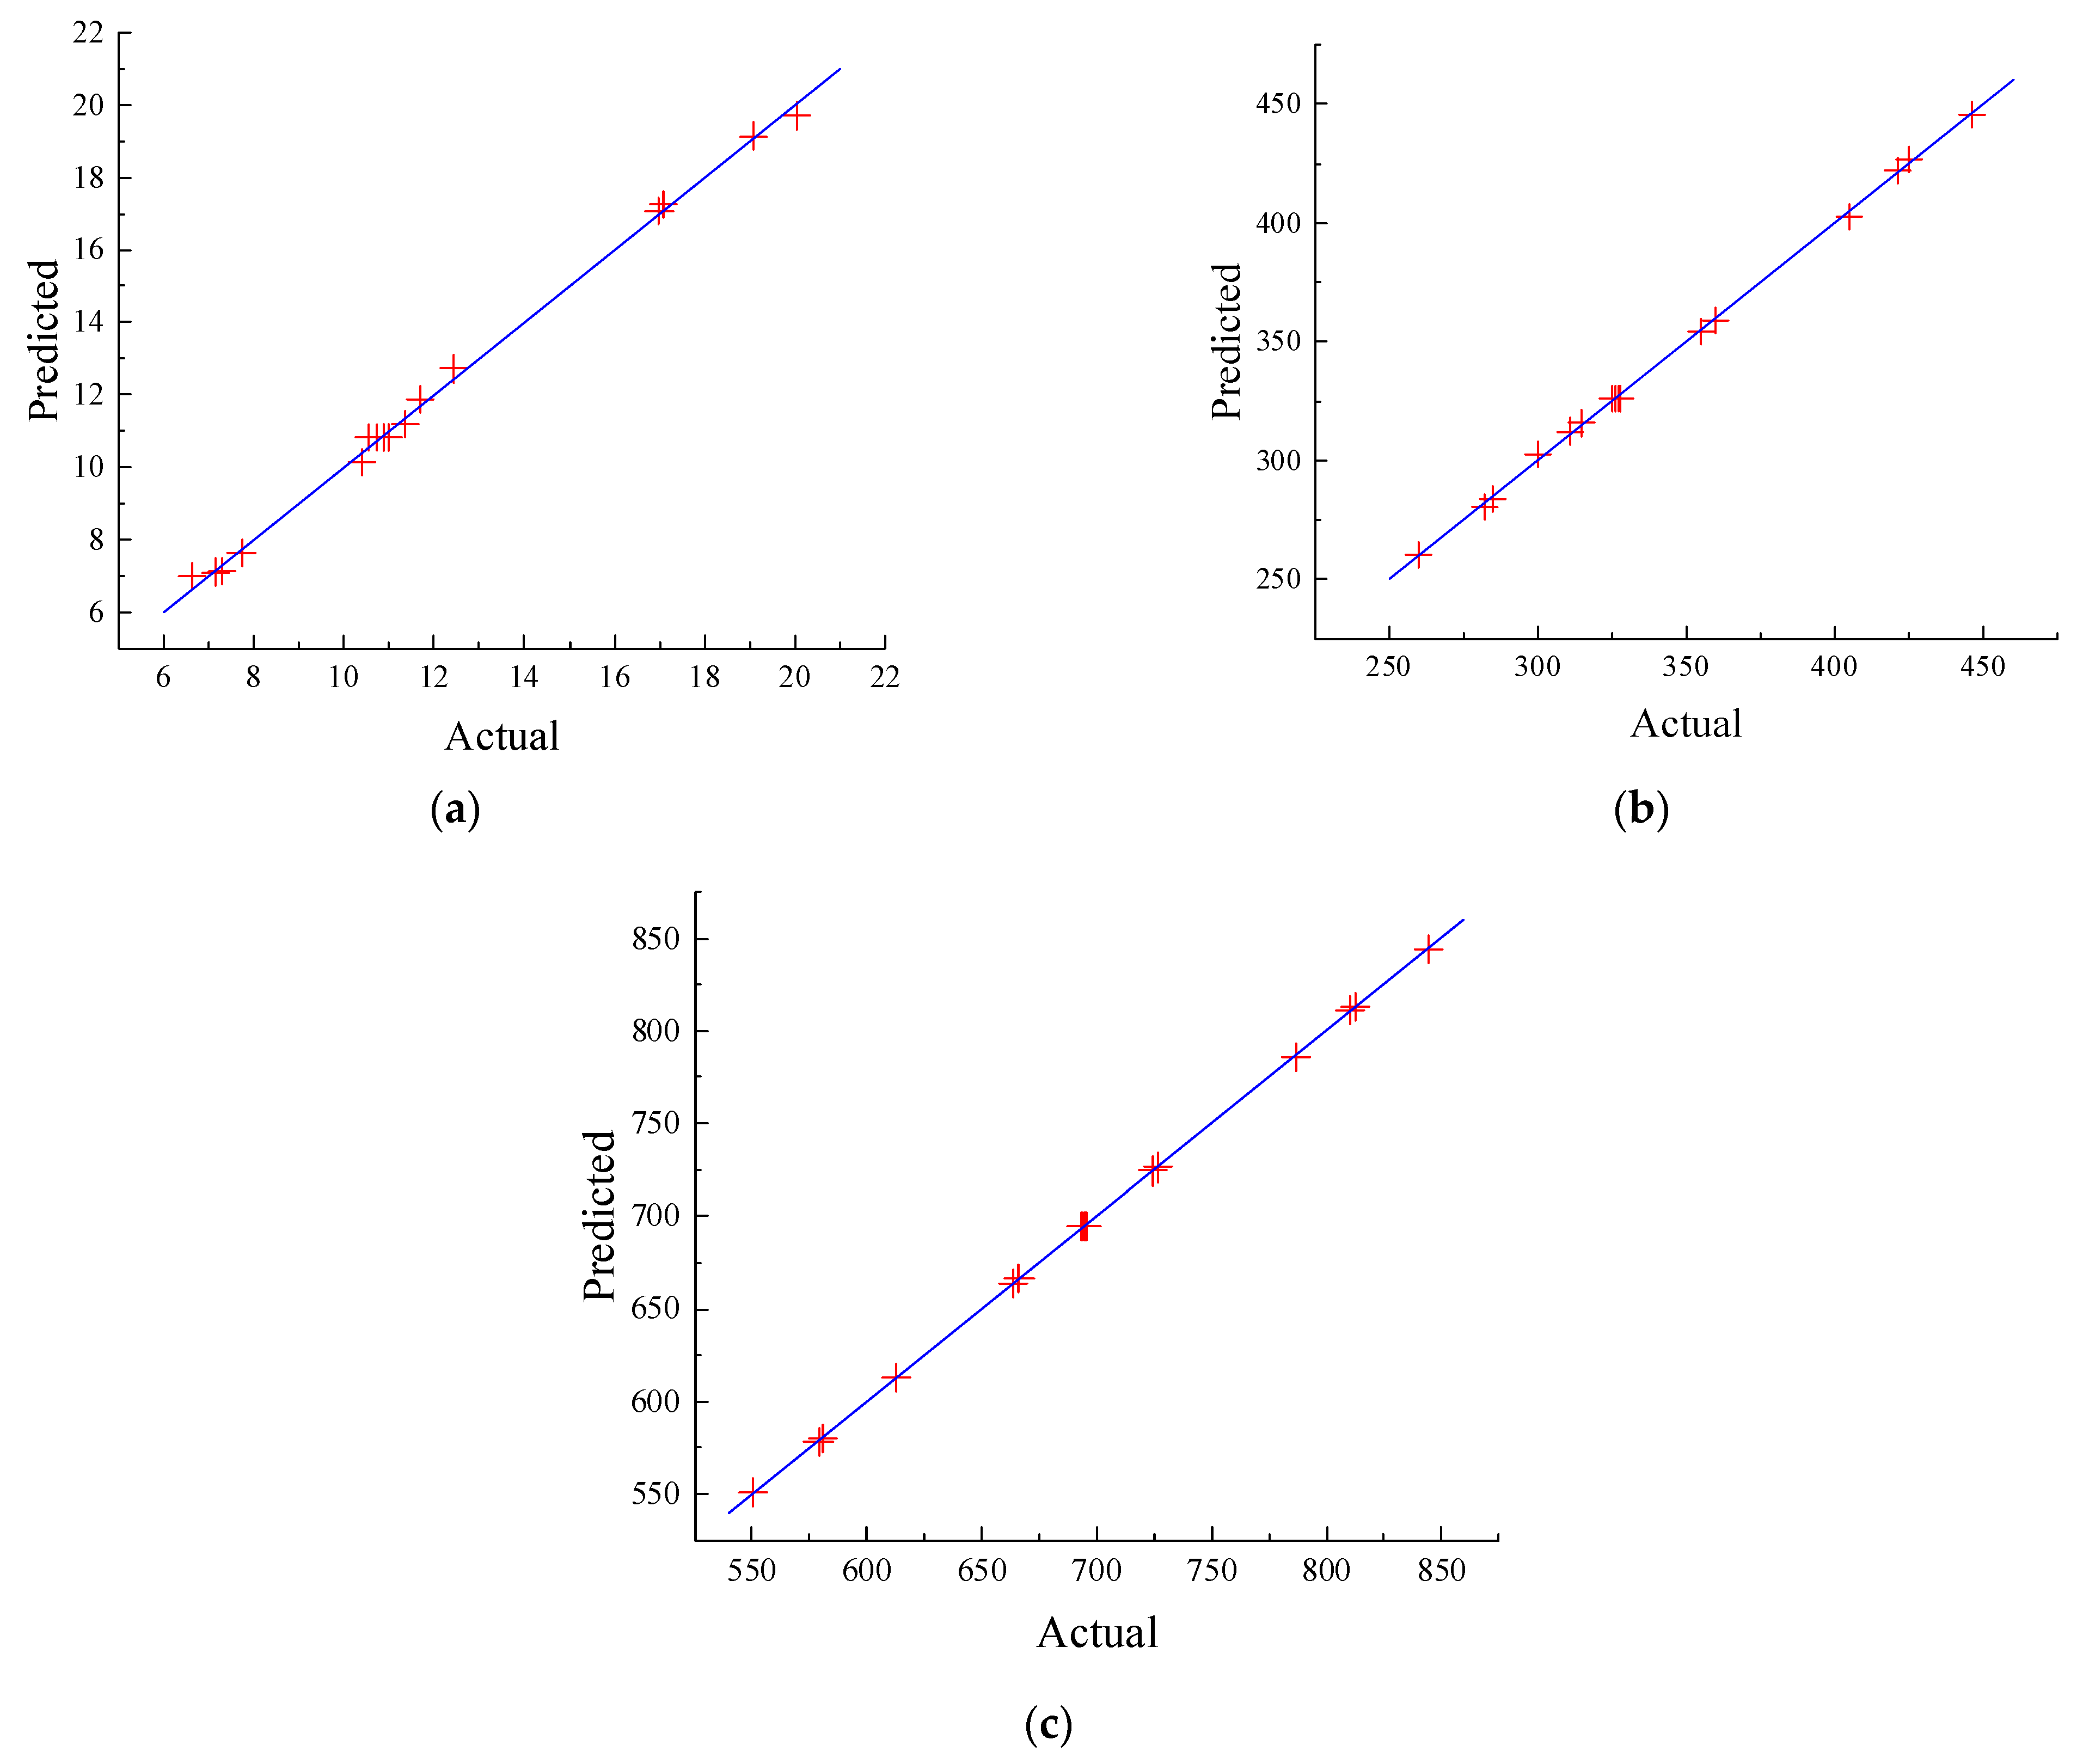
3.1. Response Surface Model Fitting and Its Validation

According to the experimental results and the software Design-Export10, the response surface functions of 7dUCS, initial setting time, and viscosity of the grouting material could be obtained through multiple linear regression fitting of the data as follows:
7dUCS (correlation coefficient R2 was 0.9688):
Y 1 = 10.82 5.54 X 1 + 0.81 X 2 + 0.48 X 3 0.49 X 1 X 2 0.47 X 1 X 3 0.052 X 2 X 3 + 1.6 X 1 2 + 0.43 X 2 2 + 0.23 X 3 2
Initial setting time (correlation coefficient R2 was 0.9907):
Y 2 = 326.2 + 71.25 X 1 + 2.0 X 2 21.25 X 3 + 0.25 X 1 X 2 0.25 X 1 X 3 0.25 X 2 X 3 + 22.27 X 1 2 + 4.77 X 2 2 + 4.28 X 3 2
Viscosity (correlation coefficient R2 was 0.9996):
Y 3 = 694.36 116.44 X 1 + 1.08 X 2 + 30.11 X 3 0.12 X 1 X 2 + 0.9 X 1 X 3 0.12 X 2 X 3 + 2.32 X 1 2 1.05 X 2 2 + 1.82 X 3 2
The reliability of the RSM function model can be verified according to the significance F-value test and analysis of variance of the regression model. Table 3 lists the results of this model. The p-value is used to verify the significance of the regression coefficients. When p < 0.05, it indicates that the influencing factor is significant. As shown in the data of analyzing variance (ANOVA) in Table 3, the p-values of “model” were less than 0.0001, indicating that the regression effects were very significant. This model can be used to predict the property of grouting materials. The scatter plots of measured and predicted values of grouting material properties (Figure 2) show that the scattered points are distributed near the straight line, indicating that the data fit well. From the above analysis, it can be concluded that the predicted value of the model was very consistent with the actual value, and that the model has high reliability and a good fitting effect.

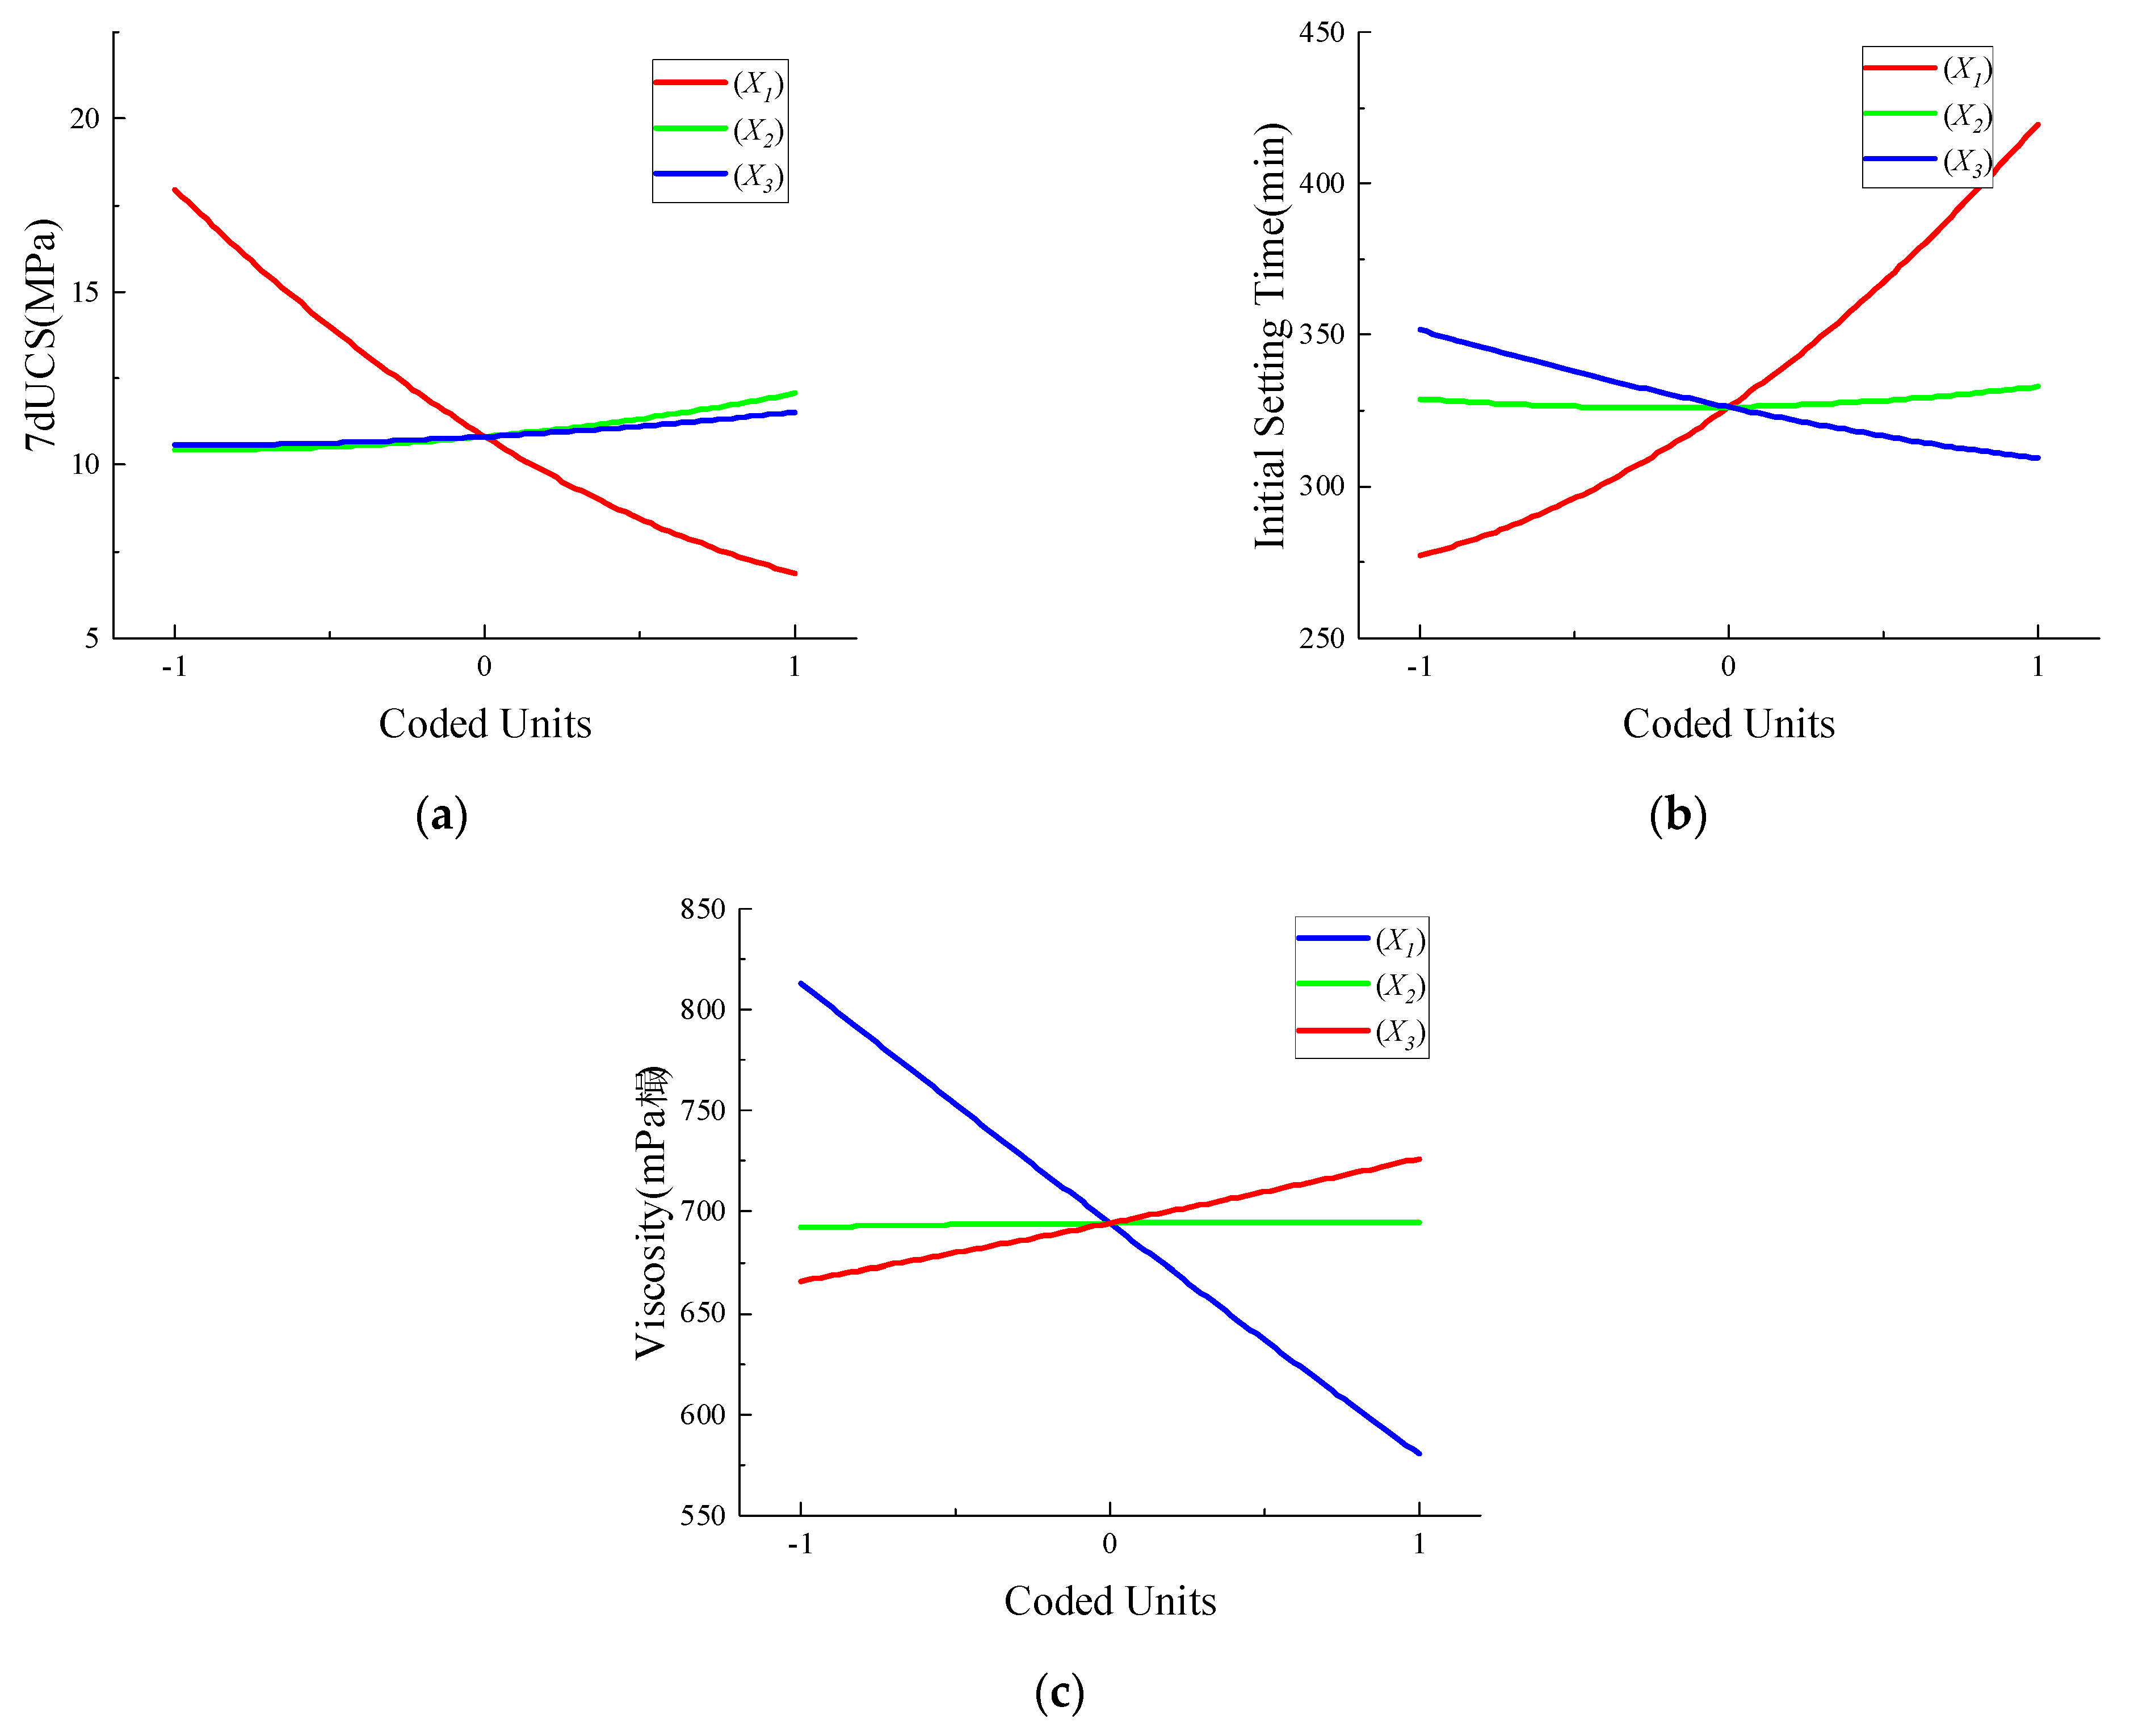
3.2. Effect of Response Surface Variables on the Properties of Grouting Material

3.2.1. Water–Cement Ratio

The effect of response surface parameters on the properties of grouting material is shown in Figure 3. The 7dUCS and viscosity decreased with the increase of w/c, while the initial setting time increased with the increase of w/c. Cement-based materials can have great strength because the hydration reaction of cement produces a large number of ettringite crystals. Those are filled among the aggregates to increase the strength. However, with the increase of water, free water content increases in the slurry. It reduces the generation of cement hydration products, resulting in the decrease of the strength. At the same time, the increase of free water reduces the viscosity and prolongs the initial setting time.

3.2.2. Silica Fume

Figure 3a depicts that the 7dUCS increased with the increase of silica fume content, but the degree of increase is less than that with the change of w/c. Where w/c was 0.8 and the sodium silicate content was 3%, 7dUCS increased by 15.5% as the silica content increased from 1% to 3%. This indicates that the improvement of strength resulted from calcium silicate hydrated gel (C-S-H) which is produced by silica fume, water, and cement hydration products Ca(OH)2. The initial setting time and viscosity changed slightly with the increase of silica fume content. In Figure 3b, the corresponding curve rises slowly and is close to the horizontal line. The initial setting time–silica fume content curve decreased slightly at first and then rose slowly.

3.2.3. Sodium Silicate

The sodium silicate showed a slight effect on the 7dUCS, which was weaker than that of silica fume. As seen in Figure 3a, its growth rate was 9.18%. The initial setting time decreased with the increase of sodium silicate, and the decrease rate was 14.81%. The viscosity increased with the rise of sodium silicate content. It probably resulted from reaction products C-S-H of sodium silicate and Ca(OH)2. The initial setting time is shortened because the fast reaction decreased the time of gelation. Therefore, the curve of initial setting time–sodium silicate content shows a negative correlation in Figure 3b. Additionally, hydrolysis reaction of sodium silicate consumes a certain amount of water, which also increases the slurry viscosity. Correspondingly, the viscosity curve shows a rising trend in Figure 3c.

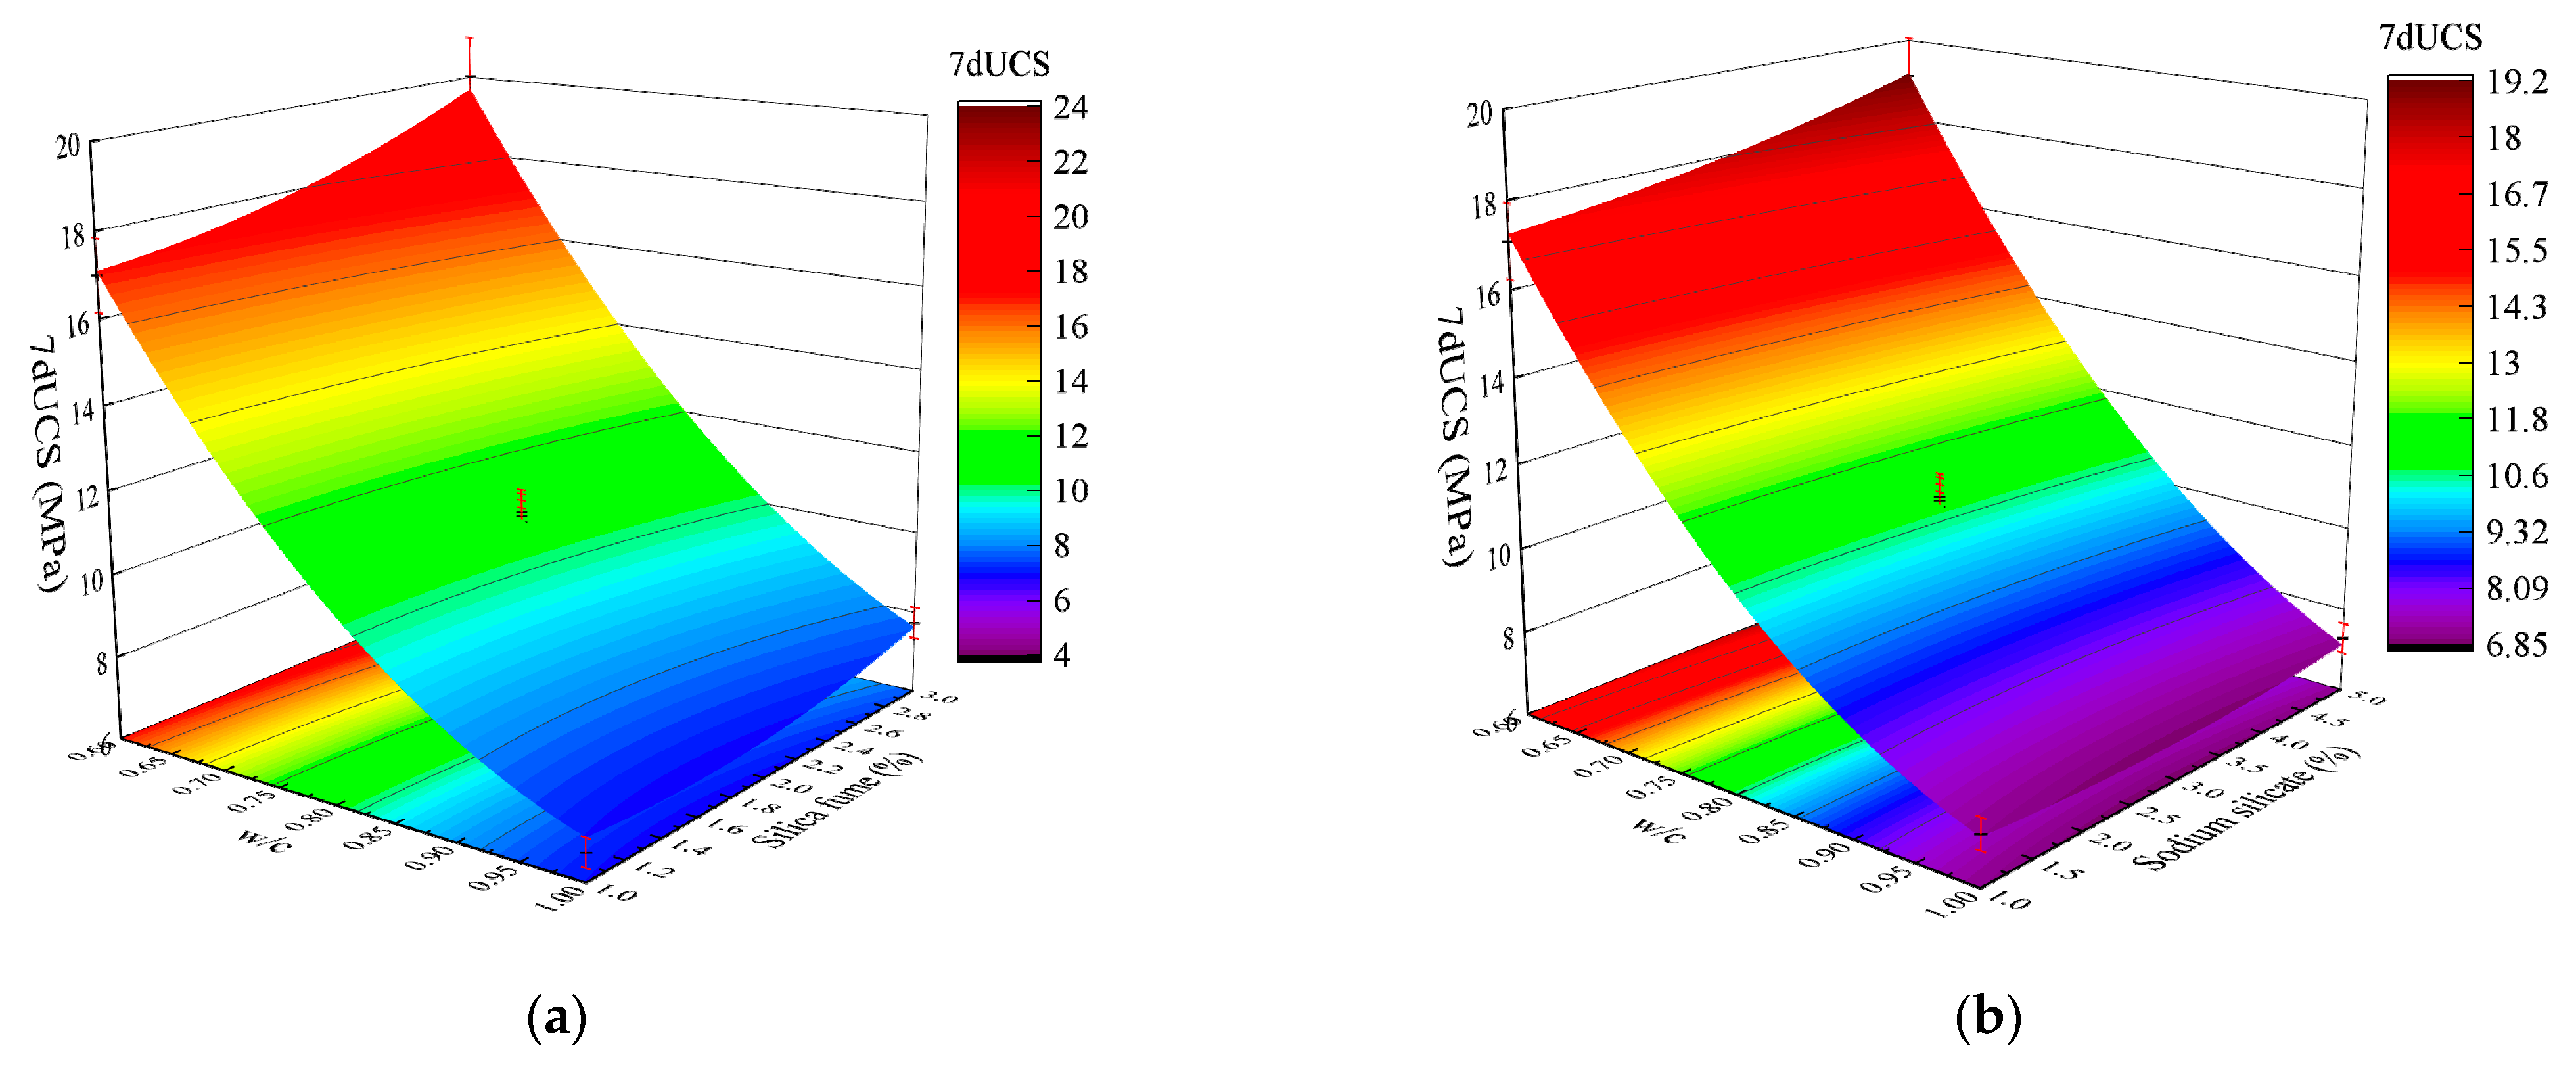
3.2.4. Interaction of Variables

The p-value of both X1 X2 and X1 X2 were smaller than 0.05 for 7dUCS in ANOVA results (Table 3), indicating that 7dUCS was significantly influenced by the reaction between w/c (X1) and silica fume content (X2), as well as the interaction between w/c (X1) and sodium silicate content (X3). Figure 4 shows the 3D response surface plots of X1 X2 and X1 X3, where the red indicates that the 7dUCS is high and the blue indicates low 7dUCS. The reduction rate of 7dUCS slowed down after the actual value of w/c exceeded 0.8. The response surface gradually flattened with the increase of w/c, which is consistent with that in Figure 3a. As mentioned above, both silica fume and sodium silicate could increase the 7dUCS. However, with the increase of w/c, the decrease of slurry concentration leads to the decrease in the amount of C-S-H, which results in the weakening of their reinforcement effect on 7dUCS.
To illustrate the rationality of using the RSM-BBD method, the conclusions drawn in this paper are compared with similar research results of others is the following. The orthogonal test research of Jiupeng Zhang [42] on cement-based materials showed that increasing w/c significantly reduced the compressive strength and viscosity of cement slurry. In contrast, it increased the fluidity. Similarly, the conclusion drawn by X.Q. Wang [43] was consistent with the above, that high w/c weakened the strength of geopolymer grouting materials but improved the fluidity of materials. Huifeng Su [44] conducted an improvement test on the grouting material. It was found that the slurry viscosity and initial setting time would be increased as silica fume was added to the grouting material. This was consistent with the conclusion in this paper that the viscosity and initial setting time of fly ash grouting materials increases with the rise of silica fume content. Yijie Zhang [45] also concluded that sodium silicate reduced the setting time and rheological properties of grouting materials, while it improved the strength of materials. In conclusion, the RSM is an excellent method to study the change law between material properties and their raw materials with fewer experiments.

4. Multi-Objective Optimization and Decision-Making of Grouting Material

4.1. Objective Functions of Optimization

The target of this paper is to figure out the relationship between the mixture ratio and properties of fly ash grouting materials and predict the raw materials mixture ratio of required grouting properties. As mentioned above, RSM fits well the relationship between the mixture ratio and the response values through polynomial functions. To achieve the expected grouting effect, the response values must achieve the corresponding objectives. In this study, 13.13 MPa of the 7dUCS, 271.76 min of the initial setting time, and 725.85 mPa·s of the slurry viscosity were recommended based on the evaluations from consulting, design, and construction units. With the increase of w/c, though the slurry viscosity decreased as expected, 7dUCS decreased and initial setting time increased, which contradicts the expectation. Therefore, multi-objective optimization of the raw materials mixture ratio needs to be carried out based on the polynomial function fitted above.
According to the target of each grouting material property, the optimization objective function of each material property can be expressed as:
Minimize: f = { f 1 , f 2 , f 3 }
{ f 1 = | 10.82 5.54 X 1 + 0.81 X 2 + 0.48 X 3 0.49 X 1 X 2 0.47 X 1 X 3 0.052 X 2 X 3 + 1.6 X 1 2 + 0.43 X 2 2 + 0.23 X 3 2 13.13 | f 2 = | 326.2 + 71.25 X 1 + 2.0 X 2 21.25 X 3 + 0.25 X 1 X 2 0.25 X 1 X 3 0.25 X 2 X 3 + 22.27 X 1 2 + 4.77 X 2 2 + 4.28 X 3 2 271.76 | f 3 = | 694.36 116.44 X 1 + 1.08 X 2 + 30.11 X 3 0.12 X 1 X 2 + 0.9 X 1 X 3 0.12 X 2 X 3 + 2.32 X 1 2 1.05 X 2 2 + 1.82 X 3 2 725.85 |
where X1, X2, and X3 are coded values of w/c, silica fume content, and sodium silicate content respectively, which are subject to 1 ( X 1 , X 2 , X 3 ) 1 .

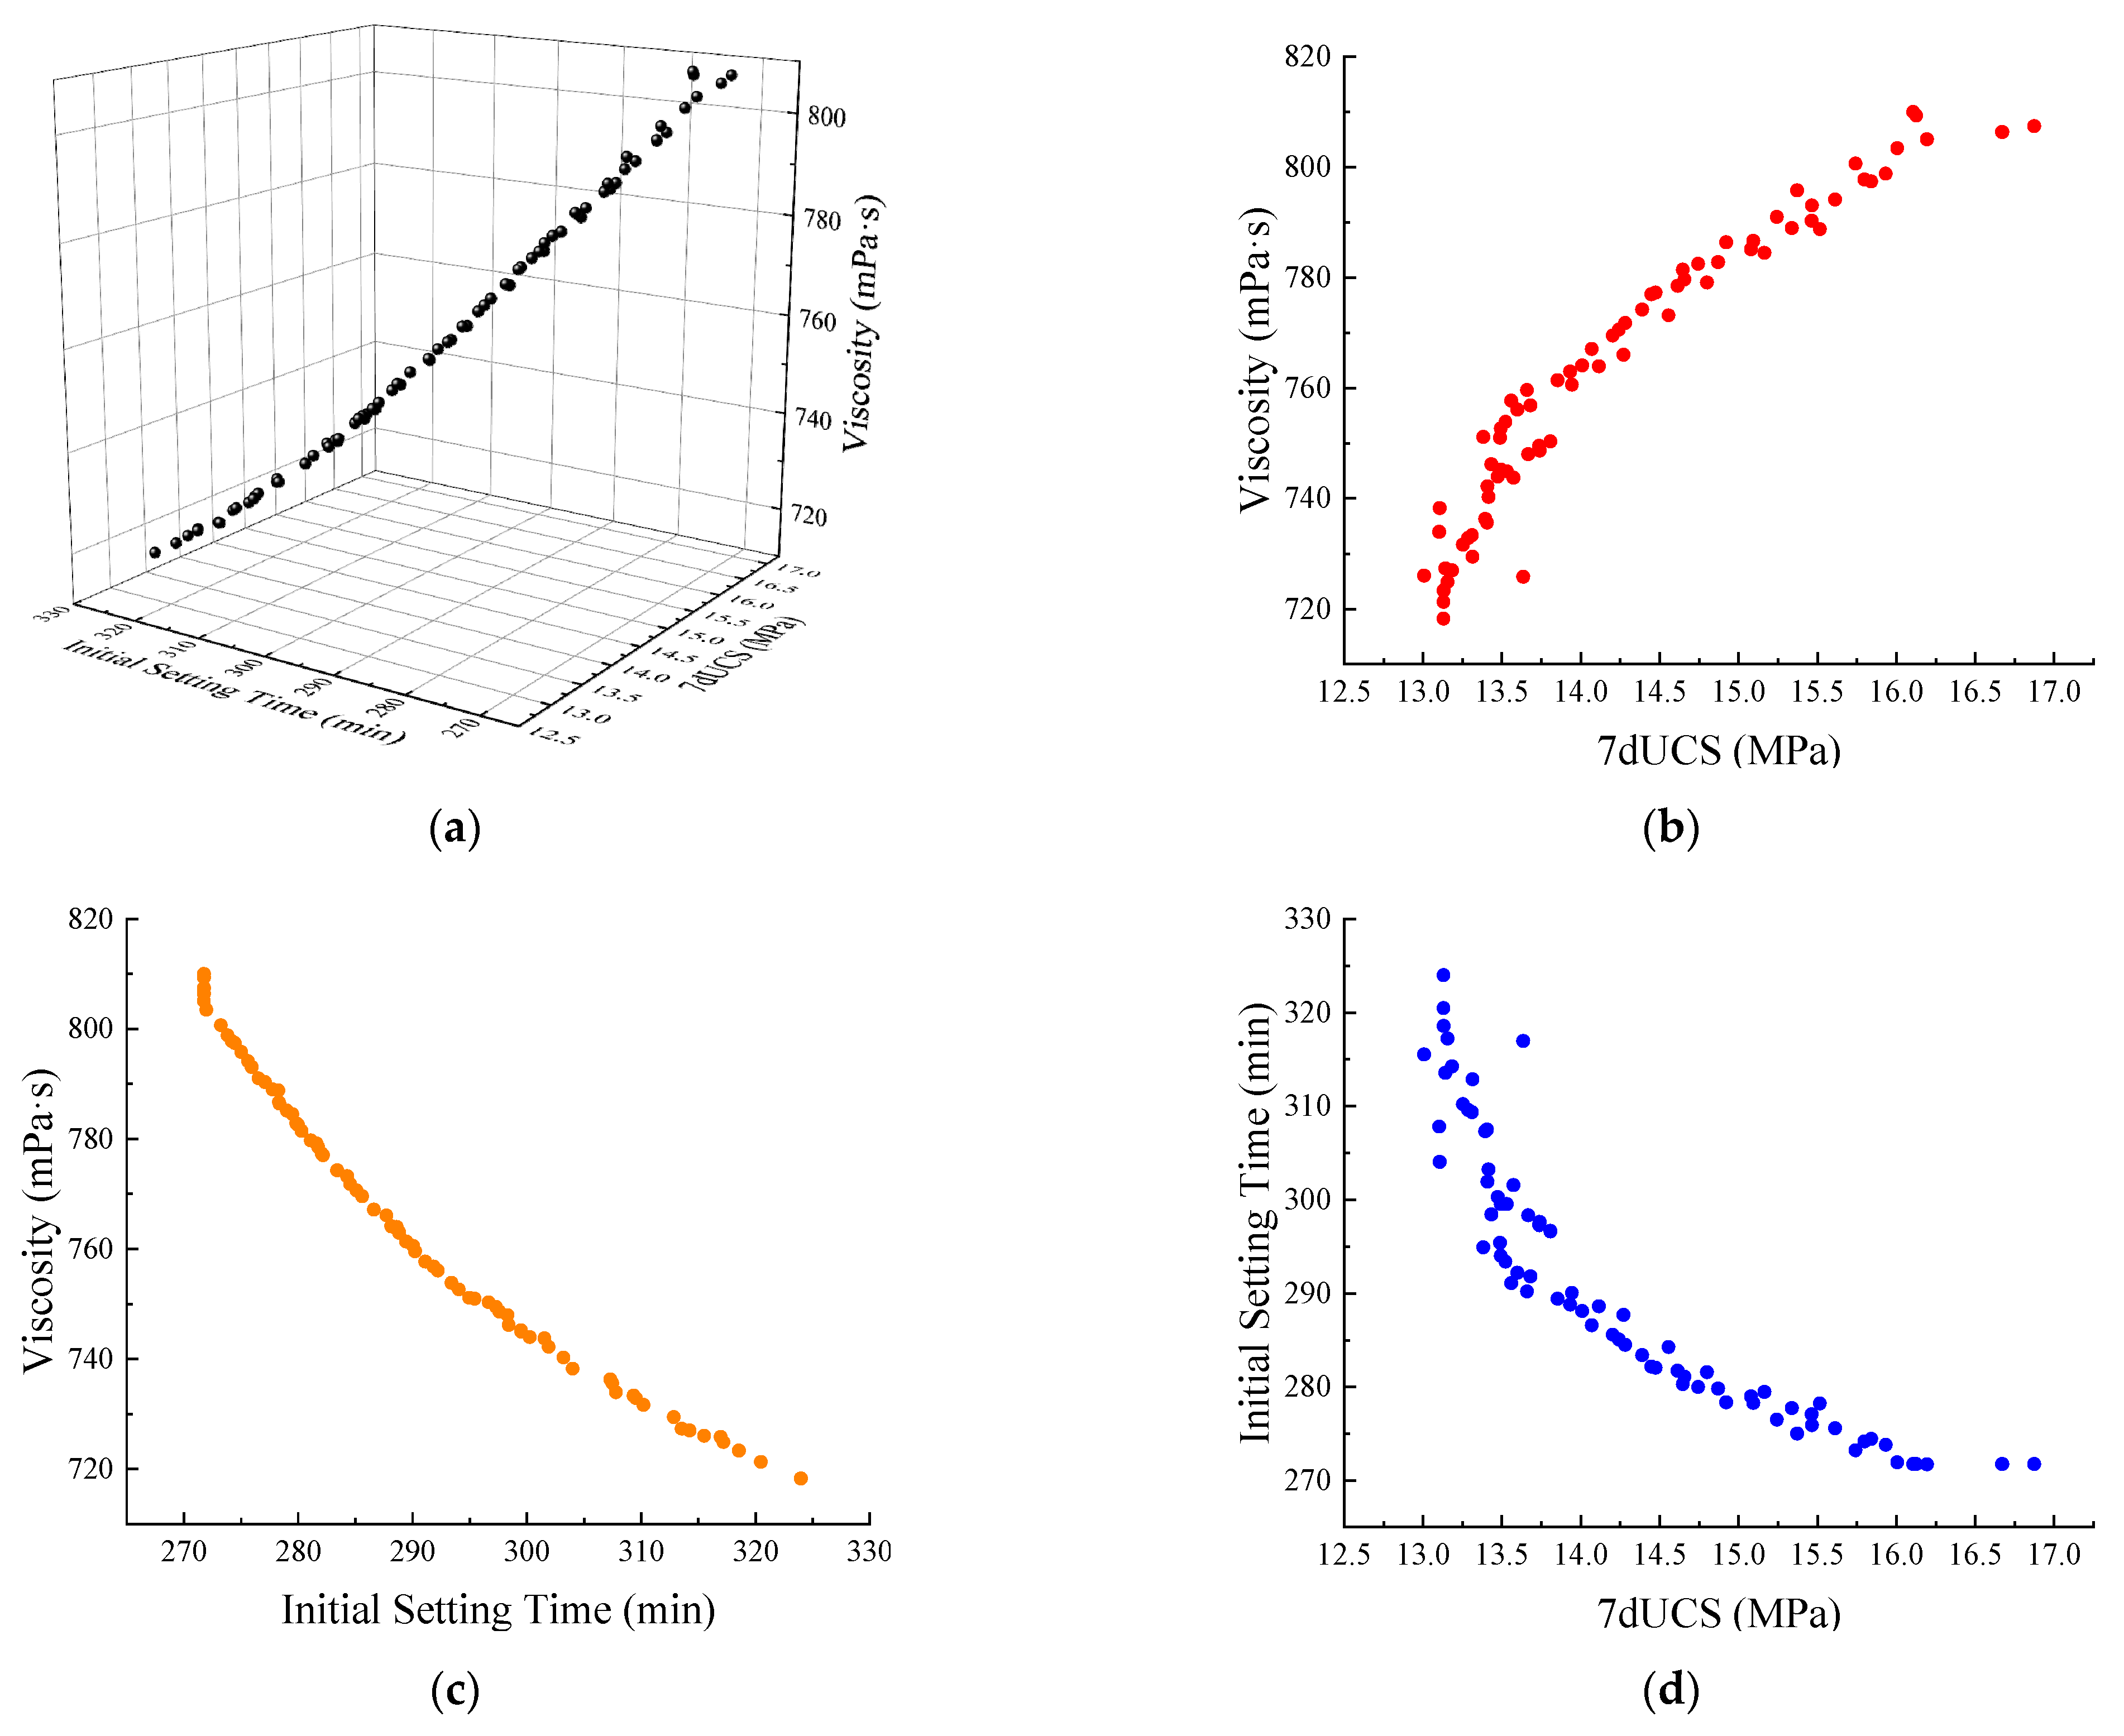
4.2. Pareto Solution Set

The model was calculated by MATLAB 2021a to realize the optimization of grouting materials. NASG-II model parameters were set as: paretoFraction = 0.4, populationsize = 200, generations = 3000, stallGenlimit = 3000, Tolfun = 1 × 10⁻¹⁰. Variables A, B, and C were coded values with upper bound = 1 and lower bound = −1.
The Pareto optimal solutions consist of 80 non-controlled solutions for the three properties of grouting material. In the three-dimensional coordinate system with coordinate axes of 7dUCS, initial setting time, and viscosity, as shown in Figure 5, all points were relatively evenly distributed on a slender surface.
The Pareto front projections of Figure 5b–d show the distribution of non-controlled solutions on each of the two material properties. The Pareto front display diagram of slurry–7dUCS viscosity shows that 7dUCS and slurry viscosity of grouting material will increase or decrease at the same time with the change of materials mixture ratio, which corresponds to Figure 3a,c. This is different from the Pareto front trend of slurry viscosity–initial setting time and initial setting time–7dUCS. While one material property increases, the other material property decreases.

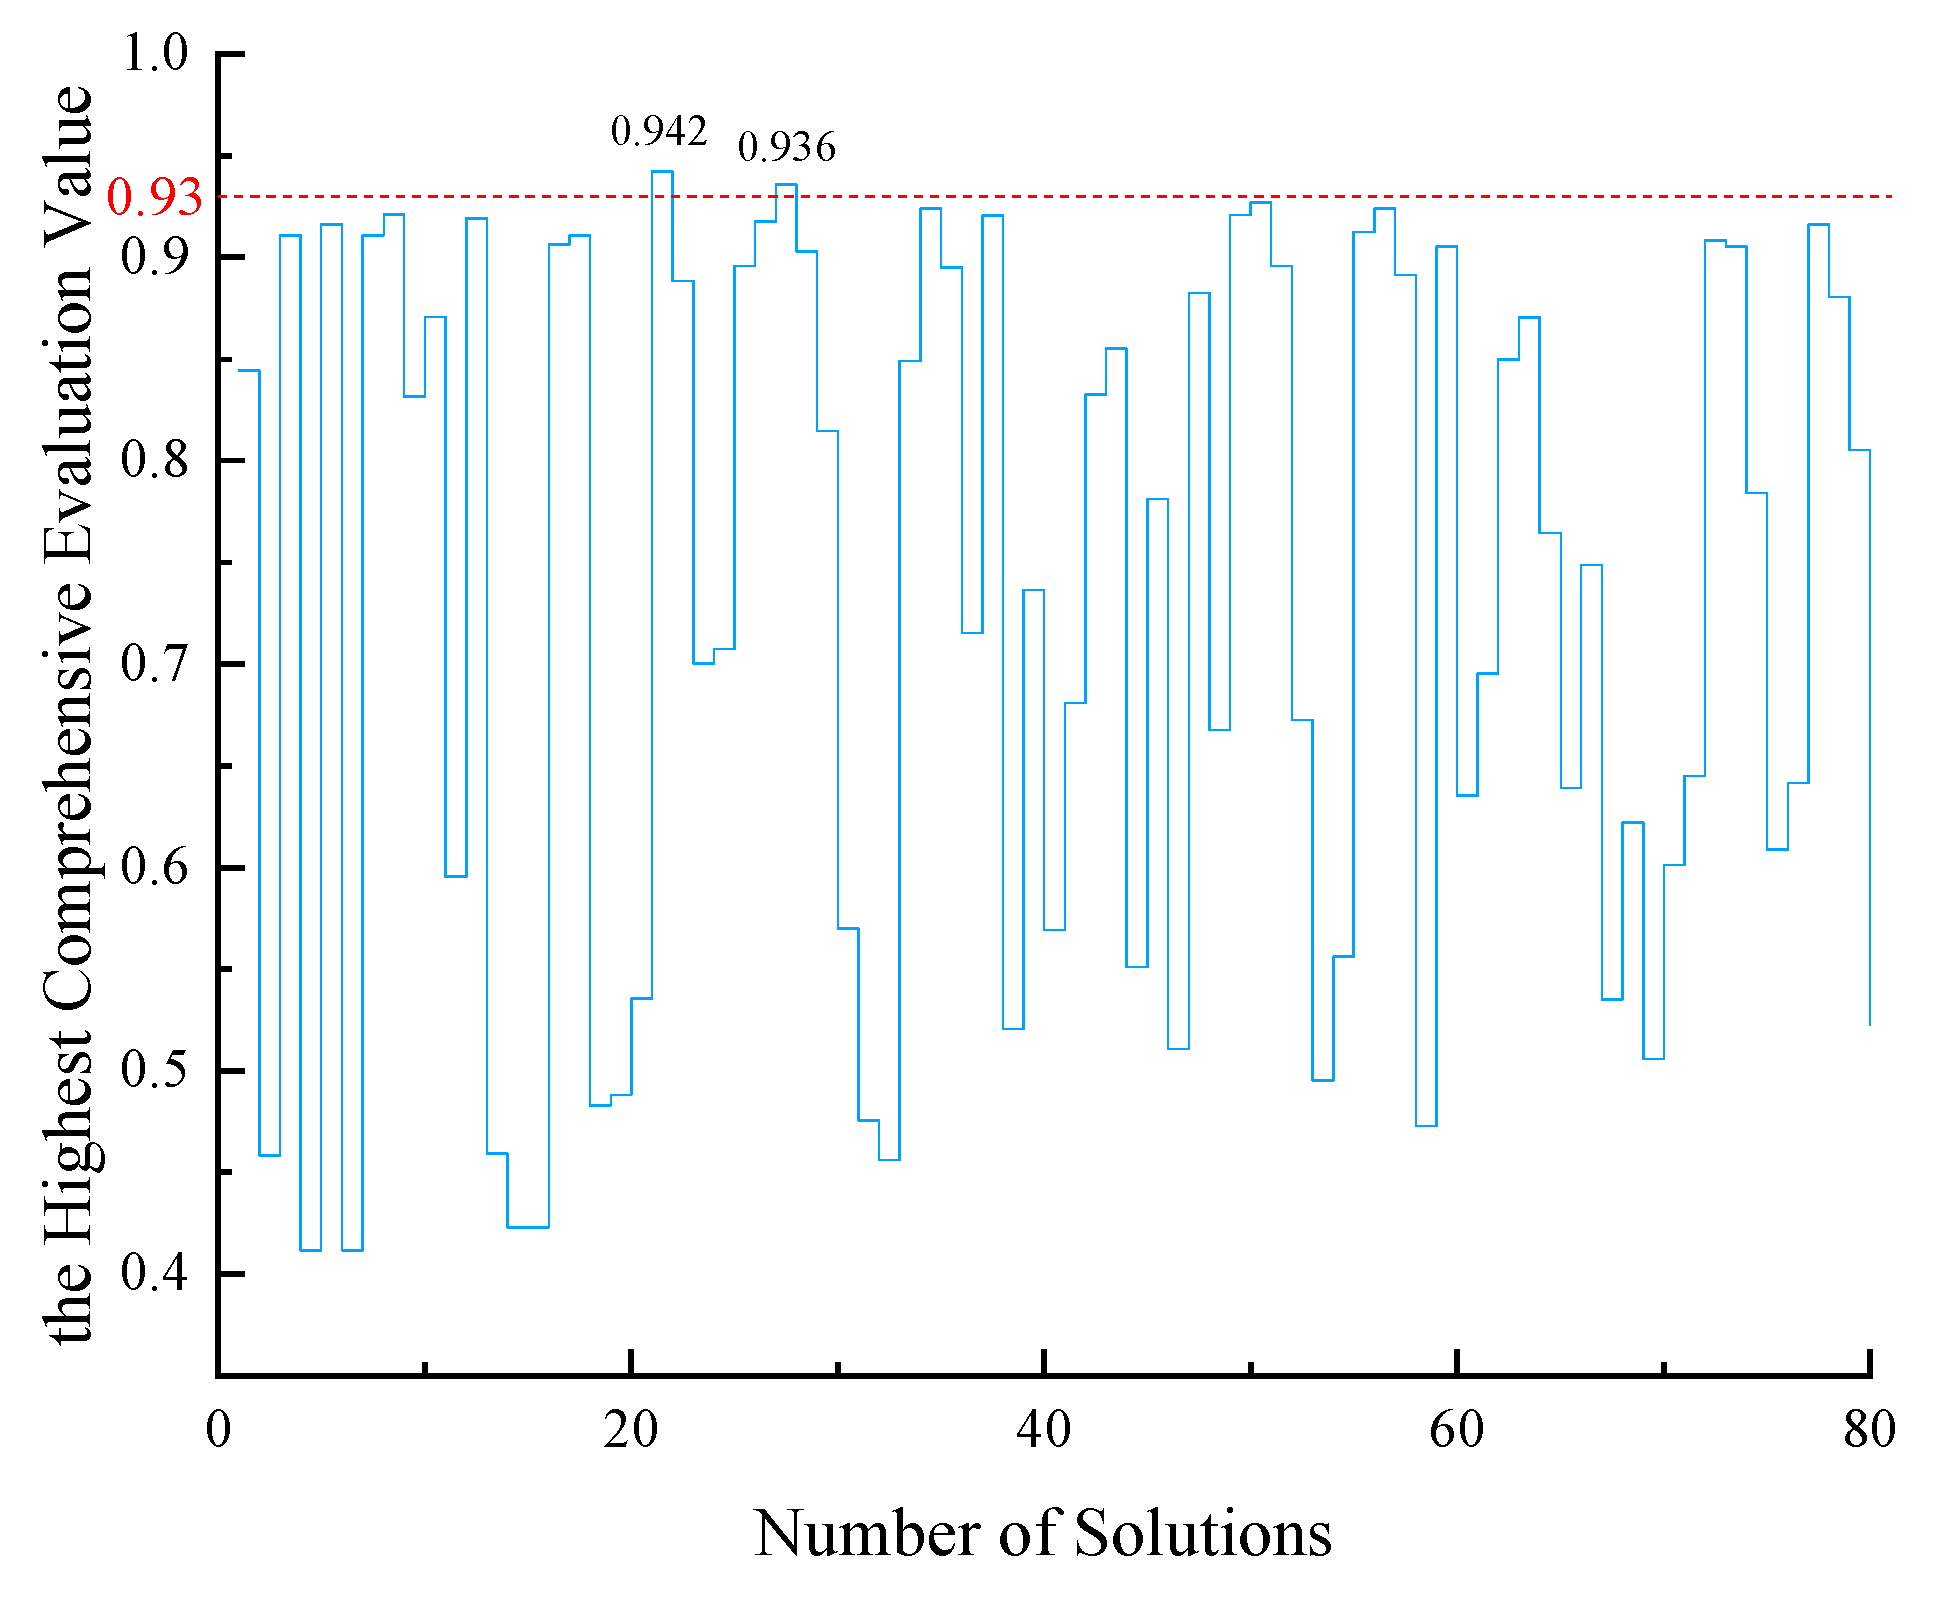
4.3. Decision Results

As multi-attribute decision-making is executed with TOPSIS, the original data matrix was combined with the index type (general forward processing) to obtain the forward initial decision matrix. The target properties of grouting material in this study were 13.13 MPa for the 7dUCS, 271.76 min for the initial setting time, and 725.85 mPa·s for the slurry viscosity which belongs to the intermediate index. The intermediate index needs to be changed into maximum index through the conversion formula:
a i j = 1 abs ( x i j x b e s t ) max { abs ( x i j x b e s t ) } , ( i = 1 , 2 , , n ; j = 1 , 2 , , m )
where x i j is the index value of the i-th alternative under the evaluation index j; a i j is the index value of the i-th alternative under the evaluation index j after forwarding processing.
Since the main purpose is to improve the strength of the working body in grouting engineering, and the slurry viscosity is not as important as the initial setting time, the non-numerical order of the three properties of the grouting material is 7dUCS > initial setting time > slurry viscosity.
According to the research of Taboada [40], 5000 iterations are enough to realize the determination of the solutions as the NNRP method is used to determine the optimal solutions for three or four attributes. In this paper, the maximum iteration number was set to 5000 when preparing the optimal solutions for fly ash grouting material. The determination results are shown in Figure 6. The horizontal axis is the serial number of the solutions and the vertical axis is the highest comprehensive evaluation value of the solutions. The blue line shows the variation of the highest comprehensive evaluation value of different solutions, while the red line is plotted to highlight the optimal solutions. Two solutions are above 0.93. They are No. 21 with the highest comprehensive evaluation value of 0.942, followed by No. 27, with the highest comprehensive evaluation value of 0.936. The two solutions were selected as the optimal solutions and their relevant parameters are shown in Table 4. The 7dUCS of the two solutions are almost equal, the initial setting times are about 305 min, and the viscosities are less than 740 mPa·s.

5. Conclusions

In this paper, the Box–Behnken design method was used to conduct the experiment, and the response surface regression model was established based on the 7dUCS, viscosity, initial setting time, and the raw materials ratio. Then, the genetic algorithm NSGA-II was used to optimize the fly ash grouting material mixture ratio with multiple objectives. Finally, the optimal solution was selected through NNRP-TOPSIS. This method increases the recovery and utilization of solid waste, and it is beneficial to reduce environmental pollution caused by fly ash. The main conclusions of this paper are as follows:
(1)
Based on RSM-BBD, the response surface regression model was established based on 7dUCS, viscosity, initial setting time, and the raw materials ratio. Their correlation coefficients were 0.9688, 0.9907, and 0.9996, respectively, indicating that the fitting effect is good. The effects of w/c, silica fume content, and sodium silicate content were consistent with the previous research results on the properties of solid waste fly ash grouting materials.
(2)
The 7dUCS and viscosity of fly ash grouting material decrease, while the initial setting time increases with the increase of w/c. 7dUCS increases with the increase of silica fume and sodium silicate content, while the initial setting time and viscosity change slightly with the increase of silica fume content. The initial setting time decreases, while slurry viscosity increases with the increase of sodium silicate content.
(3)
NSGA-II can realize the multi-objective optimization and obtain the Pareto solution set of fly ash grouting materials. Based on the required grouting material property, NNRP-TOPSIS can sort the Pareto solution set with the non-numerical order of 7dUCS > initial setting time > slurry viscosity. The optimal ratio of materials was selected, which is w/c of 0.71, silica fume of 1.73%, sodium silicate of 2.61%.

Author Contributions

Conceptualization, L.X.; methodology, L.X.; software, Z.Z.; validation, Z.W. (Zhijun Wan), Y.Z. and J.L.; formal analysis, Z.Z.; investigation, Z.W. (Ziqi Wang) and J.L.; resources, Z.W. (Ziqi Wang); data curation, L.X.; writing—original draft preparation, L.X. and Z.Z.; writing—review and editing, Z.W. (Zhijun Wan); visualization, L.X. and Z.Z.; supervision, Z.W. (Zhijun Wan); project administration, Y.Z.; funding acquisition, Z.W. (Zhijun Wan). All authors have read and agreed to the published version of the manuscript.

Funding

This research was funded by the National Natural Science Foundation of China (No.52074266), as well as the Postgraduate Research and Practice Innovation Program of Jiangsu Province (KYCX21_2361).

Data Availability Statement

All data and code used or analyzed in this study are available from the corresponding author on reasonable request.

Acknowledgments

The authors thank the financial support of the Postgraduate Research and Practice Innovation Program of Jiangsu Province (KYCX21_2361), as well as the National Natural Science Foundation of China (No.52074266) in the preliminary work and the subsequent APC. The authors would like to thank the editor and three anonymous reviewers for helpful feedback on earlier drafts of this work.

Conflicts of Interest

The authors declare no conflict of interest.

References

  1. He, Y.; Luo, Q.; Hu, H. (Eds.) Situation analysis and countermeasures of China’s fly ash pollution prevention and control. In Proceedings of the 7th International Conference on Waste Management and Technology (ICWMT), Beijing, China, 5–7 September 2012. [Google Scholar]
  2. Zhou, H.; Bhattarai, R.; Li, Y.; Si, B.; Dong, X.; Wang, T.; Yao, Z. Towards sustainable coal industry: Turning coal bottom ash into wealth. Sci. Total Environ. 2022, 804, 149985. [Google Scholar] [CrossRef] [PubMed]
  3. Shen, W.; Zhou, M.; Zhao, Q. Study on lime-fly ash-phosphogypsum binder. Constr. Build. Mater. 2007, 21, 1480–1485. [Google Scholar] [CrossRef]
  4. Cui, B.; Liu, Y.; Feng, G.; Bai, J.; Du, X.; Wang, C.; Wang, H. Experimental study on the effect of fly ash content in cemented paste backfill on its anti-sulfate erosion. Int. J. Green Energy 2020, 17, 730–741. [Google Scholar] [CrossRef]
  5. Wang, S.; Llamazos, E.; Baxter, L.; Fonseca, F. Durability of biomass fly ash concrete: Freezing and thawing and rapid chloride permeability tests. Fuel 2008, 87, 359–364. [Google Scholar] [CrossRef]
  6. Aikawa, Y.; Miyahara, S.; Atarashi, D.; Siribudhaiwan, N.; Sakai, E. Theoretical analysis of the hydration of fly ash cement. J. Ceram. Soc. Jpn. 2015, 123, 1073–1079. [Google Scholar] [CrossRef] [Green Version]
  7. Li, B.; Zhou, N.; Qi, W.; Li, A.; Cui, Z. Surface Subsidence Control during Deep Backfill Coal Mining: A Case Study. Adv. Civ. Eng. 2020, 2020, 6876453. [Google Scholar] [CrossRef]
  8. Sheng, J.; Wan, W.; Liu, D.; Jiang, F.; Li, X.; Zhang, H. Investigation of the Optimization of Unloading Mining Scheme in Large Deep Deposit Based on Vague Set Theory and Its Application. Adv. Civ. Eng. 2021, 2021, 6690861. [Google Scholar] [CrossRef]
  9. Fan, K.; Xiao, T. (Eds.) Behavior characters and control of underground pressure of fully mechanized sublevel caving mining in deep mine. In Proceedings of the International Symposium on Mining Science and Safety Technology, Jiaozuo, China, 16–19 April 2007. PEOPLES R CHINA2007. [Google Scholar]
  10. Guo, W.; Wang, H.; Chen, S. Coal pillar safety and surface deformation characteristics of wide strip pillar mining in deep mine. Arab. J. Geosci. 2016, 9, 137. [Google Scholar] [CrossRef]
  11. Chen, X.; Li, L.; Wang, L.; Qi, L. The current situation and prevention and control countermeasures for typical dynamic disasters in kilometer-deep mines in China. Saf. Sci. 2019, 115, 229–236. [Google Scholar] [CrossRef]
  12. Zhang, S.; Fan, G.; Chai, L.; Li, Q.; Chen, M.; Luo, T.; Ren, S. Disaster Control of Roof Falling in Deep Coal Mine Roadway Subjected to High Abutment Pressure. Geofluids 2021, 2021, 8875249. [Google Scholar] [CrossRef]
  13. Liu, T.; Lin, B.; Yang, W.; Liu, T.; Zhai, C. An integrated technology for gas control and green mining in deep mines based on ultra-thin seam mining. Environ. Earth Sci. 2017, 76, 243. [Google Scholar] [CrossRef]
  14. Hao, P.; Dong, H.; Liu, Z.; Li, J.; Jing, L. (Eds.) Brief analysis of floor grouting method in soft rock roadway based on engineering materials and engineering mechanics. In Proceedings of the 3rd International Conference on Mechanical Engineering, Industry and Manufacturing Engineering (MEIME 2013), Wuhan, China, 22–23 June 2013. [Google Scholar]
  15. Wang, Q.; Gao, H.; Yu, H.; Jiang, B.; Liu, B. Method for Measuring Rock Mass Characteristics and Evaluating the Grouting-Reinforced Effect Based on Digital Drilling. Rock Mech. Rock Eng. 2019, 52, 841–851. [Google Scholar] [CrossRef]
  16. Zhu, Y. (Ed.) Research on Control Technology and Structural Characteristics of Very Instable Surrounding Rocks in Structural Belt. In Proceedings of the International Conference on Civil Engineering and Building Materials (CEBM), Kunming, China, 29–31 July 2011. [Google Scholar]
  17. Dou, J.; Zhou, M.; Wang, Z.; Wang, K.; Yuan, S.; Jiang, M.; Zhang, G. Case Study: In Situ Experimental Investigation on Overburden Consolidation Grouting for Columnar Jointed Basalt Dam Foundation. Geofluids 2020, 2020, 1865326. [Google Scholar] [CrossRef]
  18. Zhang, G.; Yuan, S.; Sui, W.; Qian, Z. Experimental Investigation of the Pressure and Water Pressure Responses of an Inclined Shaft Wall During Grouting. Mine Water Environ. 2020, 39, 256–267. [Google Scholar] [CrossRef]
  19. Li, X.; Zhong, D.; Ren, B.; Fan, G.; Cui, B. Prediction of curtain grouting efficiency based on ANFIS. Bull. Eng. Geol. Environ. 2019, 78, 281–309. [Google Scholar] [CrossRef]
  20. He, W.; Gao, X.; Feng, X. (Eds.) Research on Pre-Grouting Technique of Blind Shaft of Metal Mine in Southwest China. In Proceedings of the 6th International Conference on Environmental Science and Civil Engineering (ESCE), Nanchang, China, 4–5 January 2020. [Google Scholar]
  21. Zheng, G.; Pan, J.; Cheng, X.; Bai, R.; Du, Y.; Diao, Y.; Ng, C.W.W. Use of Grouting to Control Horizontal Tunnel Deformation Induced by Adjacent Excavation. J. Geotech. Geoenviron. Eng. 2020, 146, 05020004. [Google Scholar] [CrossRef]
  22. Hao, C.; Feng, G.; Wang, P. Proportion optimization of grouting materials for roadways with soft surrounding mass. Int. J. Green Energy 2021, 18, 203–218. [Google Scholar] [CrossRef]
  23. Zhang, C.; Yang, J.; Fu, J.; Wang, S.; Yin, J.; Xie, Y. Recycling of discharged soil from EPB shield tunnels as a sustainable raw material for synchronous grouting. J. Clean. Prod. 2020, 268, 121947. [Google Scholar] [CrossRef]
  24. Mao, J.-H.; Yuan, D.-J.; Jin, D.-L.; Zeng, J.-F. Optimization and application of backfill grouting material for submarine tunnel. Constr. Build. Mater. 2020, 265, 120281. [Google Scholar] [CrossRef]
  25. Zhang, S.; Qiao, W.-G.; Wu, Y.; Fan, Z.-W.; Zhang, L. Optimization of microfine-cement-based slurry containing microfine fly ash and nano-CaCO3 for microfracture grouting. Bull. Eng. Geol. Environ. 2021, 80, 4821–4839. [Google Scholar] [CrossRef]
  26. Mallick, H.; Ma, S.; Franzosa, E.A.; Vatanen, T.; Morgan, X.C.; Huttenhower, C. Experimental design and quantitative analysis of microbial community multiomics. Genome Biol. 2017, 18, 228. [Google Scholar] [CrossRef]
  27. Xu, Z.; Liao, Q. Gaussian Process Based Expected Information Gain Computation for Bayesian Optimal Design. Entropy 2020, 22, 258. [Google Scholar] [CrossRef] [Green Version]
  28. Li, Z.; Lu, D.; Gao, X. Optimization of mixture proportions by statistical experimental design using response surface method—A review. J. Build. Eng. 2021, 36, 102101. [Google Scholar] [CrossRef]
  29. Narenderan, S.T.; Meyyanathan, S.N.; Karri, V. Experimental design in pesticide extraction methods: A review. Food Chem. 2019, 289, 384–395. [Google Scholar] [CrossRef]
  30. Ferdosian, I.; Camoes, A. Eco-efficient ultra-high performance concrete development by means of response surface methodology. Cem. Concr. Compos. 2017, 84, 146–156. [Google Scholar] [CrossRef]
  31. Zhang, C.; Yang, J.; Fu, J.; Wang, S.; Yin, J.; feng Ou, X.; Xie, Y. Optimal formulation design of polymer-modified cement based grouting material for loose deposits. Constr. Build. Mater. 2020, 261, 120513. [Google Scholar] [CrossRef]
  32. Xie, C.; Cao, M.; Lv, X. Optimization of calcium carbonate whisker reinforced cement paste for rheology and fracture properties using response surface methodology. Fatigue Fract. Eng. Mater. Struct. 2021, 44, 859–875. [Google Scholar] [CrossRef]
  33. Tian, Z.; Zhang, Z.; Zhang, K.; Tang, X.; Huang, S. Statistical modeling and multi-objective optimization of road geopolymer grouting material via RSM and MOPSO. Constr. Build. Mater. 2021, 271, 121534. [Google Scholar] [CrossRef]
  34. Box, G.E.P.; Wilson, K.B. On the Experimental Attainment of Optimum Conditions. In Breakthroughs in Statistics: Methodology and Distribution; Kotz, S., Johnson, N.L., Eds.; Springer: New York, NY, USA, 1992; pp. 270–310. [Google Scholar]
  35. Deb, K.; Pratap, A.; Agarwal, S.; Meyarivan, T. A fast and elitist multiobjective genetic algorithm: NSGA-II. IEEE Trans. Evol. Comput. 2002, 6, 182–197. [Google Scholar] [CrossRef] [Green Version]
  36. Jaber, A.; Lafon, P.; Younes, R. A branch-and-bound algorithm based on NSGAII for multi-objective mixed integer nonlinear optimization problems. Eng. Optim. 2021, 1–19, ahead of print. [Google Scholar] [CrossRef]
  37. Huang, Y.; Fei, M. Motion Planning of Robot Manipulator Based on Improved NSGA-II. Int. J. Control. Autom. Syst. 2018, 16, 1878–1886. [Google Scholar] [CrossRef]
  38. Chaki, S.; Bathe, R.N.; Ghosal, S.; Padmanabham, G. Multi-objective optimisation of pulsed Nd:YAG laser cutting process using integrated ANN-NSGAII model. J. Intell. Manuf. 2018, 29, 175–190. [Google Scholar] [CrossRef]
  39. Ching-Lai Hwang, K.Y. Multiple Attribute Decision Making: Methods and Applications; Springer: Berlin, Germany, 1981. [Google Scholar]
  40. Taboada, H.A.; Coit, D.W. Multi-objective scheduling problems: Determination of pruned Pareto sets. IIE Trans. 2008, 40, 552–564. [Google Scholar] [CrossRef]
  41. Carrillo, V.M.; Aguirre, O.; Taboada, H. (Eds.) Applications and performance of the non-numerical ranking preferences method for post-Pareto optimality. In Proceedings of the Conference of the Complex Adaptive Systems on Responding to Continuous Global Change in Systems Needs, Chicago, IL, USA, 30 October–2 November 2011. [Google Scholar]
  42. Zhang, J.; Cai, J.; Pei, J.; Li, R.; Chen, X. Formulation and performance comparison of grouting materials for semi-flexible pavement. Constr. Build. Mater. 2016, 115, 582–592. [Google Scholar] [CrossRef]
  43. Wang, X.Q.; Wen, P.H.; Gao, Z.W.; Wang, C.H. (Eds.) Research on influence of water-cement ratio on workability and mechanical properties of geopolymer grouting material. In Proceedings of the 2nd International Conference on New Material and Chemical Industry (NMCI), Sanya, China, 18–20 November 2018. [Google Scholar]
  44. Su, H.; Li, R.; Yang, M. An experimental study of modified physical performance test of low-temperature epoxy grouting material for grouting joints with tenon and mortise. J. Intell. Manuf. 2021, 32, 667–677. [Google Scholar] [CrossRef]
  45. Zhang, Y.; Wang, S.; Li, L.; Han, J.; Zhang, B.; Hou, D.; Wang, J.; Lin, C. A preliminary study of the properties of potassium phosphate magnesium cement-based grouts admixed with metakaolin, sodium silicate and bentonite. Constr. Build. Mater. 2020, 262, 119893. [Google Scholar] [CrossRef]
Figure 1. The grouting material mixture ratio optimization process framework consists of Box–Behnken design of response surface methodology (RSM-BBD), non-dominated sorting genetic algorithm-II (NSGA-II), and technique for order preference by similarity to ideal solution based on non-numerical ranking preferences method (NNRP + TOPSIS).
Sustainability 14 00399 g001
Figure 2. Scatter plot of actual and predicted grouting material properties: (a) 7dUCS; (b) initial setting time; (c) viscosity.
Sustainability 14 00399 g002
Figure 3. Effect of response surface parameters on (a) 7dUCS, (b) initial setting time, and (c) viscosity of materials. (Controlling other variables, coded values of w/c (X1), silica fume content (X2), and sodium silicate content(X3) are all 0).
Sustainability 14 00399 g003
Figure 4. Effect of response surface interaction parameters on properties of grouting materials. (a) 3-D Surface plot for 7dUCS with the interaction of w/c and silica fume content; (b) 3-D Surface plot for 7dUCS with the interaction of w/c and silica silicate content.
Sustainability 14 00399 g004
Figure 5. Pareto solutions with NSGA-II on (a) 7dUCS, initial setting time, and viscosity; (b) 7dUCS and viscosity; (c) initial setting time and viscosity; (d) 7dUCS and initial setting time.
Sustainability 14 00399 g005
Figure 6. The highest comprehensive evaluation index of each solution.
Sustainability 14 00399 g006
Table 1. The main performance indexes of raw materials.
Raw MaterialsMain Performance Indexes
CementSetting time/minCompressive strength/MPaFlexural strength/MPa
Initial settingFinal setting3 d28 d3 d28 d
≥45≤300≥22≥46≥3.5≥6.5
Fly ashcomponentSiO2Al2O3Fe2O3CaOK2ONa2OOthers
content58.3%24.6%5.4%4.6%2.0%2.0%3.1%
Sodium silicateDensity
(g/cm3)
Water insoluble content/%Sodium oxide content/%Modulus/MSilica content/%Baume degrees
1.3870.468.33.326.540
Table 2. Input values of RSM-BBD variables.
Code Valuew/cSilica Fume Content/%Sodium Silicate Content/%
−10.611
00.823
1135
Table 3. Analysis of variance with the regression model of the properties of grouting material.
Source of Variation7dUCSInitial Setting TimeViscosity
F-Valuep-ValueF-Valuep-ValueF-Valuep-Value
Model334.94<0.00011089.30<0.000119,640.77<0.0001
X12773.55<0.00018537.16<0.00011.656 × 105<0.0001
X259.370.0016.730.035814.120.0071
X320.890.0026759.38<0.000111,076.17<0.0001
X1X210.830.01330.0530.82520.0950.7664
X1X39.960.01600.0530.82524.950.0615
X2X30.120.73480.0530.82520.0950.7664
Lack of Fit6.260.05445.200.07261.590.3247
Table 4. Values table of the optimal solution of the model.
No.Real Values of InputsValues of Outputs
w/cSilica Fume/%Sodium Silicate/%7dUCS/MPaInitial Setting Time/minViscosity/mPa·s
10.711.732.6113.106304.013738.284
20.711.812.2713.103307.790733.982
Publisher’s Note: MDPI stays neutral with regard to jurisdictional claims in published maps and institutional affiliations.

