Article

A Data Fusion Model to Merge the Spectra Data of Intact and Powdered Cayenne Pepper for the Fast Inspection of Antioxidant Properties

by
Kusumiyati Kusumiyati
1,*,
Ine Elisa Putri
1,
Agus Arip Munawar
2 and
Diding Suhandy
3
1
Department of Agronomy, Faculty of Agriculture, Universitas Padjadjaran, Sumedang 45363, Indonesia
2
Department of Agricultural Engineering, Faculty of Agriculture, Syiah Kuala University, Banda Aceh 23111, Indonesia
3
Department of Agricultural Engineering, Faculty of Agriculture, University of Lampung, Bandar Lampung 35145, Indonesia
*
Author to whom correspondence should be addressed.
Sustainability 2022, 14(1), 201; https://doi.org/10.3390/su14010201
Submission received: 18 November 2021 / Revised: 20 December 2021 / Accepted: 22 December 2021 / Published: 25 December 2021
(This article belongs to the Special Issue Sustainable Agrifood Technologies)

Abstract

:
Spectroscopy technology has been widely used for the quality assessment of agricultural products, but the models produced in recent studies usually focus on only one sample form. Meanwhile, most products, especially cayenne pepper, are not only in the form of fresh samples but also in powder. Therefore, the research used visible/near-infrared (Vis/NIR) spectroscopy to predict the antioxidant properties using a fusion model derived from both intact and powdered cayenne pepper. The parameters used to determine these properties include the %inhibition, antioxidant activity, and antioxidant capacity. The results showed that the fusion model at %inhibition was 0.90 (Rcal), 7.63 (RMSEC), 0.84 (Rpred), and 9.16 (RMSEP) while the antioxidant activity had 0.94, 181.82, 0.81 and 340.06, whereas antioxidant capacity produced 0.94, 14.42, 0.82 and 22.64 for Rcal, RMSEC, Rpred, and RMSEP, respectively. The Vis/NIR spectroscopy was able to predict the antioxidant properties in both the intact and powdered cayenne pepper using the fusion model.

1. Introduction

Cayenne pepper is a widely cultivated commodity in several countries and is observed to be in great demand by the public in Indonesia. Its quality, however, depends on the variety, maturity levels, cultivation techniques, growing environment, and post-harvest handling which, thereby, constitutes part of the determinants of consumer acceptance. It is important to note that this agricultural product can be consumed as whole fruit and after it has been processed into different products in the market, such as the powder form, which is widely used as a mixed seasoning in cooking.
There is presently public awareness on health, especially on food intake, and antioxidant compounds have been discovered to be one of the most sought-after for consumption due to the several benefits they provide for the human body. These include their ability to increase body immunity and alter the metabolic activation and detoxification of carcinogens [1]. These antioxidant compounds are naturally available in different vegetables and fruit commodities such as cayenne pepper, which contains several phytochemicals well known for their antioxidant properties such as capsaicinoids, carotenoids, and phenolic compounds [2]. The researchers in the health sector, therefore, showed that a maximum of 50 g/day is recommended to be consumed [3]. It is, however, important to note that it is possible to quantitatively express the antioxidant compounds using certain properties such as %inhibition, antioxidant activity, and antioxidant capacity which certain differences. The capability of the compound to scavenge free radicals is represented as the percentage inhibition [4]. Meanwhile, the kinetics of the response between an antioxidant and the reduced or scavenged prooxidant or radical is referred to as the antioxidant activity while the antioxidant capacity quantifies the oxidant probe’s thermodynamic conversion efficiency in the presence of an antioxidant [5]. Moreover, the activity of each fraction as a free radical scavenger was measured by comparing its absorbance to a blank solution (no sample) [4]. The antioxidant activity was expressed by IC50, which is the concentration of antioxidants needed to inhibit 50% of free radicals, while the antioxidant capacity was evaluated based on equivalency testing (ET), which is expressed as a comparison such as Trolox, gallic acid, and vitamin C [6,7,8].
The 2,2-diphenyl-1-picrylhydrazyl (DPPH) radical scavenging assay is currently being used as the method to determine antioxidants [9]. This method involves the application of a spectrophotometer as a measuring instrument, requires expertise and time, and is also reported to be expensive and complex. The emergence of spectroscopy technology in the last few decades has been used for the quality control of agricultural products such as the fruit ripeness index [10,11,12]. It has also been applied to predict the fruit quality properties [13,14,15,16]. Moreover, the quality of agricultural products has also been predicted with a high accuracy using these spectroscopy techniques on the parameters of antioxidant properties of fresh products such as berry [17], sorghum grains [18], bean seed [19], and propolis [20]. Meanwhile, the processed products in the form of powder previously analyzed include green tea powder [21] and okra seed powder [22].
Jiang et al. [23] used the spectroscopy technique to predict the quality parameters of intact chilies while Rohaeti et al. [24] used chili powder. It has also been discovered that most studies in the field of spectroscopy have only developed calibration models on a single form sample, but there is a need to focus on the quality control of different forms of samples in the agricultural industry. This process, however, requires a lot of time, effort, and cost. Therefore, a multi-form calibration model could be developed to serve as the solution to these problems towards having a fusion model to predict the quality attributes in different sample forms. Li et al. [25] combined different cultivars of pears in a single calibration model to detect the soluble solids content (SSC) using visible/near-infrared (Vis/NIR) spectroscopy. Kusumiyati et al. [26,27] also succeeded in combining different commodities of the Cucurbitaceae family in a single calibration model. Moreover, this model was reported to be reliable, has strong potential to predict the chemical content of different products, and also ensures practicality in terms of time and cost [28]. There are, however, lack of previous studies on the development of multi-form calibration model of intact and powdered samples. Therefore, this research aimed to develop a fusion model by merging spectral data of intact and powdered cayenne peppers using Vis/NIR spectroscopy to conduct a fast inspection of antioxidant properties.

2. Materials and Methods

2.1. Cayenne Pepper Samples

There are two varieties of cayenne pepper, and these include var. Domba and var. Manik. The samples were observed to be planted in the Controlled Culture Laboratory, Faculty of Agriculture, Universitas Padjadjaran, Indonesia, with an altitude of ±730 m above sea level (masl). The intact samples were freshly harvested while the powder samples were obtained from dried and mashed intact fruits. The process involved transferring the harvested fruits to the Horticulture Laboratory, Faculty of Agriculture, Universitas Padjadjaran, where the samples were sorted according to varieties, and the stalks and adhering dirt were removed. Each sample unit consists of ±30 g and placed in a zipped plastic for numbering. A total of 100 samples were obtained from the combined intact and powdered fruit samples and further divided into 2 categories which include the calibration set with 70 samples and prediction set with 30 samples.

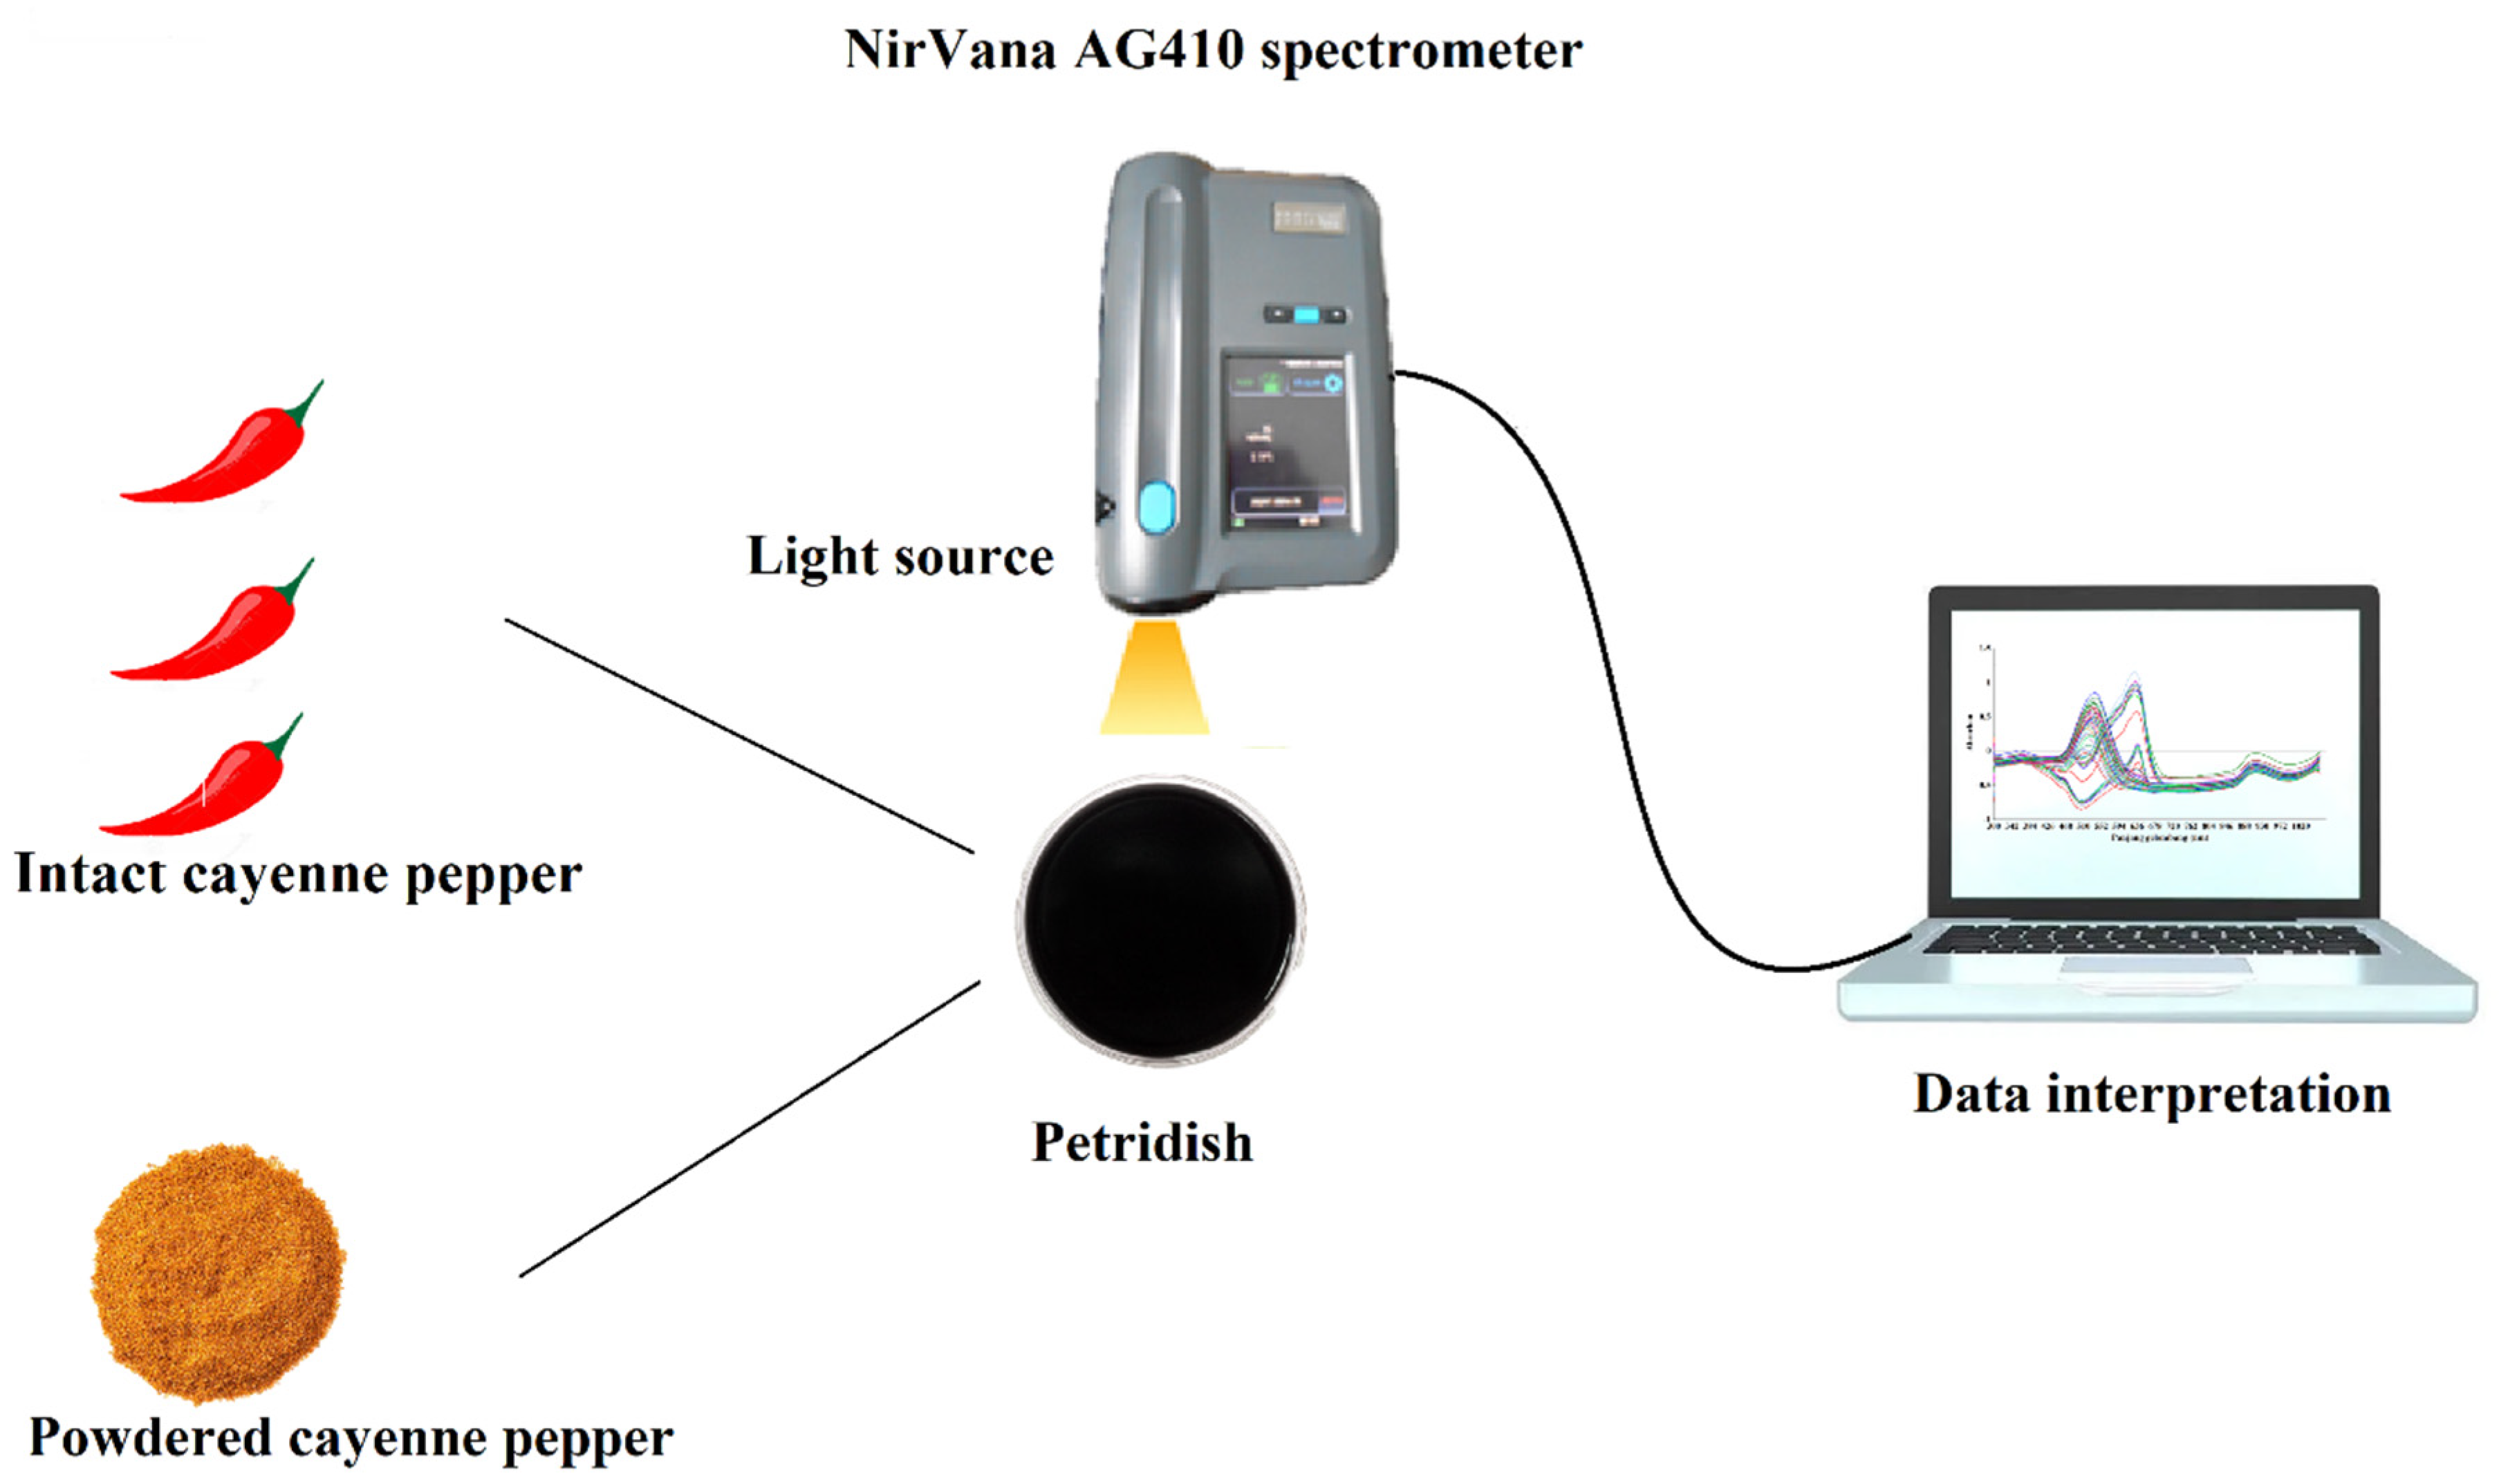
2.2. Spectra Measurement

The intact cayenne pepper in the zipped plastic was removed and placed in a Petri dish lined with black cardboard. The fruits were trimmed to ensure there are no gaps, and this was followed by the collection of data for each sample at 5 different points including the top, bottom, middle, right, and left sides of the Petridish. The original spectral data for each sample was, therefore, obtained from the average absorbance data for the 5 points. Meanwhile, the intact fruit samples were dried in an oven after the measurement according to their respective sample numbers and ground to powdery form. A similar spectral measurement process was also applied to the powdered samples, as indicated in Figure 1. A NirVana AG410 spectrometer (Integrated Spectronics Pty, Ltd., North Ryde, Australia) was applied as the measuring instrument at a wavelength of 312–1050 nm and an interval of 3 nm. However, the absorbance data was observed to have some noise and this has the ability to reduce the accuracy of the calibration model. It is, therefore, possible to reduce this noise using different spectral correction methods.

2.3. Chemical Measurements Using Antioxidant DPPH Method

The %inhibition, antioxidant activity, and antioxidant capacity were measured by UV/Vis spectrophotometer (Shimadzu UV mini 1240, Tokyo, Japan). Samples preparation involved drying the cayenne pepper using the oven (Memmert Schutzart DIN 40050-IP 20, Schwabach, Germany) at 50 °C. The dried samples were placed in a manual coffee grinder and ground up to became smooth. An amount of 0.05 g of the powdered sample was weighed and placed in a 10 mL vial, after which methanol was added and the mixture was put in a sonicator (Baku BK-2000, Guangzhou, China) for 20 min at 65 °C. Sample extractions were done in triplicate. The extraction results were later transferred to a 10 mL volumetric flask using a micropipette (Thermo Fisher Scientific, Waltham, MA, USA) and methanol was added to the mark. The extract was placed in a centrifuge (Corona 80-2 Centrifuge) for 10 min at 4000 rpm [29,30] and this was followed by the addition of DPPH solution and subsequent incubation for 30 min in a dark room. Moreover, the absorbance value was displayed using a spectrophotometer at a wavelength of 515 nm while the inhibition of DPPH free radicals was determined using the %inhibition. The IC50 value (ppm) was determined based on the relationship between the %inhibition and the concentration of the sample solution. The antioxidant capacity was obtained by comparing the IC50 ascorbic acid used as standard with the IC50 sample, and the results were expressed in mg ascorbic acid equivalent/100 g of dried weight [6].

2.4. Data Analysis

All the spectral data were translated using ISIS software (Integrated Spectronics Pty, Ltd., North Ryde, Australia) and opened in Microsoft Excel. The actual and spectral data were processed using The Unscrambler X.4 (trial version). It is, however, important to note that the original spectra data is absorbance spectra. Moreover, the multivariate analysis was conducted using the principal component analysis (PCA) and partial least squares regression (PLSR). The PCA was used to classify the data visualization of sample spectra and produced several principal components (PCs) with PC1 being the largest dataset variation followed by PC2 and others. The data were visualized based on each PC forming a new axis. Meanwhile, the PLSR was used to process the variable X (Vis/NIR spectra) and variable Y (actual data/laboratory analysis) simultaneously, and also applied as a predictor towards a series of organic materials. It also has the ability to describe the correlation accuracy between the two variables, and this means it can be quickly and precisely used to predict fruit quality. The purpose of the PLSR was to prevent the multicollinearity condition which is defined as the difficulty in distinguishing between the effects of each X variable on the Y variable due to the similarities in the X variables. This is the reason the multiple regression method is usually applied in cases with more than one number of X variables. The development of the calibration model in this research involved the application of several spectral correction methods such as the multiplicative scatter correction (MSC), standard normal variate (SNV), first derivative Savitzky–Golay (dg1), second derivative Savitzky–Golay (dg2), area normalization (AN), mean normalization (MN), de-trending (DT), Savitzky–Golay smoothing (SGS), and orthogonal signal correction (OSC). Furthermore, the best model was selected based on the evaluation of accuracy which includes the coefficient of correlation (R), root mean square errors of calibration or cross-validation (RMSEC/CV), root mean square errors of prediction (RMSEP), and the PCs.

3. Results and Discussion

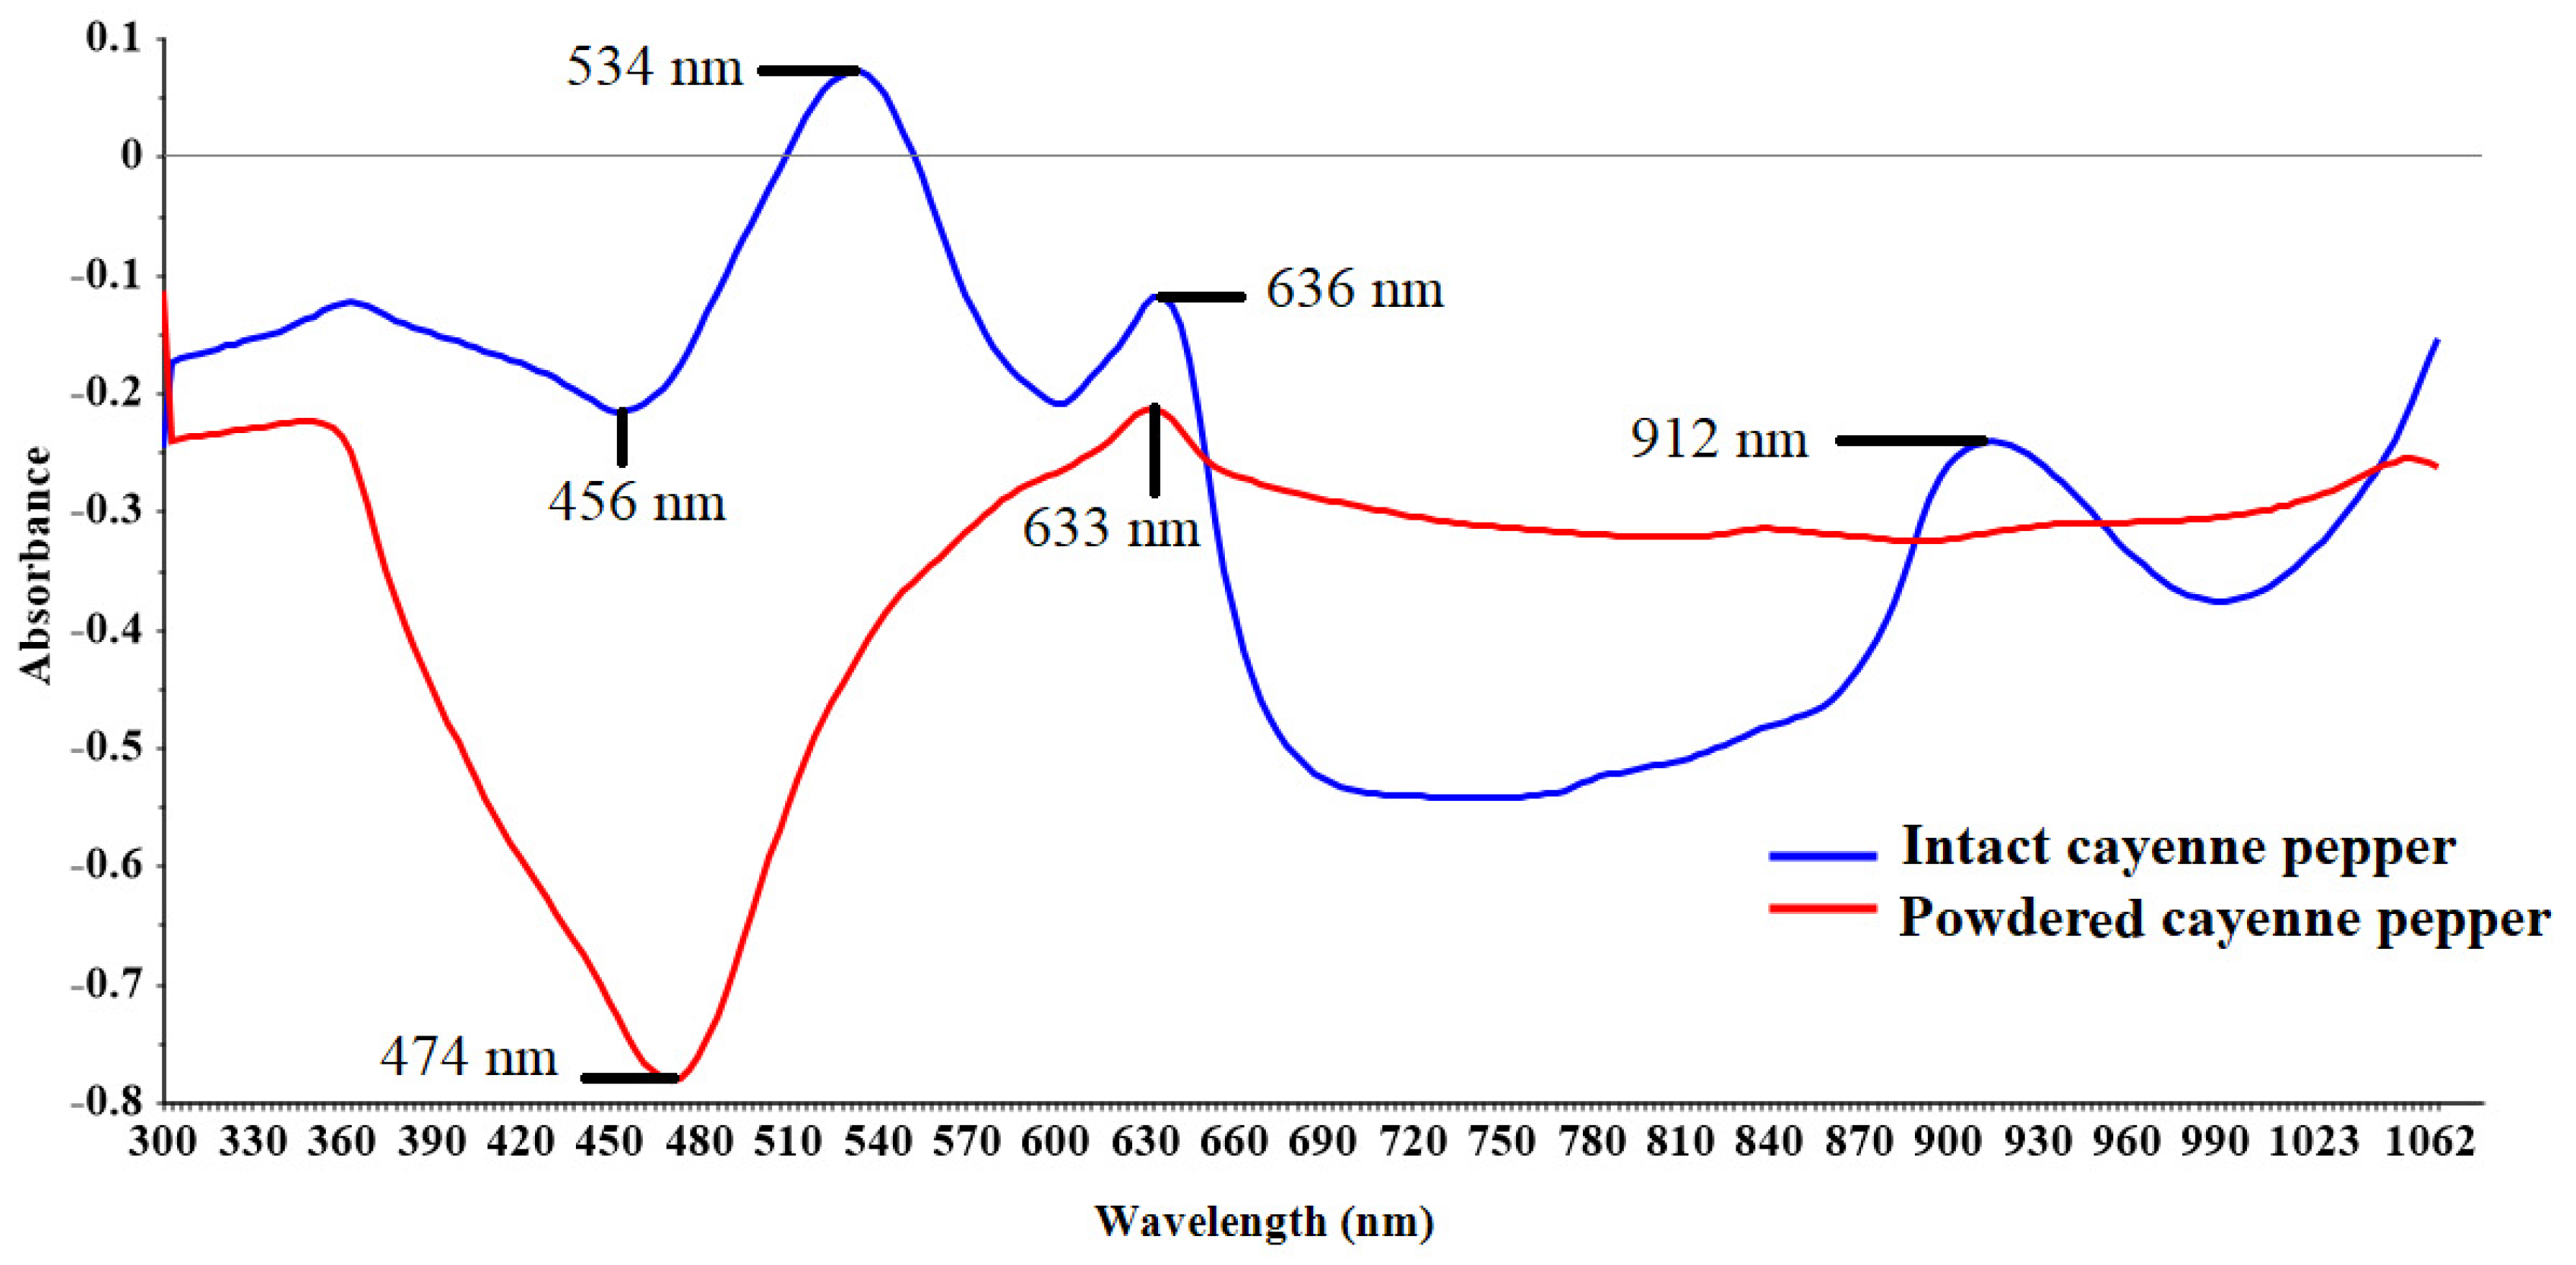
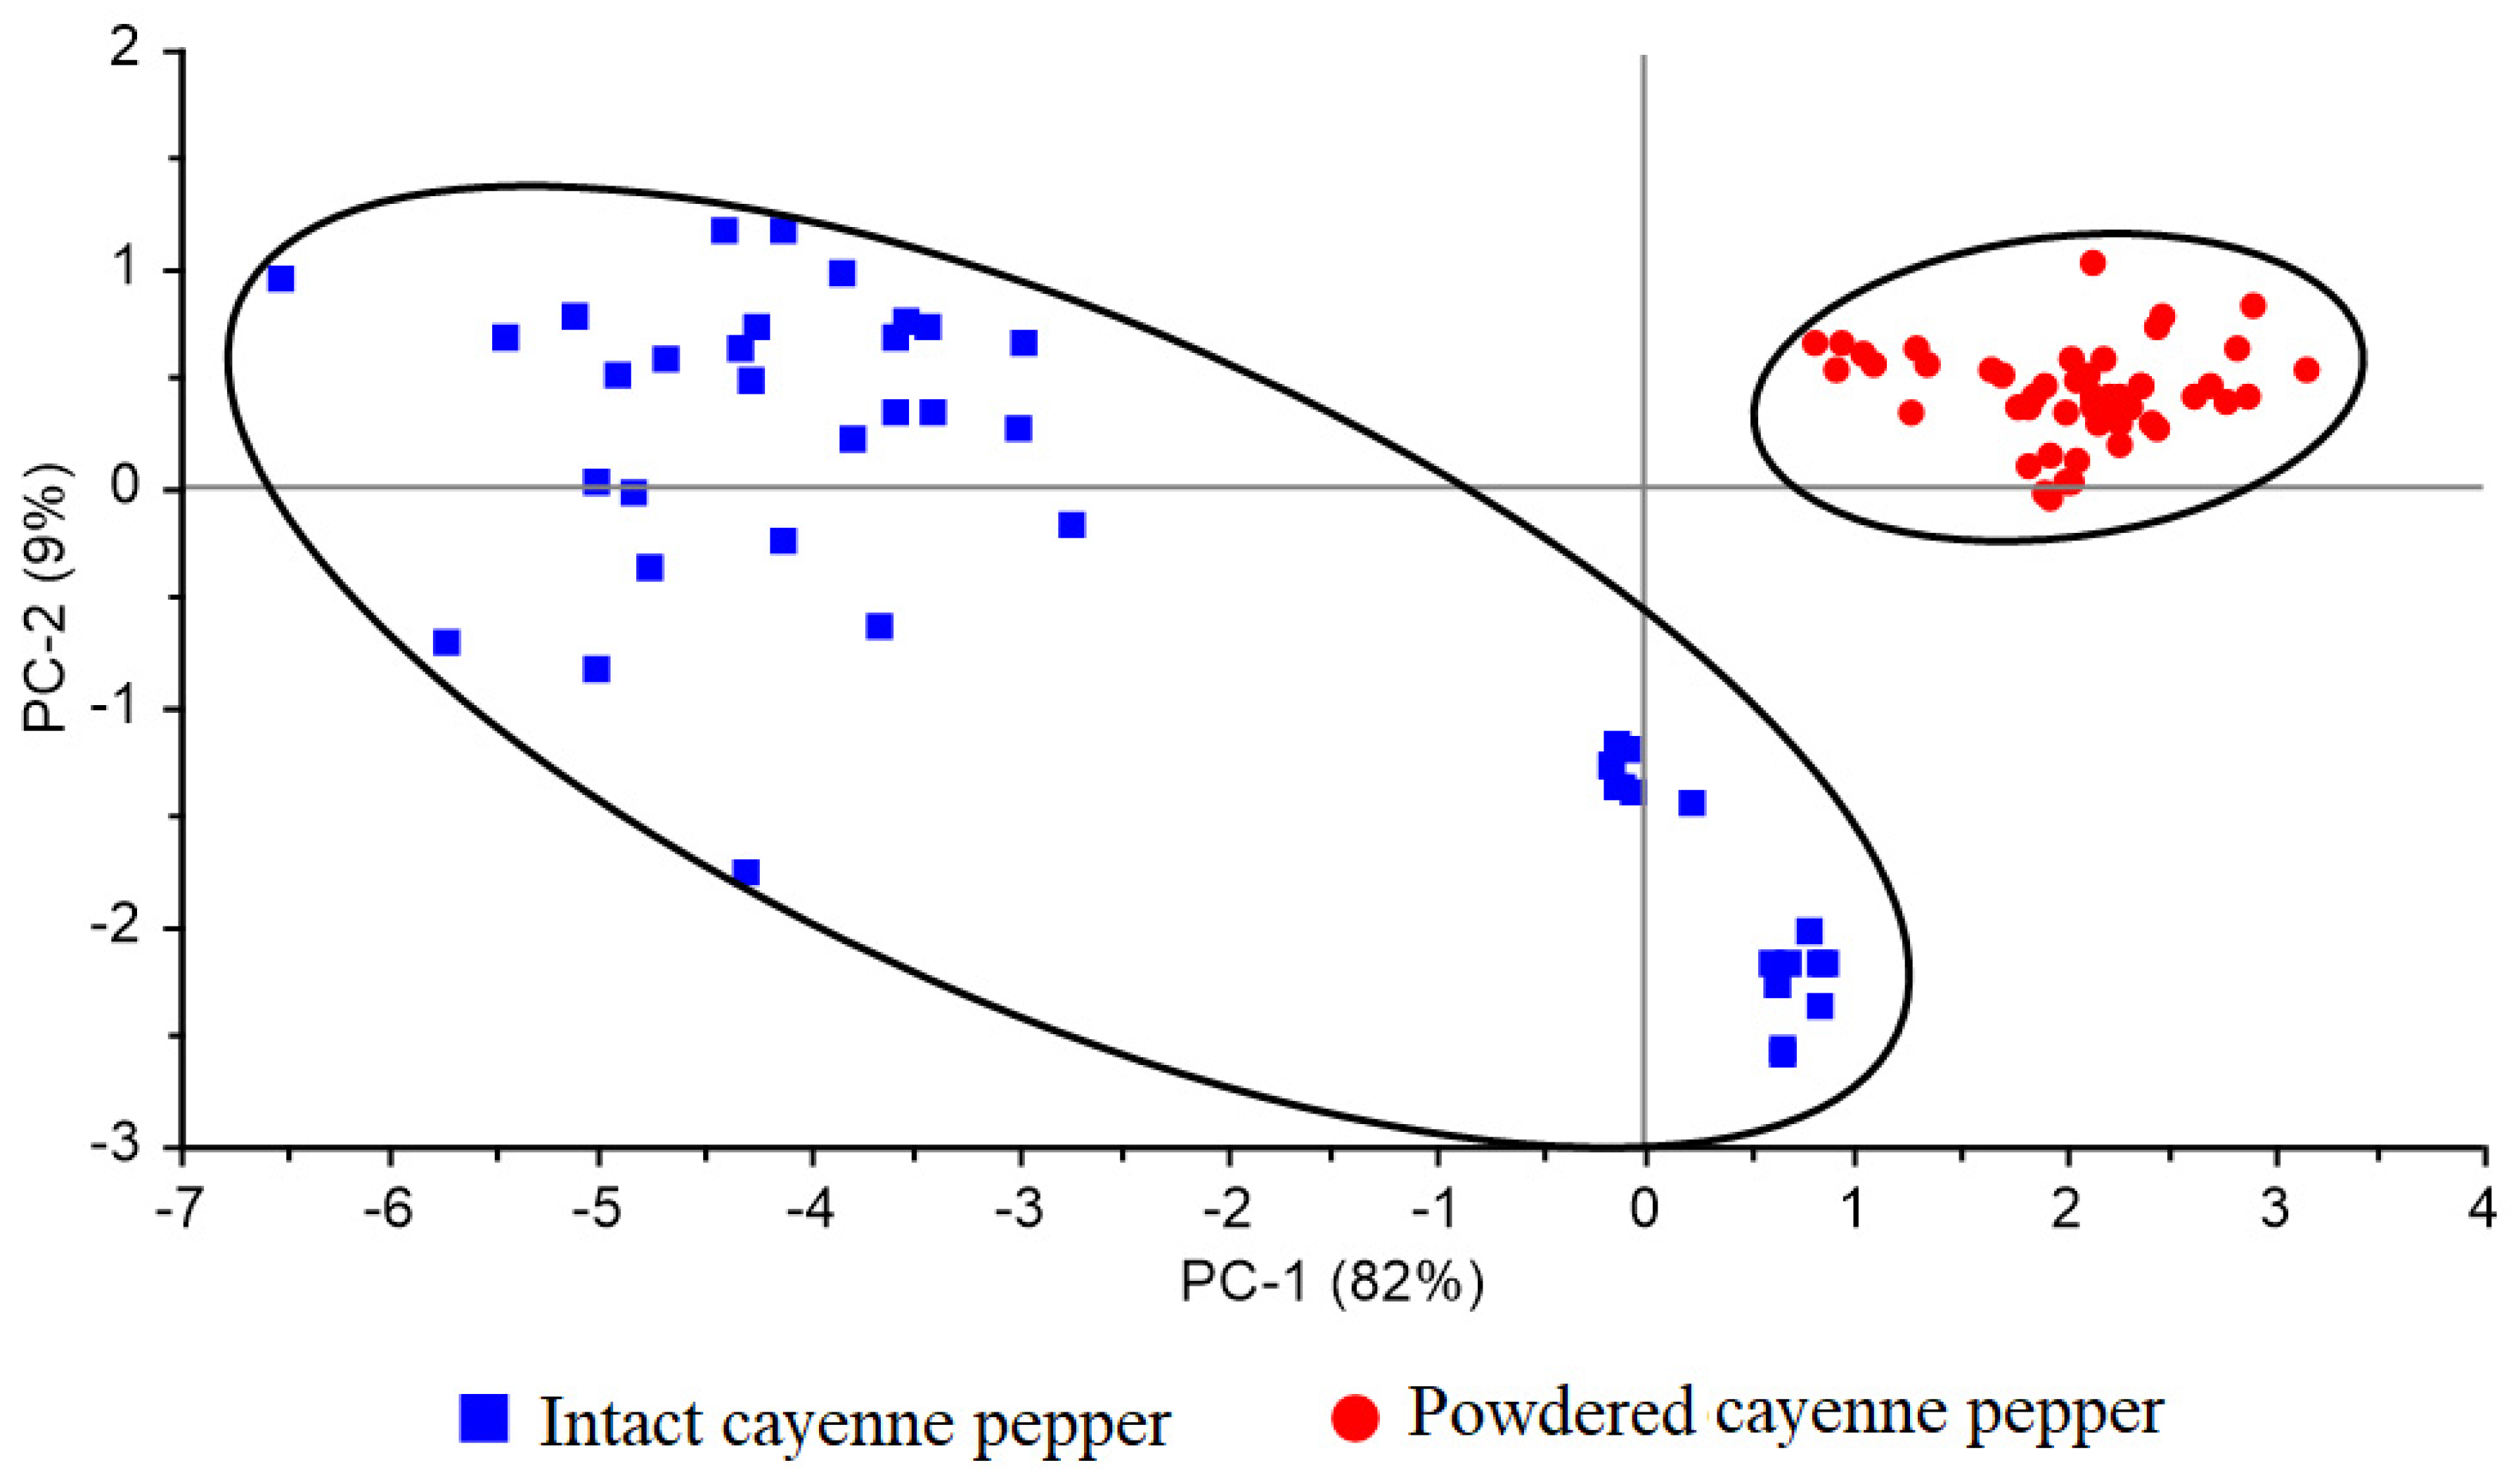
3.1. Spectral Information

The spectral data represented the information about the chemical components contained by the samples. The Vis/NIR spectra has been reported to be sensitive to products involving C–H and O–H molecular bonding responses [31]. Therefore, Figure 2 presented the average absorbance spectra for the intact and powdered cayenne pepper. Figure 2 showed that the peaks were at 456 nm, 474 nm, 534 nm, 633 nm, and 636 nm. Moreover, the range for these wavelengths was discovered to have corresponded with the absorption of the color pigment. This was indicated by 420–503 nm which was the absorption peak of the carotene and xanthophyll, as well as beta-carotene, which indicates a yellow to orange-red color, with the strongest absorption at 475 nm. Meanwhile, the absorbance peaks of xanthophylls, lutein, and violaxanthin were estimated at 435 nm with the strongest recorded between 350–500 nm. The important wavelength of the chlorophyll in the fruit sample was presented at 680 nm [12]. The findings also showed a peak at 912 nm of intact cayenne pepper, while no peak was observed for the powdered sample. Furthermore, it is important to note that the difference between the two forms is the water content such that the water absorption was observed to be dominated by O–H bonds at a wavelength of 700–2500 nm while the other peaks for water were reported at approximately 760 nm and 970 nm [32]. Color pigment is also one of the sources of antioxidant compounds, as indicated by chlorophyll and carotenoids [8,33] which are present in chili as the chlorophyll a and chlorophyll b, as well as carotenoids in the form of capsanthin, β-carotene, lycopene, etc. [34].
The typical spectral patterns for each sample form were visually grouped to determine their similarities and differences. Figure 3 shows the PCA plot was corrected using the MSC method, which is a popular method of normalization to ensure the spectra are closer to a certain reference. It is also possible to determine the mean of the data set by varying the size and offset of the spectra [35]. Moreover, Figure 3 shows the possibility of completely separating the spectra of the intact and powdered samples up to 100%, with the blue color used for the intact while the red color is for the powder. A difference was observed in the position with the intact sample placed in quadrants two, three, and four, while the powder is in quadrant one. Furthermore, PC1 produced 82% while PC2 had 9%, which means the total variation of the dataset that can be described is 91%. Therefore, PC1 and PC2 are sufficient. It is also possible to visualize the PCA results in a two-dimensional scatter plot of scores, and PC1 and PC2 were discovered to have the ability to describe over 70% of the total variance when combined, and this indicates the possibility of visualizing the effects of PCA in a two-dimensional score scatter plot [36].

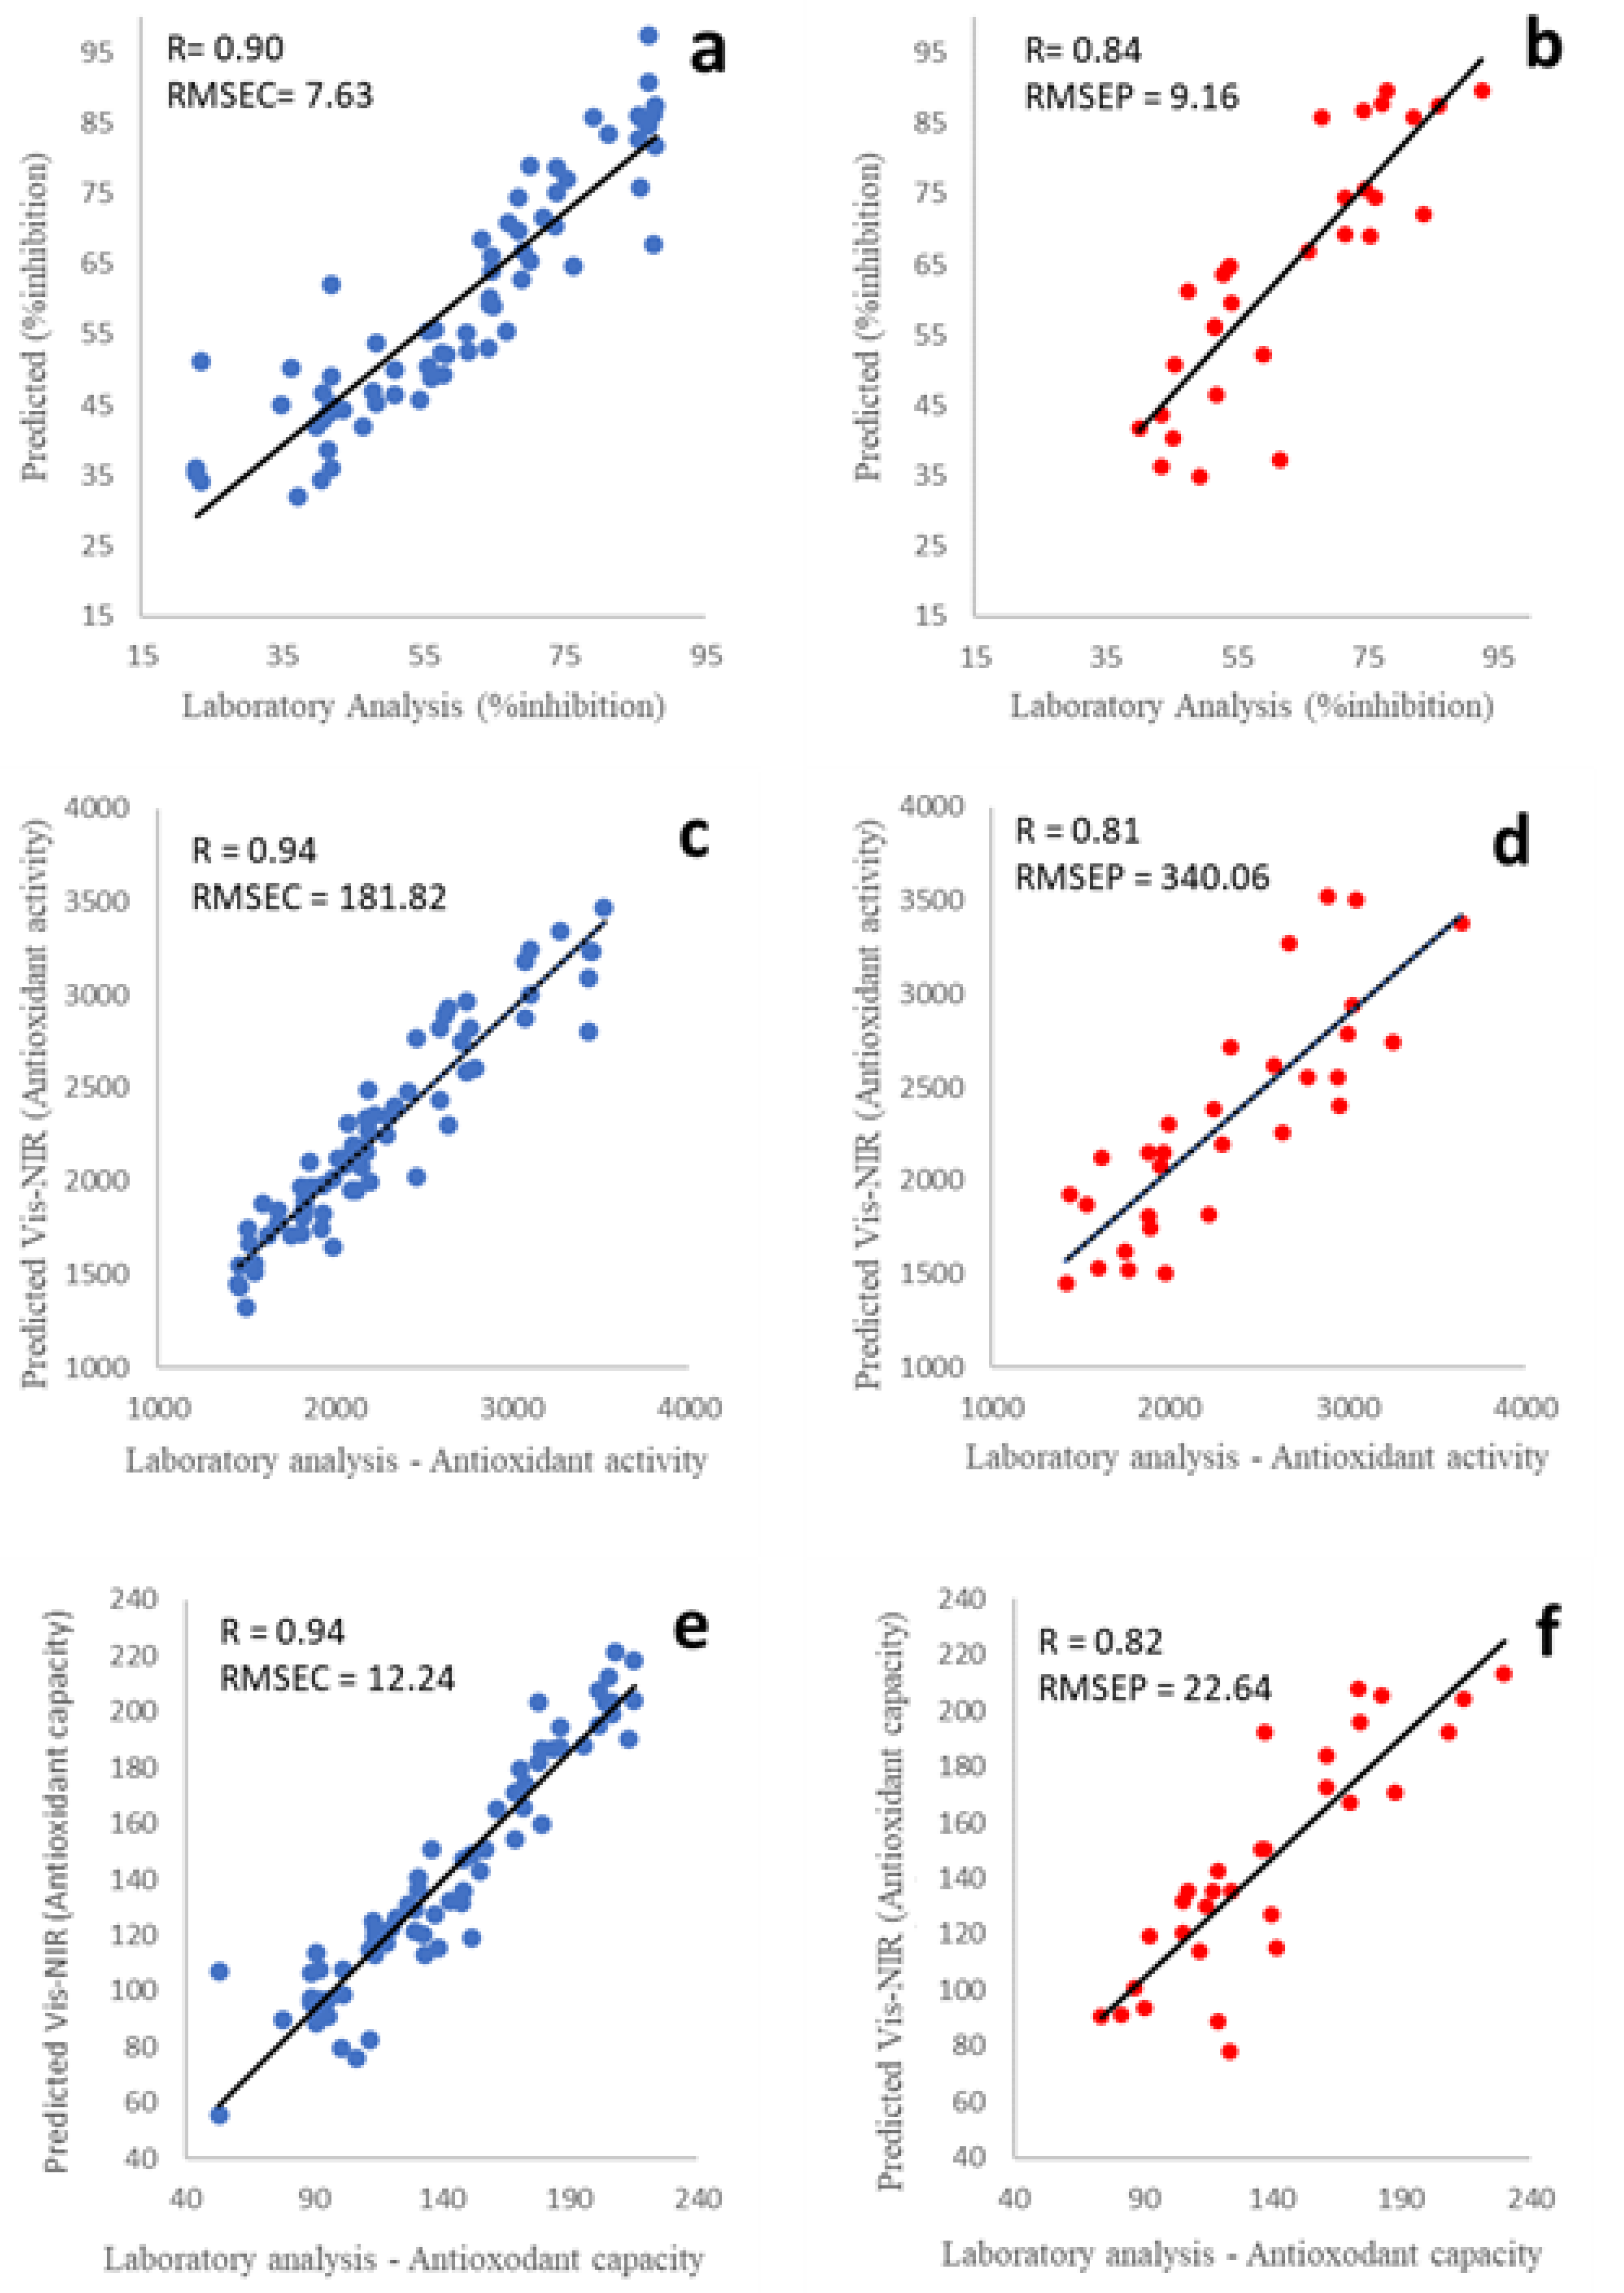
3.2. Calibration Model Development for Antioxidant Properties Prediction

Vis/NIR spectroscopy is a non-destructive method widely used to predict or detect the quality of different types of fruits. It is considered environmentally friendly and is also reported to have the ability to save time, energy, and costs. Moreover, the light emitted from the detector is basically reflected, absorbed, and transmitted after hitting an object, thereby vibrating the atoms in the object. These light spectra also interact with the different chemical constituents of the product. Therefore, the calibration model is a necessary step to determine the correlation between Vis/NIR spectroscopy and the different parameters being tested. However, the spectral data obtained tend to have a noise which has the ability to cause the calibration model to be less accurate, and this is the reason for the application of the correction methods [37]. The calibration model developed was first corrected using several correction methods to increase its accuracy.
Table 1 shows a summary of the parameters of the antioxidant properties and the different types of spectra correction methods applied. The best calibration model in the %inhibition was obtained by applying the OSC correction method, as evident in the Rcal of 0.90, the Rcv of 0.90, the Rpred of 0.84, the RMSEC of 7.63, the RMSECV of 7.79, the RMSEP of 9.16, and the PCs of 1 recorded. The difference between the calibration model with OSC and the original spectra was discovered to be the PC value, which was successfully reduced from 7 to 1 by the correction method. This is due to the ability of the OSC to process the standard effectively by eliminating information considered not to be correlated with the actual data (%inhibition), thereby substantially reducing the number of PCs needed to build the calibration model and at the same time improving the predictive ability of the model in the same spectral region [38]. Moreover, the PLSR combined with the OSC in antioxidant activity also produced the best calibration model with the PCs, Rcal, RMSEC, Rcv, RMSECV, Rpred, and RMSEP of 1, 0.94, 181.82, 0.94, 186.57, 0.81, and 340.06, respectively. This means the OSC correction method succeeded in increasing the model’s accuracy in estimating the antioxidant activity of cayenne pepper. The OSC also produced the best results for the antioxidant capacity parameter when compared to other spectra, as indicated by the PCs, Rcal, RMSEC, Rcv, RMSECV, Rpred, and RMSEP values of 1, 0.94, 14.42, 0.93, 14.80, 0.82, and 22.64, respectively. This is also in line with study reported by Lu et al. [39] about the prediction of the antioxidant properties of shallots, which resulted in an Rcal at 0.98, an Rpred at 0.96, and an RMSEC at 0.39.
OSC is effective in removing noise in the spectra and also has the ability to improve the predictive ability of the calibration model. It also facilitates model interpretation by removing a lot of noise in the X data and the parts considered to be unrelated to Y [40]. The scatter plot of the antioxidant properties for the intact and powdered cayenne pepper calibration set represented by using blue color and the prediction set represented by using red color is presented in Figure 4. The degree of correlation between the X and Y factors is also indicated in this figure, with the distribution of data corrected with the OSC discovered to be closer to the regression line, which indicates the further accuracy of the model. Moreover, the closeness of the Rcal value of the model to 1 and the RMSEC/RMSEP to 0 shows the existence of a strong correlation between the predictions of the Vis/NIR spectroscopy and the actual data [41].

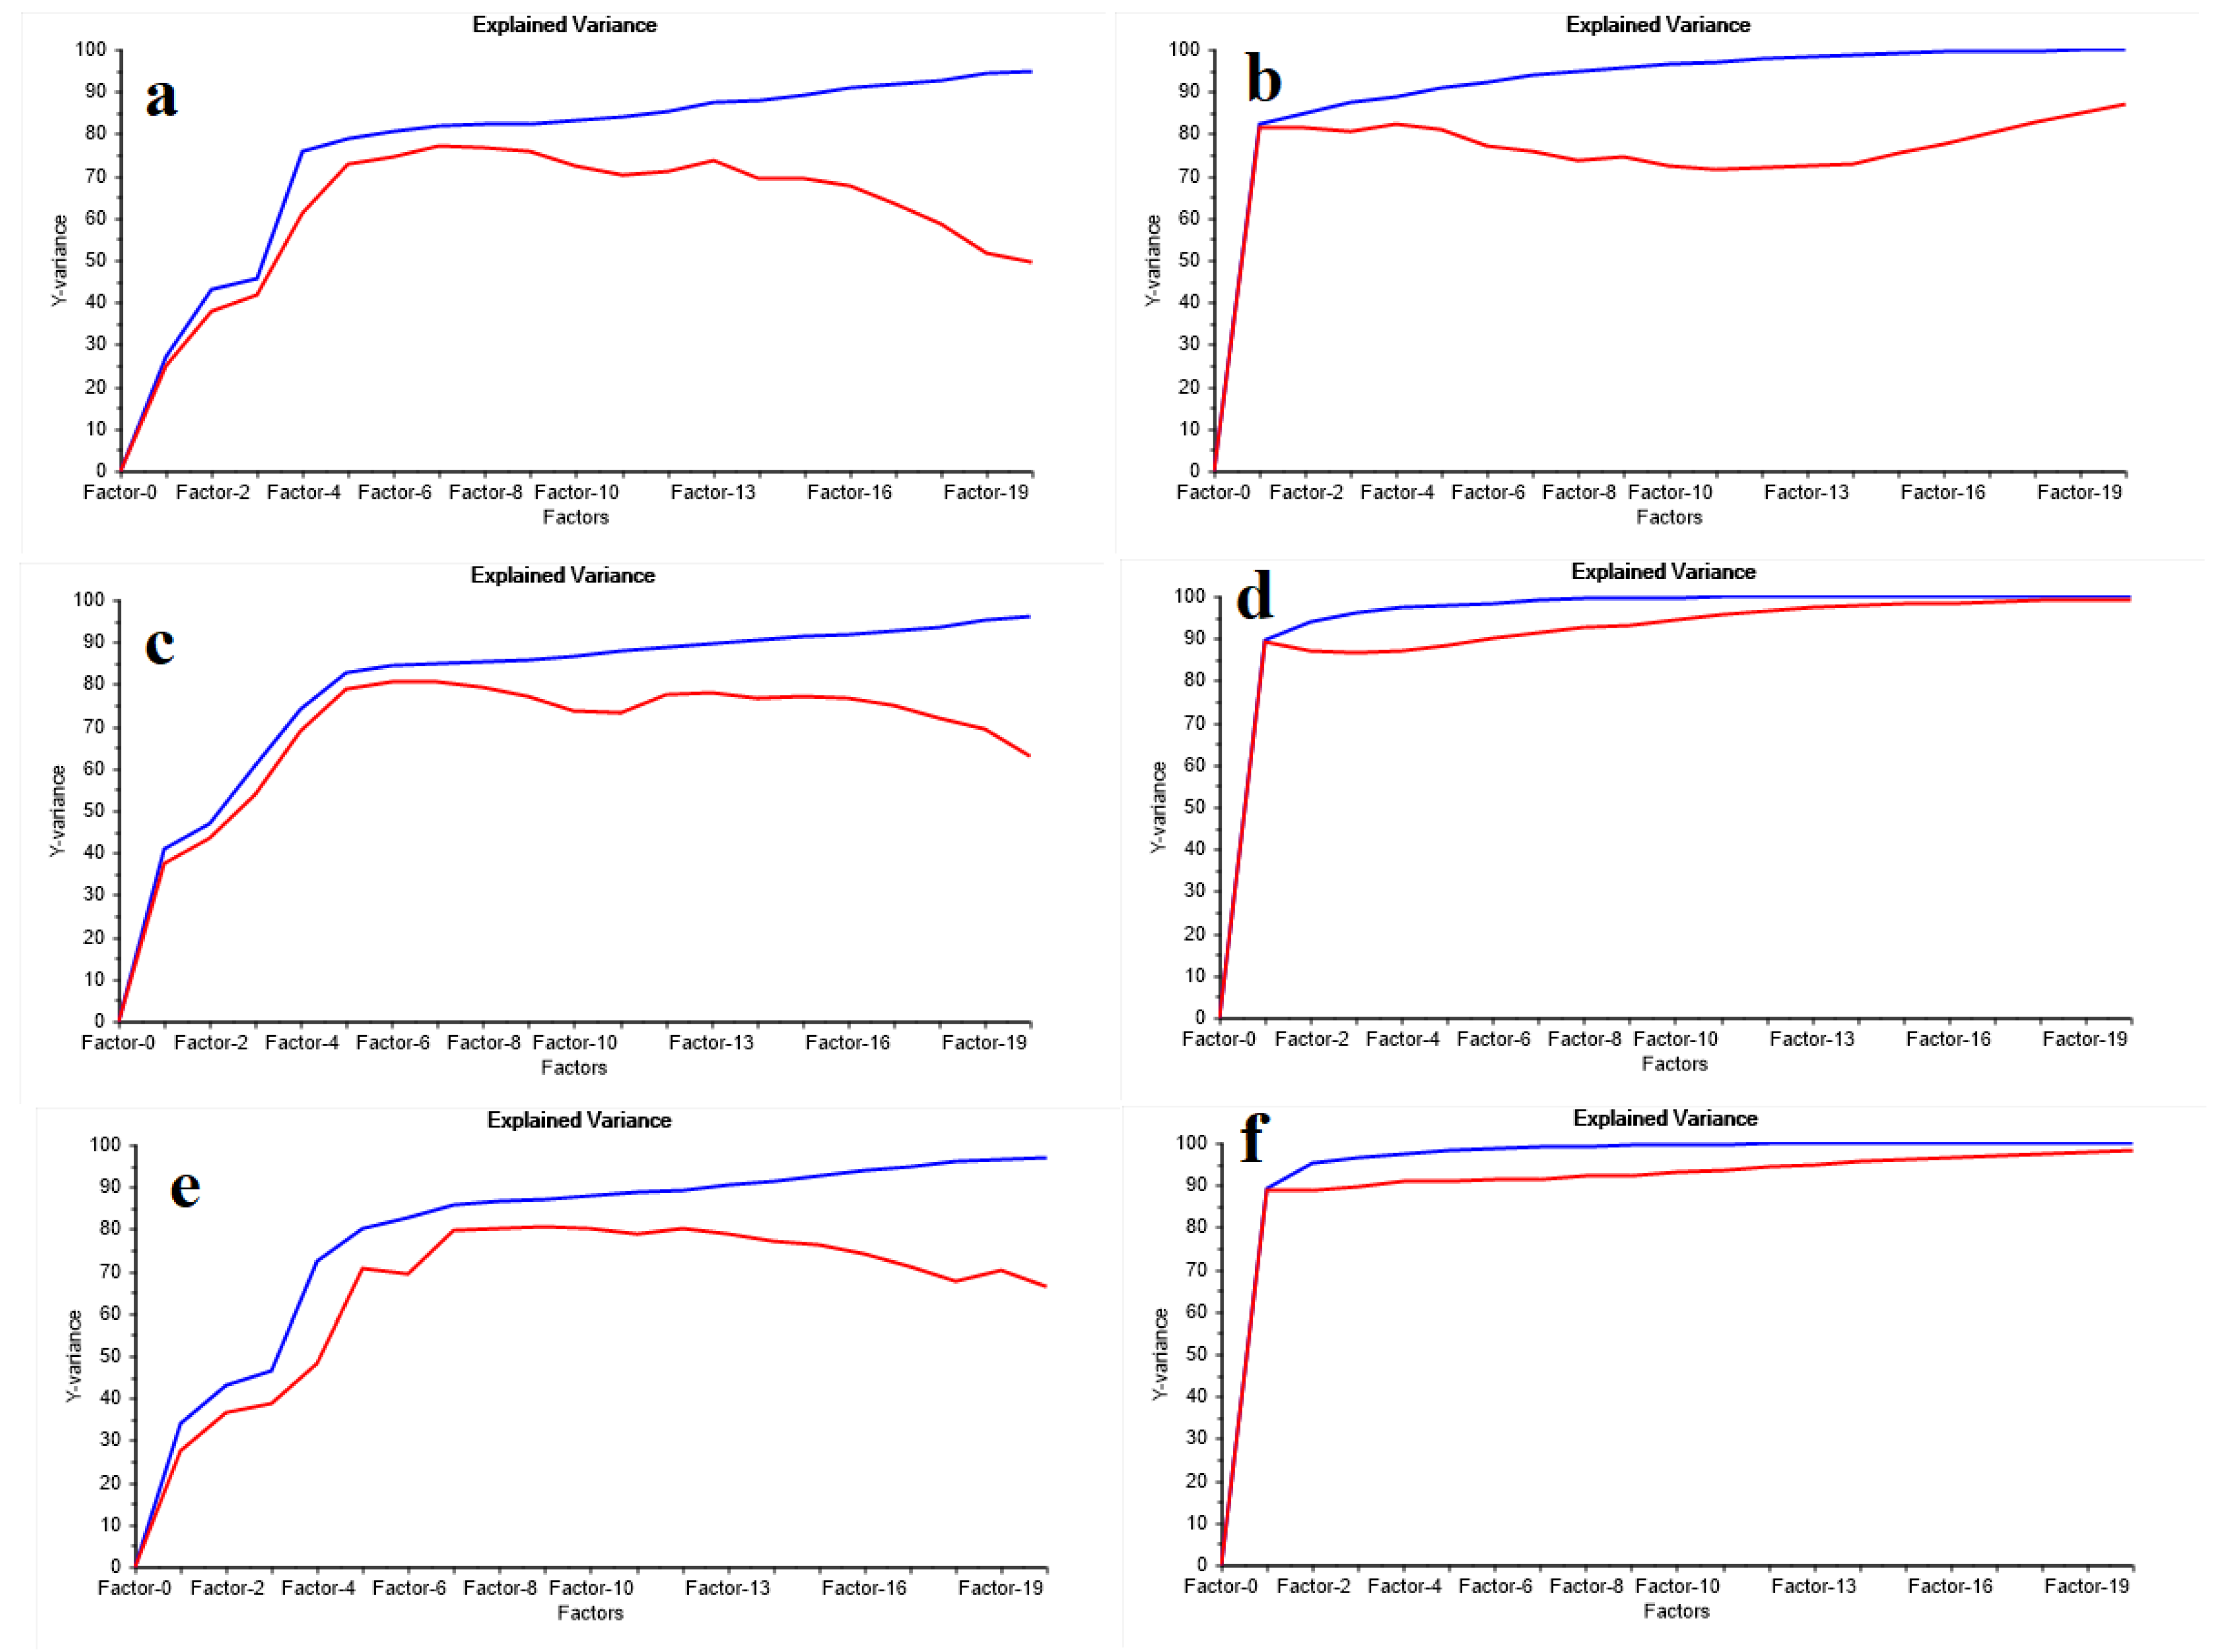
3.3. The Variance of the Antioxidant Properties Prediction

Figure 5 describes the plot of the calibration and cross-validation variance against some PCs for the prediction of the antioxidant properties, including %inhibition, antioxidant activity, and antioxidant capacity using original and OSC spectra. The OSC application caused an increase in data variation, as indicated by the smaller PCs. It is, however, important to note that the optimum value for OSC with PCs was 1. A previous study also showed that different wavelengths are usually projected into a new space defined by an axis known as the PC, where the initially very large variable is replaced by a small set of new and uncorrelated variables [42]. Therefore, the OSC used in this research was able to reduce the PC values for the antioxidant properties from 7 to 1, while another study, with 7 to 2, also produced the same accuracy value [43]. This is in line with the findings that OSC has the ability to reduce model complexity by producing smaller PCs [40].

4. Conclusions

The findings have proven that Vis/NIR spectroscopy can be used to predict antioxidant properties in intact and powdered cayenne pepper. This was observed from the ability of the fusion model developed to produce R and RMSEC values of 0.90 and 7.63 for %inhibition, 0.94 and 181.82 for antioxidant activity, and 0.94 and 14.42 for antioxidant capacity, respectively. The model also predicted the unknown samples, as indicated by the R and RMSEP of 0.84 and 9.16 for %inhibition, 0.81 and 340.06 for antioxidant activity, and 0.82 and 22.64 for antioxidant capacity, respectively. These results have shown the ability of the fusion model of Vis/NIR spectroscopy, designed by combining the spectra data on intact and powdered cayenne pepper, for the rapid inspection of the antioxidant properties.

Author Contributions

Conceptualization, K.K.; formal analysis, I.E.P.; funding acquisition, K.K.; investigation, D.S. and A.A.M.; methodology, K.K.; writing—original draft, K.K.; writing—review and editing, I.E.P., D.S. and A.A.M. All authors have read and agreed to the published version of the manuscript.

Funding

This research obtained no particular support from governmental, private, or non-profit funding sources.

Institutional Review Board Statement

Not applicable.

Informed Consent Statement

Not applicable.

Data Availability Statement

The data presented in this study are available on request from the corresponding author.

Acknowledgments

The authors would like to thank to Yusuf Eka Maulana and Yuda Hadiwijaya as research assistants for sharing and supporting in this research.

Conflicts of Interest

The authors declare no conflict of interest.

References

  1. Swallah, M.S.; Sun, H.; Affoh, R.; Fu, H.; Yu, H. Antioxidant potential overviews of secondary metabolites (polyphenols) in fruits. Int. J. Food Sci. 2020, 2020, 1–7. [Google Scholar] [CrossRef] [PubMed]
  2. Zimmer, A.R.; Leonardi, B.; Miron, D.; Schapoval, E.; de Oliveira, J.R.; Gosmann, G. Antioxidant and anti-inflammatory properties of Capsicum baccatum: From traditional use to scientific approach. J. Ethnopharmacol. 2012, 139, 228–233. [Google Scholar] [CrossRef] [PubMed] [Green Version]
  3. Shi, Z.; El-Obeid, T.; Riley, M.; Li, M.; Page, A.; Liu, J. High Chili intake and cognitive function among 4582 adults: An open cohort study over 15 years. Nutrients 2019, 11, 1183. [Google Scholar] [CrossRef] [PubMed] [Green Version]
  4. Adebiyi, O.E.; Olayemi, F.O.; Ning-Hua, T.; Guang-Zhi, Z. In vitro antioxidant activity, total phenolic and flavonoid contents of ethanol extract of stem and leaf of Grewia carpinifolia. Beni-Suef Univ. J. Basic Appl. Sci. 2017, 6, 10–14. [Google Scholar] [CrossRef]
  5. Apak, R.; Gorinstein, S.; Böhm, V.; Schaich, K.M.; Özyürek, M.; Güçlü, K. Methods of measurement and evaluation of natural antioxidant capacity/activity (IUPAC technical report). Pure Appl. Chem. 2013, 85, 957–998. [Google Scholar] [CrossRef] [Green Version]
  6. Lim, Y.Y.; Murtijaya, J. Antioxidant properties of Phyllanthus amarus extracts as affected by different drying methods. LWT-Food Sci. Technol. 2007, 40, 1664–1669. [Google Scholar] [CrossRef]
  7. Paixão, N.; Perestrelo, R.; Marques, J.C.; Câmara, J.S. Relationship between antioxidant capacity and total phenolic content of red, rosé and white wines. Food Chem. 2007, 105, 204–214. [Google Scholar] [CrossRef] [Green Version]
  8. Wang, W.; Bostic, T.R.; Gu, L. Antioxidant capacities, procyanidins and pigments in avocados of different strains and cultivars. Food Chem. 2010, 122, 1193–1198. [Google Scholar] [CrossRef]
  9. Shahidi, F.; Zhong, Y. Measurement of antioxidant activity. J. Funct. Foods 2015, 18, 757–781. [Google Scholar] [CrossRef]
  10. Polinar, Y.Q.; Yaptenco, K.F.; Peralta, E.K.; Agravante, J.U. Near-infrared spectroscopy for non-destructive prediction of maturity and eating quality of ‘carabao’ mango (Mangifera indica L.) fruit. Agric. Eng. Int. CIGR J. 2019, 21, 209–219. [Google Scholar]
  11. Sohaib Ali Shah, S.; Zeb, A.; Qureshi, W.S.; Arslan, M.; Ullah Malik, A.; Alasmary, W.; Alanazi, E. Towards fruit maturity estimation using NIR spectroscopy. Infrared Phys. Technol. 2020, 111, 103479. [Google Scholar] [CrossRef]
  12. Walsh, K.B.; Blasco, J.; Zude-Sasse, M.; Sun, X. Visible-NIR ‘point’ spectroscopy in postharvest fruit and vegetable assessment: The science behind three decades of commercial use. Postharvest Biol. Technol. 2020, 168, 111246. [Google Scholar] [CrossRef]
  13. Chen, W.; Li, H.; Zhang, F.; Xiao, W.; Zhang, R.; Chen, Z.; Du, Y. Handheld short-wavelength NIR spectroscopy for rapid determination of sugars and carbohydrate in fresh juice with Sampling Error Profile Analysis. Infrared Phys. Technol. 2021, 115, 103732. [Google Scholar] [CrossRef]
  14. Hayati, R.; Zulfahrizal, Z.; Munawar, A.A. Robust prediction performance of inner quality attributes in intact cocoa beans using near infrared spectroscopy and multivariate analysis. Heliyon 2021, 7, 1–7. [Google Scholar] [CrossRef]
  15. Mishra, P.; Woltering, E.; El Harchioui, N. Improved prediction of ‘Kent’ mango firmness during ripening by near-infrared spectroscopy supported by interval partial least square regression. Infrared Phys. Technol. 2020, 110, 103459. [Google Scholar] [CrossRef]
  16. Posom, J.; Klaprachan, J.; Rattanasopa, K.; Sirisomboon, P.; Saengprachatanarug, K.; Wongpichet, S. Predicting marian plum fruit quality without environmental condition impact by handheld visible-near-infrared spectroscopy. ACS Omega 2020, 5, 27909–27921. [Google Scholar] [CrossRef] [PubMed]
  17. Kljusurić, J.G.; Mihalev, K.; Bečić, I.; Polović, I.; Georgieva, M.; Djaković, S.; Kurtanjek, Ž. Near-infrared spectroscopic analysis of total phenolic content and antioxidant activity of berry fruits. Food Technol. Biotechnol. 2016, 54, 236–242. [Google Scholar] [CrossRef]
  18. Alfieri, M.; Cabassi, G.; Habyarimana, E.; Quaranta, F.; Balconi, C.; Redaelli, R. Discrimination and prediction of polyphenolic compounds and total antioxidant capacity in sorghum grains. J. Near Infrared Spectrosc. 2019, 27, 46–53. [Google Scholar] [CrossRef]
  19. Carbas, B.; Machado, N.; Oppolzer, D.; Queiroz, M.; Brites, C.; Rosa, E.A.S.; Barros, A.I.R.N.A. Prediction of phytochemical composition, in vitro antioxidant activity and individual phenolic compounds of common beans using MIR and NIR spectroscopy. Food Bioprocess Technol. 2020, 13, 962–977. [Google Scholar] [CrossRef]
  20. Calegari, M.A.; Ayres, B.B.; dos Santos Tonial, L.M.; de Alencar, S.M.; Oldoni, T.L.C. Fourier transform near infrared spectroscopy as a tool for predicting antioxidant activity of propolis. J. King Saud Univ.-Sci. 2020, 32, 784–790. [Google Scholar] [CrossRef]
  21. Fu, H.; Hu, O.; Xu, L.; Fan, Y.; Shi, Q.; Guo, X.; Lan, W.; Yang, T.; Xie, S.; She, Y. Simultaneous recognition of species, quality grades, and multivariate calibration of antioxidant activities for 12 famous green teas using mid- and near-infrared spectroscopy coupled with chemometrics. J. Anal. Methods Chem. 2019, 2019, 1–14. [Google Scholar] [CrossRef] [PubMed]
  22. Xia, F.; Li, C.; Zhao, N.; Li, H.; Chang, Q.; Liu, X.; Liao, Y.; Pan, R. Rapid determination of active compounds and antioxidant activity of okra seeds using Fourier transform near infrared (FT-NIR) spectroscopy. Molecules 2018, 23, 550. [Google Scholar] [CrossRef] [PubMed] [Green Version]
  23. Jiang, J.; Cen, H.; Zhang, C.; Lyu, X.; Weng, H.; Xu, H.; He, Y. Nondestructive quality assessment of chili peppers using near-infrared hyperspectral imaging combined with multivariate analysis. Postharvest Biol. Technol. 2018, 146, 147–154. [Google Scholar] [CrossRef]
  24. Rohaeti, E.; Muzayanah, K.; Septaningsih, D.A.; Rafi, M. Fast analytical method for authentication of chili powder from synthetic dyes using uv-vis spectroscopy in combination with chemometrics. Indones. J. Chem. 2019, 19, 668–674. [Google Scholar] [CrossRef]
  25. Li, J.; Zhang, H.; Zhan, B.; Wang, Z.; Jiang, Y. Determination of SSC in pears by establishing the multi-cultivar models based on visible-NIR spectroscopy. Infrared Phys. Technol. 2019, 102, 1–10. [Google Scholar] [CrossRef]
  26. Kusumiyati; Hadiwijaya, Y.; Putri, I.E.; Munawar, A.A. Multi-product calibration model for soluble solids and water content quantification in Cucurbitaceae family, using visible/near-infrared spectroscopy. Heliyon 2021, 7, e07677. [Google Scholar] [CrossRef] [PubMed]
  27. Kusumiyati, K.; Hadiwijaya, Y.; Putri, I.E.; Munawar, A.A. Enhanced visible/near-infrared spectroscopic data for prediction of quality attributes in Cucurbitaceae commodities. Data Brief 2021, 39, 107458. [Google Scholar] [CrossRef] [PubMed]
  28. Rambo, M.K.D.; Ferreira, M.M.C.; Amorim, E.P. Multi-product calibration models using NIR spectroscopy. Chemom. Intell. Lab. Syst. 2016, 151, 108–114. [Google Scholar] [CrossRef]
  29. González-zamora, A.; Sierra-campos, E.; Luna-ortega, J.G.; Pérez-morales, R.; Carlos, J.; Ortiz, R.; García-hernández, J.L. Characterization of different capsicum varieties by evaluation of their capsaicinoids content by high performance liquid chromatography, determination of pungency and effect of high temperature. Molecules 2013, 18, 13471–13486. [Google Scholar] [CrossRef]
  30. Thapa, B.; Skalko-basnet, N.; Takano, A.; Masuda, K.; Basnet, P. High-performance liquid chromatography analysis of capsaicin content in 16 capsicum fruits from nepal. J. Med. Food 2009, 12, 908–913. [Google Scholar] [CrossRef]
  31. Fan, S.; Wang, Q.; Tian, X.; Yang, G.; Xia, Y.; Li, J.; Huang, W. Non-destructive evaluation of soluble solids content of apples using a developed portable Vis/NIR device. Biosyst. Eng. 2020, 193, 138–148. [Google Scholar] [CrossRef]
  32. Zhang, Q.; Li, Q.; Zhang, G. Rapid determination of leaf water content using Vis/NIR spectroscopy analysis with wavelength selection. Spectrosc. Int. J. 2012, 27, 93–105. [Google Scholar] [CrossRef]
  33. Pérez-gálvez, A.; Viera, I.; Roca, M. Carotenoids and chlorophylls as antioxidants. Antioxidants 2020, 9, 505. [Google Scholar] [CrossRef] [PubMed]
  34. Pola, W.; Sugaya, S.; Photchanachai, S. Influence of postharvest temperatures on carotenoid biosynthesis and phytochemicals in mature green chili (Capsicum annuum L.). Antioxidants 2020, 9, 203. [Google Scholar] [CrossRef] [Green Version]
  35. Windig, W.; Shaver, J.; Bro, R. Loopy MSC: A simple way to improve multiplicative scatter correction. Appl. Spectrosc. 2008, 62, 1153–1159. [Google Scholar] [CrossRef]
  36. Saganowska, P.; Wesolowski, M. Principal component and cluster analyses as supporting tools for co-crystals detection. J. Therm. Anal. Calorim. 2017, 130, 45–55. [Google Scholar] [CrossRef] [Green Version]
  37. Hadiwijaya, Y.; Putri, I.E.; Mubarok, S.; Hamdani, J.S. Rapid and non-destructive prediction of total soluble solids of guava fruits at various storage periods using handheld near-infrared instrument. In IOP Conference Series: Earth and Environmental Science; IOP Publishing: Bristol, UK, 2020; pp. 1–7. [Google Scholar]
  38. Wang, J.; Wang, J.; Chen, Z.; Han, D. Development of multi-cultivar models for predicting the soluble solid content and firmness of European pear (Pyrus communis L.) using portable vis–NIR spectroscopy. Postharvest Biol. Technol. 2017, 129, 143–151. [Google Scholar] [CrossRef]
  39. Lu, X.; Wang, J.; Al-Qadiri, H.M.; Ross, C.F.; Powers, J.R.; Tang, J.; Rasco, B.A. Determination of total phenolic content and antioxidant capacity of onion (Allium cepa) and shallot (Allium oschaninii) using infrared spectroscopy. Food Chem. 2011, 129, 637–644. [Google Scholar] [CrossRef] [PubMed]
  40. Zhang, L.; Zhang, L.; Li, Y.; Wang, J. Orthogonal signal correction used for noise elimination of open path Fourier transform infrared spectra. J. Environ. Sci. Health Part A Toxic/Hazard. Subst. Environ. Eng. 2005, 40, 1069–1079. [Google Scholar] [CrossRef] [PubMed]
  41. Awasthi, S.; Kumar, R.; Devanathan, A.; Acharya, R.; Rai, A.K. Multivariate methods for analysis of environmental reference materials using laser-induced breakdown spectroscopy. Anal. Chem. Res. 2017, 12, 10–16. [Google Scholar] [CrossRef]
  42. Agelet, L.E.; Hurburgh, C.R. A tutorial on near infrared spectroscopy and its calibration. Crit. Rev. Anal. Chem. 2010, 40, 246–260. [Google Scholar] [CrossRef]
  43. Qu, H.B.; Ou, D.L.; Cheng, Y.Y. Background correction in near-infrared spectra of plant extracts by orthogonal signal correction. J. Zhejiang Univ. Sci. B 2005, 6, 838–843. [Google Scholar] [CrossRef] [PubMed] [Green Version]
Figure 1. Schematic for Vis/NIR spectroscopy technique and spectra measurements.
Sustainability 14 00201 g001
Figure 2. Absorbance spectra recorded in a range of 312–1050 nm for intact and powdered cayenne pepper.
Sustainability 14 00201 g002
Figure 3. PCA scores plot of intact and powdered cayenne pepper.
Sustainability 14 00201 g003
Figure 4. Scatter plot of intact and powdered cayenne pepper calibration set (blue) and prediction set (red) for antioxidant properties: (a,b) %Inhibition; (c,d) Antioxidant activity; (e,f) Antioxidant capacity using PLSR and OSC.
Sustainability 14 00201 g004
Figure 5. Variance of %inhibition ((a): original; (b): OSC), antioxidant activity ((c): original; (d): OSC); and antioxidant capacity ((e): original; (f): OSC).
Sustainability 14 00201 g005
Table 1. Summary of results for antioxidant properties using PLSR and spectra correction methods.
ParametersSpectra Correction MethodsPCsRcalRMSECRcvRMSECVRpredRMSEP
%InhibitionOriginal70.907.790.878.960.839.45
MSC60.888.490.849.800.7910.36
SNV70.878.730.8310.130.8110.03
AN60.888.270.8410.050.7710.81
MN80.907.850.869.130.8010.24
Dg180.917.350.8310.160.819.91
Dg230.7611.690.7613.840.5813.96
DT70.907.920.869.240.829.75
SGS70.907.800.879.020.839.45
OSC10.907.630.907.790.849.16
Antioxidant activityOriginal60.91220.910.89251.240.83325.91
MSC70.89250.240.84304.430.80350.24
SNV50.88253.650.85292.810.74391.74
AN50.88259.200.86278.640.69423.18
MN70.90236.950.86282.360.76375.58
Dg170.91228.230.86288.480.80345.58
Dg250.88254.560.72381.400.64452.79
DT60.88252.260.85294.650.78369.78
SGS60.91221.450.88253.110.83325.79
OSC10.94181.820.94186.570.81340.06
Antioxidant capacityOriginal70.9216.730.8819.640.8619.78
MSC80.9216.730.8919.870.8719.95
SNV70.9118.130.8621.920.8520.51
AN70.9315.410.9018.730.7227.73
MN80.9314.890.9117.920.6031.72
Dg190.9413.570.8919.470.8321.83
Dg230.7628.550.6633.080.6131.43
DT60.9216.650.9118.940.8719.55
SGS70.9216.760.8919.760.8619.76
OSC10.9414.420.9314.800.8222.64
PCs: principal components; Rcal: coefficient of correlation in calibration set; RMSEC: root mean square error of calibration; Rcv: coefficient of correlation of cross-validation; RMSECV: root mean square error of cross-validation; Rpred: coefficient of correlation in prediction set; RMSEP: root mean square error of prediction; MSC: multiplicative scatter correction; SNV: standard normal variate; AN: area normalization; MN: mean normalization; dg1: first derivative Savitszky–Golay; dg2: second derivative Savitsky–Golay; DT: de-trending; SGS: Savitzky–Golay smoothing; OSC: orthogonal signal correction.
Publisher’s Note: MDPI stays neutral with regard to jurisdictional claims in published maps and institutional affiliations.

