Article

Influence of Sociodemographic Factors on Construction Fieldworkers’ Safety Risk Assessments

1
Department of Civil, Construction, and Environmental Engineering, The University of Alabama, Tuscaloosa, AL 35487, USA
2
Department of Construction Management, Colorado State University, Fort Collins, CO 80523, USA
*
Author to whom correspondence should be addressed.
Sustainability 2022, 14(1), 111; https://doi.org/10.3390/su14010111
Submission received: 24 November 2021 / Revised: 14 December 2021 / Accepted: 20 December 2021 / Published: 23 December 2021
(This article belongs to the Collection Advances in Construction Safety Management Practices)

Abstract

:
Construction operations are hazardous, leading to thousands of accidents, injuries, and fatalities annually. Safety risk assessment (SRA) is a key component necessary to respond to hazards effectively. Individuals have different perceptions of the riskiness of construction hazards, and studies have shown that different sociodemographic factors among employees can alter their SRA skills. However, their role in the US construction industry has been understudied, and this analysis investigates this topic further. Following a detailed systematic review of the relevant literature, quantitative data were collected from 181 construction fieldworkers in the United States using images integrated into an interactive questionnaire survey. Responses on the severity and frequency of seven potential accident causes were captured and analyzed. Findings from the literature review revealed six key sociodemographic factors—age, education, training, gender, ethnicity, and work type—that could impact fieldworkers’ SRA. However, a quantitative analysis suggests that only education is a significant influence, and sociodemographic factors had a statistically significant impact on less than five percent of the assessments. Therefore, the present study proposes that future investigation within the SRA domain should complement sociodemographic factors with critical behavioral factors that are rarely discussed, such as cognitive biases, personality traits, and safety behavior. As a foundational study for safety researchers and practitioners, the results provide information on SRA that can help enhance the safety and workforce sustainability of construction companies with a diverse workforce.

1. Introduction

The US construction industry employed over 3.2% of the US population in 2021, and employees had different sociological and demographic characteristics such as age, ethnicity, and gender [1]. According to previous studies, workers’ poor situational awareness is a leading cause of workplace accidents [2,3,4,5]. Moreover, hazard recognition has been identified as the first step toward accurate safety risk assessment [6]; however, most construction employees are unable to appropriately identify safety risks [7,8]. More specifically, approximately 6% of a sample population of construction foremen in the United States can accurately assess workplace safety issues [7], whereas the risk of typical hazards encountered on the jobsite was perceived to be considerably low by 100% of a sample population of construction workers in Eastern Europe [9]. As a result, there is a critical necessity to understand construction workers’ situational awareness on a jobsite in order for employers and safety managers to develop safety strategies that address their workers’ needs.
Workers’ ability to assess safety risks has been quantified in multiple studies, and the results suggest that workers perceive safety risks differently when exposed to identical circumstances [10,11,12]. Sociodemographic factors have been recognized as influencing an individual’s ability to assess safety risks in the construction industry [13]. Moreover, studies have emphasized that demographic characteristics substantially impact construction employees’ safety awareness and workplace safety performance [14,15]. For example, several authors have found that age, gender, training, experience, job role, and education affect workers’ situational awareness [14,16,17,18,19].
Although it is broadly accepted that these factors impact workers’ safety performance, their role on fieldworkers’ safety risk perception in the US construction industry has been understudied. For instance, these factors are typically assessed in isolation (e.g., Caban-Martinez et al. [20] and Tixier et al. [21] investigated the influence of Occupational Safety Health Administration (OSHA) training alone), limiting the potential to generate critical intra-study insights. Moreover, most studies in the US either focus on supervisors or construction students [11,21,22,23,24], and the few studies that assess fieldworkers’ safety risk assessments are either regional [20] or based on a small sample size [25]. Given that fieldworkers make up a significant portion of worker injuries and fatalities in the US construction industry [26], and that injuries associated with poor worker safety actions occur across the US, it is imperative to investigate this topic further.
Therefore, the purpose of the present study is to investigate the effect of different sociodemographic factors on construction workers’ safety risk assessment (SRA) skills in the US, given that workers typically assess safety risks differently. A detailed literature review was conducted to determine the various sociodemographic factors that potentially influence SRAs. Then, a survey was undertaken to quantify workers’ perceived risk level and identify the impact of the identified sociodemographic factors on SRAs. The present study contributes to existing knowledge and practice in the following ways:
(1)
The study highlights the sociodemographic factors relevant to fieldworker SRA research in the US construction industry while highlighting several potential behavioral factors that could influence workers’ SRAs.
(2)
The findings of this study provide valuable information about fieldworkers’ SRAs to US contractors with a diverse workforce, allowing them to improve their safety training and favorably influence their employees’ safe behavior. Construction safety trainers can benefit from the findings because they can tailor safety trainings to the needs of specific groups of employees.

2. Background

The construction industry is known for unique projects that come with distinct challenges. These challenges frequently result in unanticipated situations that expose construction employees to occupational hazards and cause unforeseen liabilities. These incidents are unavoidable, and the nature of the construction site activities contributes to occupational risks [27]. Safety professionals have worked to improve safety by integrating procedures, regulations, and activities into the construction process. Unfortunately, these safety practices have not been implemented fully due to poor management and workers’ lack of attention to safety [28]. As a result, understanding construction workers’ safety risk assessments is critical to creating a safe and healthy workplace for them.

2.1. Construction Safety Risk Assessment (SRA)

Construction is one of the most hazardous industries in the United States, largely due to its uncertainties, dynamism, and complexity. Its hazardous nature is also partly a result of its fast pace and the constant changes that occur in the construction environment as a job progresses. In 2019, the fatality rate for construction workers in the United States increased by over 41% to 1102 (approximately 15 workers died daily from work-related accidents), surpassing the previous peak in 2007 [26]. According to OSHA, the primary causes of construction worker fatalities are falls, being struck, electrocution, and being caught between construction hazards [26]. Although construction organizations have implemented several interventions such as site-specific safety plans [29], near-miss reporting programs [30], safety incentive programs [31], and technology-based processes [32] aimed at mitigating the risks associated with these accidents, the accident rates remain troubling. Existing accident theories suggest that although the work environment contributes to accidents, most accidents can be attributed to workers’ unsafe actions [33].
The ability of workers to perceive and analyze hazards, make projections, and establish control in such a dynamic and complex work environment poses a significant challenge [34]. Workers make imprecise and ill-timed decisions when they have little awareness of the situation in which they find themselves [34]. Moreover, when two or more workers are exposed to the same circumstance, they typically see it differently. If no safety plan is in place to counteract workers’ inherent biases and risk propensity, those with a higher tolerance for risk-taking and those who constantly underestimate safety risks could be exposed to a severe accident [12]. The inability of workers to establish proper awareness of their environment is a fundamental cause of many mishaps that occur on dynamic jobsites [35]. Thus, the current status of workers’ SRAs must be understood, and solutions that assist workers in remaining attentive to potential threats in their workplace must be developed.
By definition, a safety risk assessment is a systematic method for identifying and evaluating the impact of hazards to aid decision-making and promote a safe workplace [36]. Consequently, SRAs are a vital component of safety management. This assessment relies on determining the severity of the hazard tied to a construction event and evaluating how often the hazard occurs (probability). Several studies have investigated construction workers’ proficiency in accurately establishing and growing conscious of safety risks in a workplace [37]. Many have also examined why workers assess risks differently, finding that the distinct psychosocial [38], personality [39], and demographic characteristics [14,17,40] of workers influence their perception of safety risks.

2.2. SRA and Sociodemographic Factors

In addition to workers’ awareness of their dynamic work environment, they need to be able to properly assess the features, severity, and frequency of existing and evolving hazards in the workplace as construction work progresses. Several studies have shown that sociodemographic characteristics, including the age [16,41], type of work [2,39], level of training [22,40], ethnicity [41,42], education level [19,43], and gender [43,44] of construction workers, influence workers’ SRAs. The outcomes are discussed in the subsequent sub-sections.

2.2.1. Influence of Age of Workers

Compared with other sectors, the construction industry, particularly in the United States, has scarce information about the influence of age on the SRAs of employees, which is evident in a study conducted by Salminen [45]. Salminen evaluated the effect of age on occupational injuries across different industries, and less than 16% of the reviewed articles were drawn from the construction domain. Given the limited information on hand, especially within the United States, it is challenging to ascertain the level of impact fieldworkers’ age has on their ability to perceive safety risks or identify which age group has an exceptionally high SRA.
However, researchers looked at the effect of age on the risk perceptions (RPs) of construction workers in Hong Kong and found that age had no influence [46]. However, in other studies, the RPs of Chinese construction workers have been reported to be influenced by their age [14], which is consistent with the findings of Mučenski et al. [47]. Some researchers reported that young workers have low RPs [16,17,44,47]. The low RPs among young people can be attributed to a lack of industry experience and a low level of training [44,47]. Workers in their 40s and 50s are more mindful of their safety than their younger counterparts [17], mainly because the older workers exhibit more positive attitudes than young workers [46]. Field employees aged 37–46 consider hazards with a low frequency of occurrence to have low severity [16], and this could be because of their familiarity with the construction event connected to a given hazard [37]. Although the average age of construction employees in the United States is about 43 years [1], information about the RPs of workers aged 50 years or more remains rare. As a result, this study was designed to investigate the SRAs of construction workers across all age groups.

2.2.2. Effect of Workers’ Education Level

A review of prior studies showed that the influence of education on construction workers’ SRAs is inconclusive. For example, Trillo-Cabello et al. [11] evaluated the influence of sociodemographic factors on experts’ SRAs and discovered that their level of education does not influence their ability to perceive safety risks. Similarly, Renault et al. [18] reported that experience and education are statistically insignificant concerning a company’s risk management methods. These findings imply that workers with a high level of education do not use risk management techniques that are distinct from those used by workers with a low degree of education [42].
Nonetheless, Karimi and Taghaddos [19] found that craft workers with high educational attainment have a considerably low probability of fatal injuries. Similarly, Chaswa et al. [17] revealed that education has a statistically significant influence on workers’ SRA abilities. The authors stated that, unlike unskilled workers, educated workers adequately perceive safety risks linked with the manual handling of loads. This finding demonstrates that hiring uneducated construction workers for a project increases the likelihood of injuries and fatalities at the jobsite.

2.2.3. Effect of Training

Construction companies invest a substantial amount of money in training their employees each year, and researchers have proven that subjecting workers to safety training significantly improves their ability to assess safety risks [9]. However, how training affects workers’ safety awareness depends on the training style, which may be traditional, highly engaging, or experiential [37]. For example, Rodríguez-Garzón et al. [40,48] used a psychometric model developed by Daniel Kahneman and Amos Tversky to measure the risk perception of workers. They proceeded to conduct a hierarchical cluster analysis to group the outcome and then examined the influence of training on the principal components. The authors found that the demographic training variable significantly impacted the workers’ perception of safety risks, arguing that subjecting workers to more than 40 h of training would increase the number of workers with high SRA skills from 22.8% to 45%. However, more than half of the workers (55%) would still have low RPs.
Other studies have examined the impact of training techniques on the SRA of workers. Namian et al. [37] investigated the influence of training techniques with different engagement levels on construction workers’ SRAs. The results showed that relative to workers with low-engagement training, the workers with high-engagement training had a significantly higher perception of safety risks, and hazard recognition skill was a confounding variable [37]. This finding infers that hazard recognition influenced the workers’ ability to assess safety risks accurately.

2.2.4. Influence of Workers’ Gender

Researchers have attempted to answer whether male and female construction workers perceive risk differently, but their findings remain inconclusive. In a recent study, Trillo-Cabello et al. [11] designed a survey questionnaire to investigate how the gender of safety experts influences their RP and found that gender had no bearing on the safety experts’ ability to perceive risks. Similarly, Wong et al. [43] investigated the risk awareness of male and female engineering students. They discovered that both genders have low and high RP in response to working in a “hot environment” and “struck by a falling object,” respectively. These findings indicate that there is no significant difference in the SRAs of both male and female construction personnel.
On the contrary, Han et al. [16] developed a questionnaire-based survey to explore the effect of gender on construction workers’ SRAs and found that relative to male workers, women recorded a high SRA. Similarly, Chan et al. [41] argued that the gender of workers plays a significant role in their level of SRA. In another study, Ahonen and Benavides [49] examined archival data and reported that the rate of occupational accident occurrence among male workers is significantly higher than for female workers. These findings demonstrate that researchers continue to disagree on the influence of gender on construction workers’ RP.

2.2.5. Influence of Workers’ Ethnicity and Culture

Between 2010 and 2020, the US construction industry experienced about a 7.5% increase in employees from minority ethnic groups (MEGs) [1]. This finding shows that construction companies have experienced greater diversity and inclusion in their workplace. Nonetheless, injury and fatality rates among foreigners and other members of MEGs are higher than those of their local counterparts [45,49] because many MEG members perform riskier tasks than those performed by local workers [50]. Unfortunately, research on the safety awareness of MEG construction workers in the United States is scarce.
In a recent study, researchers found that compared with local workers, MEG workers have a considerably low perception of safety risks—little to no construction experience, lack of construction safety rules, and financial stress have been identified as primary factors impacting their RP [41]. Chan et al. [41] also suggested that the existing safety laws and procedures focused on local workers should be evaluated to consider ethnic differences and improve RP. In 2009, Lesch et al. [24] compared the RP of college students in the United States and China using symbols, signal words, and colors, finding that RP among Americans is higher than that of the Chinese. The difference results from variations in their interpretation of the words, signals, and colors [24]. Similarly, Zou and Zhang [51] designed a survey questionnaire to compare the RP of construction workers in Australia and China and reported that Chinese workers ranked construction operational risks as the highest risks. In contrast, the Australian workers generally assessed environmental risks as the highest. The poor RP of the Chinese workers regarding environmental risks could result from a lack of awareness about the impact of construction activities on the environment, and the authors encouraged the Chinese government to put safety policies in place to counteract environmental pollution.

2.2.6. Influence of Work Type and Role

The impact of work roles on the SRAs of construction workers is a concern in both developing and developed countries [25,38,52,53]. The type of role workers play in the construction industry influences the number of occupational risks to which they are exposed. In masonry, Memarian and Mitropoulos [54] explored historical data and established that masons are responsible for 48% of the overall accident events, whereas laborers and foremen recorded 41% and 9%, respectively. Abbas et al. [52] investigated the influence of construction employee job positions on their ability to perceive risks accurately and expressed that the risk perceptions of frontline workers are much lower than those of site engineers. This finding is in line with the conclusion drawn by Hung et al. [25] and Borys [53].
In another study, Meliá et al. [38] compared the risk perceptions of top management with frontline workers in three nations and found a significant difference. Specifically, the mean scores of supervisors and managers were somewhat higher than those of frontline workers. Likewise, Hallowell [2] compared the risk perception of construction managers and workers and confirmed that their perceptions differed significantly. The wide discrepancy in workers’ and managers’ ability to perceive risk is influenced by poor social relationships [38], limited experience in workplace safety [52], the disparity in the construction industry’s safety attitudes among managers, supervisors, and frontline workers [25], and the poor acceptance and implementation of safety regulations and procedures by frontline workers [55].
Table 1 summarizes the studies investigating the role of the discussed social demographic factors on accidents and safety risk perception. The data suggest a significant gap in the existing literature at the nexus of SRA, sociodemographic factor-based analyses, and fieldworkers in the US construction industry. Therefore, the objectives of the present study are to:
(1)
Identify the sociodemographic factors typically evaluated in the construction SRA literature.
(2)
Investigate the effect of the aforementioned sociodemographic factors on fieldworkers’ SRAs for different accident causes across the United States.
(3)
Recommend individual behavioral factors that could impact construction fieldworkers’ SRAs.

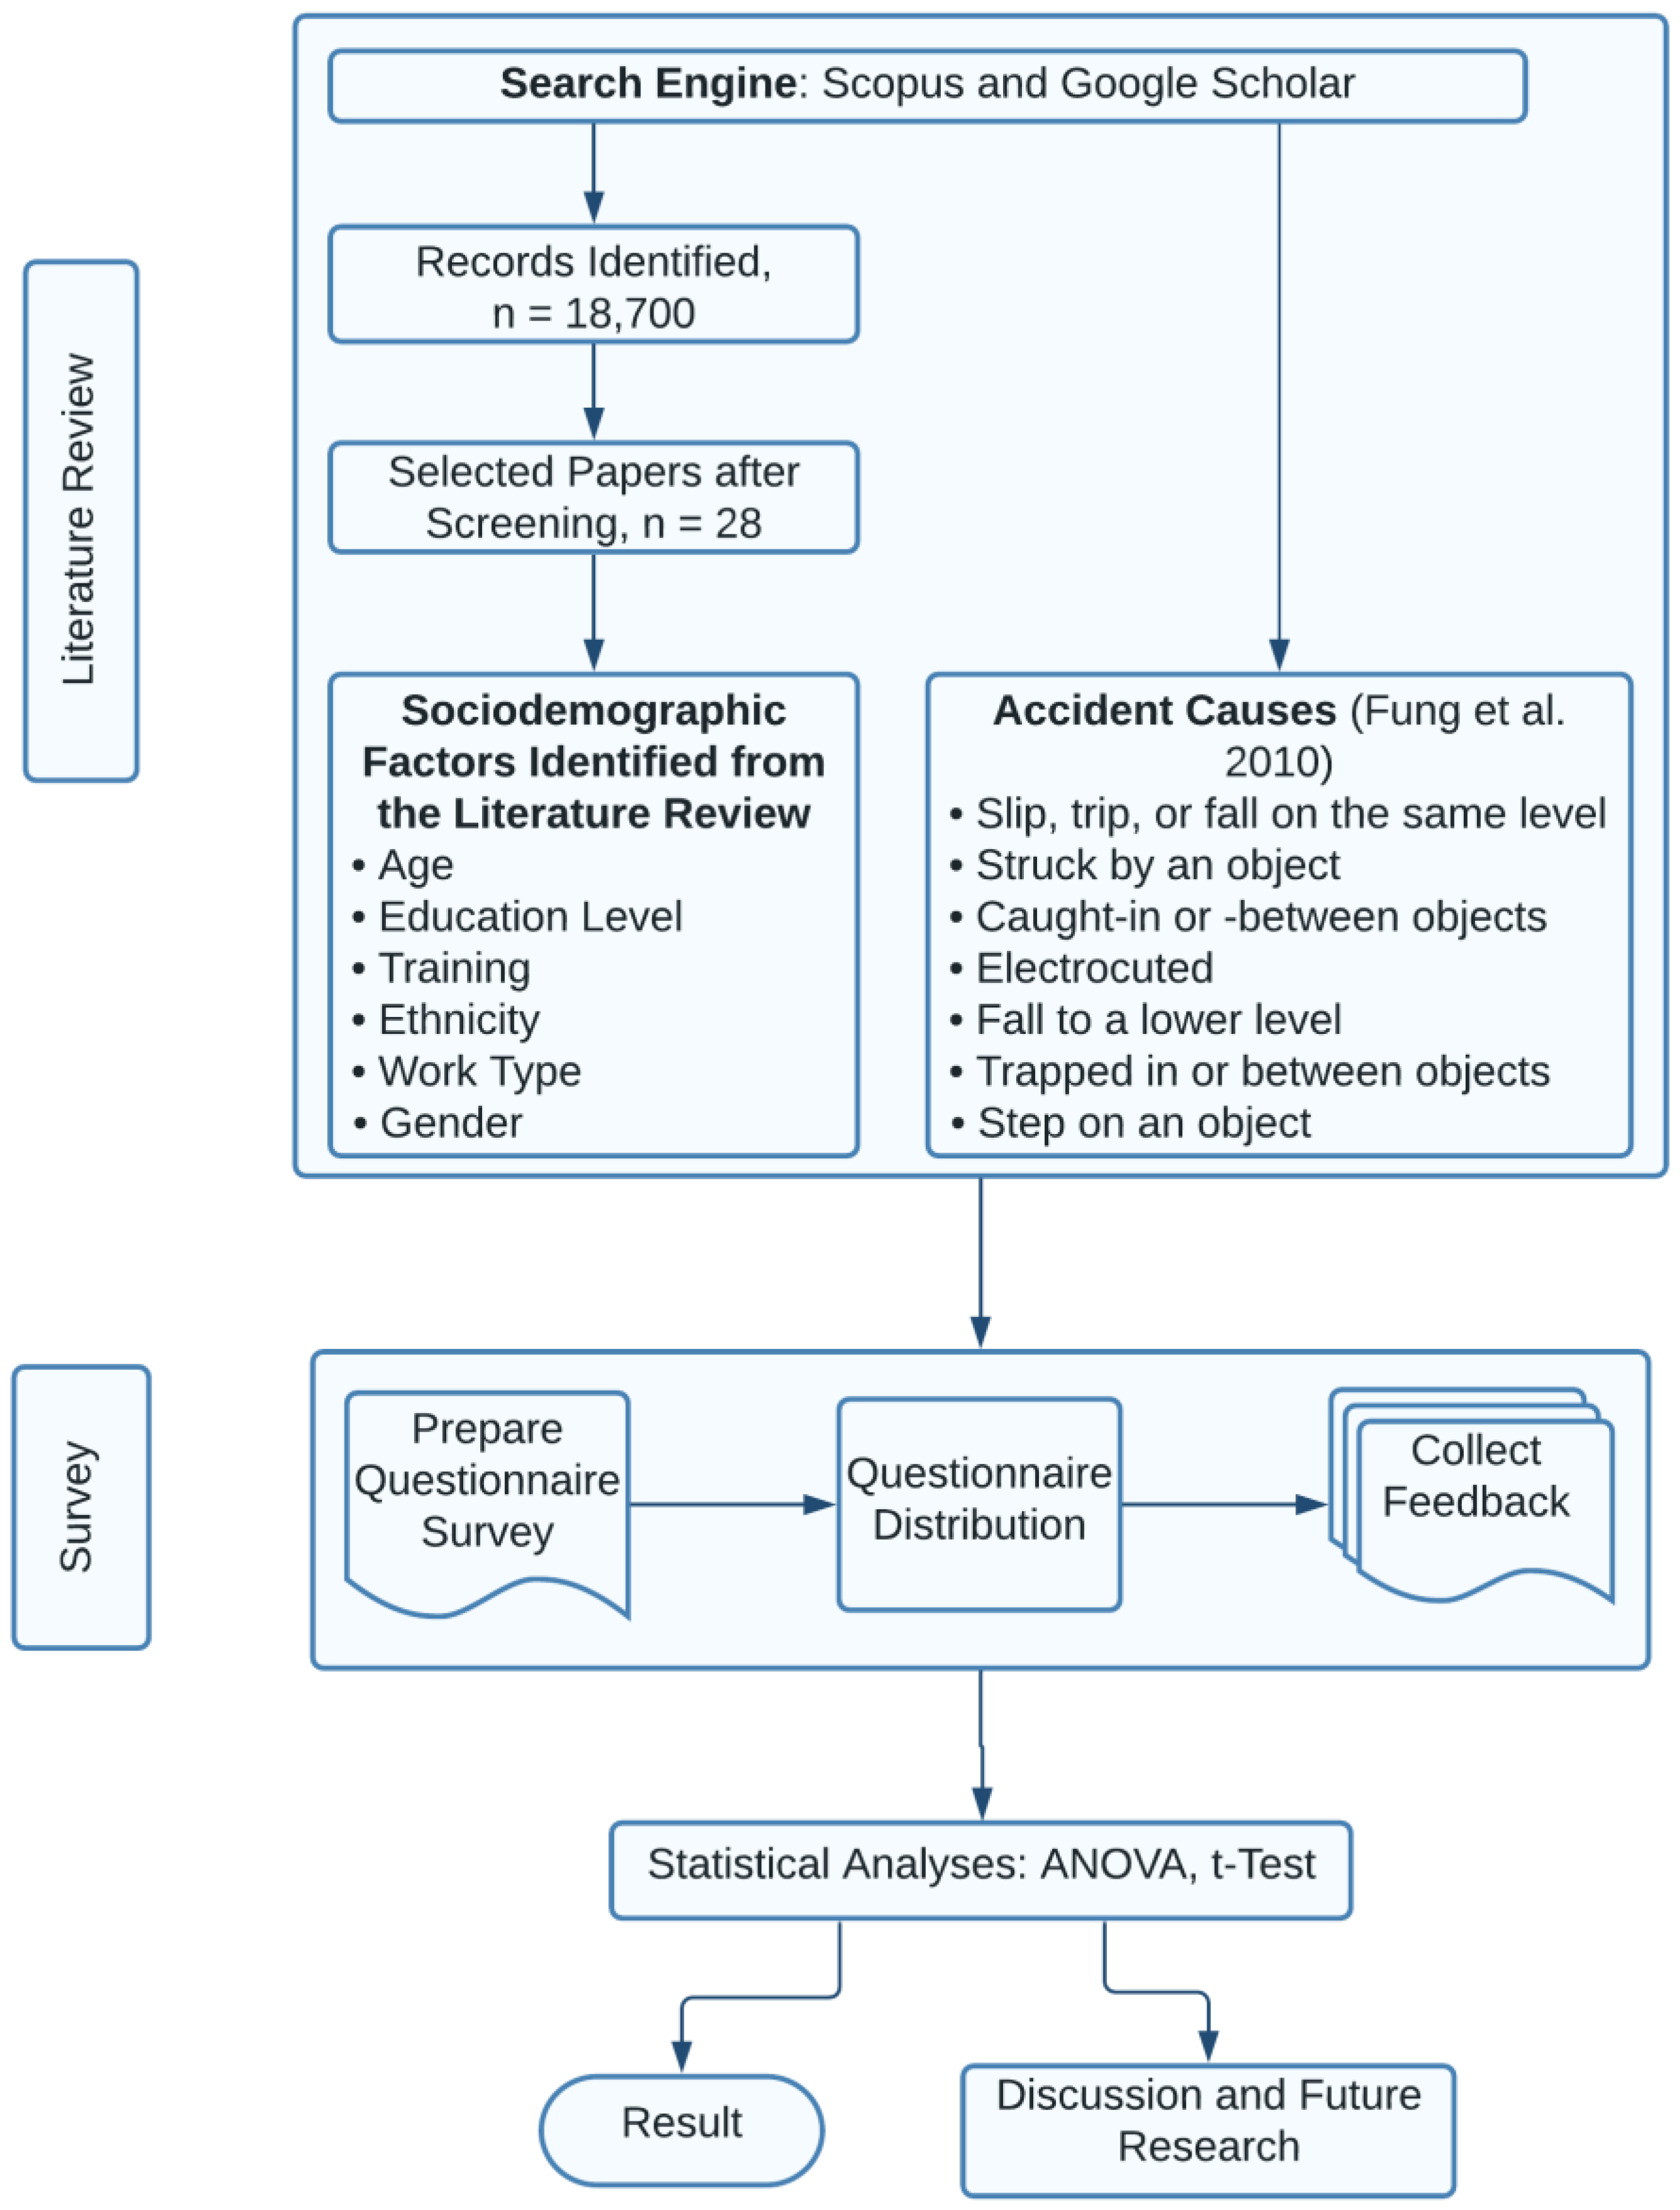
3. Materials and Methods

To achieve the research goal, we relied on multiple research methods. As depicted in Figure 1, a detailed literature review was conducted to identify relevant sociodemographic factors and common accident causes in the construction industry. This review was followed by a questionnaire-based survey to gather information on workers’ perceptions of safety risks. Descriptive and inferential statistical analyses were employed to extract important insights from construction workers who participated in the pre-sent study. A detailed explanation of the literature review process and survey development is provided in this section.

3.1. Literature Review and Content Analysis

A comprehensive literature review was conducted to appraise the state of the art regarding the influence of demographic factors on construction workers’ perceptions of safety risk. Scopus and Google Scholar were the primary search engines used in this investigation. A desktop review was conducted first to identify potential demographic factors (gender, ethnicity, age, education, training, and work type), followed by a more detailed review to locate relevant articles (situational awareness and sociodemographic) in the construction domain. A pilot search on Scopus was conducted with the general keywords “Situational AwarenessORRisk AssessmentORRisk IdentificationORRisk PerceptionORHazard IdentificationANDDemographics” OR “Sociodemographic,” which yielded more than 18,700 document results, indicating a considerable uptrend in the search terms. Then, a new search was conducted that used filters and limits. First, the search was confined to articles with engineering as the subject area, and then it was narrowed down to the title, abstract, and keywords of the article. Second, the “AND” and “OR” Boolean operators were employed to include each sociodemographic factor, and the method was repeated multiple times, changing “Demographics” and “Sociodemographic” with fresh queries and including “Construction” each time at the end.
For training, the keywords “safety training” AND “OSHA” OR “OSHA train*,” obtained 16 results (10 selected). A total of 110 papers were obtained when “Age” OR “Age Demography*” was specified for age (11 selected). “Ethnic*” OR “Culture*” was keyed for ethnicity, and 57 documents were returned (15 selected). “Education” was typed in for education, and it yielded 70 documents (12 selected). “Work type” OR “job position” were keyed in for work type, which yielded eight documents (six selected). “Gender” was keyed in for gender, and 22 papers were retrieved (12 selected).
Only 66 publications were accepted after the title and abstract of the results obtained from each search query were examined to rule out studies that were not relevant to the study’s goal. The full text of the 66 papers was assessed for the quality of the research method, results, and conclusion. A total of 38 studies were eliminated, leaving 28 studies for this investigation. A master table was prepared to display the results; this table includes the essential characteristics (demographic factors explored, method of analysis, number of participants, type of respondents, location, and outcomes) in addition to their general metadata [59].

3.2. Questionnaire Survey

A questionnaire with an image that symbolizes a construction site was prepared for this study. The questionnaire was sent to fieldworkers at construction companies all over the United States via Email between April and June 2020 through workforce associations and third-party survey platforms. The questionnaires were filled out online by the participants who volunteered to take the survey. The image on the questionnaire depicts a steel erection operation with some hazardous aspects, as shown in Figure 2. This image was selected because, among various trades in the construction industry, steel erection operations entail the highest level of risk [60].
The questionnaire was divided into two sections. The first section included questions asking participants for demographic data, and the second section included rating questions associated with the severity and frequency of incidents based on the following accident causes: slip, trip, or fall on the same level; struck by an object; caught in or between objects; electrocution; fall to a lower level; trapped in or between objects; step on an object. The seven listed occurrences are highly related to the construction trade, according to Fung et al. [60], who investigated 18 typical incidents in the construction industry.
In the questionnaire, the severity of the accident causes was assessed on a scale of 1 to 5, where 1 = discomfort or pain, 2 = first aid, 3 = medical case, 4 = lost work time, 5 = permanent disablement or fatality. Similarly, the frequency of the accident causes was assessed on a scale of 1 to 5, where 1 = never, 2 = once every 10 years, 3 = once a year, 4 = once per month, 5 = once per week.
Since the survey responses for this study came from construction employees across the United States, the data distribution was considered appropriate. The ideal sample size necessary to establish statistical significance in this study was calculated using Equation (1). The margin of error for this survey study was 10%, the standard deviation (Zα/2) for a two-tailed alternate hypothesis at α = 0.05 was 1.96, and the sample proportion was 50% for a simple random sampling where D = 1 [61]. Therefore, a sample size no less than 96 was required to examine the effect of sociodemographic characteristics on the SRAs of construction workers:
S s = Z α / 2 2 × P × ( 1 P ) × D e 2
where S s represents the sample size, Zα/2 is the z-value that represents the confidence level in the data, P is the sample proportion, D is the design effect, and e is the sampling error.

3.3. Survey Distribution and Safety Risk Analysis

The survey was distributed to approximately 2000 construction fieldworkers using the convenience sampling approach [62,63] because the respondents were within reach and possessed the qualifications needed for this study. In total, 211 responded. The responses were reviewed for completeness and signs of invalid responses (e.g., straight-lining, failed attention check questions, and speeders). Twenty responses were removed as part of the quality control process, thereby reducing the number of viable and valid responses to 181. The survey data were entered into Excel 2016 [64] and transferred to IBM SPSS version 26 [65] for statistical analysis. Preliminary analyses were conducted by computing the variable for the severity score (severity/incident) using the severity scale by Hallowell and Gambatese [66]. The frequency score (incident/worker-hour) was also computed, given that every worker works eight hours a day and five days a week. The SRA, defined by Alomari et al. [67] as the product of an individual’s rating of severity and the frequency of occurrence, was then computed, as shown in Table 2.
This approach was repeated to determine a worker’s risk perception for each probable workplace accident. According to Table 2, if a fieldworker rates the severity of an accident type, such as electrocution, as 4 (lost work time) and the frequency of occurrence as 4 (once per month), then this worker’s SRA is 1.53. Equation (2) shows the mathematical expression for SRA. Alomari et al. [67], Hallowell [2], and Namian et al. [34] have all previously tested this method of assessing workers’ risk perception in the construction industry:
Safety Risk Assessment (S/w-h) = Frequency (incident/w-h) × Severity (S/incident)
where S represents severity, and w h represents working hours. The questionnaire used a 1 to 5 Likert scale to obtain information regarding workers’ perceptions of the injury severity and frequency, respectively. The Likert scale for injury severity and frequency were translated into the severity and frequency scores displayed in Table 2. Then, a safety risk assessment was calculated using Equation (2), and the significance of any differences in mean value comparisons was explored using an analysis of variance (ANOVA) and a t-test. A follow-up post hoc test was performed in cases where the ANOVA revealed a significant difference.

3.4. Statistical Tests

Based on the findings in the reviewed studies, it was hypothesized that sociodemographic factors would influence construction fieldworkers’ risk perception skills. The research hypothesis was investigated by computing and analyzing the workers’ SRA score using a univariate ANOVA for categorical variables with more than two levels and a t-test for independent variables with two levels. The data was checked to see if they met all the assumptions for univariate statistical methods. It was observed that the dependent variables (SRA scores) failed the normality test. Although non-parametric tests are suitable for analyzing non-normally distributed data, previous studies have concluded that parametric tests have a higher power than non-parametric tests, and thus, the former identify data actual effects better than the latter [68].
Moreover, Rasmussen and Dunlap [69] have emphasized that analyzing transformed data using parametric tests is more accurate than analyzing raw data with non-parametric tests. Hence, the non-normally distributed continuous variables were transformed into normal variables via SPSS software by first calculating the fractional rank of each score to achieve statistical uniformity, and then using the inverse normal distribution function developed by Abramowitz and Stegun in 1964 to calculate the z-score, which produced a normal distribution that contains real numbers: positive and negative scores [70]. Since negative risk scores are not acceptable in the SRA study, the negative values were normalized using the square root transformation described by Osborne [71] and mathematically expressed in Equation (3):
( | m i n   v a l u e | + 1 + D V )  
where DV is the dependent variable, and |min value| is the absolute of the lowest value in the dependent variable under consideration.
The normality test was reassessed using the normalized variables, and the histogram and the normality Q-Q plots showed that the normality assumption was met, and parametric tests were conducted. Six independent variables (IVs) were considered, and the impact of each of the IVs on each of the dependent variables (DVs) was considered individually.

3.4.1. ANOVA

A univariate ANOVA was used to understand the effect of the respective sociodemographic characteristics (age, safety training, and education level) on construction workers’ ability to evaluate safety risks for the respective accident causes. The ANOVA was used to test whether field employees with varying levels of safety training, age, or education perceive risks the same way in a given workplace. Prior to this test, we confirmed that the SRA scores were measured on a continuous scale, the independent variables had three or more categorical groups, the samples were independent of one another, there were no significant outliers in the data, and the transformed SRA scores were approximately normal. A homoscedasticity test was also conducted to ensure the equality of variances, but in situations where the assumption was violated, the outcome of a Brown Forsythe test was reported rather than the ANOVA test. Table A1 of the appendix page shows the results of the Levene’s test.

3.4.2. Independent t-Test

Similar to the ANOVA test, an independent t-test was used to examine the influence of the sociodemographic characteristics of construction workers on their SRA. Specifically, the influence of gender, ethnicity, and work type on field employees’ ability to assess risk was investigated. The results of the equality of variance test are shown in Appendix B.

4. Results and Discussion
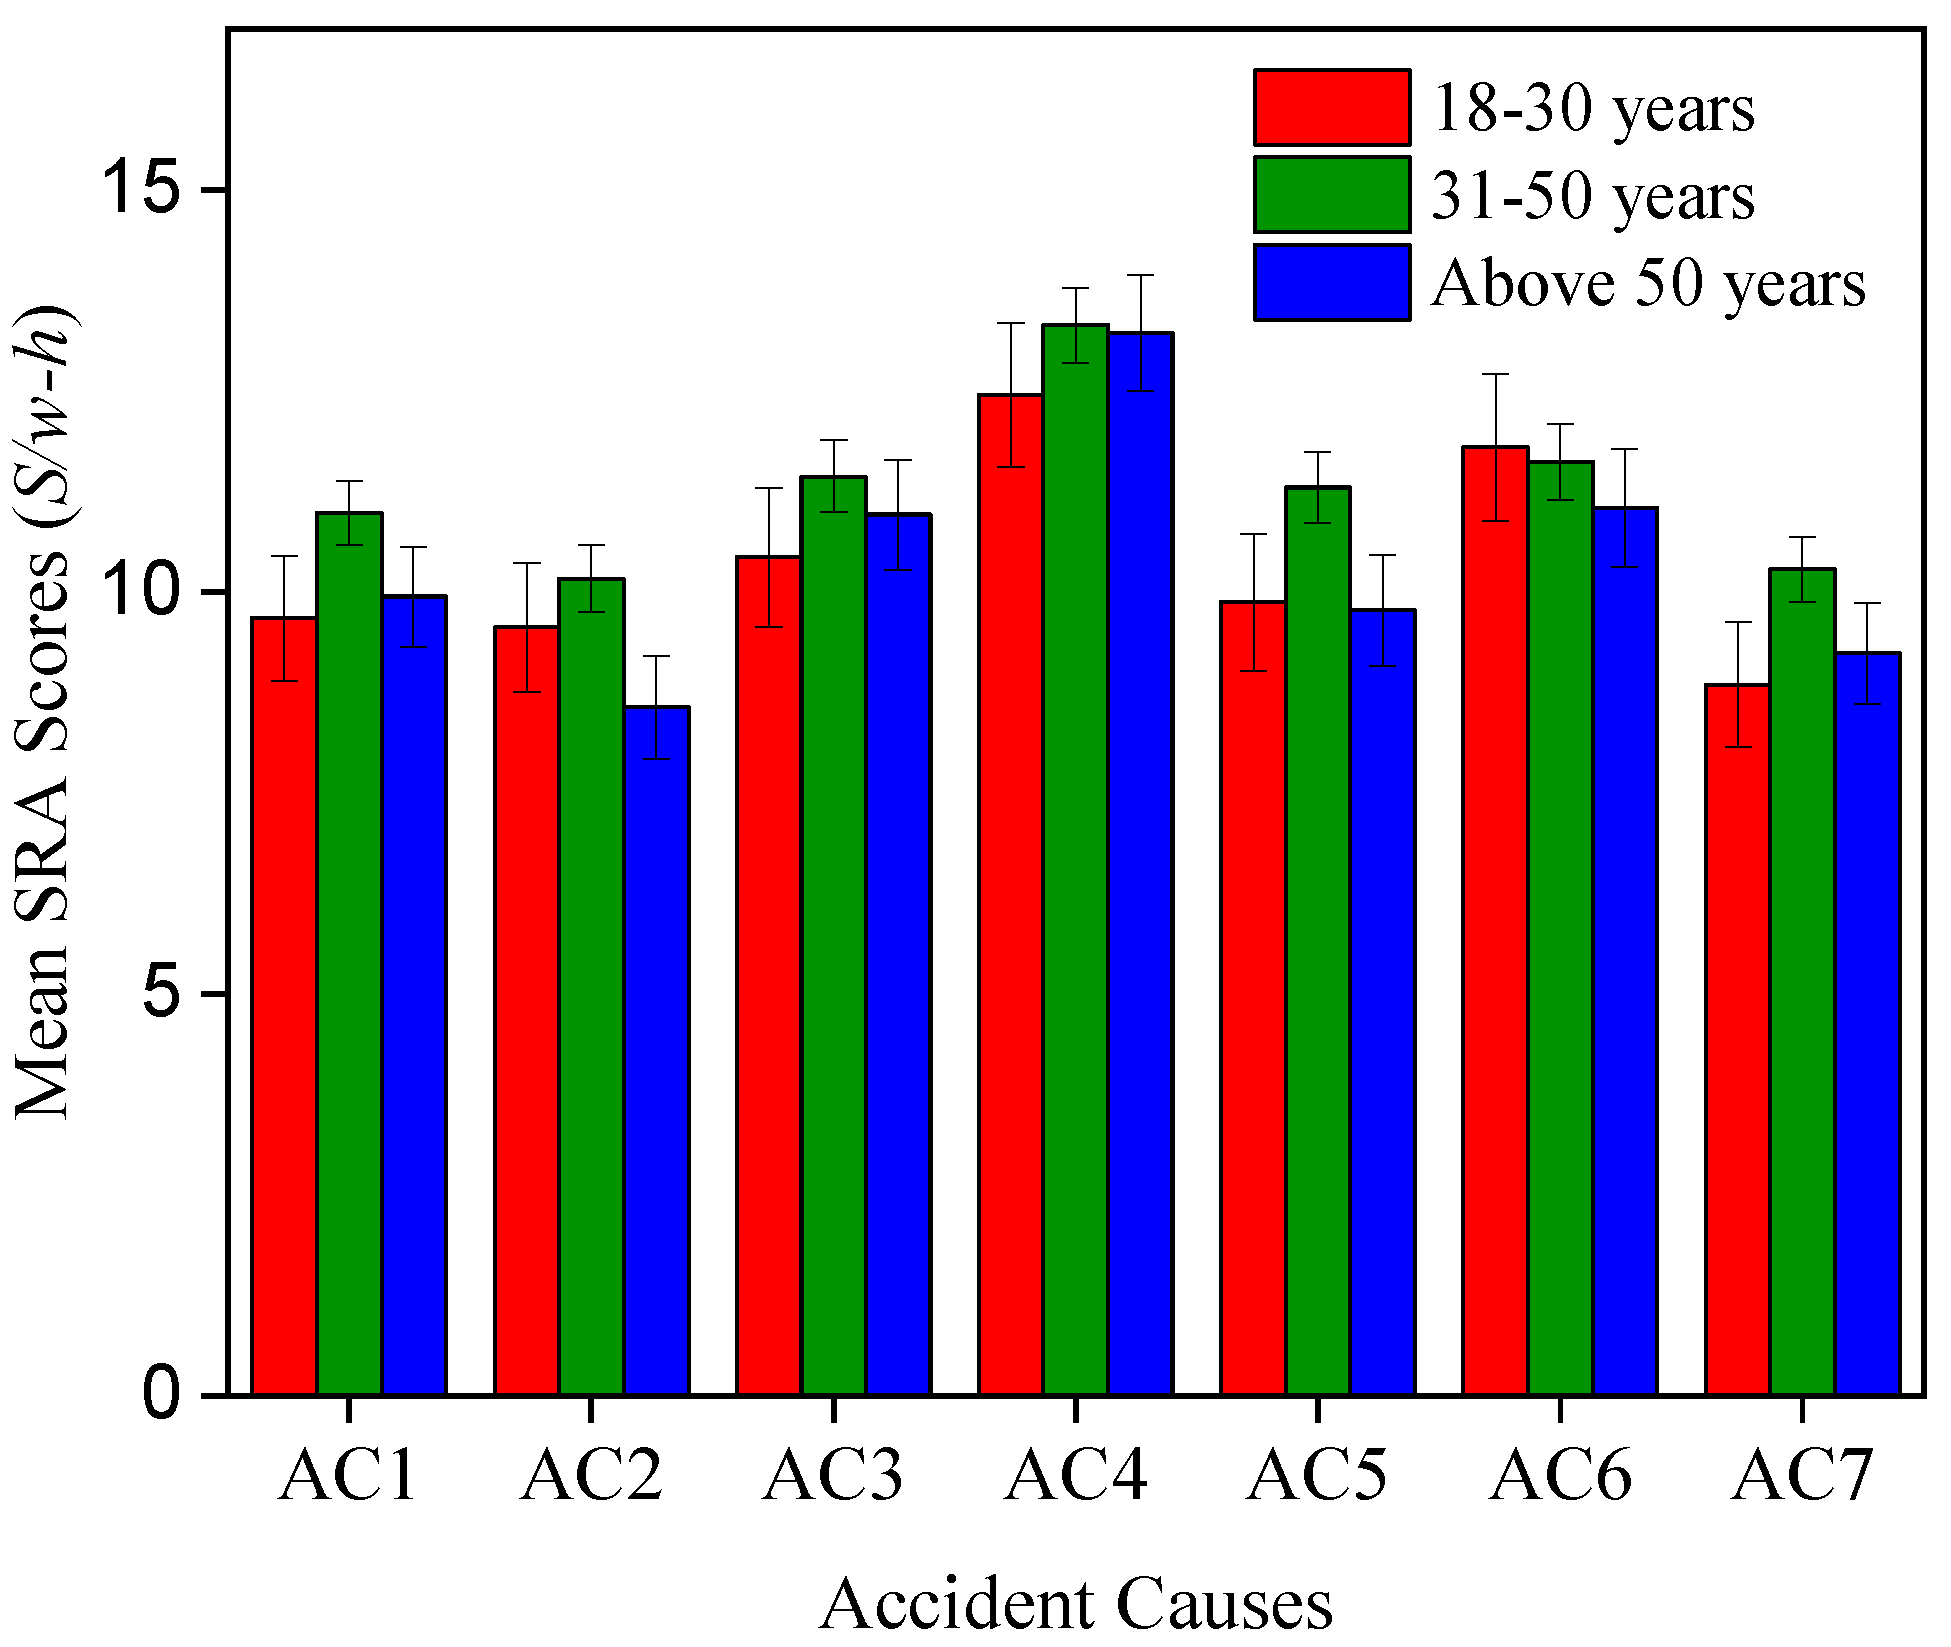
This section presents the results from the statistical analysis and discusses the findings regarding demographic factors. SRA is defined as the hazard assessment ability of construction workers, and a significance level of 0.05 was used. Construction workers with a high SRA have a relatively higher safety awareness of the potential risks of the hazard present on the jobsite (and vice versa). The descriptive statistics result is shown in the Appendix B (Table A2). Table 3 shows a summary of the demographic information of the fieldworkers who participated in this study.
The accident causes are represented as follows in Figure 3, Figure 4, Figure 5, Figure 6, Figure 7 and Figure 8: AC1 = Slip, trip, or fall on the same level; AC2 = Struck by an object; A3 = Caught-in or -between objects; AC4 = Electrocuted; AC5 = Fall to a lower level; AC6 = Trapped in or between objects; AC7 = Step on an object.

4.1. Age of Workers

A univariate ANOVA was used to investigate the influence of age on construction workers’ SRA scores for the respective accident causes. Levene’s test showed that except for the “caught in-between objects” SRA scores, all other SRA scores have equal variances with a p-value that range from 0.162 to 0.877. The “caught in-between objects” SRA scores, on the other hand, have unequal variances among the groups (p-value = 0.042), and as a result, Brown Forsythe tests were reported. From the descriptive statistics, we expected a significant difference between the middle-aged workers and the older workers for “slip, trip, or fall on the same level,” “struck by an object,” and “fall to a lower level” accidents.
However, the ANOVA test showed that the difference in the mean SRA scores recorded by the respective age groups was statistically insignificant (p-values ranged from 0.100 to 0.186). This finding indicated that all the workers, irrespective of their age, similarly perceived the risk of losing their balance while working in a damp environment, the possibility of injury from overhanging loads, and the risk of working near an unprotected hole. Furthermore, the outcome of the statistical test also revealed that age had no significant impact on “Trapped in or between objects,” “Caught-in or-between objects,” and “Step on an object” accident causes with p-values that ranged from 0.161 to 0.553. This outcome is not consistent with the previous findings that age significantly influences workers’ perception of safety risks [14,16,17,47], and this difference could be a result of the sample of participants used for the study.
Lastly, the ANOVA test result for the electrocution event was noteworthy. Although the figure clearly shows no significant difference (p-value = 0.692) in the mean SRA scores provided by the employees regardless of their age group, they assessed the risk of placing energized equipment in a damp environment higher than other jobsite safety risks. This finding validates the conclusion drawn by Greening [72] that self-projection into hypothetical realities for an electrocution incident leads to high SRAs as a result of low perceived control. In other words, given that about 72% of the workers considered in this study have been involved or witnessed an accident, the majority were able to envisage a potential electrocution accident in their minds, believing that they have little control over a potential electrocution incident at the construction site. This belief caused them to rate the risk of electrocution astronomically high. The statistical value for the test is shown in Table 4.
Table 4 shows the ANOVA result and the significant value of the effect of sociodemographic factors on SRA of the respective accident causes. As shown in the table, only education significantly influenced the SRA of an accident cause.
These findings suggest that relative to other age groups, middle-aged workers recorded the highest mean SRA scores across the accident causes except for the variable “trapped in or between objects,” where the young workers recorded the highest SRA score, whereas the old workers recorded the lowest SRA score across the seven accident causes. The middle-aged workers might have been able to assess the risk higher than the other workers because relative to older workers, they are energetic and healthy, enabling them to perform their job efficiently while also watching out for safety risks. Compared with young workers, the middle-aged workers might have undergone more trainings and gathered the experience necessary to assess safety risks on the job. The older construction workers, on the other hand, may record low SRA scores for the following reasons: (1) rather than focusing on both the job details and the hazards tied to the job at the same time, their energy is dwindling, and they could only focus on completing the job [73]; (2) at the jobsite, older workers adopt a “macho” culture, where they understand that a situation is dangerous but still want to take the risk because they are afraid of being criticized by their peers [74]; (3) older workers are difficult to train and are resistant to workplace health and safety rules [75]. Although age had no significant impact on construction workers’ SRAs, construction employers are advised to pay special attention to older workers at their jobsites to eliminate or minimize workplace safety risks.

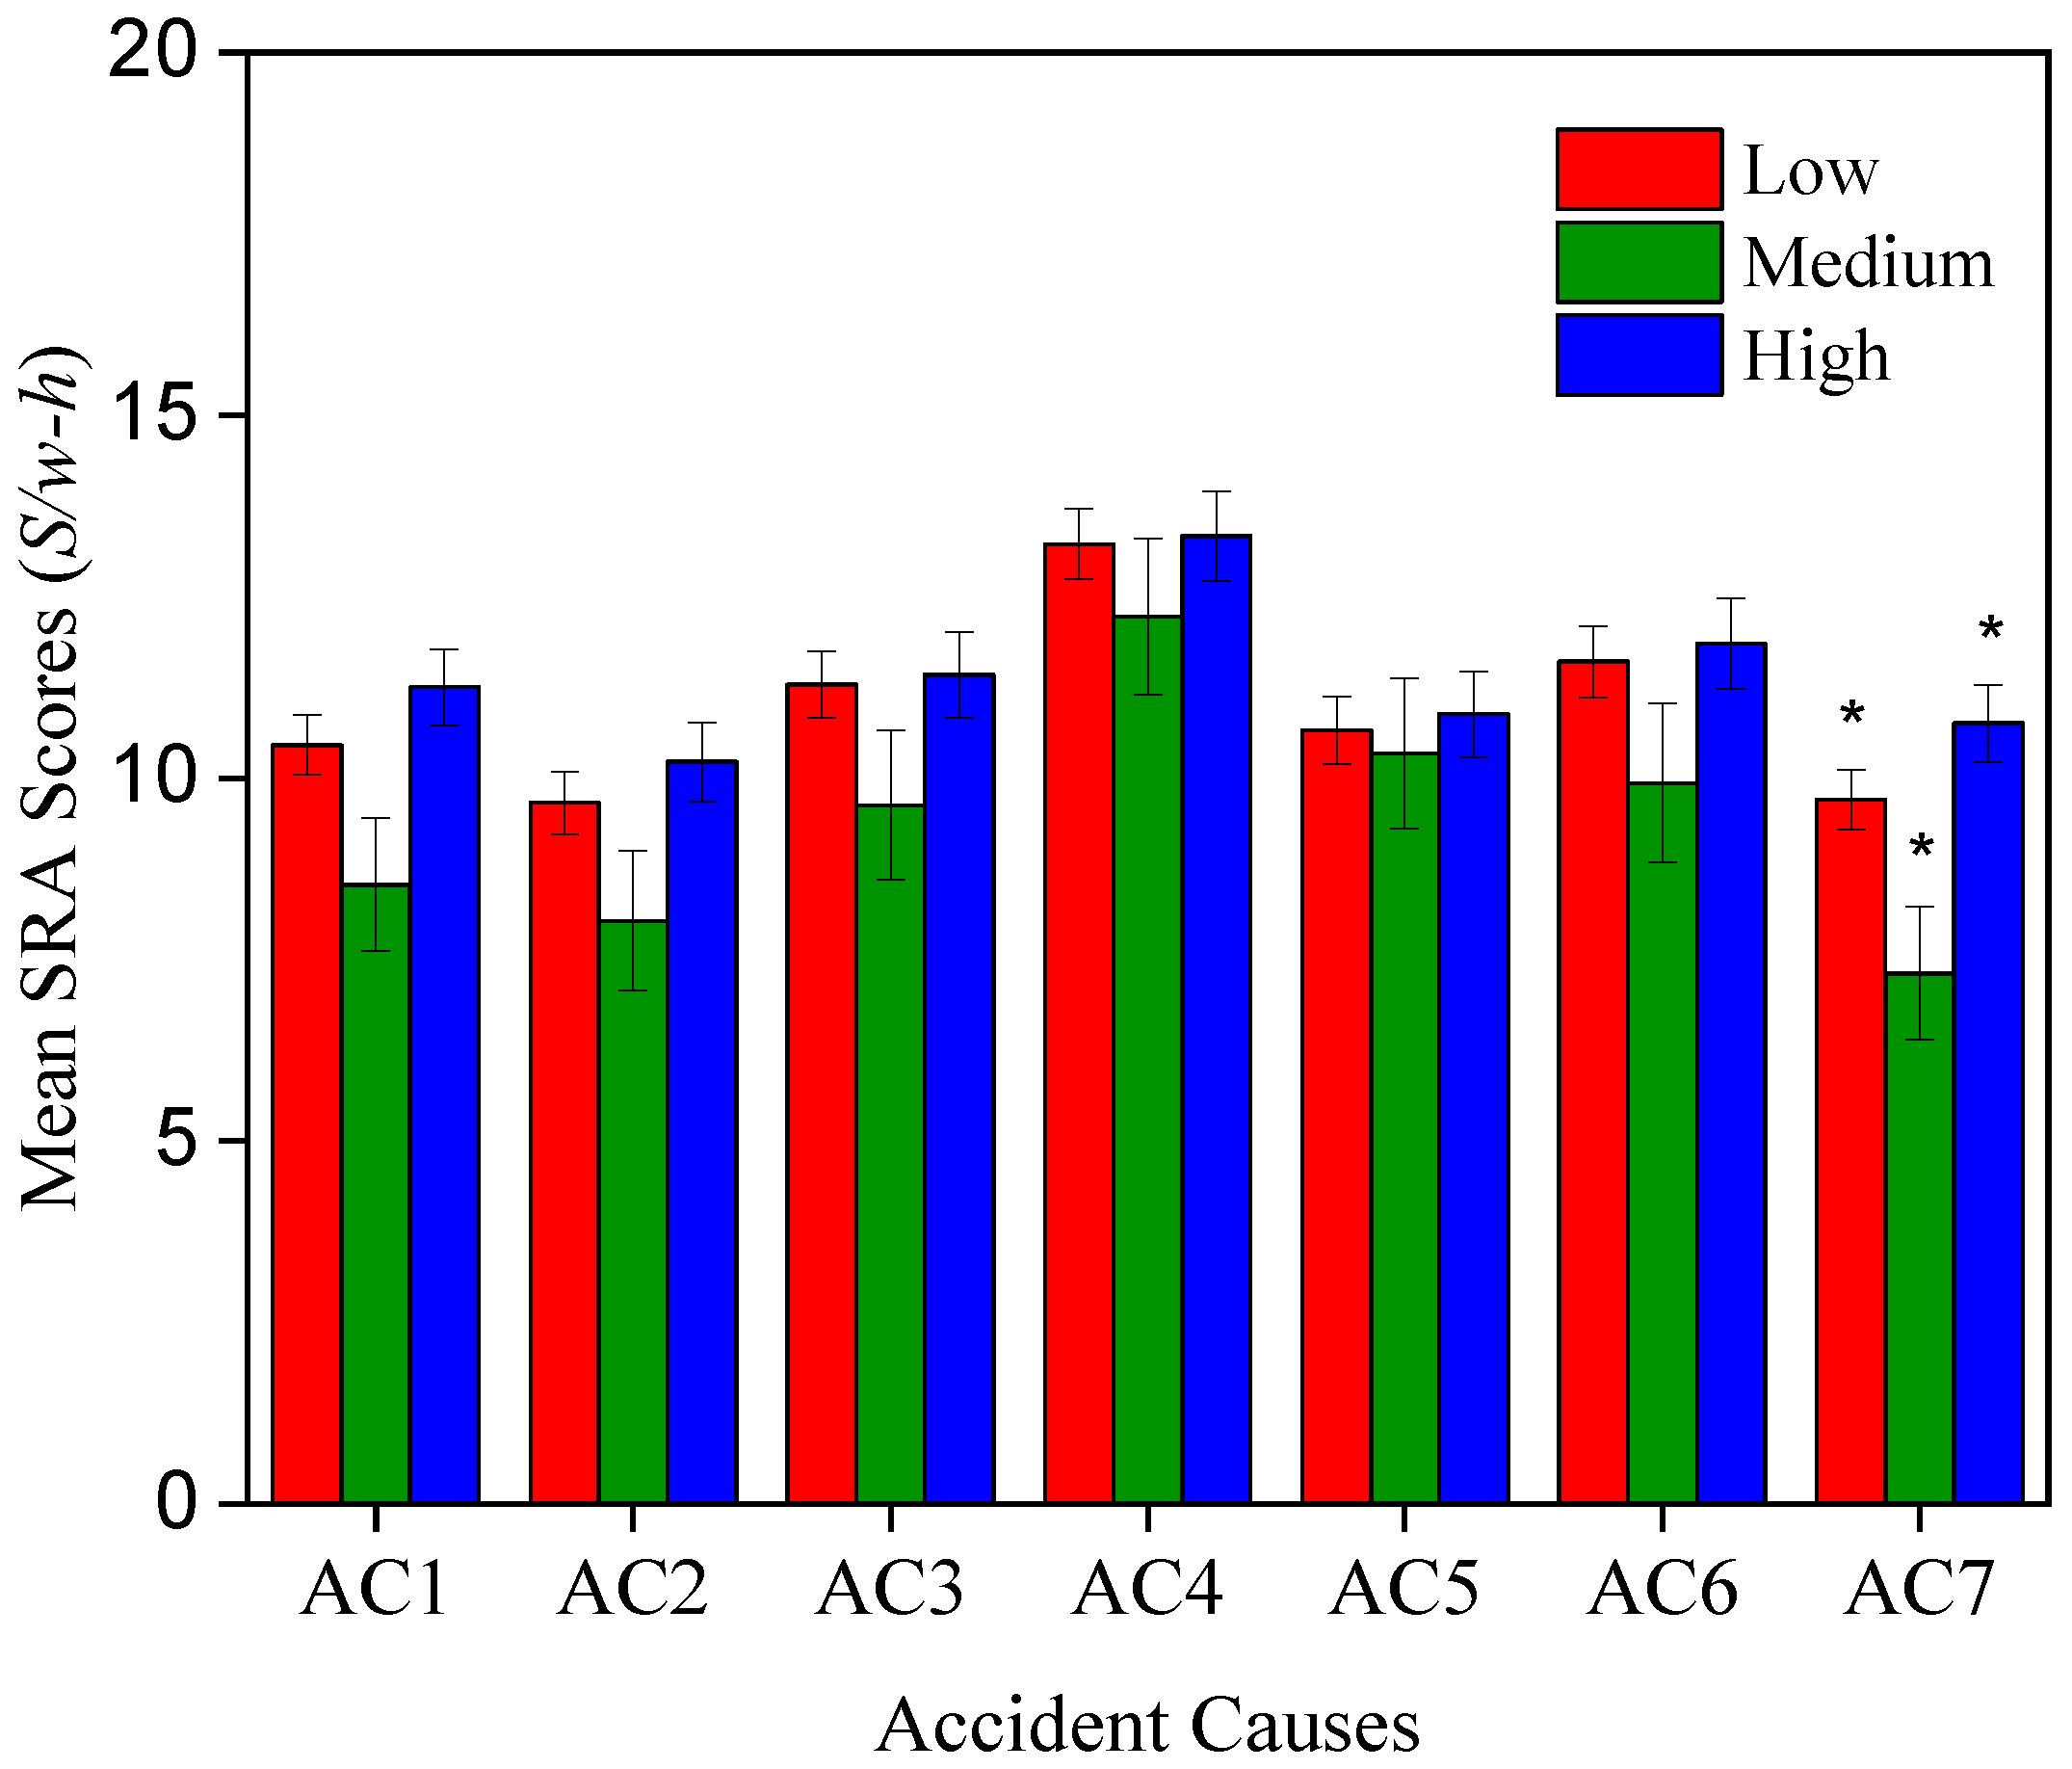
4.2. Education Level of Workers

A univariate ANOVA test was conducted to examine the effect of workers’ education on their SRA score for the respective accident causes. Levene’s test showed that all the variables have equal variances (p-value ranging from 0.094 to 0.706) except “slip, trip, or fall on the same level” and “step on an object” incidents, which violated the equality of variance assumption (p-values = 0.003 and 0.023, respectively) and thus a Brown Forsythe test was conducted for these variables. We predicted the mean SRA scores of the three various levels of education for “slip, trip, or fall on the same level” accident cause to be considerably different based on the descriptive data. However, the Brown Forsythe test revealed that the difference was insignificant (p-value = 0.096). This finding indicated that construction employees, regardless of their degree of education, perceive the risk of losing one’s balance, catching one’s foot on a dangerous object, or worse, falling on the same level in a similar way.
On the other hand, the Brown Forsythe test established a significant effect in the mean SRA scores of the workers for the “step on an object” accident cause for the three different education levels: F (2, 46.877) = 4.199, p-value = 0.021. This result revealed that workers with a high education level assessed the risk of a worker stepping into rippling rings of electrical current that are invisible to the eye due to the presence of an energized cable on the floor in a wet environment higher than workers with a medium education level. The difference in their mean risk scores was 3.50 S/w-h. This finding aligns with the conclusion drawn by other studies that the education level of workers significantly impacts their SRA [37,43]. However, the other pair comparisons were insignificant.
Moreover, from the descriptive statistics, one would expect a significant difference between the mean SRA scores reported by the workers for the “struck by an object” accident cause. However, the statistical analysis showed that different levels of education have no bearing on how the workers perceived the risk (p-values = 0.147). Similarly, the outcome of the ANOVA test for the influence of education on the respective accident causes, namely: “trapped in or between objects,” “caught in or between objects,” “electrocuted,” and “fall to a lower level,” demonstrated that the difference in the mean SRA scores of workers with a low level, medium level, and high level of education was not statistically significant. The p-value ranged from 0.289 to 0.898, demonstrating that other than the risk of stepping on an energized cable, the construction workers would assess the common safety risks that happen on the construction site, similarly regardless of their level of education. The statistical value for the test is shown in Table 4.
Taken together, across the seven accident causes, the workers with a high education level recorded the highest SRA score, whereas the workers with a medium education level recorded the lowest SRA scores. One prior study has argued that workers with little to no education may record low SRA scores because they encounter difficulties comprehending the fundamentals of safety protection, obligations, and rights [51]. On the contrary, researchers have also reported that education has no significant impact on the SRAs of workers [11]. Further investigations showed that one study used safety specialists as subjects, whereas Chaswa et al. [17] and Zou and Zhang [51] used construction employees. Hence, education has a significant impact on the SRA of construction workers for “step on an object” safety incidents. Nonetheless, workers with medium education levels require specialized training and supervision on the jobsite, especially when performing tasks that may cause them to step on an object.

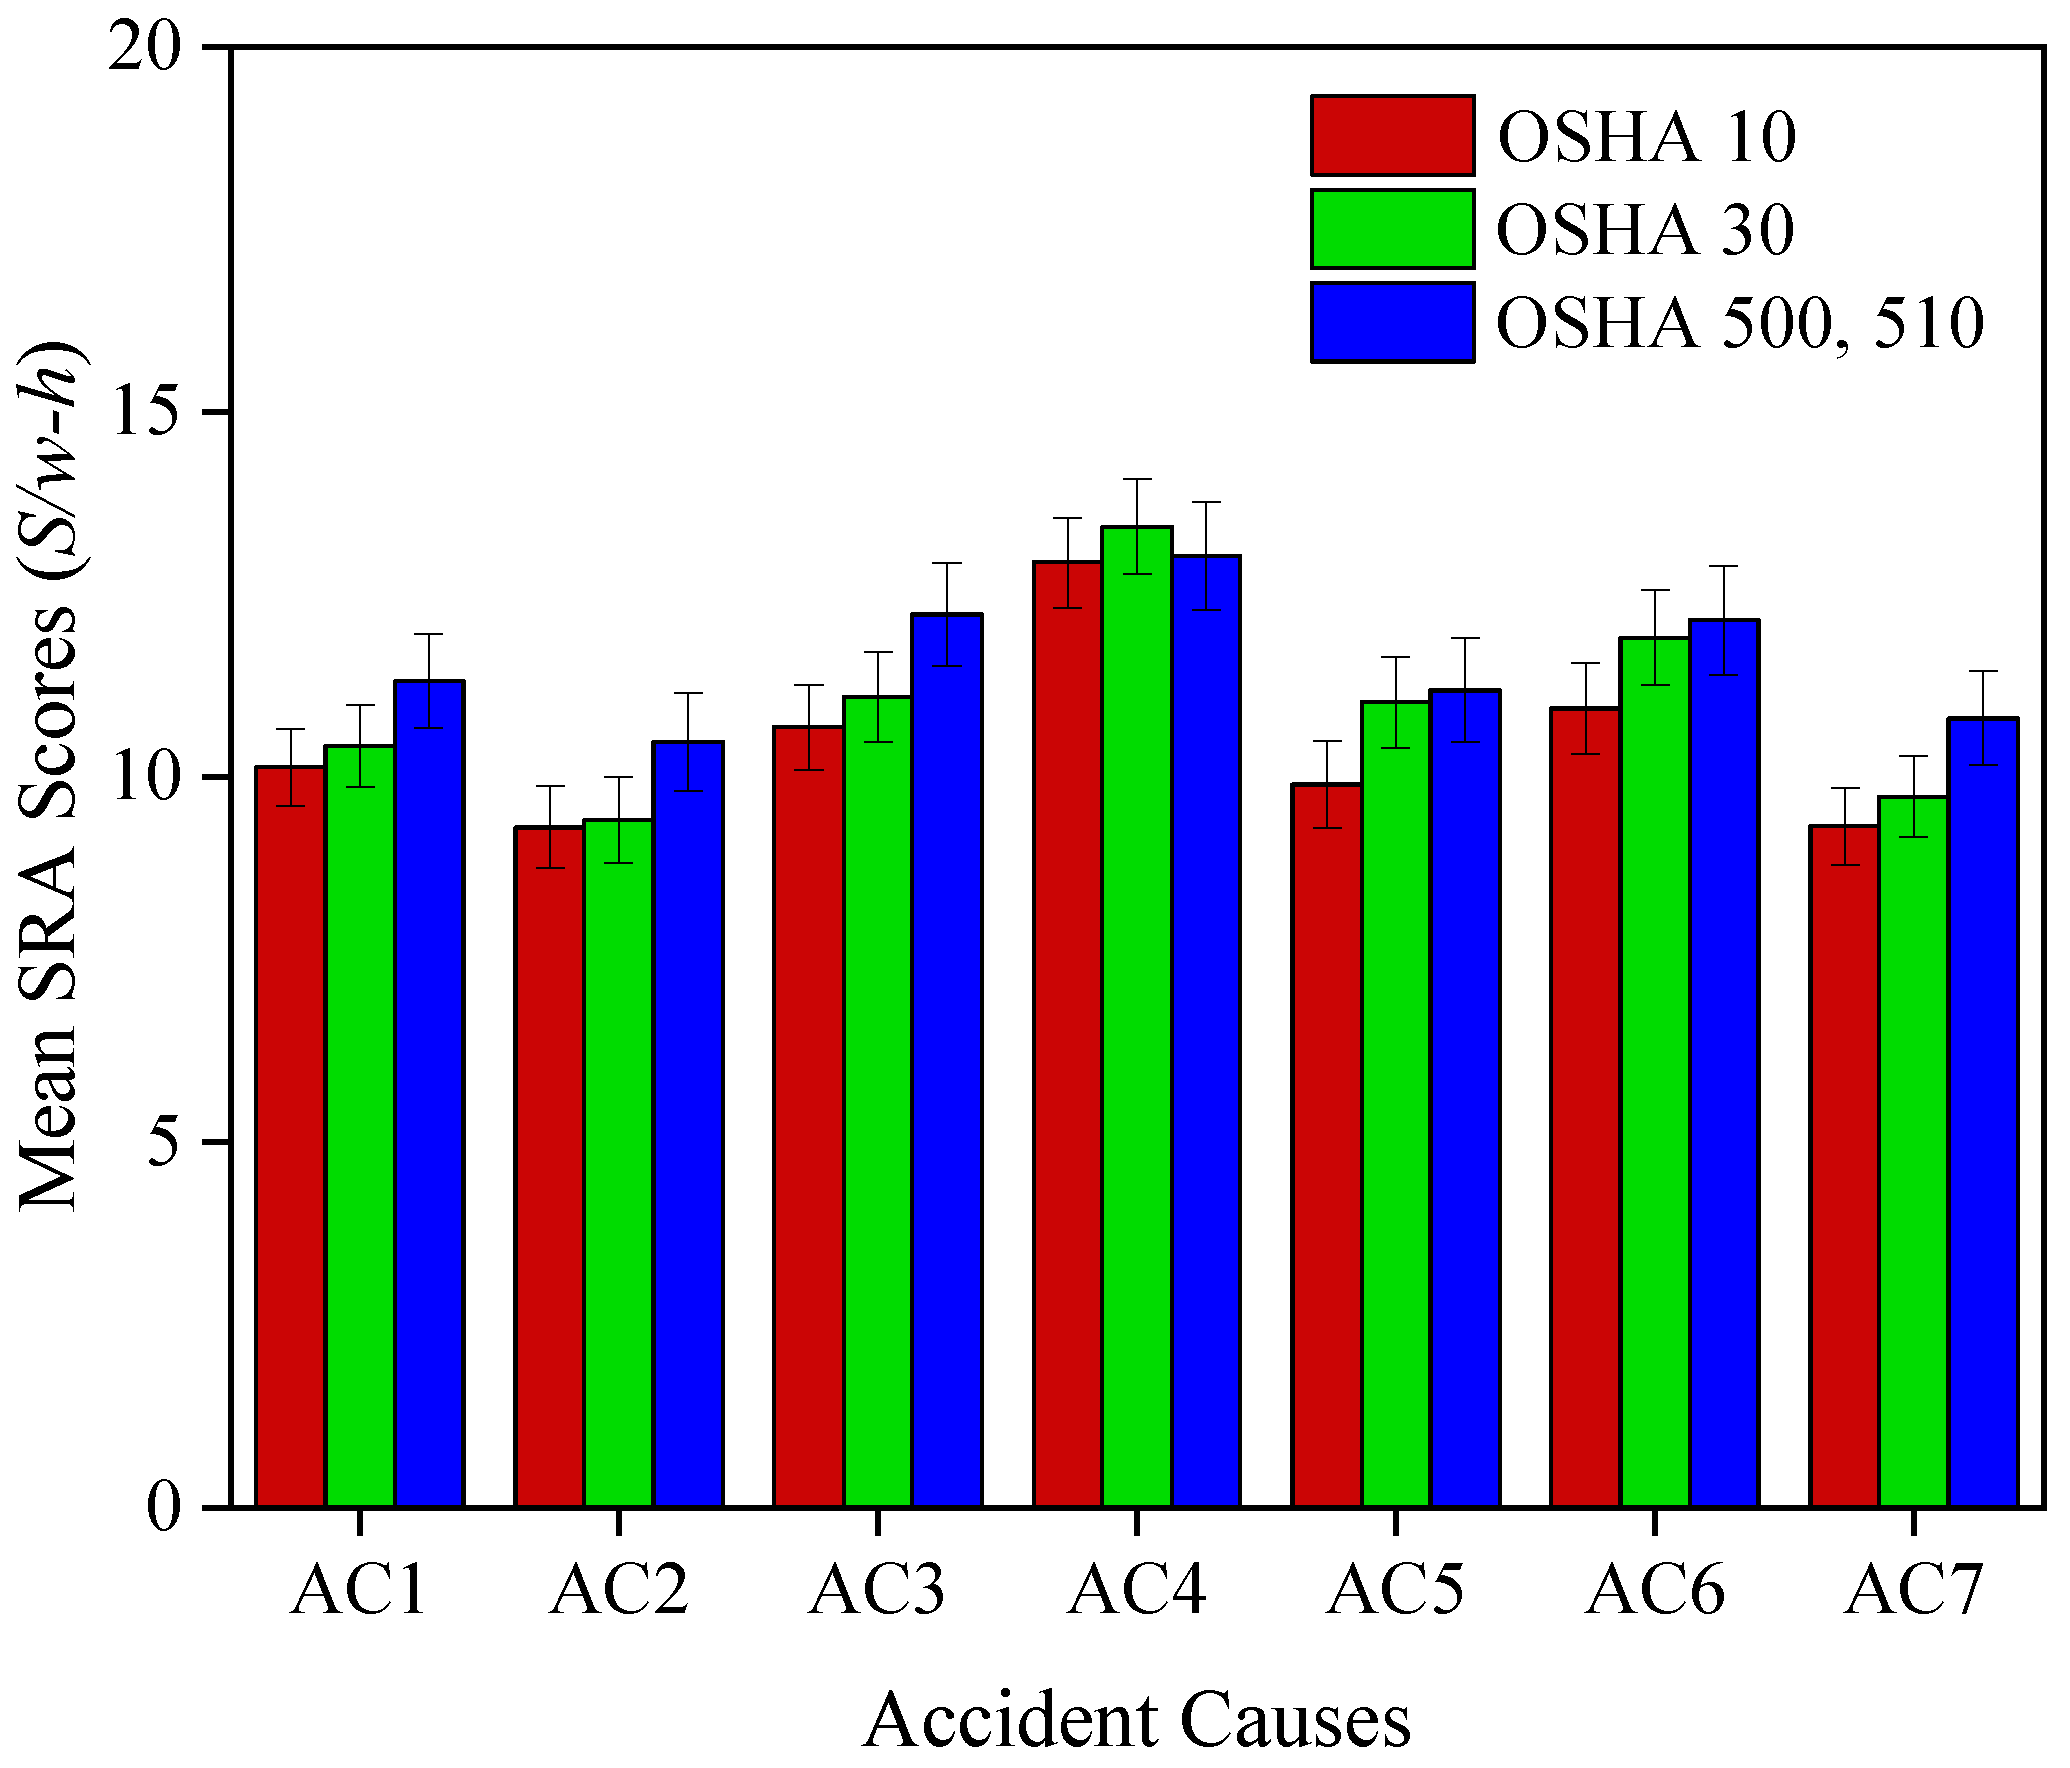
4.3. Influence of Training

A univariate ANOVA was conducted to understand the impact of training level on workers’ SRA scores for the different accident causes. Levene’s test showed that the assumption of homoscedasticity was met for six SRA scores (p-values ranging from 0.080 to 0.668) except for the “fall to a lower level” SRA scores (p-value = 0.040), and thus a Brown Forsythe test was conducted for the “fall to a lower level” incident. From the descriptive statistics, we expected that workers who attained OSHA 500 or 510 h of training would perceive the risk of “step on an object” and “caught in-between objects” accident causes significantly higher than workers with OSHA 10 and 30 h of training, respectively. However, the ANOVA test established that the level of safety training workers attained did not significantly (p-value = 0.199 and 0.236, respectively) impact their mean SRA scores.
Furthermore, the statistical analysis was repeated for the remaining five accident causes, and the outcomes showed that irrespective of construction workers’ level of OSHA training, they all assessed the risks of common accident causes at the jobsite similarly, with the p-value ranging from 0.291 to 0.849. The descriptive output for the test is shown in Table 4. This outcome confirms the conclusion drawn by Li et al. [76] that the more traditional classroom safety training received by construction employees, the lower the quality of safety-related work produced due to the fast and continually shifting workplace.
The outcomes suggest that construction workers assessed safety risks in the same way, regardless of their degree of OSHA training. This finding aligns with the conclusion drawn by Tixier et al. [21] and Eiris et al. [23] that safety training does not increase workers’ ability to recognize danger because it is based on traditional rather than modern teaching methods. Similarly, studies have shown that the modern techniques of safety training significantly improve workers’ hazard recognition skills [9] and save a significant amount of time [23]. However, Caban-Martinez et al. [20] argued that 10 h of OSHA training influences construction workers’ ability to recognize safety risks. A further investigation showed that Caban-Martinez et al. contrasted sample populations in which one group had safety training whereas the other group had no training, whereas other studies used subjects with some form of safety training in their study [21,23]. Thus, construction managers and safety trainers should encourage their workers to participate in high-engagement training rather than relying solely on traditional safety trainings to improve their workers’ awareness of safety risks.

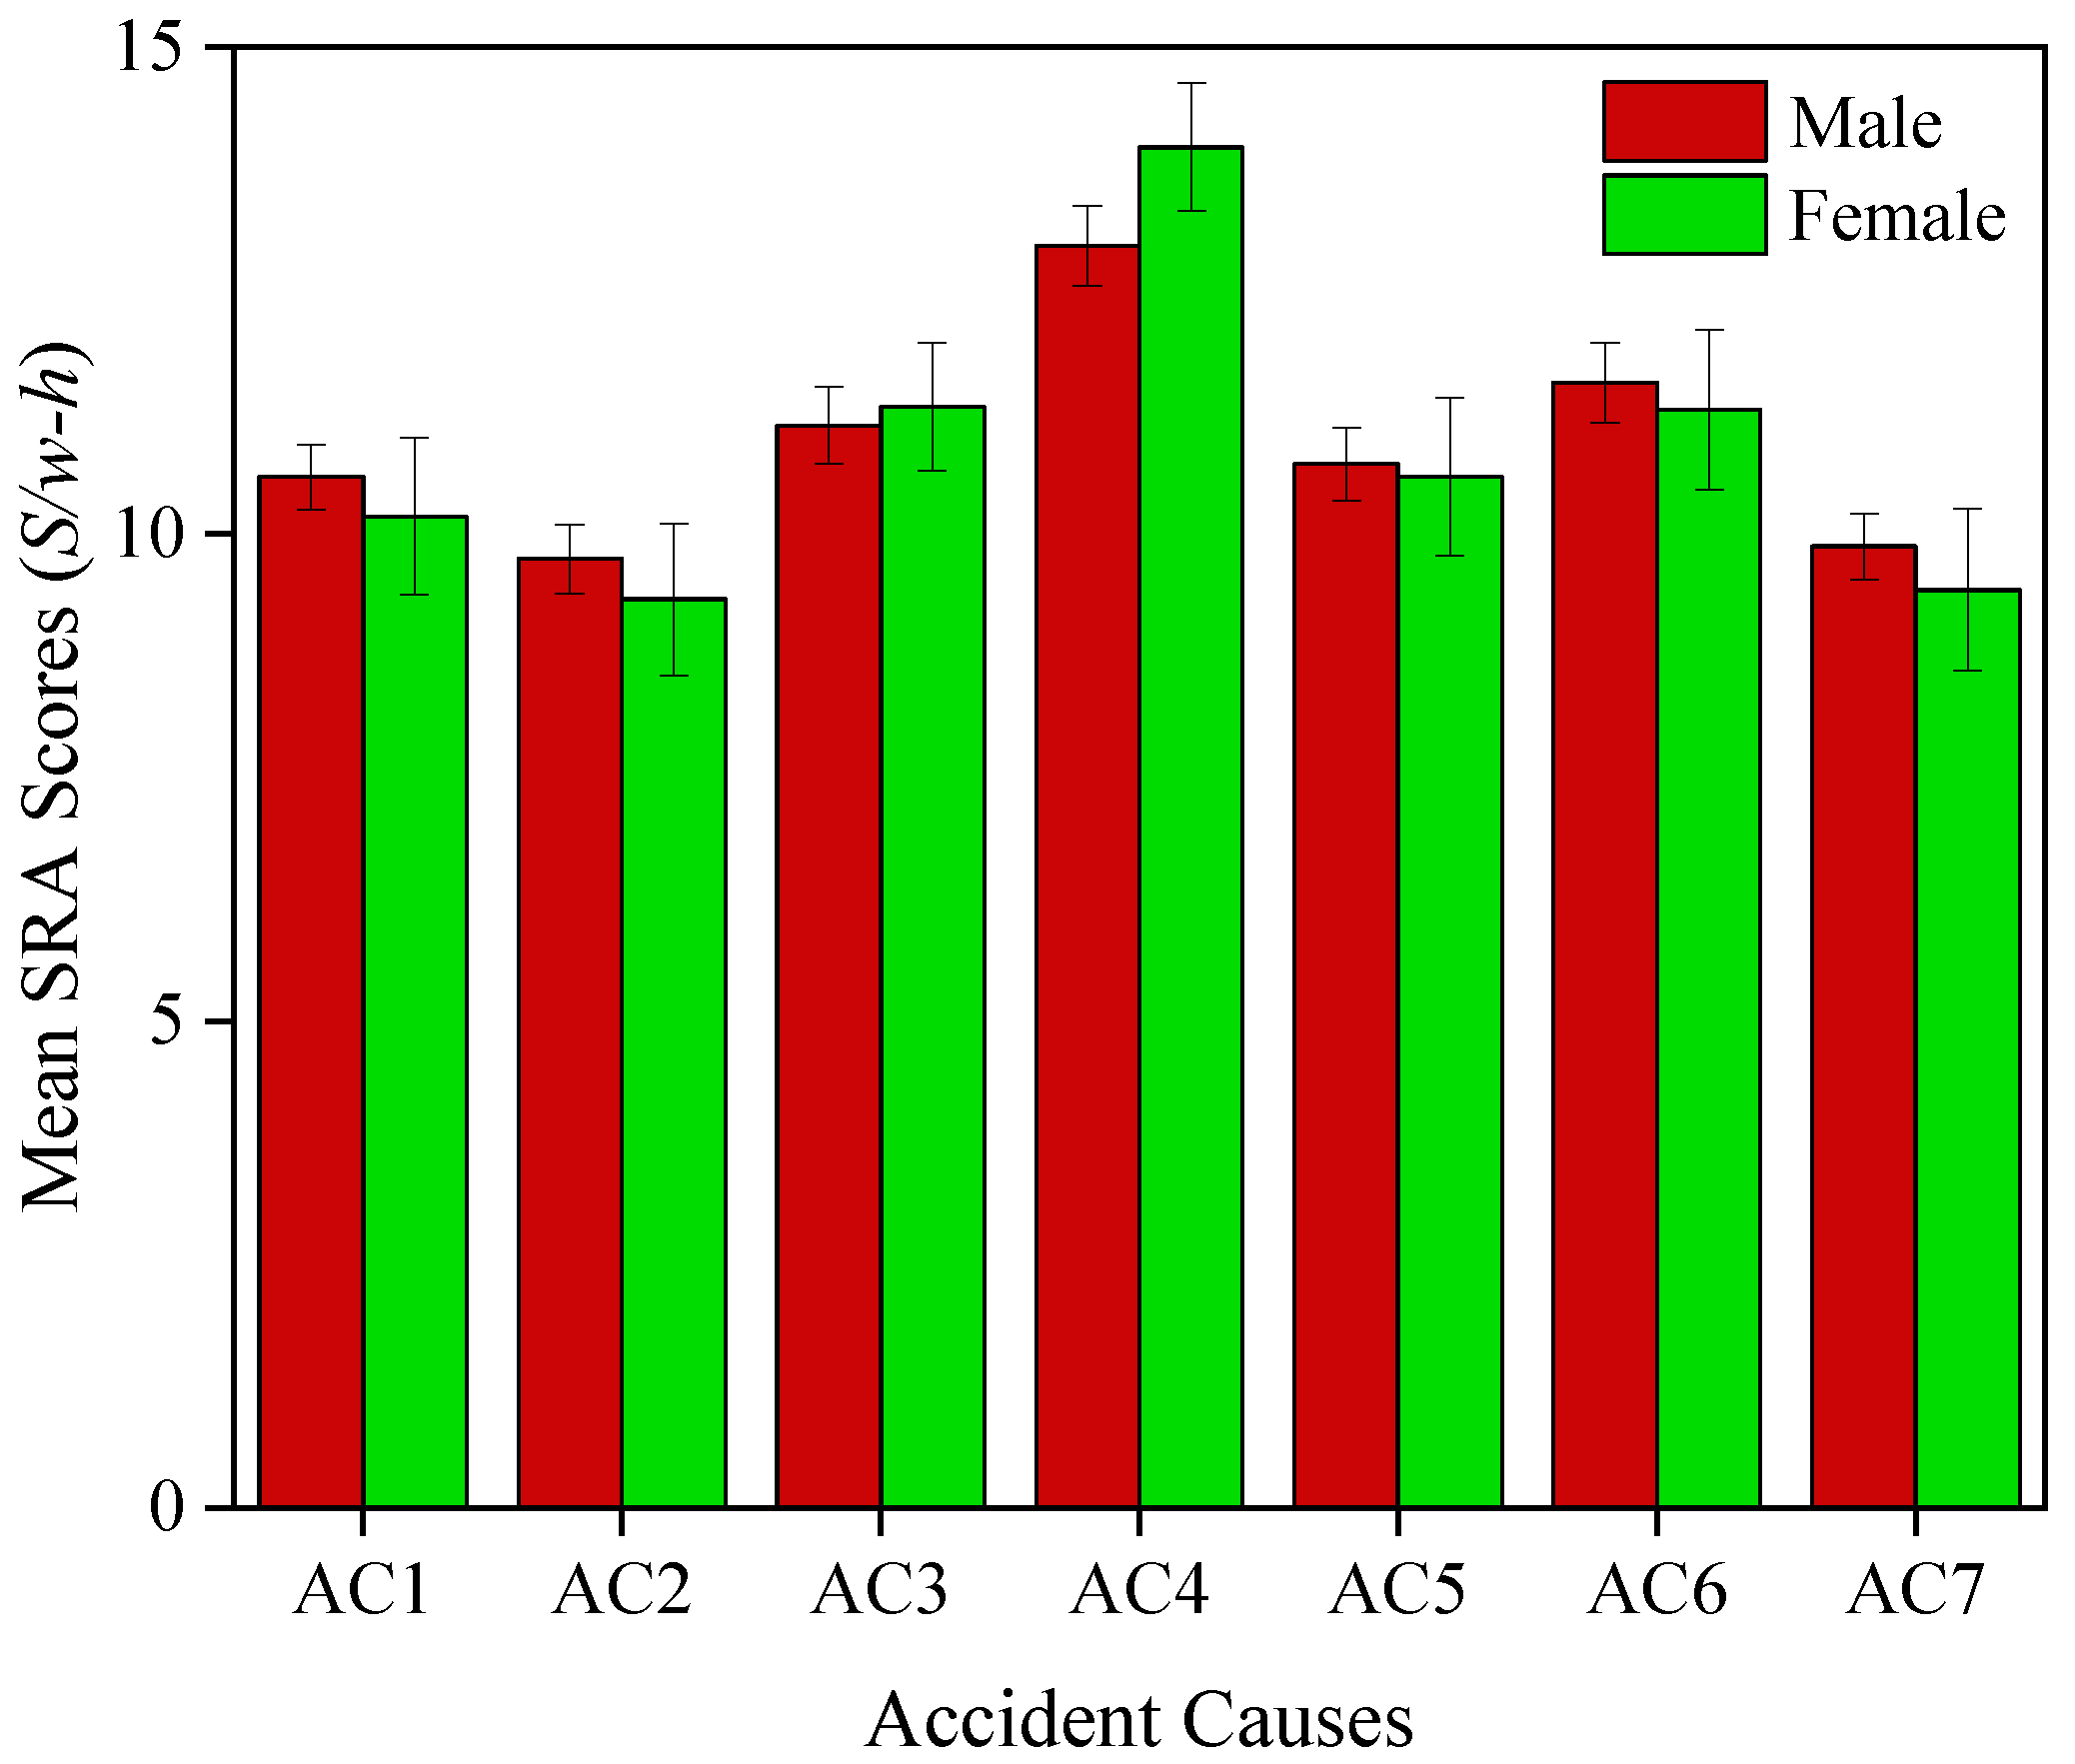
4.4. Gender of Workers

An independent t-test was conducted to compare the impact of gender on the mean SRA scores recorded by construction workers for the respective accident causes. The p-values for the homoscedasticity test ranged from 0.111 to 0.892, which showed that the assumption for the homogeneity of variance was fulfilled. The t-test result demonstrated that the difference in the mean SRA scores recorded by the workers for each of the seven accident causes was statistically insignificant, with p-values ranging from 0.269 to 0.883. A slight difference was observed in their mean SRA scores, with the male workers recording higher values than the female workers for most of the accident causes. Interestingly, relative to other accident causes, both male and female workers assessed the risk of electrocution to be high. Nonetheless, consistent with the finding of Flynn et al. [77], the female workers recorded a higher mean SRA score, possibly because (1) females are more highly susceptible than males, making them hypersensitive to safety risks [78]. (2) Safety and health issues are more pertinent to female workers than their male counterpart [79]. (3) Females have a lower socioeconomic position than males, making them more vulnerable to resource loss following an accident, hence causing them to over-assess safety risks subconsciously [80]. The statistical results are shown in Table 4.
Overall, this shows that male and female construction workers assessed the risk of common construction hazards at the construction site similarly. This finding aligns with the deduction made by Trillo-Cabello [11] and Wong et al. [43] that both male and female construction personnel similarly assess safety risks. More specifically, female workers recorded high SRA scores for two out of the seven accident causes, whereas the male workers recorded high SRA scores for the remaining five accident causes. As a result, male construction workers might take fewer risks than female workers. Although gender had no significant influence on construction workers’ SRAs, safety educators should prepare targeted training on accident causes for female construction workers to improve their perception of safety risks.

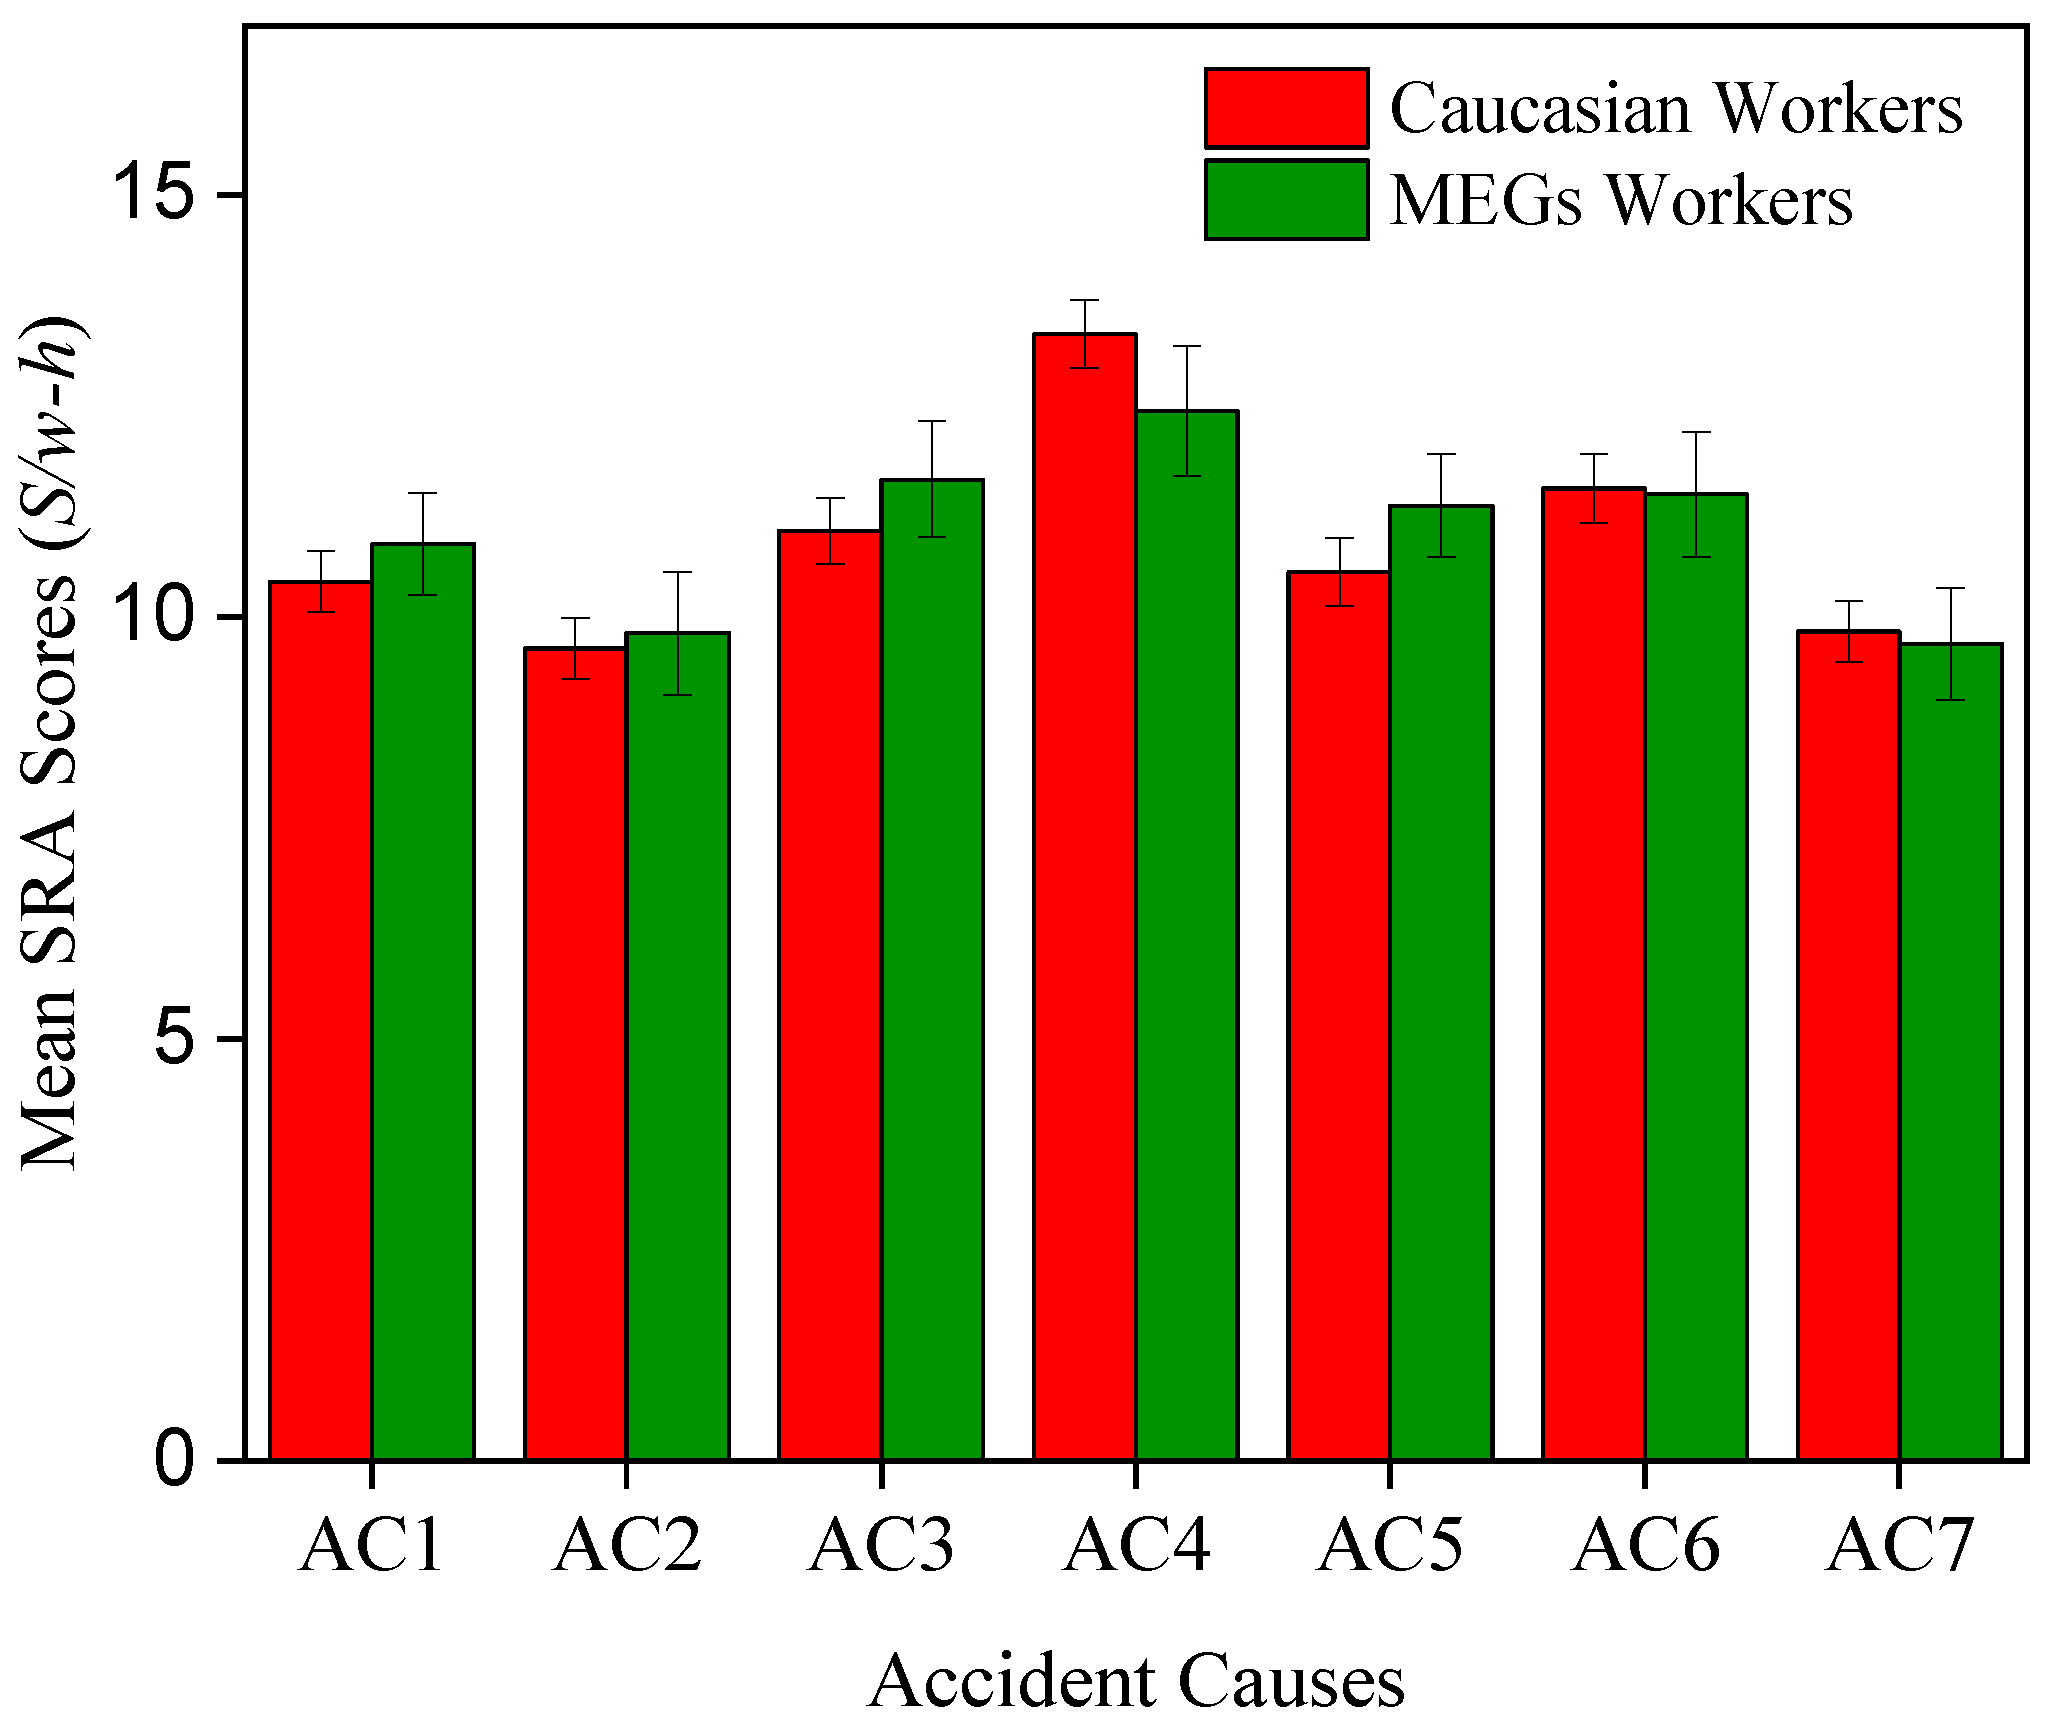
4.5. Ethnicity of Workers
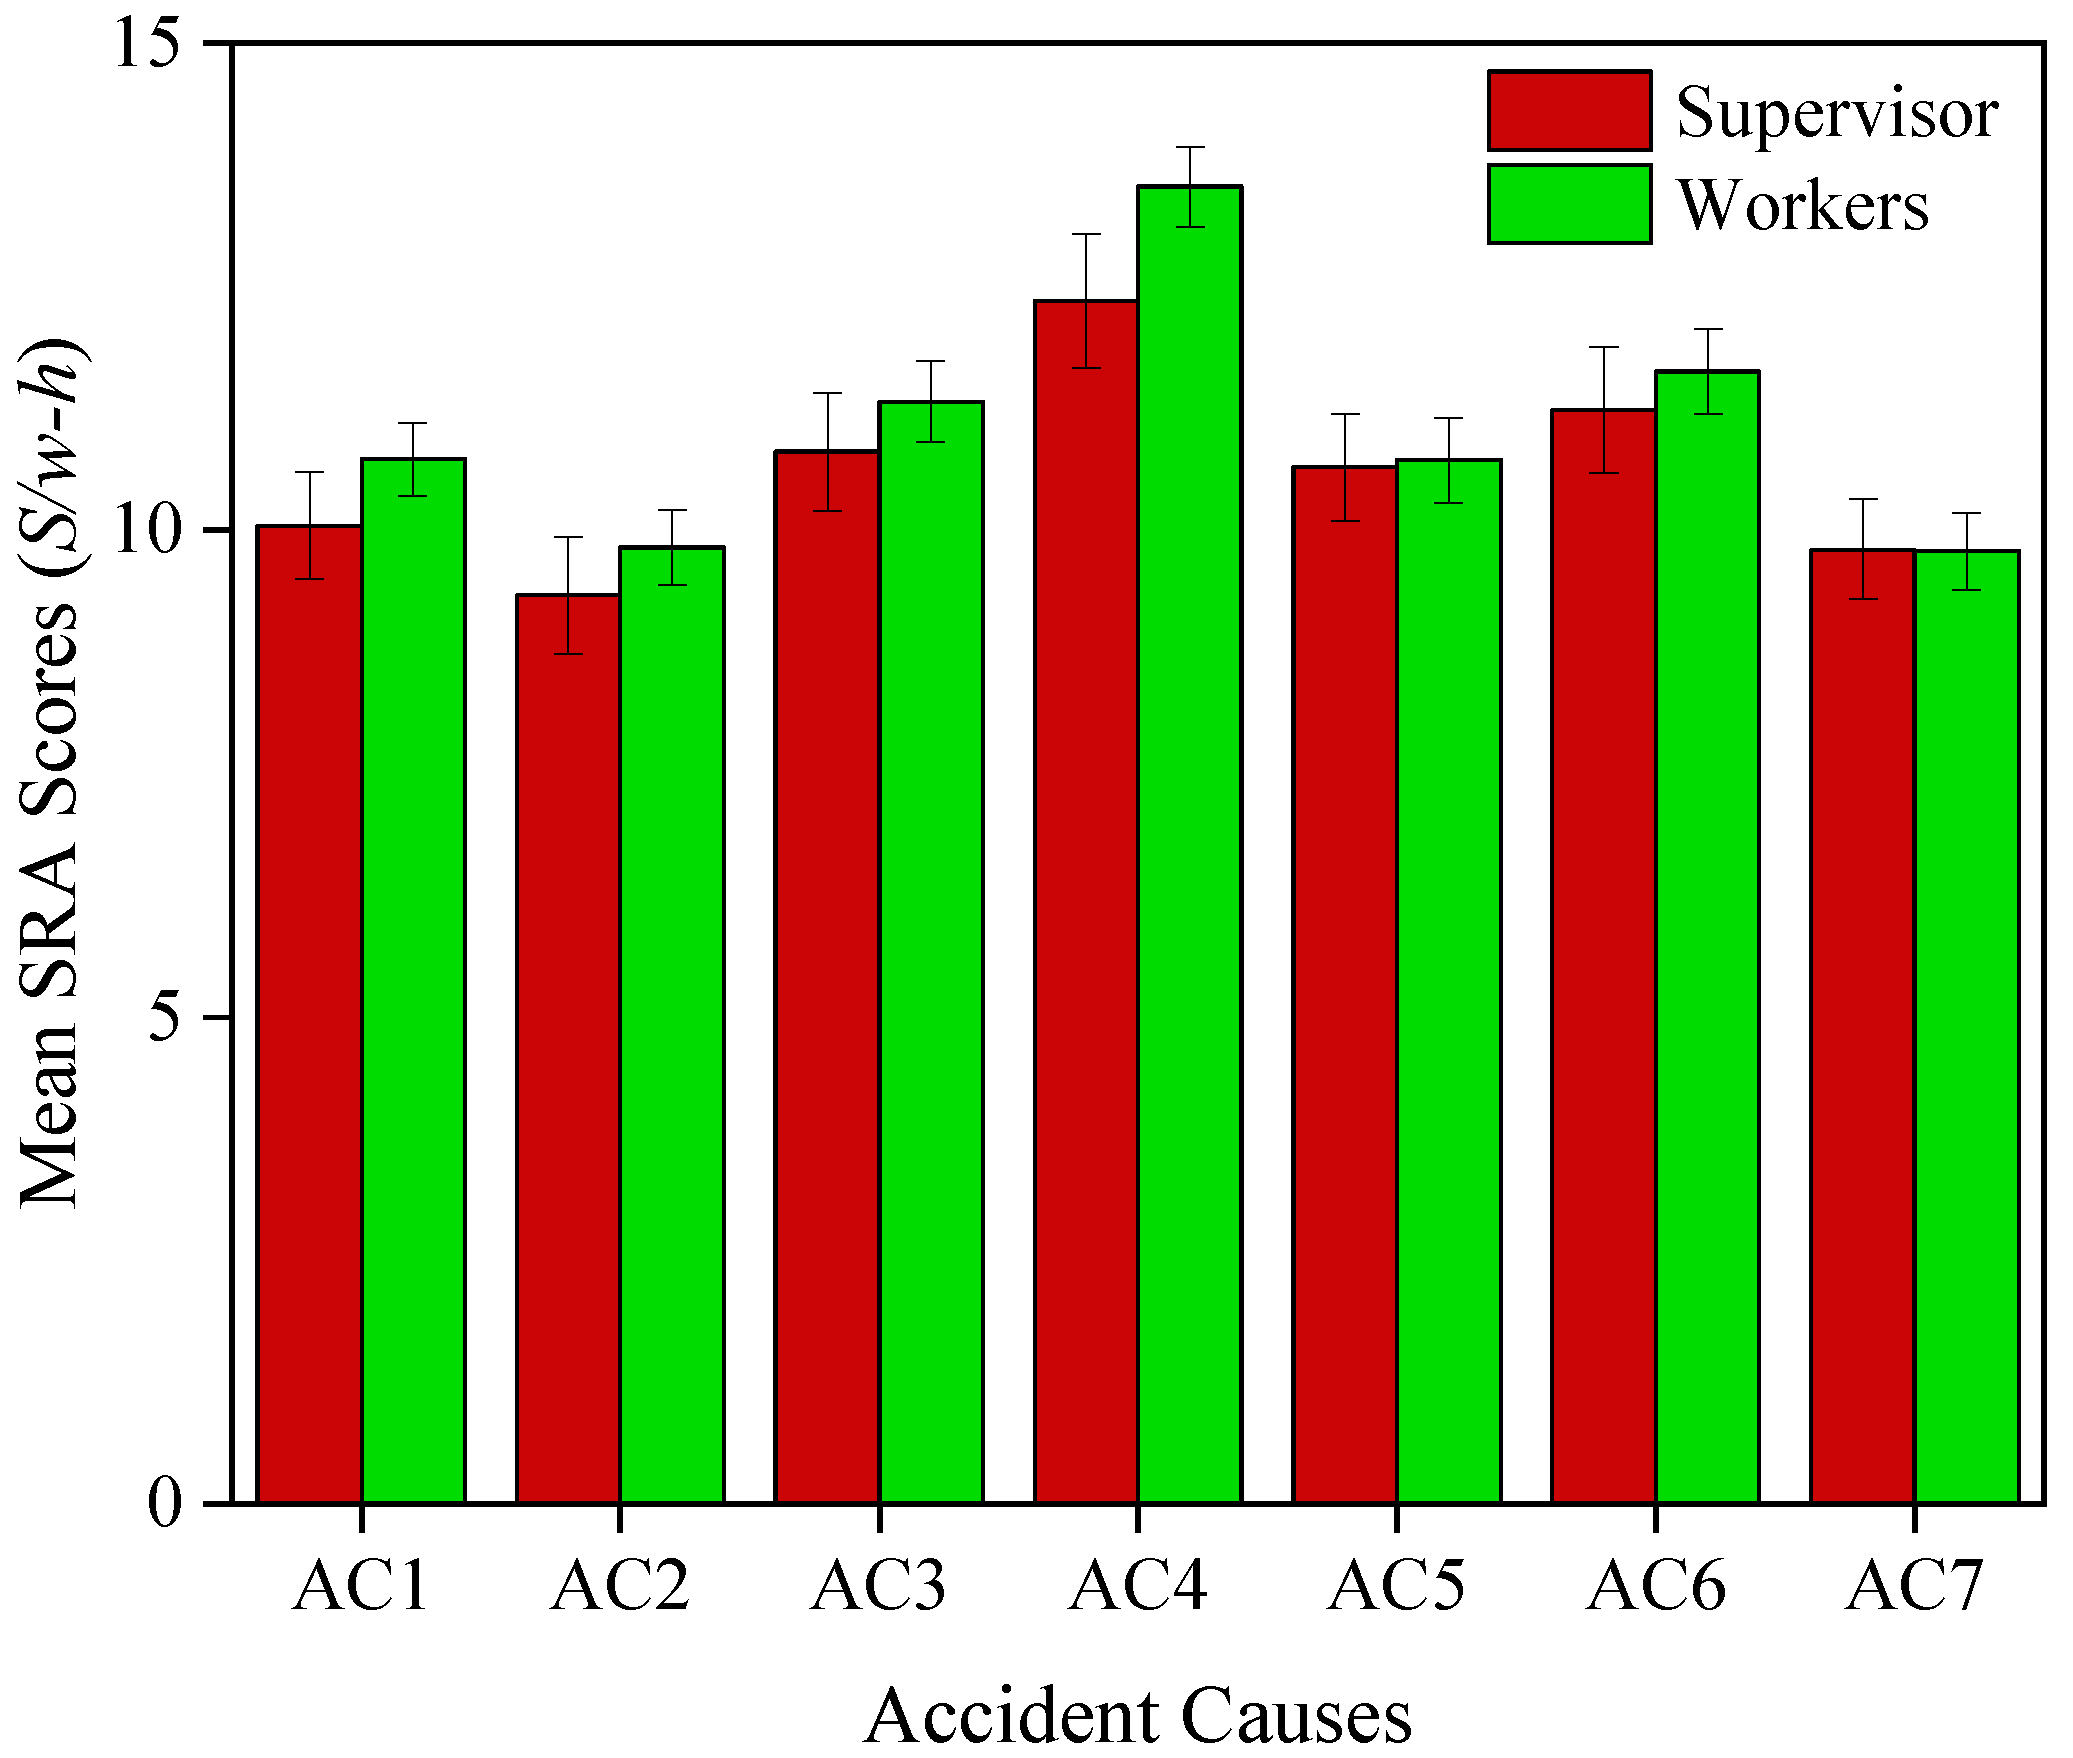
An independent t-test was used to assess the influence of construction employees’ ethnic groups on their mean SRA scores for the various accident causes. Levene’s test for equality of variances showed that the assumption was met in this analysis, with p-values ranging from 0.062 to 0.836. The outcome of the statistical analysis showed that the ethnicity of workers had no significant impact on their mean SRA scores and the p-values ranged from 0.300 to 0.945. The statistical outcome specific to this analysis is shown in Table 4.
The construction industry comprises individuals from diverse ethnic groups. This study found that although the ethnicity of workers had no significant impact on their SRA, there was a slight difference in the mean SRA scores reported by Caucasians and workers from minority ethnic groups (MEG). Caucasian workers recorded lower mean SRA scores for four out of the seven accident causes, while members of the MEGs recorded lower mean SRA scores for the remaining three accident causes. Relative to Caucasians, the low mean SRA scores recorded by MEG workers could be among the factors contributing to the high fatality rates among members of MEGs in developed countries [42,49,55,81]. Furthermore, studies have attributed this unfortunate situation to MEG workers’ lack of work experience and training [46], their exposure to more risky jobs [82], and the failure of employers to provide them with adequate personal protective equipment [83].
On the other hand, workplace safety standards vary by country. The safety standards in countries where MEG members work are considerably higher than those of their home countries [84]. Thus, compared with locals, MEG workers may have a poor understanding of safety standards, procedures, and risks [41]. As a result, MEG workers may be subject to more corner-cutting and unscrupulous employers, and are more vulnerable to being convinced that unsafe practices are indeed safe due to lack of understanding. Hence, safety instructors should develop specialized trainings for MEG construction employees, and construction employers should provide extra supervision for MEG workers at the jobsite.

4.6. Work Type/Role

After revealing that the ethnicity of workers had no significant impact on the SRA scores of the workers, an independent t-test was conducted to understand the impact of the job role of construction personnel (supervisors vs. workers) on their mean SRA scores for the respective accident causes. A homoscedasticity test showed that the assumption for equality of variances was met for all the SRA scores (p-values ranging from 0.186 to 0.973). The outcome of the analysis showed that job role has no significant impact on the mean SRA scores reported by the workers for all the respective accident causes, with p-values ranging from 0.124 to 0.986. The rest of the statistical output is shown in Table 4.
Construction supervisors are responsible for the management and safety of employees at the jobsite; thus, it is expected that they have a considerably higher SRA score than the workers. The findings of this study, on the other hand, revealed that the frontline workers and supervisors all assessed the risk of common construction accident causes in the same manner. This result is consistent with the findings of Chan et al. [41] that the difference in safety awareness scores between construction managers and their workers is negligible. Moreover, Jazayeri and Dadi [7] posited no statistically significant difference between the risk perception ability of apprentices and safety experts. Compared with construction workers, construction supervisors recorded lower SRA scores across the seven accident causes.
However, Abbas et al. [52] and Hung et al. [25] claimed that supervisors assess safety risks better than construction workers. It was found that relative to this study that considered all states in the United States, Hung et al. limited their study to small companies in two states in the Eastern United States. Abbas et al. compared educated supervisors with foreign and uneducated workers, in which education might be a confounding variable [17,19,51]. The findings of this study reveal that construction workers and supervisors have similar perceptions of safety risks for the accident causes assessed in the present study.
In summary, sociodemographic factors impacted only one of the potential 42 assessments, less than 5% of the assessments. Therefore, the null hypothesis of the present study (sociodemographic factors significantly influence construction fieldworkers’ SRA skills) was rejected in more than 95% of the cases.

5. Conclusions and Future Research

Determining the best approach to assess workers’ ability to perceive risks in the construction industry has been a top concern for safety professionals and academics. Evaluating the influence of sociodemographic factors on construction fieldworkers’ perception of safety risks can assist companies with a diverse workforce to improve their training through focused efforts, thereby ensuring ongoing safety improvement. A detailed literature review and analysis were undertaken in this study to comprehend the submission of previous studies about the influence of demographic factors on SRAs. The review revealed six key sociodemographic factors that could impact fieldworkers’ SRA in the construction research: age, education level, OSHA training, gender, ethnicity, and work type.
Furthermore, the influence of the identified sociodemographic factors on construction workers’ SRA levels was investigated using univariate ANOVA and independent t-tests based upon their assessment of seven accident causes. Results from the analysis suggest that sociodemographic factors did not have a statistically significant impact on a construction fieldworker’s SRA, with the exception of education. Fieldworkers with higher education levels assessed safety risks at a statistically significant higher rate than workers with medium education levels for “step on an object” accident causes.
However, sociodemographic factors had a statistically significant impact on less than 5% of the assessments. Given the limited effect of sociodemographic factors on SRA, it is necessary to investigate other individual traits that might complement sociodemographic factors to provide a fresh perspective on construction fieldworkers’ SRAs. We propose that future studies look at factors that might help practitioners and researchers improve construction workers’ SRAs, such as:
(1)
Workers’ personality traits—These factors have been explored in psychology, health, and management and found to have a significant impact on the SRAs of workers. Specifically, extroversion and conscientiousness traits in individuals have been linked to risk-taking behaviors [39,85,86], and they should be explored further within the SRA domain in the construction industry.
(2)
Workers’ cognitive biases—These beliefs have been reviewed in psychology and engineering-based studies that reveal a significant impact on workers’ perception of safety risks [87,88,89]. Therefore, researchers involved in SRA research within the construction domain should further investigate the role these factors play in workers’ perception of the safety risks of different accident causes.
(3)
Workers’ safety attitudes and behavior—These features explain whether workers are following the path to maintain workplace safety established by safety managers at the jobsite as they go about their daily activities. Moreover, studies have confirmed an association between SRAs and safety behavior [90,91,92]. As a result, future studies should investigate its impact on construction workers’ SRA for the respective accident causes.
Assessing the influence of personality traits, cognitive biases, and other behavioral factors on fieldworkers’ SRA across different construction settings can advance the current state of RP knowledge. Future research should involve an empirical investigation to determine which behavioral factors (e.g., cognitive bias, safety behavior, and personality) have the most profound influence on construction workers’ SRAs.

Author Contributions

Conceptualization, C.N. and M.S.; methodology, C.N. and A.I.; formal analysis, A.I.; data curation, A.I. and C.N.; writing—original draft preparation, A.I.; writing—review and editing, C.N. and M.S.; supervision, C.N. All authors have read and agreed to the published version of the manuscript.

Funding

This research received no external funding.

Institutional Review Board Statement

The study was conducted in accordance with the Declaration of Helsinki, and approved by the Institutional Review Board of The University of Alabama (protocol code IRB # EX-20-CM-095).

Informed Consent Statement

Informed consent was obtained from all subjects involved in the study.

Data Availability Statement

The data presented in this study are available on request from the corresponding author.

Acknowledgments

We are grateful to all the industry experts and the workers who enthusiastically participated in the presented research.

Conflicts of Interest

The authors declare no conflict of interest.

Appendix A

Table A1. Levene’s Test Result for the influence of Demographics on Risk Perception.
IncidentsEducationAgeGenderEthnicityWork RoleSafety Training
AC1df122 2
df2178178 155
F5.9530.6801.6382.1300.1121.290
p0.0030.5080.2020.1460.7380.278
AC2df122 2
df2178178 155
F2.3470.1140.4290.0671.0451.465
p0.0990.8920.5130.7970.3080.234
AC3df122 2
df2178178 155
F1.5623.2171.7500.5710.0010.743
p0.2130.0420.1880.4510.9730.242
AC4df122 2
df2178178 155
F2.9140.0252.5600.1481.7660.608
p0.0570.9760.1110.7010.1860.546
AC5df122 2
df2180180 155
F0.1560.4480.0183.5321.7063.293
p0.8560.6390.8920.0620.1930.040
AC6df122 2
df2180180 155
F0.3480.7580.0390.3110.0261.702
p0.7060.4700.8430.5770.8730.186
AC7df122 2
df2177177 155
F3.8621.8402.3880.0430.8262.103
p0.0230.1620.1240.8360.3650.126

Appendix B

Table A2. Descriptive Statistical Result of the influence of Demographics on Risk Perception.
IncidentsAC1AC2AC3AC4AC5AC6AC7
Demography FactorsMSDMSDMSDMSDMSDMSDMSD
EducationLow10.54.09.74.211.34.413.24.910.74.611.64.89.74.1
Medium8.55.78.05.39.65.412.26.110.34.99.95.57.35.5
High11.33.710.24.111.44.613.34.110.94.711.94.810.83.7
AgeYoung9.74.79.64.410.45.312.55.19.95.011.84.98.85.1
Middle11.04.210.24.311.44.813.34.711.34.611.65.110.34.0
Old9.93.78.64.411.03.613.24.89.84.411.04.59.24.0
GenderMale10.64.19.74.311.14.813.05.010.74.611.65.09.94.1
Female10.24.79.34.511.33.814.03.810.64.711.34.89.44.8
EthnicityCaucasian10.44.39.64.311.04.713.34.810.54.811.55.09.84.2
MEG10.93.810.04.511.64.312.44.811.33.811.54.69.74.1
Work RoleSupervisor10.14.29.34.610.84.612.45.210.64.211.25.09.83.8
Worker10.74.29.84.211.34.613.54.610.74.811.64.99.84.3
Safety TrainingLow10.14.19.34.510.74.712.95.19.95.210.95.39.34.3
Medium10.44.59.44.711.14.813.45.011.04.711.94.89.74.6
Advance11.33.610.53.712.24.013.04.111.23.612.14.110.83.1
Note: M indicates mean, SD indicates standard deviation.

References

  1. Bureau of Labor Statistics (BLS). Labor Force Statistics from the Current Population Survey. Available online: https://www.bls.gov/cps/cpsaat18b.htm (accessed on 7 October 2021).
  2. Hallowell, M. Safety Risk Perception in Construction Companies in the Pacific Northwest of the USA. Constr. Manag. Econ. 2010, 28, 403–413. [Google Scholar] [CrossRef]
  3. Liao, P.-C.; Ma, Z.; Chong, H.-Y. Identifying Effective Management Factors Across Human Errors—A Case in Elevator Installation. KSCE J. Civ. Eng. 2018, 22, 3204–3214. [Google Scholar] [CrossRef] [Green Version]
  4. Namian, M.; Albert, A.; Feng, J. Effect of Distraction on Hazard Recognition and Safety Risk Perception. J. Constr. Eng. Manag. 2018, 144, 04018008. [Google Scholar] [CrossRef]
  5. Jamil Uddin, S.M.; Albert, A.; Alsharef, A.; Pandit, B.; Patil, Y.; Nnaji, C. Hazard Recognition Patterns Demonstrated by Construction Workers. Int. J. Environ. Res. Public Health 2020, 17, 7788. [Google Scholar] [CrossRef] [PubMed]
  6. Uddin, S.M.J.; Ganapati, N.E.; Pradhananga, N.; Prajapati, J.; Albert, A. Is the Workers’ Health and Safety Scenario Different in Post-Disaster Reconstruction from Conventional Construction? A Case Study in Bhaktapur, Nepal. Int. J. Disaster Risk Reduct. 2021, 64, 102529. [Google Scholar] [CrossRef]
  7. Jazayeri, E.; Dadi, G.B. Hazard Recognition and Risk Perception Skills among Union Electricians. J. Constr. Eng. Manag. 2020, 146, 04020108. [Google Scholar] [CrossRef]
  8. Perlman, A.; Sacks, R.; Barak, R. Hazard Recognition and Risk Perception in Construction. Saf. Sci. 2014, 64, 22–31. [Google Scholar] [CrossRef]
  9. Ricci, F.; Bravo, G.; Modenese, A.; De Pasquale, F.; Ferrari, D.; Gobba, F. Risk Perception in the Construction Industry: Differences Between Italian and Migrant Workers Before and After a Targeted Training Intervention. New Solut. J. Environ. Occup. Health Policy 2021, 31, 65–71. [Google Scholar] [CrossRef] [PubMed]
  10. Ricci, F.; Bravo, G.; Modenese, A.; De Pasquale, F.; Ferrari, D.; Bello, M.; Favero, G.; Soddu, S.; Gobba, F. Risk Perception and Ethnic Background in Construction Workers: Results of a Cross-Sectional Study in a Group of Trainees of a Vocational School in Italy. Eur. J. Investig. Health Psychol. Educ. 2021, 11, 8. [Google Scholar] [CrossRef]
  11. Trillo-Cabello, A.F.; Carrillo-Castrillo, J.A.; Rubio-Romero, J.C. Perception of Risk in Construction. Exploring the Factors That Influence Experts in Occupational Health and Safety. Saf. Sci. 2021, 133, 104990. [Google Scholar] [CrossRef]
  12. Salmon, P.M.; Stanton, N.A. Situation Awareness and Safety: Contribution or Confusion? Situation Awareness and Safety Editorial. Saf. Sci. 2013, 56, 1–5. [Google Scholar] [CrossRef]
  13. Perić, J.; Cvetković, V. Demographic, Socio-Economic and Phycological Perspective of Risk Perception from Disasters Caused by Floods: Case Study Belgrade. Int. J. Dis. Risk Manag. 2019, 1, 31–45. [Google Scholar] [CrossRef]
  14. Meng, X.; Chan, A.H.S. Demographic Influences on Safety Consciousness and Safety Citizenship Behavior of Construction Workers. Saf. Sci. 2020, 129, 104835. [Google Scholar] [CrossRef]
  15. Guo, D.-C.; Su, X.-G.; Huang, X.-W.; Zhang, W.-J.; Wu, L.-S. Safety Management Mode of Bridge & Tunnel Construction Team Based on Demographic Characteristics. Transp. Res. 2015, 4, 66–74. [Google Scholar]
  16. Han, Y.; Jin, R.; Wood, H.; Yang, T. Investigation of Demographic Factors in Construction Employees’ Safety Perceptions. KSCE J. Civ. Eng. 2019, 23, 2815–2828. [Google Scholar] [CrossRef]
  17. Chaswa, E.N.; Kosamu, I.B.M.; Kumwenda, S.; Utembe, W. Risk Perception and Its Influencing Factors among Construction Workers in Malawi. Safety 2020, 6, 33. [Google Scholar] [CrossRef]
  18. Yembi Renault, B.; Agumba, J.N.; Ansary, N. Regression Analysis of the Influence of Demographic Characteristics Using Risk Management Practices within South African Small and Medium Construction Enterprises. J. Eng. Des. Technol. 2021. [Google Scholar] [CrossRef]
  19. Karimi, H.; Taghaddos, H. The Influence of Craft Workers’ Educational Attainment and Experience Level in Fatal Injuries Prevention in Construction Projects. Saf. Sci. 2019, 117, 417–427. [Google Scholar] [CrossRef]
  20. Caban-Martinez, A.J.; Santiago, K.M.; Stillman, J.; Moore, K.J.; Sierra, D.; Chalmers, J.; Baniak, M.; Jordan, M.M. Physical Exposures, Work Tasks and OSHA-10 Training among Temporary and Payroll Construction Workers. J. Occup. Environ. Med. 2018, 60, e159. [Google Scholar] [CrossRef]
  21. Tixier, A.J.-P.; Albert, A.; Hallowell, M.R. Proposing and Validating a New Way of Construction Hazard Recognition Training in Academia: Mixed-Method Approach. Pract. Period. Struct. Des. Constr. 2018, 23, 04017027. [Google Scholar] [CrossRef]
  22. Tixier, A.J.P.; Hallowell, M.R.; Rajagopalan, B.; Bowman, D. Construction Safety Clash Detection: Identifying Safety Incompatibilities among Fundamental Attributes Using Data Mining. Autom. Constr. 2017, 74, 39–54. [Google Scholar] [CrossRef] [Green Version]
  23. Eiris, R.; Jain, A.; Gheisari, M.; Wehle, A. Safety Immersive Storytelling Using Narrated 360-Degree Panoramas: A Fall Hazard Training within the Electrical Trade Context. Saf. Sci. 2020, 127, 104703. [Google Scholar] [CrossRef]
  24. Lesch, M.F.; Rau, P.L.P.; Zhao, Z.; Liu, C. A Cross-Cultural Comparison of Perceived Hazard in Response to Warning Components and Configurations: US vs. China. Appl. Ergon. 2009, 40, 953–961. [Google Scholar] [CrossRef]
  25. Hung, Y.; Smith-Jackson, T.; Winchester, W. Use of Attitude Congruence to Identify Safety Interventions for Small Residential Builders. Constr. Manag. Econ. 2011, 29, 113–130. [Google Scholar] [CrossRef]
  26. Bureau of Labor Statistics (2020). Census of Fatal Occupational Injuries Summary. 2019. Available online: https://www.bls.gov/news.release/cfoi.nr0.htm (accessed on 7 October 2021).
  27. Osei-Asibey, D.; Ayarkwa, J.; Acheampong, A.; Adinyira, E.; Amoah, P.; Osei-Asibey, D.; Ayarkwa, J.; Acheampong, A.; Adinyira, E.; Amoah, P. An Examination of Causes of Accidents and Hazards in the Ghanaian Construction Industry. Open J. Saf. Sci. Technol. 2021, 11, 66–88. [Google Scholar] [CrossRef]
  28. Buniya, M.K.; Othman, I.; Sunindijo, R.Y.; Kineber, A.F.; Mussi, E.; Ahmad, H. Barriers to Safety Program Implementation in the Construction Industry. Ain Shams Eng. J. 2021, 12, 65–72. [Google Scholar] [CrossRef]
  29. Hinze, J.; Asce, M.; Hallowell, M.; Asce, A.M.; Baud, K. Construction-Safety Best Practices and Relationships to Safety Performance. J. Constr. Eng. Manag. 2013, 139, 04013006. [Google Scholar] [CrossRef]
  30. Zhou, Z.; Li, C.; Mi, C.; Qian, L. Exploring the Potential Use of Near-Miss Information to Improve Construction Safety Performance. Sustainability 2019, 11, 1264. [Google Scholar] [CrossRef] [Green Version]
  31. Azeez, M.; Asce, S.M.; Gambatese, J.; Asce, M.; Hernandez, S. What Do Construction Workers Really Want? A Study about Representation, Importance, and Perception of US Construction Occupational Rewards. J. Constr. Eng. Manag. 2019, 145, 04019040. [Google Scholar] [CrossRef]
  32. Nnaji, C.; Asce, A.M.; Gambatese, J.; Asce, M.; Karakhan, A.; Asce, S.M.; Osei-Kyei, R. Development and Application of Safety Technology Adoption Decision-Making Tool. J. Constr. Eng. Manag. 2020, 146, 04020028. [Google Scholar] [CrossRef]
  33. Shahab Hosseinian, S.; Jabbarani Torghabeh, Z. Major theories of construction accident causation models: A literature review. Int. J. Adv. Eng. Technol. 2012, 4, 53–66. [Google Scholar]
  34. Endsley, M.R.; Garland, D.J. Situation Awareness Analysis and Measurement; Lawrence Erlbaum Associates, Inc.: Mahwah, NJ, USA, 2000. [Google Scholar]
  35. Naderpour, M.; Lu, J.; Zhang, G. A Situation Risk Awareness Approach for Process Systems Safety. Saf. Sci. 2014, 64, 173–189. [Google Scholar] [CrossRef] [Green Version]
  36. Skjong, R.; Wentworth, B.H. Expert Judgment and Risk Perception. In Proceedings of the Eleventh International Offshore and Polar Engineering Conference, Stavanger, Norway, 17–22 June 2001. [Google Scholar]
  37. Namian, M.; Albert, A.; Zuluaga, C.M.; Behm, M. Role of Safety Training: Impact on Hazard Recognition and Safety Risk Perception. J. Constr. Eng. Manag. 2016, 142, 04016073. [Google Scholar] [CrossRef]
  38. Meliá, J.L.; Mearns, K.; Silva, S.A.; Lima, M.L. Safety Climate Responses and the Perceived Risk of Accidents in the Construction Industry. Saf. Sci. 2008, 46, 949–958. [Google Scholar] [CrossRef]
  39. Chauvin, B.; Hermand, D.; Mullet, E. Risk Perception and Personality Facets. Risk Anal. 2007, 27, 171–185. [Google Scholar] [CrossRef] [PubMed]
  40. Rodríguez-Garzón, I.; Martínez-Fiestas, M.; Delgado-Padial, A.; Lucas-Ruiz, V. An Exploratory Analysis of Perceived Risk among Construction Workers in Three Spanish-Speaking Countries. J. Constr. Eng. Manag. 2016, 142, 04016066. [Google Scholar] [CrossRef]
  41. Chan, A.P.C.; Wong, F.K.W.; Hon, C.K.H.; Lyu, S.; Javed, A.A. Investigating Ethnic Minorities’ Perceptions of Safety Climate in the Construction Industry. J. Saf. Res. 2017, 63, 9–19. [Google Scholar] [CrossRef]
  42. Ricci, F.; Modenese, A.; Bravo, G.; De Pasquale, F.; Ferrari, D.; Bello, M.; Carozza, L.; Longhi, F.; Favero, G.; Soddu, S.; et al. Ethnic Background and Risk Perception in Construction Workers: Development and Validation of an Exploratory Tool. Int. J. Occup. Med. Environ. Health 2019, 33, 163–172. [Google Scholar] [CrossRef] [PubMed]
  43. Wong, K.; Chan, A.H.S.; Alabdulkarim, S.A. Gender Differences in Risk-Taking-Related Personality Traits and Risk Perception: Implications for Safety Training and Awareness Programs. Adv. Intell. Syst. Comput. 2019, 969, 307–316. [Google Scholar] [CrossRef]
  44. Ajslev, J.; Dastjerdi, E.L.; Dyreborg, J.; Kines, P.; Jeschke, K.C.; Sundstrup, E.; Jakobsen, M.D.; Fallentin, N.; Andersen, L.L. Safety Climate and Accidents at Work: Cross-Sectional Study among 15,000 Workers of the General Working Population. Saf. Sci. 2017, 91, 320–325. [Google Scholar] [CrossRef]
  45. Salminen, S. Have Young Workers More Injuries than Older Ones? An International Literature Review. J. Saf. Res. 2004, 35, 513–521. [Google Scholar] [CrossRef]
  46. Siu, O.L.; Phillips, D.R.; Leung, T.W. Age Differences in Safety Attitudes and Safety Performance in Hong Kong Construction Workers. J. Saf. Res. 2003, 34, 199–205. [Google Scholar] [CrossRef] [Green Version]
  47. Mučenski, V.; Peško, I.; Dražić, J.; Ćirović, G.; Trivunić, M.; Bibić, D. Construction Workers Injury Risk Assessment in Relation to Their Experience and Age. Procedia Eng. 2015, 117, 525–533. [Google Scholar] [CrossRef] [Green Version]
  48. Rodríguez-Garzón, I.; Lucas-Ruiz, V.; Martínez-Fiestas, M.; Delgado-Padial, A. Association between Perceived Risk and Training in the Construction Industry. J. Constr. Eng. Manag. 2014, 141, 04014095. [Google Scholar] [CrossRef]
  49. Ahonen, E.Q.; Benavides, F.G. Risk of Fatal and Non-Fatal Occupational Injury in Foreign Workers in Spain. J. Epidemiol. Commun. Health 2006, 60, 424–426. [Google Scholar] [CrossRef] [PubMed] [Green Version]
  50. Roelofs, C.; Sprague-Martinez, L.; Brunette, M.; Azaroff, L. A Qualitative Investigation of Hispanic Construction Worker Perspectives on Factors Impacting Worksite Safety and Risk. Environ. Health 2011, 10, 1–9. [Google Scholar] [CrossRef] [Green Version]
  51. Zou, P.X.; Zhang, G. Comparative Study on the Perception of Construction Safety Risks in China and Australia. J. Constr. Eng. Manag. 2009, 135, 620–627. [Google Scholar] [CrossRef]
  52. Abbas, M.; Mneymneh, B.E.; Khoury, H. Assessing On-Site Construction Personnel Hazard Perception in a Middle Eastern Developing Country: An Interactive Graphical Approach. Saf. Sci. 2018, 103, 183–196. [Google Scholar] [CrossRef]
  53. Borys, D. The Role of Safe Work Method Statements in the Australian Construction Industry. Saf. Sci. 2012, 50, 210–220. [Google Scholar] [CrossRef] [Green Version]
  54. Memarian, B.; Mitropoulos, P. Accidents in Masonry Construction: The Contribution of Production Activities to Accidents, and the Effect on Different Worker Groups. Saf. Sci. 2013, 59, 179–186. [Google Scholar] [CrossRef]
  55. Chan, A.P.C.; Javed, A.A.; Wong, F.K.W.; Hon, C.K.H.; Lyu, S. Evaluating the Safety Climate of Ethnic Minority Construction Workers in Hong Kong. J. Prof. Issues Eng. Educ. Pract. 2017, 143, 04017006. [Google Scholar] [CrossRef]
  56. Halabi, Y.; Xu, H.; Long, D.; Chen, Y.; Yu, Z.; Alhaek, F.; Alhaddad, W. Causal Factors and Risk Assessment of Fall Accidents in the U.S. Construction Industry: A Comprehensive Data Analysis (2000–2020). Saf. Sci. 2022, 146, 105537. [Google Scholar] [CrossRef]
  57. Kang, Y.; Siddiqui, S.; Suk, S.J.; Chi, S.; Kim, C. Trends of Fall Accidents in the U.S. Construction Industry. J. Constr. Eng. Manag. 2017, 143, 04017043. [Google Scholar] [CrossRef]
  58. Zuluaga, C.M.; Namian, M.; Albert, A. Impact of Training Methods on Hazard Recognition and Risk Perception in Construction. In Proceedings of the Construction Research Congress 2016, San Juan, PR, USA, 31 May–2 June 2016; pp. 2861–2871. [Google Scholar] [CrossRef]
  59. Kassem, M.; Benomran, L.; Teizer, J. Virtual Environments for Safety Learning in Construction and Engineering: Seeking Evidence and Identifying Gaps for Future Research. Vis. Eng. 2017, 5, 1–15. [Google Scholar] [CrossRef] [Green Version]
  60. Fung, I.W.H.; Tam, V.W.Y.; Lo, T.Y.; Lu, L.L.H. Developing a Risk Assessment Model for Construction Safety. Int. J. Proj. Manag. 2010, 28, 593–600. [Google Scholar] [CrossRef]
  61. Suresh, K.; Chandrashekara, S. Sample Size Estimation and Power Analysis for Clinical Research Studies. J. Hum. Reprod. Sci. 2012, 5, 7. [Google Scholar] [CrossRef]
  62. Wong, T.K.M.; Man, S.S.; Chan, A.H.S. Critical Factors for the Use or Non-Use of Personal Protective Equipment amongst Construction Workers. Saf. Sci. 2020, 126, 104663. [Google Scholar] [CrossRef]
  63. Manege, S.L.; Mushi, F.V. Alcohol Abuse and Illicit Drug Use at Construction Sites: Perception of Workers at Construction Sites. Int. J. Constr. Eng. Manag. 2018, 7, 65–72. [Google Scholar] [CrossRef]
  64. Microsoft Corporation. Microsoft Excel [Internet]. 2016. Redmond, DC, USA. Available online: https://office.microsoft.com/excel (accessed on 7 October 2021).
  65. IBM Corporation. IBM SPSS Statistics for Windows; IBM Corp.: Armonk, NY, USA, 2019. [Google Scholar]
  66. Hallowell, M.R.; Gambatese, J.A. Construction Safety Risk Mitigation. J. Constr. Eng. Manag. 2009, 135, 1316–1323. [Google Scholar] [CrossRef]
  67. Alomari, K.A.; Gambatese, J.A.; Tymvios, N. Risk Perception Comparison among Construction Safety Professionals: Delphi Perspective. J. Constr. Eng. Manag. 2018, 144, 04018107. [Google Scholar] [CrossRef]
  68. Wadgave, U.; Ravindra Khairnar, M. Parametric Test for Non-Normally Distributed Continuous Data: For and Against. Electron. Physician 2019, 11, 7468–7470. [Google Scholar] [CrossRef] [Green Version]
  69. Rasmussen, J.L.; Dunlap, W.P. Dealing with Nonnormal Data: Parametric Analysis of Transformed Data vs. Nonparametric Analysis. Educ. Psychol. Meas. 1991, 51, 809–820. [Google Scholar] [CrossRef]
  70. Templeton, G.F. A Two-Step Approach for Transforming Continuous Variables to Normal: Implications and Recommendations for IS Research. Commun. Assoc. Inf. Syst. 2011, 28, 41–58. [Google Scholar] [CrossRef] [Green Version]
  71. Osborne, J. Improving Your Data Transformations: Applying the Box-Cox Improving Your Data Transformations: Applying the Box-Cox Transformation Transformation. Pract. Assess. Res. Eval. 2010, 15, 12. [Google Scholar] [CrossRef]
  72. Greening, L. Risk Perception Following Exposure to a Job-Related Electrocution Accident: The Mediating Role of Perceived Control. Acta Psychol. 1997, 95, 267–277. [Google Scholar] [CrossRef]
  73. Eaves, S.; Gyi, D.E.; Gibb, A.G.F. Building Healthy Construction Workers: Their Views on Health, Wellbeing and Better Workplace Design. Appl. Ergon. 2016, 54, 10–18. [Google Scholar] [CrossRef] [PubMed] [Green Version]
  74. Abrahamsson, L.; Johansson, J. From Grounded Skills to Sky Qualifications: A Study of Workers Creating and Recreating Qualifications, Identity and Gender at an Underground Iron Ore Mine in Sweden. J. Ind. Relat. 2006, 48, 657–676. [Google Scholar] [CrossRef]
  75. Williams, E.Y.; Gibb, A.G.; Gyi, D.E.; Haslam, R. Constructive Ageing: A Survey of Workers in the Construction Industry. In Proceedings of the CIB W099 International Conference, Washington, DC, USA, 24–28 August 2011. [Google Scholar]
  76. Li, H.; Chan, G.; Skitmore, M. Visualizing Safety Assessment by Integrating the Use of Game Technology. Autom. Constr. 2012, 22, 498–505. [Google Scholar] [CrossRef] [Green Version]
  77. Flynn, J.; Slovic, P.; Mertz, C.K. Gender, Race, and Perception of Environmental Health Risks. Risk Anal. 1994, 14, 1101–1108. [Google Scholar] [CrossRef] [Green Version]
  78. Slovic, P. Trust, Emotion, Sex, Politics, and Science: Surveying the Risk-Assessment Battlefield. Risk Anal. 1999, 19, 689–701. [Google Scholar] [CrossRef] [Green Version]
  79. Hitchcock, J.L. Gender Differences in Risk Perception: Broadening the Contexts. Part of the Cognition and Perception Commons, Feminist, Gender, and Sexuality Studies Commons, and the Gender and Sexuality Commons Repository Citation Repository Citation. Risk 1990, 12, 12–179. [Google Scholar]
  80. Hakes, J.K.; Viscusi, W.K. Dead Reckoning: Demographic Determinants of the Accuracy of Mortality Risk Perceptions. Risk Anal. 2004, 24, 651–664. [Google Scholar] [CrossRef]
  81. Gobba, F.; Dall’Olio, E.; Modenese, A.; De Maria, M.; Campi, L.; Cavallini, G.M. Work-Related Eye Injuries: A Relevant Health Problem. Main Epidemiological Data from a Highly-Industrialized Area of Northern Italy. Int. J. Environ. Res. Public Health 2017, 14, 604. [Google Scholar] [CrossRef] [Green Version]
  82. Menzel, N.N.; Gutierrez, A.P. Latino Worker Perceptions of Construction Risks. Am. J. Ind. Med. 2010, 53, 179–187. [Google Scholar] [CrossRef] [PubMed]
  83. Goodrum, P.M.; Dai, J. Differences in Occupational Injuries, Illnesses, and Fatalities among Hispanic and Non-Hispanic Construction Workers. J. Constr. Eng. Manag. 2005, 131, 1021–1028. [Google Scholar] [CrossRef]
  84. Flynn, M.A.; Check, P.; Eggerth, D.E.; Tonda, J. Improving Occupational Safety and Health among Mexican Immigrant Workers: A Binational Collaboration. Public Health Rep. 2013, 128 (Suppl. S3), 33–38. [Google Scholar] [CrossRef] [Green Version]
  85. Lee, C.K.; Foo, M.Y. Risk Attitudes and the Big Five Personality Traits: A Study on Construction Project Practitioners in Malaysia. Int. J. Constr. Manag. 2020, 1–11. [Google Scholar] [CrossRef]
  86. Wang, C.M.; Xu, B.B.; Zhang, S.J.; Chen, Y.Q. Influence of Personality and Risk Propensity on Risk Perception of Chinese Construction Project Managers. Int. J. Proj. Manag. 2016, 34, 1294–1304. [Google Scholar] [CrossRef]
  87. Kinsey, M.J.; Kinateder, M.; Gwynne, S.M.V.; Hopkin, D. Burning Biases: Mitigating Cognitive Biases in Fire Engineering. Fire Mater. 2021, 45, 543–552. [Google Scholar] [CrossRef]
  88. Li, H.; Chen, H.; Zhao, Z.; Hu, X.; Cheng, B.; Huang, J. Tunnel Construction Workers’ Cognitive Biases and Unsafe Behaviors: The Mediating Effects of Risk Perceptions. Adv. Civ. Eng. 2020, 2020, 1–10. [Google Scholar] [CrossRef]
  89. Houghton, S.M.; Simon, M.; Aquino, K.; Goldberg, C.B. No Safety in Numbers: Persistence of Biases and Their Effects on Team Risk Perception and Team Decision Making. Group Organ. Manag. 2000, 25, 325–353. [Google Scholar] [CrossRef]
  90. Xia, N.; Wang, X.; Griffin, M.A.; Wu, C.; Liu, B. Do We See How They Perceive Risk? An Integrated Analysis of Risk Perception and Its Effect on Workplace Safety Behavior. Accid. Anal. Prev. 2017, 106, 234–242. [Google Scholar] [CrossRef] [PubMed]
  91. Wilkins, J.R. Construction Workers’ Perceptions of Health and Safety Training Programmes. Constr. Manag. Econ. 2011, 29, 1017–1026. [Google Scholar] [CrossRef]
  92. Kale, Ö.A. Determination of Poor Compliance with Osh Rules of Construction Workers Using Ordinal Regression Model. Mugla J. Sci. Technol. 2020, 6, 78–88. [Google Scholar] [CrossRef]
Figure 1. Research Process.
Sustainability 14 00111 g001
Figure 2. Work scenario with different hazards.
Sustainability 14 00111 g002
Figure 3. Impact of Age on SRA. Note: AC1 = Slip, trip, or fall on the same level; AC2 = Struck by an object; A3 = Caught-in or -between objects; AC4 = Electrocuted; AC5 = Fall to a lower level; AC6 = Trapped in or between objects; AC7 = Step on an object.
Sustainability 14 00111 g003
Figure 4. Impact of Education on SRA. Note: The bars with * have significant differences between them. AC1 = Slip, trip, or fall on the same level; AC2 = Struck by an object; A3 = Caught-in or -between objects; AC4 = Electrocuted; AC5 = Fall to a lower level; AC6 = Trapped in or between objects; AC7 = Step on an object.
Sustainability 14 00111 g004
Figure 5. Impact of Safety Training on SRA. Note: AC1 = Slip, trip, or fall on the same level; AC2 = Struck by an object; A3 = Caught in or between objects; AC4 = Electrocuted; AC5 = Fall to a lower level; AC6 = Trapped in or between objects; AC7 = Step on an object.
Sustainability 14 00111 g005
Figure 6. Impact of Ethnicity on SRA. Note: AC1 = Slip, trip, or fall on the same level; AC2 = Struck by an object; A3 = Caught-in or -between objects; AC4 = Electrocuted; AC5 = Fall to a lower level; AC6 = Trapped in or between objects; AC7 = Step on an object.
Sustainability 14 00111 g006
Figure 7. Impact of Ethnicity on SRA. Note: AC1 = Slip, trip, or fall on the same level; AC2 = Struck by an object; A3 = Caught in or between objects; AC4 = Electrocuted; AC5 = Fall to a lower level; AC6 = Trapped in or between objects; AC7 = Step on an object.
Sustainability 14 00111 g007
Figure 8. Impact of Work Type on SRA. Note: AC1 = Slip, trip, or fall on the same level; AC2 = Struck by an object; A3 = Caught in or between objects; AC4 = Electrocuted; AC5 = Fall to a lower level; AC6 = Trapped in or between objects; AC7 = Step on an object.
Sustainability 14 00111 g008
Table 1. Summary of the Literature Review.
SourceFactors InvestigatedData AnalysisMethodData CollectionResult
[56]Work Type, Age, Project typeFrequency Analysis, Logistic RegressionArchival23,057 fall accidents in the United States construction industryRoofers recorded the highest number of fall accidents
The most of the falls occurred among the older workers
Most of the falls occurred on low cost residential and commercial projects
[46]Age, Safety Attitudehierarchical multiple regressionQuantitative, Survey374 Hong Kong Construction workersAge has no impact on the rate of occupational accidents
Older workers had a more favorable safety attitudes than younger workers
[57]Project Type, Fall ProtectionFrequency AnalysisArchival9141 fall accidents in the US construction industryThe majority of the falls happened on residential construction projects.
Only 11% of the fall accident victims were properly outfitted with fall protection gear
[14]Age, Gender, EducationANOVAQuantitative, Survey532 Chinese construction workersRelative to the female workers, Age significantly impact male workers’ RP Education significantly impacts workers’ RP
[47]Age groups, ExperienceDescriptive AnalysisQuantitative, Archival1158 Serbia Injury Reports18–34 years workers recorded significantly high injury rate
Young workers with less than 4 years of experience recorded the lowest RP
[16]Age, Education, level, GenderRII, ANOVA, t-TestQuantitative, Survey155 Chinese construction workers37–46 years old workers perceived hazards with low frequency to have significantly low severity
Education does not impact Employees’ RP *Gender significantly impact workers’ RP
[44]Age, GenderLogistic Regression AnalysisQuantitative, Survey15,144 Denmark general working populationYoung workers experience more occupational accidents
The gender of workers had a significant impact on the likelihood of being involved in an accident.
[40]Training, NationalityCluster Analysis, ANOVAQuantitative, Survey204 Spain, 213 Peru, and 97 Nicaragua construction workersLevel of training significantly impact RP of workers
Nationality had no significant impact on RP
[48]TrainingCluster Analysis; Chi-square testQuantitative, Survey177 Spanish male Construction workersLevel of training significantly impact male construction workers’ RP
Majority of the male workers had low RP
[22]Training methodsWilcoxon signed-rank testMixed-Method84 US AEC StudentsUnlike the Energy-based training module, OSHA training does not significantly improve hazard recognition skills
[20]OSHA 10-hr Traininglogistic regression analysesQuantitative, Survey250 US construction workersOSHA-10 significantly impact workers’ impact workers’ RP
[23]OSHA TrainingHazard Identification IndexQuantitative, Survey40 US CEM StudentsNo significant difference between the effect of the OSHA training and the 360-degree panoramas training
[9]16-hr course trainingChi-square, Wilcoxon Mann–Whitney testQuantitative, Survey40 Italian, 28 immigrant construction workersThe training was effective and may reduce the degree to which cultural and linguistic barriers hinder RP.
[58]Training MethodsANOVA, Kruskal–Wallis H-testQuantitative, Survey49 US project personnelHigh engagement training significantly influence RP
[55]Minority Ethnic Group (MEG), Safety climateBinary logistic regression analysisQuantitative, Survey320 Hong Kong construction workersSignificant difference between local and MEG workers’ RP
Compared with the supervisors, Frontline workers recorded the lowest safety climate score
[41]Minority Ethnic GroupsANOVA and the post hoc ScheffeQuantitative320 Minority Ethnic GroupsEthnicity had a significant effect on the RP of workers
[42]Minority Ethnic GroupsFactor AnalysisQuantitative527 Italy construction workersPerceived behavioral control, Danger perception, Safety climate, Attitude towards safe actions are the factors for evaluating RP of MEG workers
[19]Education; ExperienceChi-Square TestQuantitative6355 Iran accidents recordUneducated and/or inexperienced workers increase the risk of fatal injuries at the workplace.
[18]Education, Experiencemultiple regression analysisQuantitative181 South African construction managersEducation was statistically insignificant with the risk management practices
[17]Education; Age; Training; Work Typeprincipal component analysisQuantitative373 Malawian Construction WorkersEducation and age significantly impacted RP
Gender, professional category, safety training, and safety climate does not significantly impact worker’s RP.
[23]Cross-CultureANOVAQuantitative40 US and 43 China studentsUS subjects reported a significantly high RP than the Chinese respondents
[51]Cross-culture; Education; Trainingrisk significance indexQuantitative68 china; 41 Australian construction workersRelative to the Australian workers, the Chinese workers attributed low risk to the negative impact of construction activities to the environment
Low level of education/training was a driving factor of safety accidents
[11]Gender; Age; EducationANOVA; Multilevel linear regression analysisQuantitative82 Construction Safety ExpertsAge significantly impact safety experts’ RP *Gender and Education does not significantly impact RP
[43]GenderReliability test; Descriptive statisticsQuantitative100 Hong-Kong StudentsGender had no significant impact on RP
[49]GenderDescriptive AnalysisQuantitative2,150,992 Italy personsMale record higher number of repeated accidents than female
[52]Work typeANOVAQuantitative285 Lebanon construction workersPersonnel position had a significant impact on RP
[38]Work TypeRegression analysisQuantitative869 England, 113 Spain, 99 China, 374 SpainDifferences in safety risk perception at the managerial and workers’ levels
[25]Work TypeANOVA testsQuantitative47 US Construction workersSupervisors had a higher RP than their workers.
[53]Work TypeContent AnalysisQualitative/Interview18 Australian Construction workersGaps existed between work as imagined by managers and work as performed by workers
[54]Work TypeDescriptive AnalysisQuantitative141 recordable incidents in the USSupervisors recorded low incidents, whereas workers record the high incident.
Note: RP refers to risk perception.
Table 2. Determination of Safety Risk Perception from Severity and Frequency.
Injury Frequency (Working Hours)
Hazard (Severity Score)Never
(>200,000)
Once in 10 Years
(>20,000)
Once a Year
(~2000)
Once a Month
(~167)
Once a Week
(~40)
Discomfort/Pain (7.5)3.75 × 10−53.75 × 10−43.75 × 10−30.040.19
First aid (45.25)2.26 × 10−42.26 × 10−32.26 × 10−20.271.13
Medical case (128)6.40 × 10−46.40 × 10−36.40 × 10−20.773.20
Lost work time (256)1.28 × 10−31.28 × 10−21.28 × 10−11.536.40
Fatality (13,619)6.81 × 10−26.81 × 10−16.8181.55340.0
Table 3. Demographic Information of Survey Respondents.
DemographicsOptionsRecoded OptionsFrequencyPercent (%)
Age of Workers18–20 years and 21–30 years18–30 years2916
31–40 years and 41–50 years31–50 years10960
51–65 years and above 65 years51–above 65 years4524
EthnicityCaucasianCaucasian14177
Asian, Black or African American, Latino Hispanic, Native American, Native Hawaiian or Pacific Islander, two or more ethnicitiesMinority ethnic groups4223
EducationLess than high school degree, High school degree or equivalent, some college but no degreeLow Education Level10055
Associate degreeMedium Education Level2212
Bachelor degree, Graduate degreeHigh Education Level6133
Work TypeForemen, and SuperintendentsSupervisor5731
Carpenter, Equipment operator, Ironworker, Plumber, Mechanical Worker, Electrician, Mason, Other Fieldworker/TradespersonWorkers12669
Safety TrainingOSHA 10Low Training10443
OSHA 30Medium Training7932
OSHA 500, OSHA 510High Training6025
GenderMale 14981
Female 3419
Table 4. ANOVA Result of the influence of Demographics on Risk Perception.
IncidentsEducationAgeGenderEthnicityWork RoleSafety Training
AC1df122 2
df244.424178179179179155
F2.4701.7000.509−0.594−1.0241.065
p0.0960.1860.6120.5530.3070.347
NNNNNN
AC2df122 2
df2178178179179179155
F1.9352.1990.5020.797−0.7121.022
p0.1470.1140.6170.8260.4770.362
NNNNNN
AC3df122 2
df217880.714179179179155
F1.2510.597−0.220−0.724−0.6961.458
p0.2890.5530.8260.4700.4880.236
NNNNNN
AC4df122 2
df2178178179179179155
F0.4210.368−1.1091.038−1.5440.164
p0.6570.6920.2690.3000.1240.849
NNNNNN
AC5df122 2
df2180180181181181154.153
F0.1082.3310.147−0.945−0.1011.329
p0.8980.1000.8830.3460.9200.268
NNNNNN
AC6df122 2
df2180180181181181155
F1.2020.2760.2960.069−0.5080.951
p0.3030.7590.7670.9450.6120.389
NNNNNN
AC7df122 2
df246.877177178178178155
F4.1991.8460.5580.1870.0181.629
p0.0210.1610.5780.8520.9860.199
YNNNNN
Note: df indicates Degree of freedom, F indicates the F-statistics score, p indicates the significant value. Y indicates the demographic factor has a significant effect on SRA of the accident cause, whereas N indicates no significant effect. AC1 = Slip, trip, fall on same level; AC2 = Striking against an object; A3 = Caught between; AC4 = Electrocution; AC5 = fall to lower level; AC6 = Trapped in/between objects; AC7 = Stepped on object.
Publisher’s Note: MDPI stays neutral with regard to jurisdictional claims in published maps and institutional affiliations.

