1. Introduction
Mejías and Martínez [
1] refer to satisfaction as the level of students’ state of mind towards their institution, and which results from comparing the perception they have regarding the fulfillment of their needs, expectations and requirements.
According to González, Tinoco and Torres [
2], the abundant current literature on the relationship between the satisfaction of graduates and the degree of educational quality in obtaining different academic degrees, as well as its quantification, demonstrates the importance of this topic for universities interested in attracting new generations of students to the different modalities of higher education.
Pichardo and García [
3] consider there to be an increase in the interest in knowing the needs those university students have about the contexts to improve their higher education process.
In parallel, studies on student satisfaction are required by national and international university evaluation bodies [
4] and are indicative of areas of improvement for better positioning in academic performance among higher education institutions [
5].
However, educational quality is often confused with the quality of the service offered. Indeed, according to Mejías and Martínez [
1], the objective is to find out what needs the student has and not so much how efficient the service provided is, despite the obvious positive correlation between student satisfaction and the quality of the service provided [
4,
5,
6].
Most of the models found in the bibliography are directed to face-to-face teaching and, to a lesser extent, to the distance modality, being a common practice in the former to attribute little relevance to new technologies, which, in case they appear, usually does so as one more element of the teaching itself, as it occurs in the proposal of Mejías and Martínez [
1], instead of granting them the separate protagonism they deserve.
Virtual education plays a preponderant role in satisfying the right (and the need) that everyone has to access education [
7]. In this sense, already at the end of the 20th century, and in the first decade of the 21st century, there were two approaches to virtual education: a partial one, where the training activity, training materials, platforms and the cost/benefit ratio were evaluated [
8,
9,
10], and a global one, referring to evaluation systems centered on models and/or standards of total quality and on the practice of benchmarking. In this context, according to Pereira and Gelvez [
11], as in face-to-face education programs, in the systemic models of quality evaluation in virtual education, there is no clear concept of what quality is and that determines the criteria to be assessed, so it is important to establish standards for the quality of
e-learning.
One of these standards is “Quality Management. Quality of Virtual Training” [
12], which determines the three factors involved in meeting the needs and expectations of students: recognition of training for employability, learning methodology and accessibility.
In this context, the lack of knowledge of the methodology involved in
e-learning and the digital divide represent two major challenges, since not all students feel comfortable with the procedures or have equal opportunities in accessing technologies, respectively [
13].
Precisely, the pandemic caused by the appearance of the SARS COV-2 coronavirus at the end of 2019 and the first quarter of 2020 has only deepened the problem of inequalities, since, on the one hand, the lack of access to education with the help of ICTs by some families became evident, either due to a lack of resources or a lack of technical support [
14]; on the other hand, confinement and teleworking led to a significant increase in the number of accesses to the programs offered by educational institutions (
Figure 1).
Other standards are the EFQM model and the ISO 9000 family of standards, which indicate, as a requirement for a quality management system, the need to establish a process for measuring customer or user satisfaction [
4].
The reason for measuring student satisfaction lies in the fact that students are the main factor and guarantee of the existence and maintenance of educational organizations. Students are the recipients of education; they are the ones who can best value it and, although they have a partial vision, their opinion provides a reference that should be taken into account [
4,
15].
According to Mejías and Martínez [
1], “measuring student satisfaction in a consistent, permanent and adequate manner would guide the right decisions to increase their strengths and remedy their weaknesses.”
Romo, Mendoza and Flores [
16] emphasize the importance of measuring student satisfaction through tests of contrasted validity and reliability, in order to establish plans for improving educational quality.
The validity of the measurement instrument can be content, criterion and construct validity. In general, it is customary in models to carry out content validity by means of a literature review and consultation with panels of experts [
1].
Reliability is given, among others, by the statistical parameter “Cronbach’s alpha,” widely used in the university environment [
17], as a simple way of measuring how reliable the measuring instrument is on a scale where the approximation to unity is the most desirable.
The importance of having valid and reliable instruments (from a statistical point of view) is therefore evident, given the implications that may arise from their use [
18].
Surdez et al. [
5] used as an evaluative instrument a questionnaire to estimate university students’ satisfaction with education (SEUE), proposed by [
15], and adapted by the authors themselves (
Table 1).
In this context, Fainholc [
19] suggests that the traditional application of business quality models or others based on management rather than on the teaching–learning process to measure user satisfaction in distance education based on the completion of an opinion questionnaire can lead to misunderstandings if the institution and its technological-educational proposal are not known in depth.
Such a proposal should be based on indicators related, among others, to the fulfillment of the Sustainable Development Goals (SDGs) and the needs and expectations of stakeholders in the university context [
20].
In the scope of this research, the delivery of environmental programs is fundamental to develop competencies in graduates that contribute to sustainability within the framework of the SDGs. In this sense, the sustainability model should be one of the guiding principles to be included transversally in the different curricula of an institution [
21].
Based on the background described above, the purpose of this research was to develop a model for an educational institution to evaluate the degree of satisfaction of the graduates of several postgraduate programs in the field of the environment, through a valid and reliable instrument, applied to a test directed to a sample of 150 participants. It is hoped that the results of this report will contribute to the continuous improvement of the quality of training, to the promotion of new university programs and to an increase in the competency profile of the participants, which will undoubtedly result in better performance at the professional level to develop sustainable policies in the future.
2. Materials and Methods
The methodology followed in this work is based on a cross-section survey suited to the purposes of a descriptive and relational type of research, with a quantitative, non-experimental, transect approach, due to the fact that no hypotheses were posed and no variables were manipulated, but indeed “data were measured, evaluated or collected on various aspects, dimensions or components of the phenomenon to be investigated [in its natural working environment and in a single time]” [
4,
22].
As it can be seen from the purpose that guided this research, the methodological scope comprised, broadly speaking, four distinct stages: firstly, based on the literature review, a Likert scale instrument was developed. Secondly, the validity and reliability of this instrument was determined thanks to the data collected from a quantitative approach [
22] on the satisfaction of a sample of 150 graduates of various online postgraduate programs in the environmental field and in relation to different aspects of training. Thirdly, a factor analysis was carried out with the aim of grouping variables or items of similar characteristics into a reduced number of factors and, in this way, obtaining a simplified model. Finally, a study was carried out to determine possible relationships based on the results obtained.
2.1. Population and Sample
The target population consisted of a total of 215 graduates from different online graduate programs in the environmental area. To determine the necessary sample size, and given that the intention was to estimate distributions or percentages when working with qualitative variables, the following sample size calculation formula for a finite population was used [
23]:
where:
n = required sample size;
N = population size;
Z1− α/2 = 1.96 (Z-statistic calculated at a 95% confidence level);
p= q = 0.5 (typical values for worst-case conditions);
Error (epsilon) = 0.05.
Substituting the values in the formula resulted in the sample size required for the study to be at least .
The sampling procedure was non-probability convenience sampling.
2.2. Data Collection
At the end of the corresponding postgraduate program, the final project director sent the final grade along with an email and an access link, inviting the 215 recent graduates of the postgraduate programs between the dates of 01 January 2016 and 31 December 2018 to voluntarily participate in the survey.
The data were collected through the “Google Forms” platform, which allows administering questionnaires over the Internet.
On the other hand, participants were assured that their contribution to the research was confidential.
During the analyzed period, survey data were received from a total of 168 students (78%). Of these, 18 were discarded when deficiencies were detected in the filling out of the form. SPSS version 26 statistical software was used for data analysis.
2.3. Methodology
In particular, the following activities were carried out:
- (1)
Selection of theories, models and tools for training evaluation, through bibliographic review techniques and analysis of the educational institution’s processes.
- (2)
Finding indicators based on the models, literature review and authors’ experience.
- (3)
Selection of nominal qualitative variables (gender, origin and program) and ordinal variables (age group, entry profile and graduate satisfaction).
- (4)
Development of a measurement instrument or questionnaire for the variable “graduate satisfaction” on a Likert scale (“1. Strongly disagree” to “4. Strongly agree”), using Microsoft Word text editing software.
- (5)
Determination of the validity of the instrument by requesting a panel of experts.
- (6)
Application of the instrument to a final sample of 150 graduates belonging to different online environmental postgraduate programs.
- (7)
Findings of the reliability of the proposed measuring instrument using Cronbach’s alpha statistic in SPSS version 26 statistical software.
- (8)
Testing the adequacy of a factor analysis by finding the Kaiser–Meyer–Olkin (KMO) sampling adequacy statistic and Bartlett’s test of sphericity.
- (9)
Execution of factor analysis and determination of factors or homogeneous groups of variables.
- (10)
Finding of possible significant relationships between variables by means of the chi-square statistical parameter in the SPSS version 26 statistical software, Infostat 2020 and Excel spreadsheet.
- (11)
Interpretation of results for decision making.
3. Results
3.1. Selection of Nominal and Ordinal Qualitative Variables
The nominal qualitative variables considered during the research were “gender,” “origin” and “program” studied by the graduate. Each of them was assigned a categorical value to differentiate their categories. The assignment of these characteristics was exhaustive and mutually exclusive, i.e., it did not have any idea of quantity, order or hierarchy associated with them [
18].
On the other hand, the chosen ordinal qualitative variables did have an implicit ordering of the attribute. In this case, the “age group,” “entry profile” and “graduate satisfaction” variables were considered.
3.2. General Characteristics of the Graduates
As shown as
Table 2, it was observed that 70.7% were male and the remaining 29.3% were female; 37.3% came from South America, 32% from North America, 24% from Central America and 6.7% from Eurasia. In relation to age, the 30–39 years age group accounted for 40.7%, the 20–29 years age group for 22%, the 40–49 years age group for 20%, the 50–59 years age group for 13.3% and the 60–69 years age group for 4%. In reference to previous studies, 66% completed a degree/diploma/bachelor, 15.3% a master’s degree, 14.7% a postgraduate degree and 4% a doctorate. Finally, 44.7% studied the Climate Change program, 19.3% the Marine Sciences program, another 16% the Water program and, finally, 4% the Biodiversity program.
3.3. Determination of the Indicators of the “Graduate Satisfaction” Variable
Based on the literature review, a total of ten dimensions with their corresponding indicators were identified (
Table 3).
3.4. Instrument Design Based on the Measurement Criteria
Once the list of indicators was available, the corresponding measurement criteria for the diagnosis were proposed. To this end, a bibliographic search and the contribution of a panel of experts were used.
In this way, thirteen items or measurement criteria were obtained, which provided the basis for a Likert scale questionnaire with scale categories that gradually ranged from “1. Strongly disagree” to “4. Strongly agree” to measure the variable of graduate satisfaction in relation to the reference postgraduate programs (
Table 4).
3.5. Validity and Reliability of the Measurement Instrument
The validity of the measurement instrument was determined based on the relevance, pertinence and clarity of each of the items by a panel of experts [
4].
Ultimately, the aim was to see what proportion of the measurement criteria was accepted by each of the experts. To do this, each expert filled in a table in which he or she considered whether that question was of significant interest (relevant), whether it was suitable (feasible, novel, ethical and interesting) and, finally, whether it was unambiguously written (clear).
For example, issues were considered ambiguous, such as “The tutor has adequately complied with the teaching plan and the qualification of exercises”, if they included two activities for only one answer, or if they made reference to assumptions, for example, “I consider that my classmates adequately value the activities of the tutor”.
Once the tables were completed, the frequencies were determined and weighted with a test proportion of 85%, using the binomial in the SPSS program. In this way, significance levels were determined that allowed us to accept in all cases the null hypothesis that the accepted criteria ratio in the instrument was 85%.
The reliability of the instrument was based on the determination of Cronbach’s alpha and included all the ordinal qualitative variables or items associated with the “graduate satisfaction” variable.
Cronbach’s alpha provided a result of 0.834, considered a good value for internal consistency [
18]. Consequently, we proceeded to the study of the information collected.
Table 5 shows the statistics associated with Cronbach’s alpha. In the last column, it can be seen that all are greater than 0.808 and that the elimination of item 3 could improve the value obtained. However, it was considered that the small improvement in the statistic (from 0.834 to 0.836) was not significant enough to compensate for the loss of information that the exclusion of the item from the analysis would entail, so it was decided to leave it.
3.6. Measures of Central Tendency and Dispersion for Ordinal Qualitative Variables
Table 6 shows the measures of central tendency (mean) and dispersion (standard deviation) for the ordinal qualitative variables.
Therefore, the mean and the standard error of the mean were as follows (
Table 7):
It could be observed that the mean of age group was in the range of 30–39 years old and that the mean of entry profile was located between undergraduate and postgraduate.
3.7. Exploratory Factor Analysis
The proposal is to group the items into a reduced number of factors, capable of explaining the greatest proportion of the total variability contained in them. To this end, the variables or items must meet the assumptions of normality, homoscedasticity (equality of variances) and multicollinearity (correlation between variables).
From the statistical analysis, it was observed that the data did not follow a normal distribution. However, according to Hair et al. [
24], these three assumptions can be ignored, as factor analysis is more conceptual than statistical; in fact, these checks are rarely carried out.
Aiquipa [
25] suggests the need to use the Kaiser–Meyer–Olkin (KMO) sampling adequacy coefficient, complemented by Bartlett’s test of sphericity, to check whether factor analysis is applicable.
As shown in
Table 8, being 0.793 ≥ 0.5, it was observed that there was a strong correlation between the items; therefore, factor analysis was applicable [
26].
Likewise, the p-value of Bartlett’s test of sphericity, which is very sensitive to the sample size, turned out to be lower than the significance level in the social sciences (0.05), thus confirming, with more consistency, the suitability of performing factor analysis.
It is also convenient to review the data of the diagonal of the anti-image matrix to see to what extent they are close to unity or, if necessary, if it is necessary to eliminate any variable or item.
In this sense, Hair et al. [
24] recommend eliminating, by default, the variable with the lowest value, which, as shown in
Table 9, corresponded to item No. 3: “I am satisfied with the attention received prior to enrollment”.
Once this item was eliminated, factor analysis was performed again, showing an improvement in the KMO statistic (
Table 10).
Table 11 shows how the anti-image matrix also generally yields values closer to unity than in the previous case.
The communalities matrix also improved in this case.
Table 12 shows that the model is able to reproduce 65.1% of the variability of the first item, 68.5% of the second item, etc.
On the other hand, despite the fact that the sedimentation graph recommended selecting three factors for the analysis, i.e., those with eigenvalues above unity, it was decided to choose a number of four, based on the literature review, which recommends reaching an approximate value of 60–65% in social sciences for the rotated cumulative explained variance [
27].
As shown in
Table 13, after the rotation, there was a redistribution of the variability among the factors, with the four components explaining 63.095% of the total variability, which is an appropriate percentage in the context of the research.
The matrix of rotated components provided the items corresponding to each of the factors (
Table 14).
Table 14 shows that factor 1 refers to the methodology followed during the program. Factor 2 is related to the organization. Factor 3 refers to the fulfillment of the academic expectations of the graduate. Finally, factor 4 is related to the work of the teaching staff.
Table 15 shows the measurement criteria grouped by factors and other indicators.
3.8. Analysis of Variance (ANOVA)
ANOVA assumes normality and homoscedasticity.
Table 16 shows that residuals were normally distributed (
p-value > 0.05).
Figure 2 illustrates that the residuals do not have any information, i.e., they do not follow a definite trend, such as a “funnel shape,” in which case the hypothesis of equal variances would not be fulfilled. However, this is only a graphical test, which must then be confirmed with Levene’s statistic (
Table 17).
Levene’s homogeneity test effectively confirms that analysis of variance can be performed (Significance Level > 0.05).
Analysis of variance confirmed Significance Level > 0.05, which means that differences in the mean factors were attributed to random chance (
Table 18).
3.9. Categorization of Factors
Based on the four factors previously found, as many new variables were created as a result of the sum of the corresponding items for each of the 150 participants.
These values were then classified into different categories: “very low”, “low”, “medium” and “high,” which are intended to give an idea of the level of satisfaction corresponding to each factor.
3.10. Overall Relationship between Variables
Before studying whether there are significant relationships between the factors and the rest of the variables, it is useful to approach this same objective from a global perspective.
3.10.1. Creation of the “Level of Satisfaction” Variable
To this end, a new global variable called “level of satisfaction” was created from the sum of the items for each of the 150 participants.
The descriptive data of central tendency and dispersion of this new variable are shown in
Table 19.
3.10.2. Normality Test of the Data of the Variable “Satisfaction Level”
In order to determine whether the “satisfaction level” variable was distributed according to a normal distribution, and given that the sample was larger than 50 individuals, the Kolmogorov–Smirnov test was carried out in the SPSS software version 26 [
28].
Since the resulting p-value (0.001) is less than 0.05, the null hypothesis of a normal distribution of the data is rejected, so these values do not follow a normal distribution. This conditioned the notion that the method to be used later to determine a possible significant relationship between different variables would be nonparametric.
3.10.3. Categorization of the Variable “Level of Satisfaction”
Next, the “level of satisfaction” variable was grouped into a range of three categories: low, medium and high. For this purpose, two cut-off points were sought to establish these categories.
The following were considered:
Figure 3 shows the frequencies of the “graduate satisfaction” variable with the lower and upper cut-off values.
As a result, the ranges shown in
Table 21 were obtained, to which a categorical value and level of satisfaction were assigned.
Table 21 shows that 53% of the graduates had a medium level of satisfaction with the institution’s online environmental postgraduate programs, 23% had a low level of satisfaction and the remaining 24% were highly satisfied after completing the corresponding postgraduate program.
Since the assumptions of normality of the grouped “level of satisfaction” variable were not met, parametric tests such as Pearson’s test could not be applied, so it was necessary to resort to nonparametric, a priori, less robust ones.
Since there are nominal variables, it was not possible to apply Spearman’s correlation; therefore, it was justified to resort to the chi-square test.
The results of applying the chi-square test to each of the five variables of the model against the grouped “level of satisfaction” variable gave rise to as many contingency tables, which are summarized in
Table 22.
Since, in all cases, the p-value was ≥0.05, it was concluded to accept the null hypothesis of there being no relationship between variables in all cases.
3.11. Relationship between the Factors and the Rest of the Variables of the Model
As in the previous case, the results of applying the chi-square test to each of the four factors of the model vs. the rest of the variables gave rise to a set of contingency tables summarized in
Table 23.
In this case, significant relationships between variables do appear. In scenarios where the p-value is < 0.05, it is concluded to reject the null hypothesis of there being no relationship between variables. A stacked bar chart is then justified in these cases.
This case is proof of how important and useful it is to perform a factor analysis, since by analyzing each factor separately, information unnoticed when approaching the problem from a global perspective comes to light.
Figure 4 shows that, in general, there is a medium to high level of satisfaction with the methodology followed; however, the “Biodiversity” and “Audits” programs show high levels of dissatisfaction with this factor.
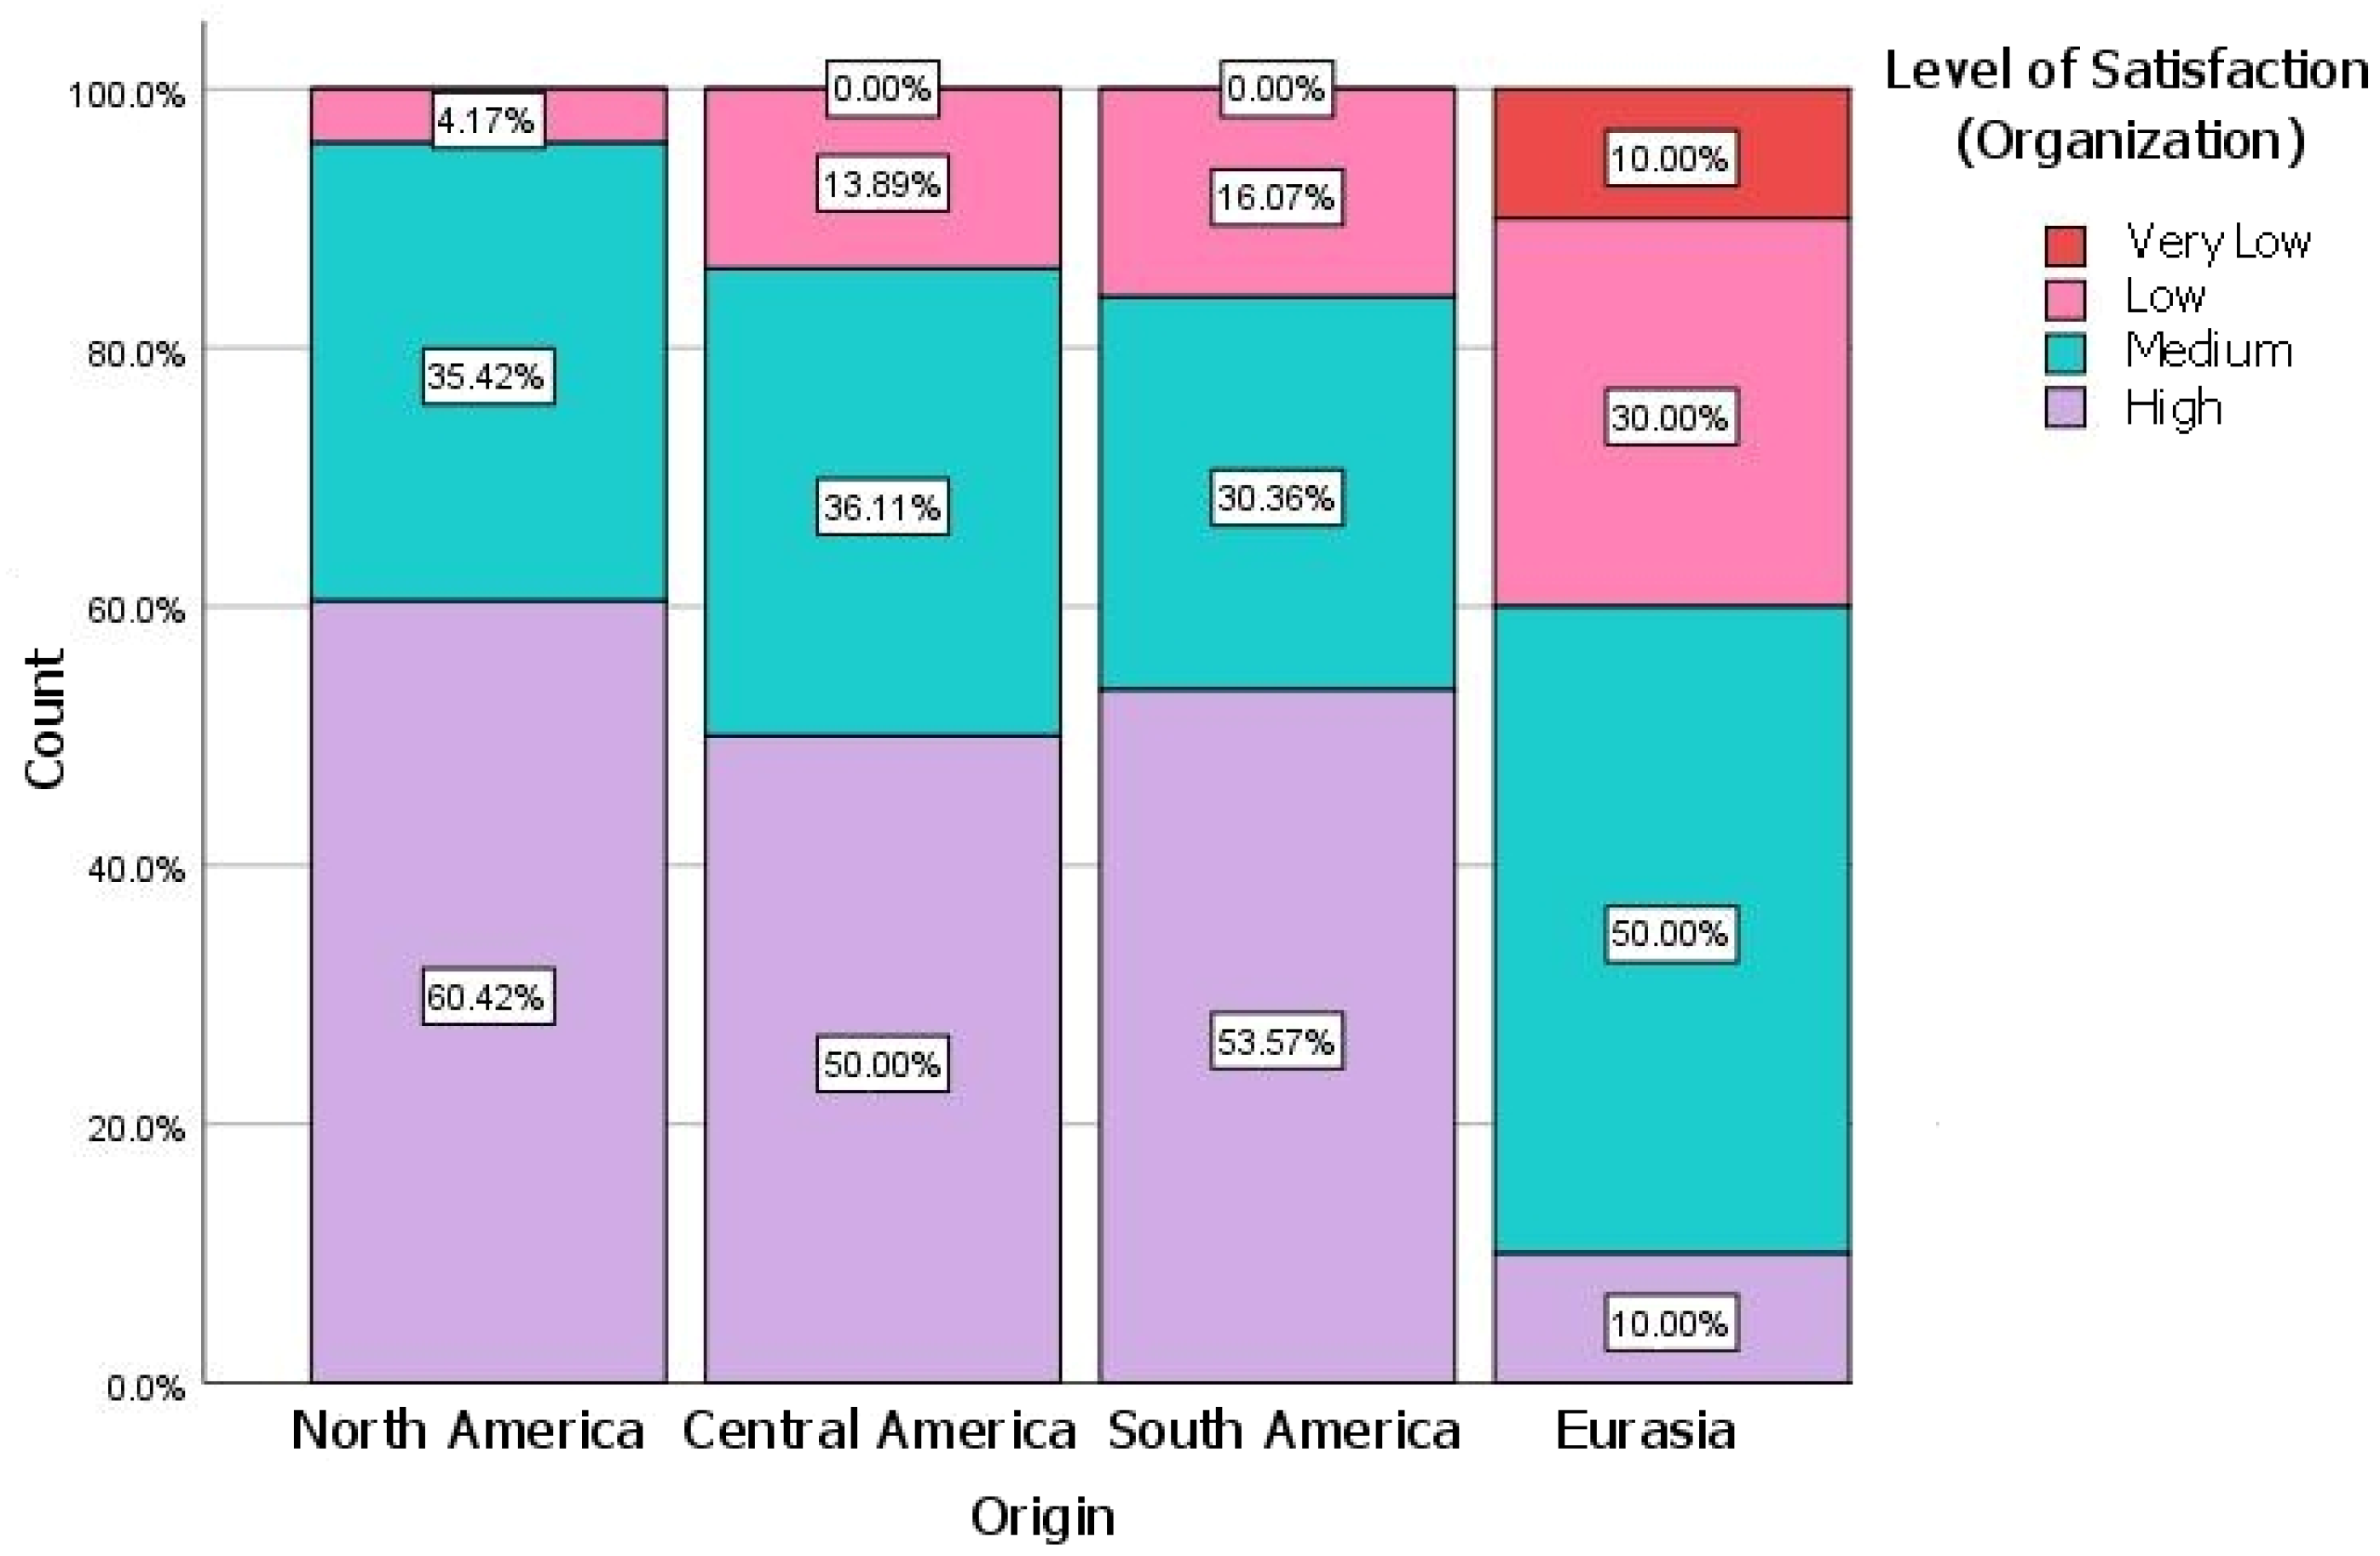
Figure 5 shows a fairly homogeneous level of satisfaction with the organization depending on the country of origin, except in the case of Eurasia, where graduates have very significant values of dissatisfaction, around 40%. There are also significant levels of dissatisfaction among graduates from South and Central America.
Figure 6 shows that, with regard to academic expectations, there is a high level of satisfaction by areas of origin, except in the case of graduates from Eurasia, whose values contrast once again with the rest.
4. Discussion
In this research article, the need to develop a model was proposed based on a series of variables collected in the bibliography to evaluate the satisfaction of 150 graduates of various online postgraduate programs in the environmental field, and to study possible relationships between them.
In this research, the estimated global mean of the variable “graduate satisfaction” was 3.72, very close to the maximum value of the Likert scale, with a standard error of 0.02, which means that the potential error made in the estimation with respect to the true average does not exceed 0.04 (with 95% confidence).
The objective was to implement the model in a Likert scale questionnaire (“1. Strongly disagree” to “4. Strongly agree”), in order to measure the variable of “graduate satisfaction” in relation to the reference postgraduate programs. This result is endorsed in most of the consulted literature references, which obtain the items of the measurement instrument, starting from indicators already contemplated in research by one or more authors, even when they differ in the number of used scales [
5,
6,
16]. For example, Álvarez et al. [
6] rely on the studies of [
15]. In this sense, it is concluded that it is possible to obtain the items of the instrument from the indicators of other models, regardless of the number of scales contemplated.
With the aim of establishing its validity and reliability, the results yielded a value of Cronbach’s alpha statistic of 0.836, which indicates that the measurement instrument is consistent over time and is within the range of values of good reliability. These results are similar to those found in most of the literature, where the values of this coefficient are above 0.80 [
5,
16], which hints at good to excellent reliability [
18]. In most models, the validity of the content of the instrument is verified by means of a literature review and an expert panel consultation. If it is verified to be possible from a statistical point of view, an exploratory factor analysis is carried out, in order to find the factors based on the grouping of items [
4,
5]. In other cases, a criterion and construct validity is also performed [
1].
In order to group the homogeneous variables into factors and simplify the complexity of the instrument, the feasibility of an exploratory factor analysis was investigated, resulting in a sampling adequacy KMO (Kaiser–Meyer–Olkin) of 0.807 and a Bartlett’s test of sphericity, whose
p-value was 0.000. Thus, the suitability of the application of factor analysis was demonstrated. The exploratory factor analysis yielded a total of four factors: methodology, organization, academic expectations and teaching work, which explained 63% of the total variance. The results are in agreement with some studies, such as Hair et al. [
24], who allude to the elimination, by default, of the item with the lowest coefficient of the diagonal of the anti-image matrix, or Pardo and Ruíz [
26], who use KMO values higher than 0.5 and a Bartlett’s
p-value of null sphericity to provide a good fit and thus find a reduced number of homogeneous groups or factors that can be crossed, in turn, with other variables to establish possible relationships between them [
29]. As a result, it is concluded that with this data reduction technique, in addition to obtaining an instrument with good internal consistency, the operation with the data matrix is considerably simplified, as we work with only four factors after regrouping.
In this research, when determining the level of satisfaction with environmental postgraduate programs in general, it was found that 77% of the graduates had a medium-high level of satisfaction. In this sense, it was found that there were no statistically significant differences between the averages of the factors of the “graduate satisfaction” variable, so the estimated differences between averages were attributed to random chance.
Regarding the objective of finding some type of relationship between the level of graduate satisfaction and the rest of the variables (gender, entry profile, origin, program and age group), the results of the chi-square test applied globally did not yield significant results. Some research works corroborating these results are those of [
4,
5,
16,
30], who also found no significant differences between satisfaction and some dimensions such as gender, average years at university and school cycle. However, Kuo et al. [
31], after conducting a preliminary test with a set of 111 students from the United States to measure their satisfaction in an online course, showed that satisfaction was conditioned by the handling of ICTs and that there were differences between gender, academic level (undergraduate and graduate) and time spent. However, the chi-square test applied to each individual factor did show significant relationships in the aspects of methodology, organization and expectations in relation to the programs studied and the origin of the graduate. In this sense, significant levels of dissatisfaction were found in the methodology of the “Auditing” and “Biodiversity” programs and from the point of view of organization and academic expectations in graduates from Central America, South America and the Eurasia zone, respectively. It is worth mentioning that, from an overall point of view, no significant differences were found among the variables, which provides an idea of the importance of performing factor analysis to discover findings that would otherwise go unnoticed. Finally, the fact that no other significant relationships were found between other variables does not mean that the relationship does not exist, but simply that it could not be demonstrated with a significance level of 0.05 and the number of study units with which it worked.


