Article

Sustainable Logistics Management Maturity—The Theoretical Assessment Framework and Empirical Results from Poland

by
Karolina Werner-Lewandowska
* and
Paulina Golinska-Dawson
Faculty of Engineering Management, Poznan University of Technology, 60-965 Poznan, Poland
*
Author to whom correspondence should be addressed.
Sustainability 2021, 13(9), 5102; https://doi.org/10.3390/su13095102
Submission received: 30 March 2021 / Revised: 22 April 2021 / Accepted: 27 April 2021 / Published: 1 May 2021
(This article belongs to the Collection Sustainability on Production and Industrial Management)

Abstract

:
Poland is Europe’s leader in international freight transport. The majority of companies in the Polish logistics sector are small-sized enterprises with limited human and material resources, which reduces their ability to implement corporate social responsibility practices. In this paper, we explore the logistics solutions (tools and practices) implemented by companies in the logistics sector to manage their business operations through the prism of the triple bottom line (TBL). We assume that a company might achieve sustainable performance even if it focuses mainly on the implementation of logistics solutions for economic performance, as some of those tools and practices also have an impact on the environmental and social performance without being dedicated to them per se. We define sustainable logistics management maturity (SLMM), as the extent to which a company implements modern logistics solutions (tools and management practices) to improve performance with regard to the economic, environmental, and social dimensions of sustainability. Results from focus group research are presented, where experts have assessed the impact of tools and management practices in logistics management on the economic, environmental, and social dimensions of sustainability. Then, we define the overall sustainable logistics management maturity indicator (OSLMI) to allow comparison and benchmarking between companies in the logistics sector. The maturity theory is applied, as it is a suitable tool for the positioning and benchmarking of companies. Through the conceptual model, we link the capabilities of a company (expressed by the application of the logistics solutions) with factors related to the company’s characteristics (size, business profile, source of capital), and the ability of a company to achieve a certain maturity level. The maturity concept is used here to measure the effectiveness of the performance of companies. We use a database of 190 Polish companies from the logistics industry to verify three research hypotheses. Bayesian statistics is applied to verify the existence of a relation between the level of SLMM and a company’s characteristics (size, scope of economic activities, and structure of capital). Statistical analysis proves that the size of a company and the type of economic activities it engages in affect its ability to achieve a higher degree of maturity.

1. Introduction

In the last decade, we have been able to observe a shift in the paradigm in the logistics sector by linking sustainability with improved company performance [1,2,3]. Sustainability practices at a company level are often analyzed by the triple bottom line (TBL) framework, which distinguishes three dimensions: economic, environmental, and social [2]. The TBL provides a holistic view of company performance [4].
The logistics sector is an interesting area for the investigation of sustainability [5] as logistics service providers link several participants in the supply chain, and transport and/or store goods on their behalf. Bandeira et al. [6] and Stindt [7] state that the measurement of the sustainability of logistics activities can significantly contribute to achieving UN SDG 12 “Responsible consumption and production”. Logistics service providers cooperate with different supply chain participants, and, thus, they are exposed to disturbances that appear in the economy. In a systematic literature review, Chowdhury et al. [8] have identified that the pandemic created an ambiguous effect on the supply chain. Interest in environmental and social issues seems to have been suppressed by financial problems and a focus on building resilience strategies in a disruptive pandemic world. Martins et al. [9] and Hong et al. [10] postulate that there is a research gap as regards the implementation of sustainability practices in logistics.
The studies on sustainability in a company are often focused on the corporate sustainability approach, which encompasses the environmental, social, and economic needs of all the stakeholders [11,12]. However, the corporate sustainability approach requires dedicated human and financial resources, which are often not available in small- and medium-sized enterprises.
Poland is an interesting market for a study in the logistics sector. According to the data from Eurostat, the Polish logistics sector has a very high share in tonne-kilometers terms in freight transport in the European Union (16, 4% of total EU) [13]. Poland holds predominance in cabotage activity. In 2018, Polish haulers were the main third-country haulers in country-to-country transport of goods in the EU [14]. According to Central Statistical Office (GUS) data, in 2018, the transport and warehousing providers accounted for 12% of enterprises in Poland [15]. In addition, logistics service providers generate the largest GDP impact among Polish service enterprises [15].
At the same time, Polish transport companies are mainly micro- and small-sized enterprises with a strong focus on cost reduction and effective management at the operational level. The environmental and social aspects are not a priority in their operations management. Therefore, it is important to explore if the current business practices have the potential to contribute to all three dimensions of sustainability.
In this paper, we explore the logistics solutions (tools and practices) implemented by companies in the logistics sector to manage their business operations through the prism of the triple bottom line (TBL). We assume that a company might achieve sustainable performance even if it focuses mainly on the implementation of logistics solutions for economic performance, as some of those tools and practices also have an impact on the environmental and social performance without being dedicated to them per se. We aim to explore how to assess the sustainable performance of companies, if they do not define their performance goals with regard to the three dimensions of sustainability.
To measure the performance of logistics service providers, we define the concept of sustainable logistics management maturity (SLMM), as the extent to which a company implements modern logistics solutions (tools and management practices) to improve performance with regard to the economic, environmental, and social dimensions of sustainability.
In the next subsection, we discuss the related works that contributed to the development of this concept.

1.1. Related Works

1.1.1. Sustainable Performance of Logistics Services Providers

Studies on sustainability in supply chain management are mostly focused on the manufacturer perspective, and, thus, they are not relevant to analyzing the performance of logistics service providers [16]. Most of the previous research conducted in this area of sustainability in the logistics sector assesses the possibility to reduce the environmental impact of logistics operations [17,18]. Centobelli et al. [19] analyze, through a systematic literature review, the environmental sustainability of logistics service providers (LSPs). They provide a taxonomy of green initiatives of LSPs and conclude that their link to sustainability performance is not fully investigated. They identify factors enabling sustainable performance, such as (inter alia): company size, quality of the human resources, and willingness of the decision-makers to engage in sustainable initiatives. Evangelista et al. [20,21] investigate if environmental sustainability is a priority in decision-making at LSPs. They identify internal and external factors related to the sustainability of the performance of LSPs. They suggest that most papers consider only large companies in the logistics sector, which implement corporate social responsibility strategy. Therefore, they make an extra effort to include medium-sized LSPs, to explore their approach towards sustainability. They identified internal factors such as the willingness of the decision-makers to engage in sustainable initiatives, cost reduction and pressure on profitability, and maintaining company image. Bask et al. [5], investigated entities (600 surveys) in the logistics sector to identify (among others) the characteristics of a company that is prone towards sustainability. They conclude that globally-operating LSPs are the most interested in environmental issues, and they outperform their smaller competitors. They state that sustainability should be integrated into operations management. A focus on small-sized enterprises is very rare in studies on sustainability in the logistics sector. Abbasi and Nilsson [17] try to include SMEs (at a very limited scale) in their study, on the sustainable performance of the LSPs. They find out that LSPs perceive that “their efforts to provide more environmental solutions do not pay off since they are not prioritized when they come in conflict with cost or time”. Therefore, we make the assumption that small- and medium-sized enterprises (as they have limited resources) give priority to economic/profit-related issues. They are followed by environmental concerns, and, thereafter, social/people performance [17]. In our database micro- and small-sized enterprises are dominant. Therefore, we contribute to the existing research gap on the assessment of LSPs performance, as most studies include mainly large enterprises.
In previous studies, we have investigated [22,23,24,25,26] the issues related to the assessment of the performance of the LSPs by application of the logistics management maturity (LMM) framework. The LMM defines the extent to which a company implements modern logistics tools and practices (also referred to as “logistics solutions”) to improve its operations. In previous research [22,23,24,25,26], we have identified and analyzed 65 tools used in the field of logistics management [26,27]. Logistics solutions, which we previously analyzed, have proven to be relevant to achieving economic/profit-related performance. In this research, we extend our previous studies, and explore the links between these logistics solutions and the environmental and social/people-related performance of LSPs. Based on the previous research of Pfohl et al. [28], we link the performance of logistics management to a company’s internal capabilities. Internal capabilities are expressed by the ability to implement logistics solutions in business operations. Companies search for guidelines on how to improve their capabilities and integrate sustainability in their business goals at the operational level [29,30,31]. The ability to compare and benefit from benchmarking in a particular sector is an important element of the transition towards more sustainable business performance [32,33,34]. The maturity models are suitable positioning and benchmarking tools, and, thus, we used this method in our study.

1.1.2. Maturity Models for Sustainability Assessment

We performed a literature review in Scopus Web of Science and Google Scholar for the term: sustainable logistics management maturity. The results were not satisfactory, as we found a very limited number of relevant works. For that reason, we decided to proceed with the critical literature review on general maturity models for sustainability assessment.
Maturity models (MMs) are currently recommended by researchers as a framework for sustainability assessment in a company [35,36,37,38]. Pullen [37] defines MMs, as “a structured collection of elements that describe the characteristics of effective processes at different stages of development”. The advantages of MMs are their simplicity in application and their evolutionary character, as they may gradually guide a company towards excellence in the analyzed domain [39]. According to Röglinger et al. [40] maturity models allow for internal or/and external benchmarking and are suitable as reference models.
In this paper, we apply the maturity model theory to provide a framework for the comparison of different companies in the logistics sector with regard to the level of application of modern logistics solutions for sustainable logistics management. The existing MMs for suitability assessment focus on sustainable supply chain management [39], corporate social reasonability [41], and product development and life cycle management [42]. They are not relevant for an analysis of small- and medium-sized logistics service providers, as they do not consider the evolution of a company’s capabilities towards sustainable operations. Examples of the application of MMs in the area of logistics are very limited [27,43]. The most holistic models by Battista et al. [43] and Battista and Schiraldi [44] focus only on economic/profit-related performance. Machado et al. [35] explore the use of MMs to trigger changes in business processes towards more sustainable performance by the integration of sustainability into operations management. The model identifies five maturity levels with a focus on corporate social responsibility from basic compliance with the minimum regulations towards the top maturity level with fully sustainable performance. That framework is designed for large companies with dedicated resources to develop CSR. Such solutions are not suitable for SMEs with limited resources.

1.2. Aim and Originality of This Study

Studies on small- and medium-sized enterprises (SMEs) are underrepresented in the literature. SMEs have limited human and material resources, and, thus, they struggle to implement complex solutions for corporate sustainability. We explore the logistics solutions (tools and practices) that are implemented by companies with a focus on achieving economic/profit-related performance, and we assess their relation to the three dimensions of sustainability.
How can we assess the sustainable performance of companies, if they do not define the performance goals with regard to the three dimensions of sustainability?
We asked experts in a focus group research to assess the impact of the implementation of different solutions in logistics management on the economic, environmental, and social dimensions of sustainability. Then, we defined the overall sustainable logistics management maturity indicator (OSLMI) to allow comparison and benchmarking between companies in the logistics sector. The maturity theory is applied, as it is a suitable tool for the positioning and benchmarking of companies. Through the conceptual model, we link the capabilities of a company (expressed by the application of the logistics solutions) with factors related to the company’s characteristics (size, business profile, source of capital), and the ability of a company to achieve a certain maturity level. The maturity concept is used here to measure the effectiveness of the performance of a company. We used a database of 190 Polish companies from the logistics industry. Three research hypotheses are stated and verified. Bayesian statistics is applied to verify the existence of a relation between the level of SLMM and company size, the scope of economic activities, and the source of capital.
The paper is organized as follows: First, the background and motivation for this study are presented in Section 1. In Section 2, the methodology is described, and the research questions and research hypotheses are discussed. In Section 3, empirical testing is provided. The discussion of the results is presented in Section 4. The final conclusions, benefits, and limitations of the study, and further research are discussed in Section 5.

2. Materials and Methods

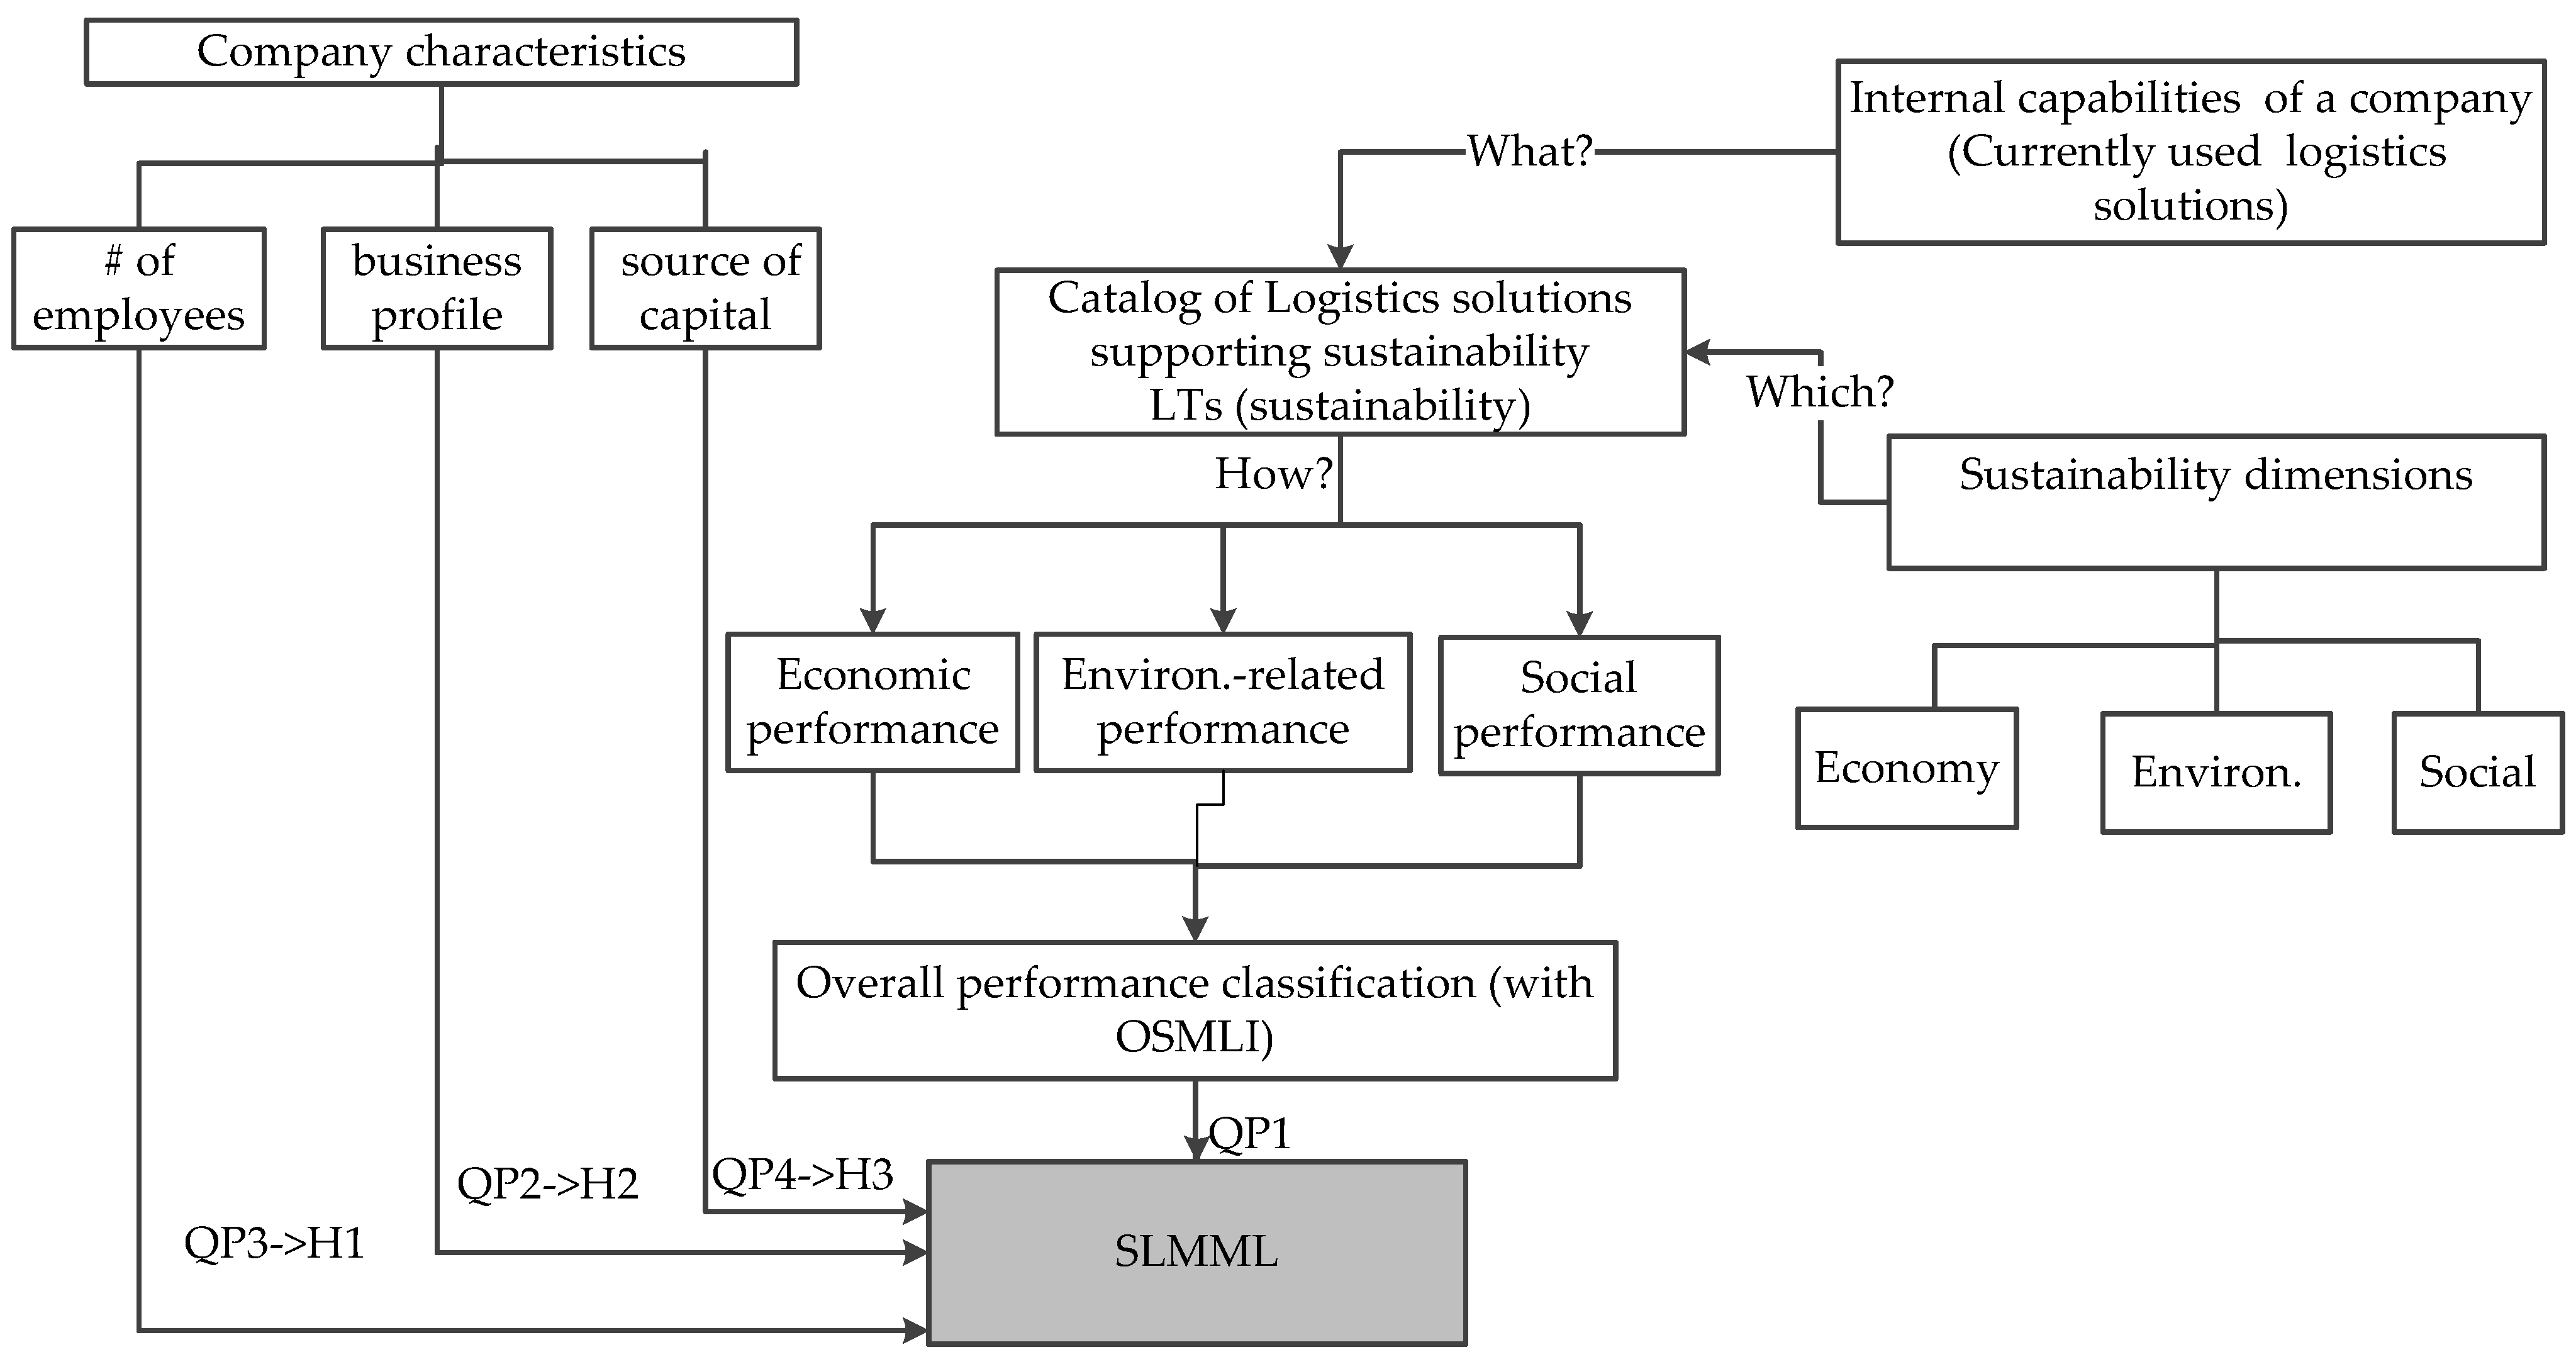
2.1. Scope of Research and Conceptual Model

The scope of this research encompasses logistics service providers, defined as an enterprise classified under the Statistical Classification of Economic Activities in the European Community, Rev. 2 (NACE Rev. 2) in section H. This section includes the provision of passenger or freight transportation, whether scheduled or not, by rail, pipeline, road, water, or air and associated activities such as terminal and parking facilities, cargo handling, storage, etc. Included in this section are also postal and courier activities.
We investigate the logistics solutions (tools and practices) that companies use for economic/profit-related performance, and chose the solutions (in focus research) that also have an impact on environmental and social performance, without being dedicated to them per se. We assume that a company can achieve sustainable performance even if it mainly focuses on the implementation of logistics solutions that support economic performance. We define the concept of sustainable logistics management maturity (SLMM) as the extent to which a company implements modern logistics solutions (tools and management practices) to improve performance with regard to the economic, environmental, and social dimensions of sustainability.
We define maturity, as the capability of a company to achieve the goals by application of the solutions, which support the achievement of this goal. A maturity model is an evolutionary approach, which guides the company from current to future (more desirable) state with regard to its performance in the analyzed context. In our case, the context is constituted by the three dimensions of sustainability. The primary goal of the maturity model is to allow for the positioning of the current capabilities of a company to trigger a transition. A capability is a repeatable pattern of activities in the use of resources to offer products/services to a market [45]. In accordance with the work of Pfohl et al. [28], logistics management capabilities are created internally in a company by people, technology, organization of processes, and learning from previously performed tasks [28]. The internal capabilities determine the performance of logistics management. We assume that internal capabilities define the choice of applied logistics solutions. Thus, logistics management maturity is the extent to which a company implements modern logistics tools and practices (also referred to as “logistics solutions”) to support the management of its logistics activities [24,25,26,27,28].
In this paper, we propose an approach for the positioning of a company with regard to its performance in the context of the three dimensions of sustainability, even if the company does not implement the corporate sustainability strategy.
In the conceptual model (in Figure 1) we place the concept of the Sustainable Logistics Management Maturity (SLMM) at the center. Based on the previous research of Pfohl et al. [28], we link the performance of logistics management to a company’s internal capabilities. In the research of Pfohl [46], the internal capabilities determined the effectiveness of logistics management and the ability of a company to achieve goals. In our approach, we substitute the “effectiveness of performance” by “maturity of performance”. As the effectiveness is “doing things right” [47], we assume that the more mature the company is, the better its performance will be in the analyzed context (dimension of sustainability). We use the concept of maturity (and maturity model theory), as the maturity model describes the integration of practices from a basic state to an improved state [36].
For the benchmarking of companies in the logistics sector, we need a flexible assessment framework due to the different characteristics of companies. We characterize a LSP by three dimensions: employment size (micro-, small-, medium-sized enterprise, and large company), business profile (a dominant type of logistics service), and source of capital (national, international). We further consider two dominant business profiles in Poland, namely, transport services and warehousing. The data on the role of transport from Eurostat is presented in the Introduction section. Polish warehousing is becoming the largest warehousing sector in Central and Eastern Europe, with over 1 million sqm of new space delivered to the market, between H1 2019 and H1 2020 [48]. Warehousing investments in the first half of 2020 came to almost EUR 1.2 billion [49]. Yield rates on warehouse investments in Poland are higher than in other European countries [50].
The common opinion in the Polish logistics sector is that companies with “foreign capital” achieve better performance. Thus, the source of capital is included to verify whether the source of capital enables to achieve more “mature” (more effective) performance in the context of sustainability.
In the conceptual model (Figure 1), the internal capabilities of a company are represented by its ability to apply logistics solutions. In the research questions, we link the capabilities of a company in logistics management, with regard to the three dimensions of sustainability (as sustainable logistics management maturity), with the company’s characteristics. We formulated four research questions:
  • QP1: How to classify the levels for sustainable logistics management maturity in the logistics sector?
  • QP2: Is the level of SLMM determined by the scope of services provided by a logistics operator?
  • QP3: Is the level of SMLL determined by the size of employment in enterprise?
  • QP4: Is the level of SLMM determined by the source of capital?
Question QP1 has a preparatory character and helps us to structure the capabilities of a company and design a new way to measure them. We analyze the internal capabilities of a company to achieve a certain level of maturity in economic, environmental, and social performance. To do so, we conduct focus group research and choose the most relevant (with stronger impact) solutions among those currently applied in companies. The results of the focus group are presented in the next subsection. We apply the term sustainable logistics management maturity, which we understand as the extent to which a company uses the solutions from the catalog of logistics solutions that support sustainability (from the focus group research). Then we classify the current “as-is” state of the companies to a certain level of maturity. The classification is necessary for positioning and benchmarking the companies, as maturity models should allow a company to identify the maturity gap (defined as the difference between the future desired state and the current state/position of a company)
Questions QP2–QP3 seek to answer whether the characteristics of companies are internal enablers of performance that is more mature (therefore, more effective) with regard to the three dimensions of sustainability.

2.2. Identification of the Tools and Practices Used by Logistics Service Providers and Their Impact—On the TBL Performance

In order to identify logistics solutions that support the sustainability of a logistics service provider (LTs set), we used the catalog of LTs identified in our previous project “Study of the logistics maturity of service enterprises”, financed by the National Science Centre (grant No. 2016/21/D/HS4/02116). In that project, a set of 65 logistics tools was developed, the use of which determines the logistics management maturity of an enterprise. The initial set of LTs was presented to the experts. During the focus group research, we asked the experts to identify and assess the impact of the implementation of technologies and practices in logistics management on the economic, environmental, and social dimensions of sustainability.
We adopted the following criteria for the selection of experts:
  • C1: practical knowledge in the area of sustainable development with a minimum of 5 years of experience in the company,
  • C2: theoretical knowledge in the area of sustainable development with a minimum of 5 years of experience in scientific research,
  • C3: minimum of 5 years of practical work experience in the logistics sector,
  • C4: minimum of 3 years of experience in scientific research in the logistics sector.
The experts had to meet at least two of the selection criteria. Table 1 shows the characteristics of the focus group.
The selected focus group was characterized by an equal share of experts, practitioners, and scientists. The experts answered the questions concerning the assessment of the impact of each logistics solution (LT) on a company’s ability to achieve sustainable performance (economic, environmental, and social). During the focus group research, we asked the experts the following questions:
(1)
Can those tools contribute to improving the performance of a company with regard to the three dimensions of sustainability?
(2)
If yes, what, in your opinion, is the strength of such an impact?
For the assessment of the impact, the experts used binary assessment, where:
  • 1-LT has a positive impact on the dimension of sustainable development,
  • 0-LT does not affect the sustainability dimension.
The experts used a questionnaire, which included a set of 65 logistics tools from [24,25,26]. The study took place in July 2020. On the basis of the results, we obtained a set of 36 logistics tools, which, in total, received the highest number of indications by experts. In this way, we identified logistics tools (LTs set) that support sustainable logistics management. Based on the responses of experts, in the next stage of the research, we determined the strength of the impact of the logistics tools on individual dimensions of sustainability (indicated in Table 2 as wix). Table 2 presents the average values (the arithmetic mean) of the experts’ responses.
As can be seen from the data in Table 2, each LT affects the dimensions of sustainability, but the strength of this impact is different. By analyzing Table 2, we can assess which logistics tool has the greatest total impact strength, taking into account the wix value. We can state that LT11 has the strongest impact—storage initiatives for corporate social responsibility and environmental protection (the total strength is w11e+env+s = 2.56, which is 85% of the maximum possible total impact strength equal to 3). According to the experts’ opinions, the weakest correspondence with the dimensions of sustainability is shown by LT 28—“Calculation of procurement costs”, which does not affect the environmental dimension, has a minor impact on the social dimension (w29s = 0.25) and a simultaneous strong impact on the economic dimension (w29e = 0.88).

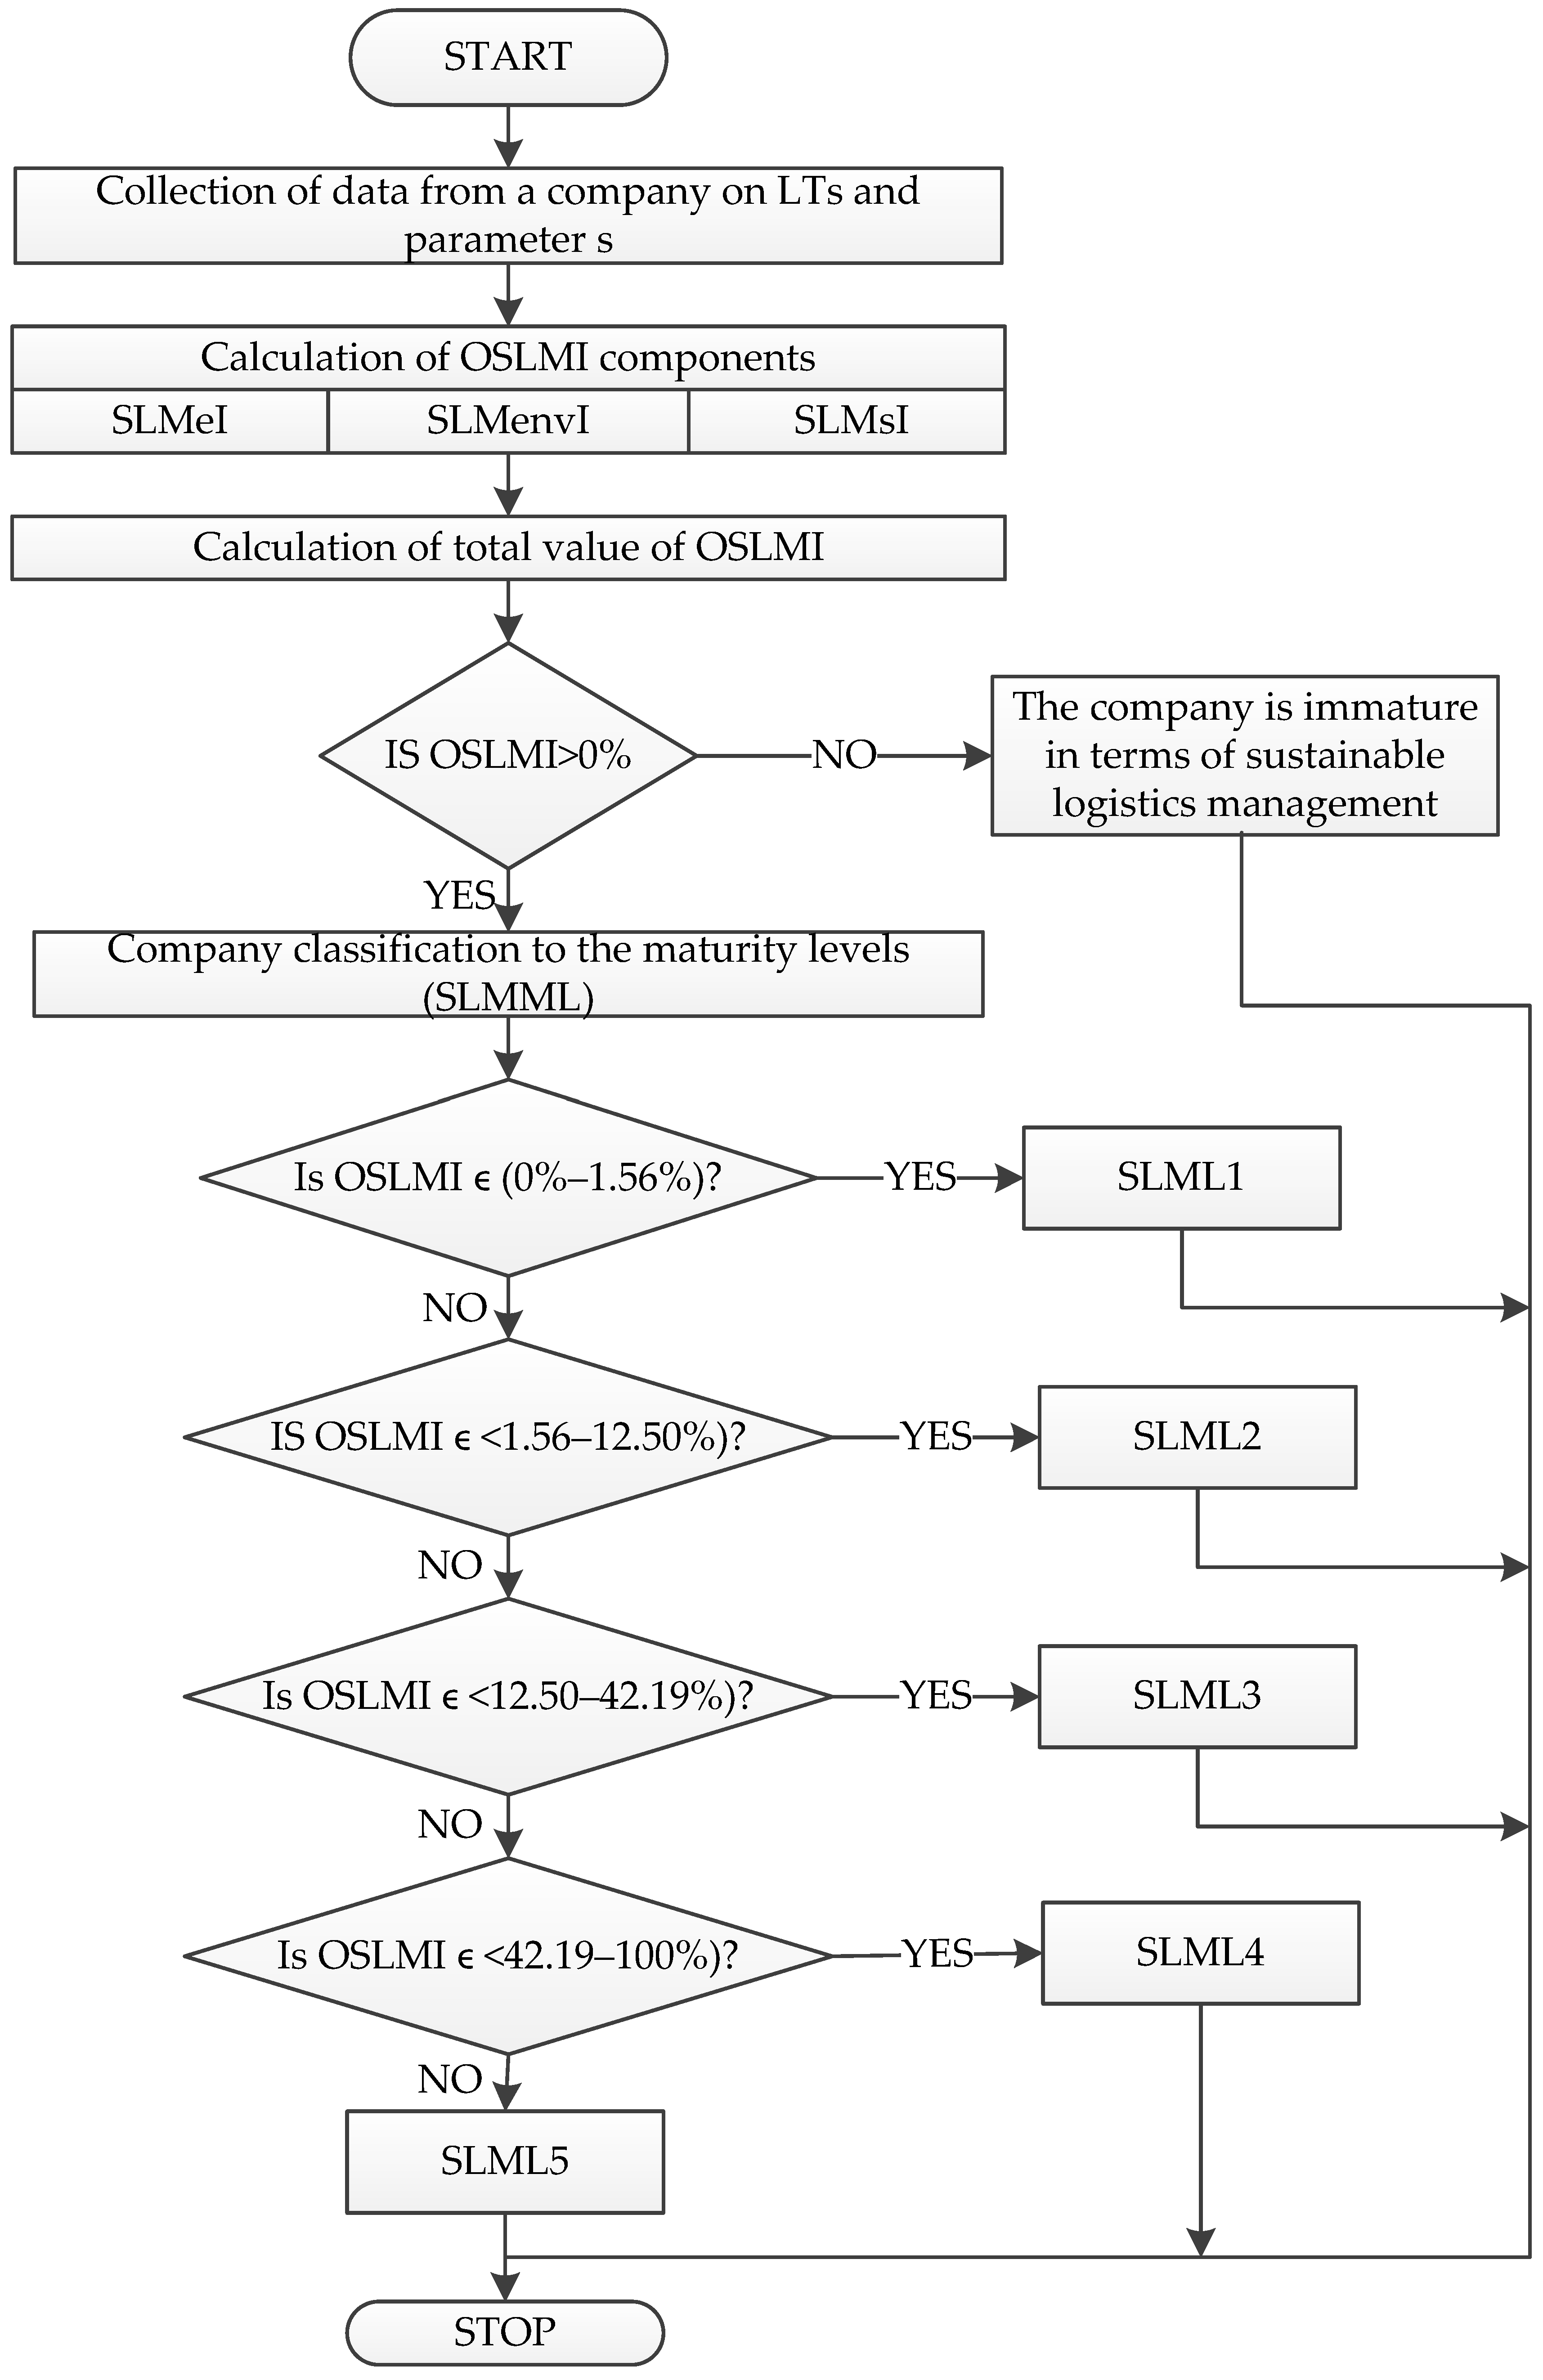
2.3. Development of an Indicator-Based Method for Classifying Sustainable Logistics Management Maturity (SLMM) at Companies

For measuring sustainable logistics management maturity (SLMM), we propose the overall sustainable logistics management indicator (OSLMI). The OSLMI illustrates the extent to which a company implements logistics solutions (hereinafter, referred to as LTs, including tools and management practices), which are relevant to achieve performances that contribute to the economic, environmental, and social dimensions of sustainability (Equation (1)):
OSLMI = SLMeI × SLMenvI × SLMsI
where
SLMeI—indicator of application of the LTs to achieve economic performance
SLMenvI—indicator of application of the LTs to achieve environmental performance
SLMsI—indicator of application of the LTs to achieve social performance
The individual components of the OSLMI are calculated using the following formula (Equation (2))
S L M x I = i = 1 n ( w i x × s )   and   SLMx I ϵ < 0 ;   100 % >  
where
x—is a set of the dimensions of sustainability, x ϵ {e, env, s},
wix—strength of the impact of a LT on the dimension of sustainability,
s—use of a given LT by the enterprise; s ϵ {0.1} where 0—logistics tool is not used or is unknown in enterprise, 1—logistics tool is used in enterprise.
N—is a set of logistics solutions.
SLMxI is expressed as a percentage [%] and it measures the extent to which a company uses LTs, which support the achievement of performance in the economic, environmental, and social dimensions. The reference value is 100%, and it means that a logistics service provider applies all LTs. The value of 0% indicates that no LTs are used in a company. Intermediate values indicate the application of a certain group of LTs. The strength of the LTs’ impact on a given dimension of sustainability is different. The value of “n” may vary depending on the output of the focus group assessment. The set of logistics solutions is flexible, as it can be adjusted by the participation of different experts if it would be relevant in the context of a different country.
Overall, sustainable logistics management indicators range from 0% to 100%, and allow for the classification and comparison of different logistics service providers in a synthetic way. Defining SLMML results from the assumption in this research that the logistics solution (LTs) applied by companies will translate into management decisions that support the three dimensions of sustainability. The consequence of this approach is the classification of companies at an appropriate maturity level from SLMML1 to SLMML5. The classification rule is presented in Table 3.
The range of the OSLMI score in Table 3 is a result of Equation (1). The OSLMI score is a result of the multiplication of the indicators: SLMeI, SLMenvI, and SLMsI. They are calculated from Equation (2). and their value range is from 0% to 100%. We assume even distribution of SLMeI/SLMenvI/SLMsI between the maturity levels. SLMeI/SLMenvI/SLMsI values for the first level belong to (0%; 25%), for level 2 <25%; 50%); Level 3 <50%; 75%), and level 4 takes values < 75%; 100%). Level 5 is a benchmark so only the value 100% is relevant. The multiplication (as in Equation (1)) of the SLMeI, SLMenvI, and SLMsI values provides the OSLMI range as indicated in Table 3.
According to the classification rules in Table 3, level 5-SLMML5, should be treated as a reference level (the highest achievable level). It is a benchmark that enterprises should aim for, indicating that a company uses all logistics solutions (LTs) relevant to performance with regard to all three dimensions of sustainability.
Our methodology for determining the SLMML also assumes that the value of the OSLMI might be 0%, which means that the enterprise is immature in terms of sustainable logistics management. The OSLMI takes the value of 0% when at least one of its components: SLMeI or SLMenvI or SLMsI is equal to 0%, and this is a basis for assessing such an enterprise as immature. Figure 2 presents the procedure for classifying companies based on the OSLMI value. The application of the OSLMI provides the answer to research question QP1.

2.4. Definition of the Research Hypotheses

After developing the SLMM measurement method, we defined the following research hypotheses on the basis of the research questions (QP2–QP4):
Hypothesis 1 (H1).
The size of employment in the enterprise has an impact on the SLMML (sustainable logistics management maturity level).
Hypothesis 2 (H2).
The business profile has an impact on the SLMML (sustainable logistics management maturity level).
Hypothesis 3 (H3).
The source of origin of capital has an impact on the sustainable logistics management maturity level.
In the research hypotheses, we link the capabilities of a company in logistics management with regard to the three dimensions of sustainability (as Sustainable Logistics Management Maturity) with the company’s characteristics. Hypotheses H1–H3 seek to answer whether the characteristics of a company (company size, business profile, and source of capital) enable more mature (therefore, more effective) overall (economic, environmental, and social) performance.
The hypotheses were verified for credibility by the application of Bayesian statistics. Bayesian statistics differs from the traditional frequentist statistics, as it can cope with uncertainty [51]. It provides a rational, mathematically sound approach to test the credibility of the prior beliefs/hypothesis (and refine them), based on the arrival of new data to produce an updated posterior belief/hypothesis. Therefore, it can cope in a situation where the data for traditional testing (representative sample) is not available. It is suitable to test hypotheses in an uncertain situation with limited information [52].

2.5. Data for the Verification of Research Hypotheses

The verification of the research hypotheses was carried out for the population of N = 190 of Polish enterprises providing transport and storage services. Data were extracted from the database covering 2000 Polish service enterprises and 65 logistics tools (The database was created within the framework of a grant entitled “Study of the logistics maturity of service enterprises”, financed by the National Science Centre (grant No. 2016/21/D/HS4/02116)). The characteristics of the researched population of 190 logistics service providers are presented in Figure 3.
Micro enterprises (up to 10 employees) dominated the study population. Micro and small-sized companies constitute 96% of our surveyed population. There were no medium-sized enterprises (51 to 250 employees) in the studied group. This is not the result of any deliberate action. These enterprises did not agree to participate in the study. The highest share of the population is characterized by enterprises providing services related to the transport of both people and goods. In the surveyed population, the share of enterprises whose capital comes from outside Poland is small.
Quantitative data on the 36 logistics tools selected by the experts (in accordance with the results in Table 2) for 190 logistics operators were extracted from the database (see results in Figure 4). The most frequently used LTs by logistics service providers (by over 60% of the surveyed enterprises) were:
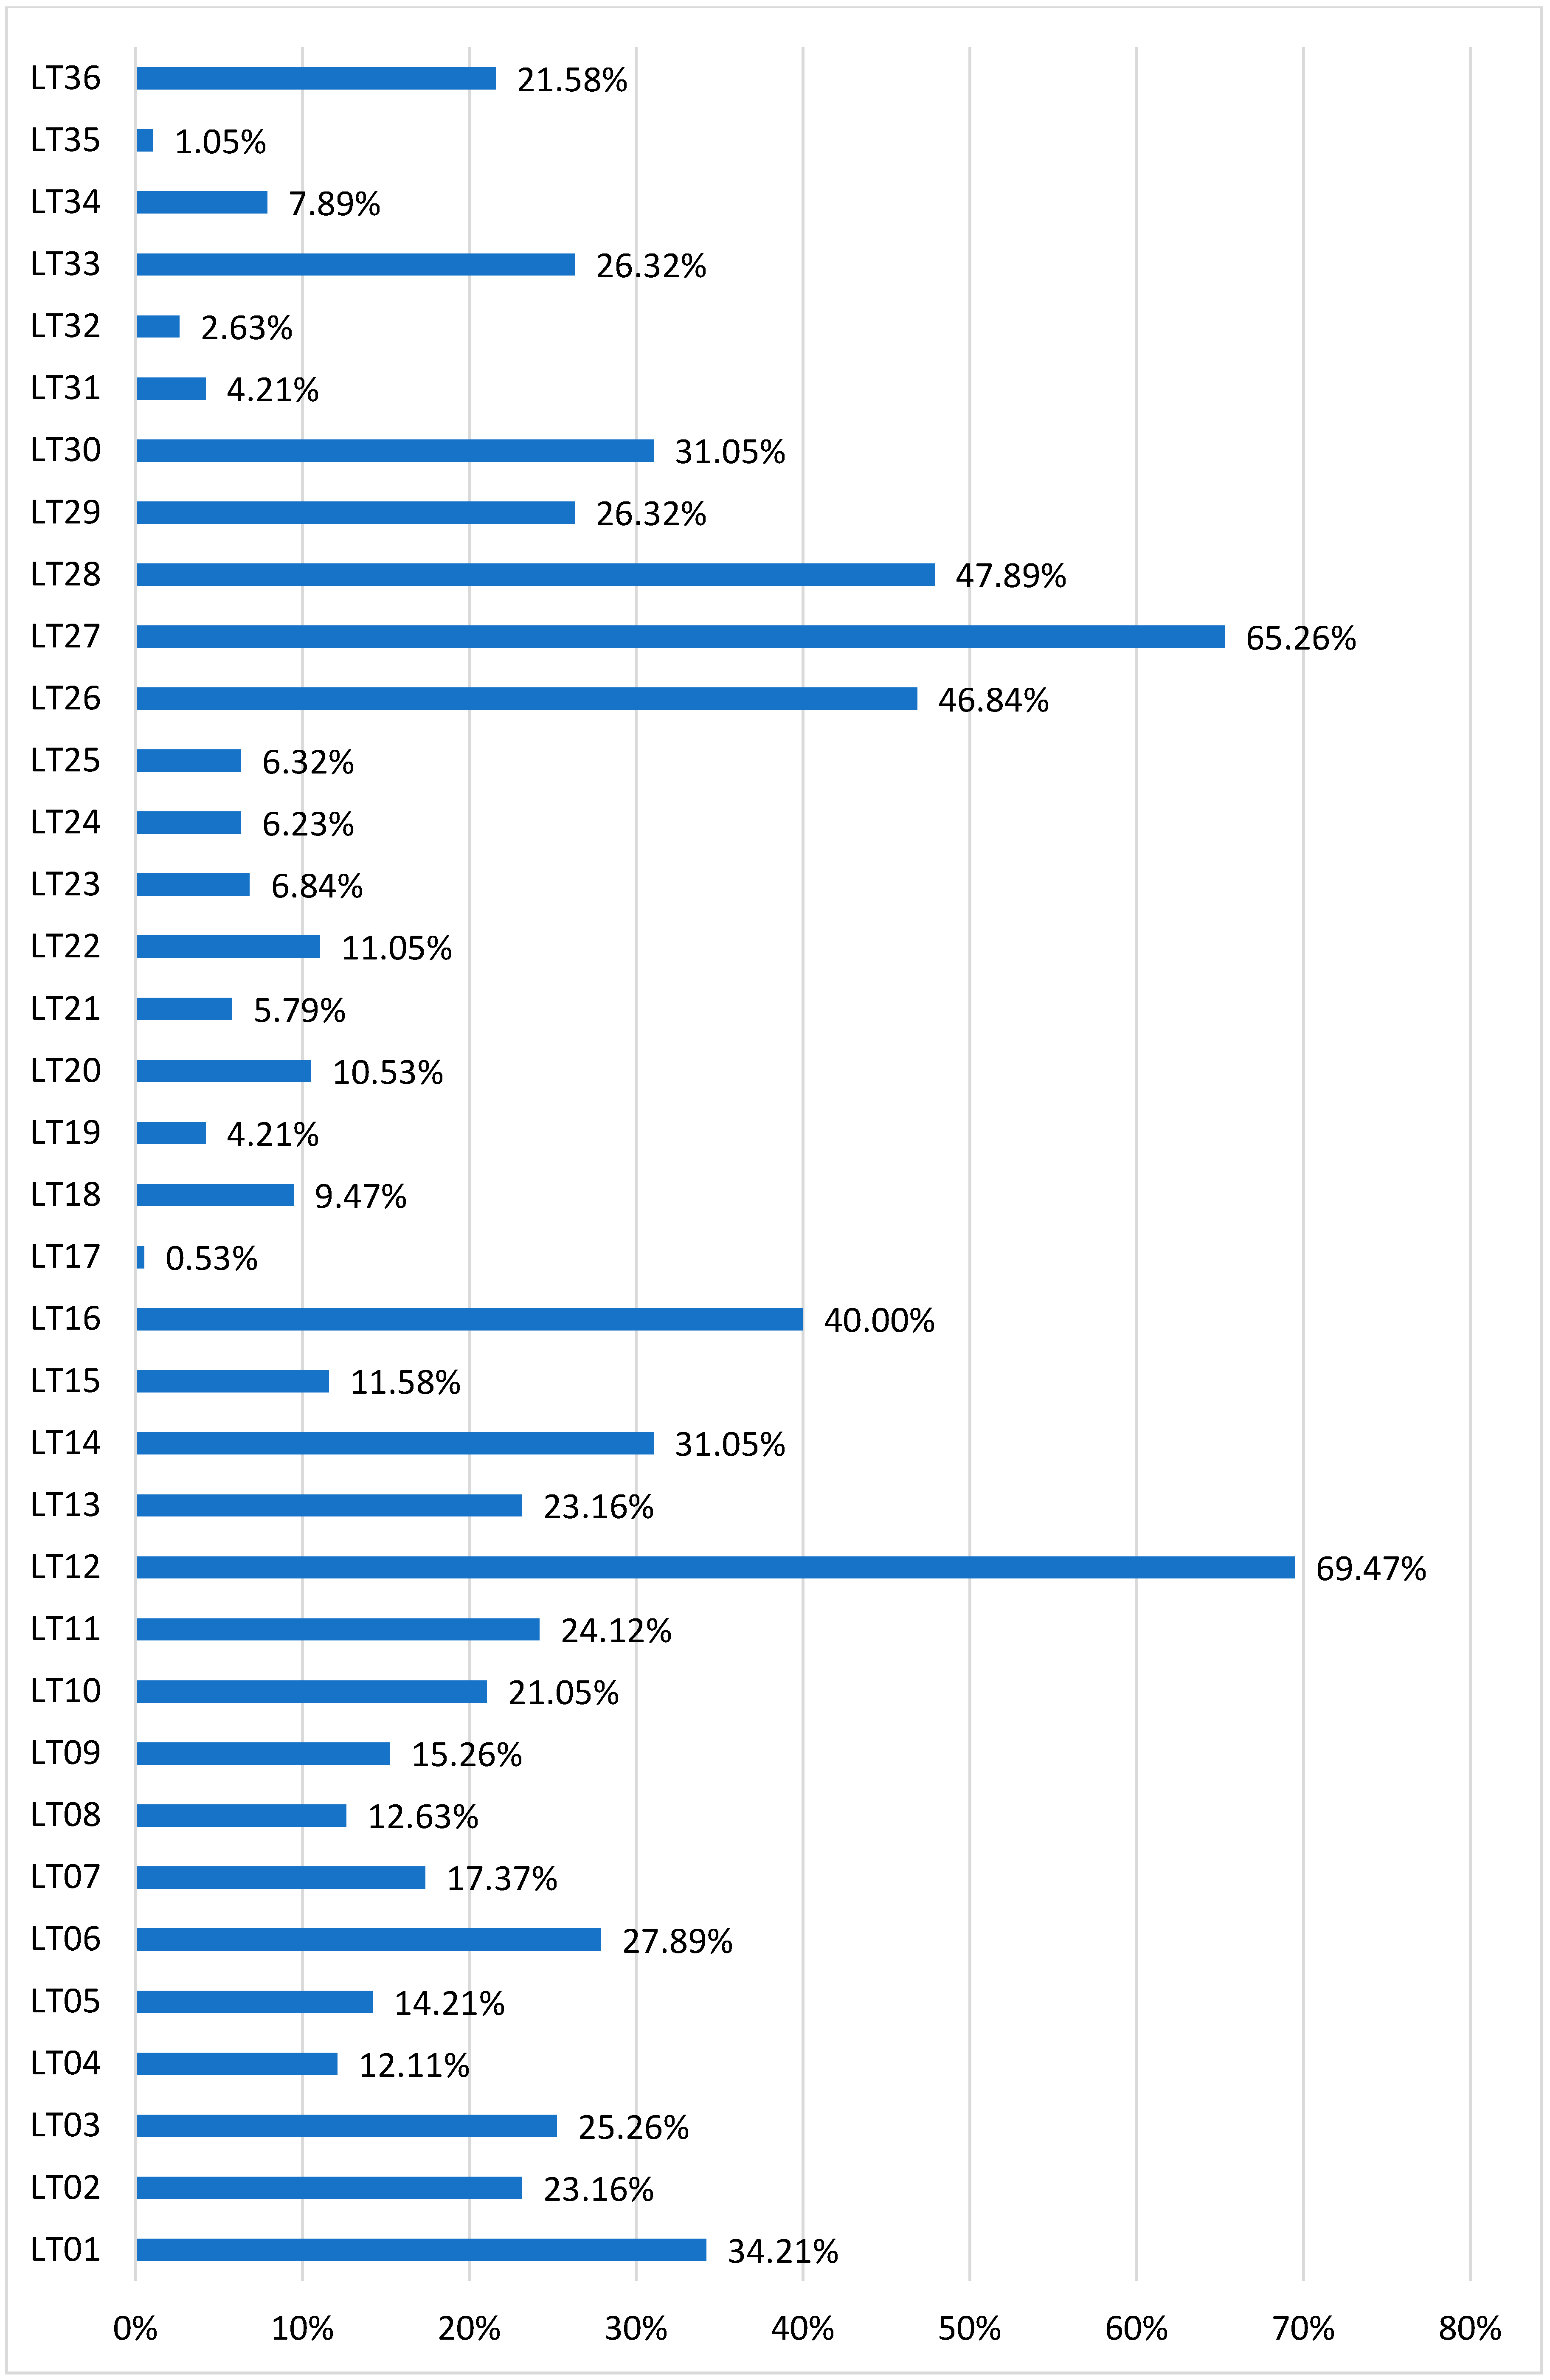
  • LT12 Calculation of shipping rates and fees,
  • LT27 Maintaining long-term relationships with the supplier.
Logistics solutions that were rarely used:
  • LT17 Assessment of the transport service provider using various criteria,
  • LT35 Z-WAVE protocol.
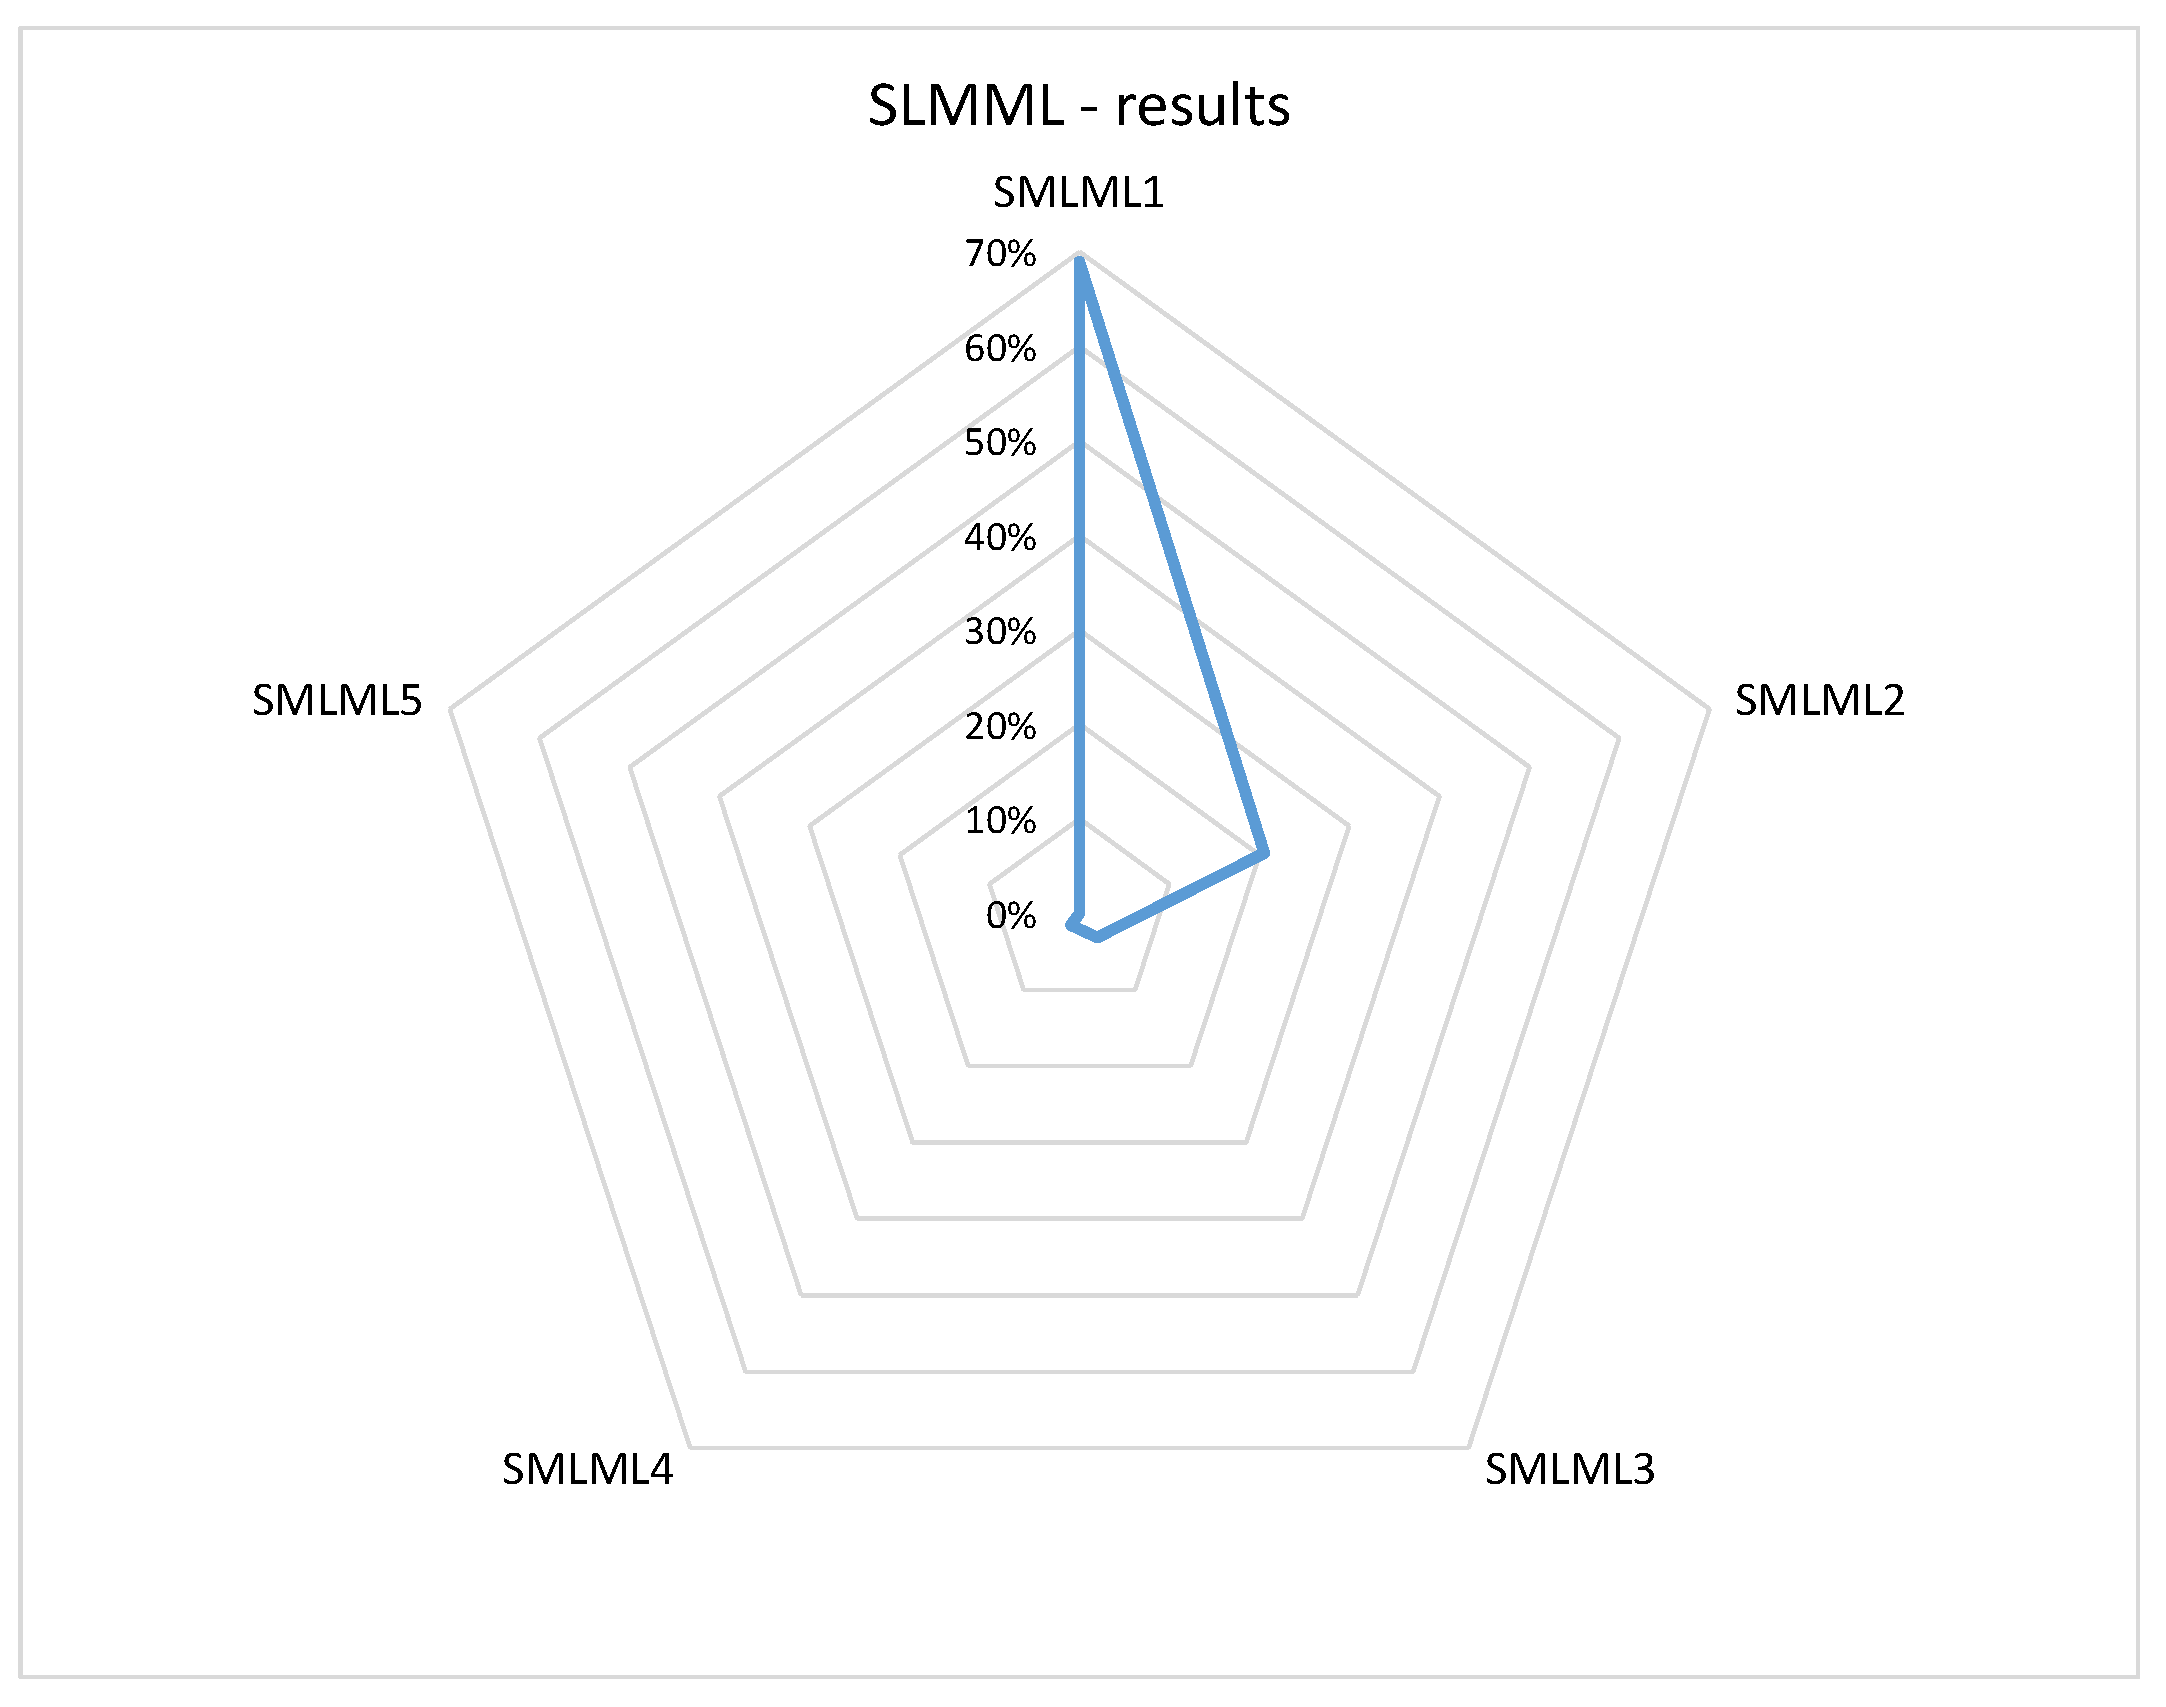
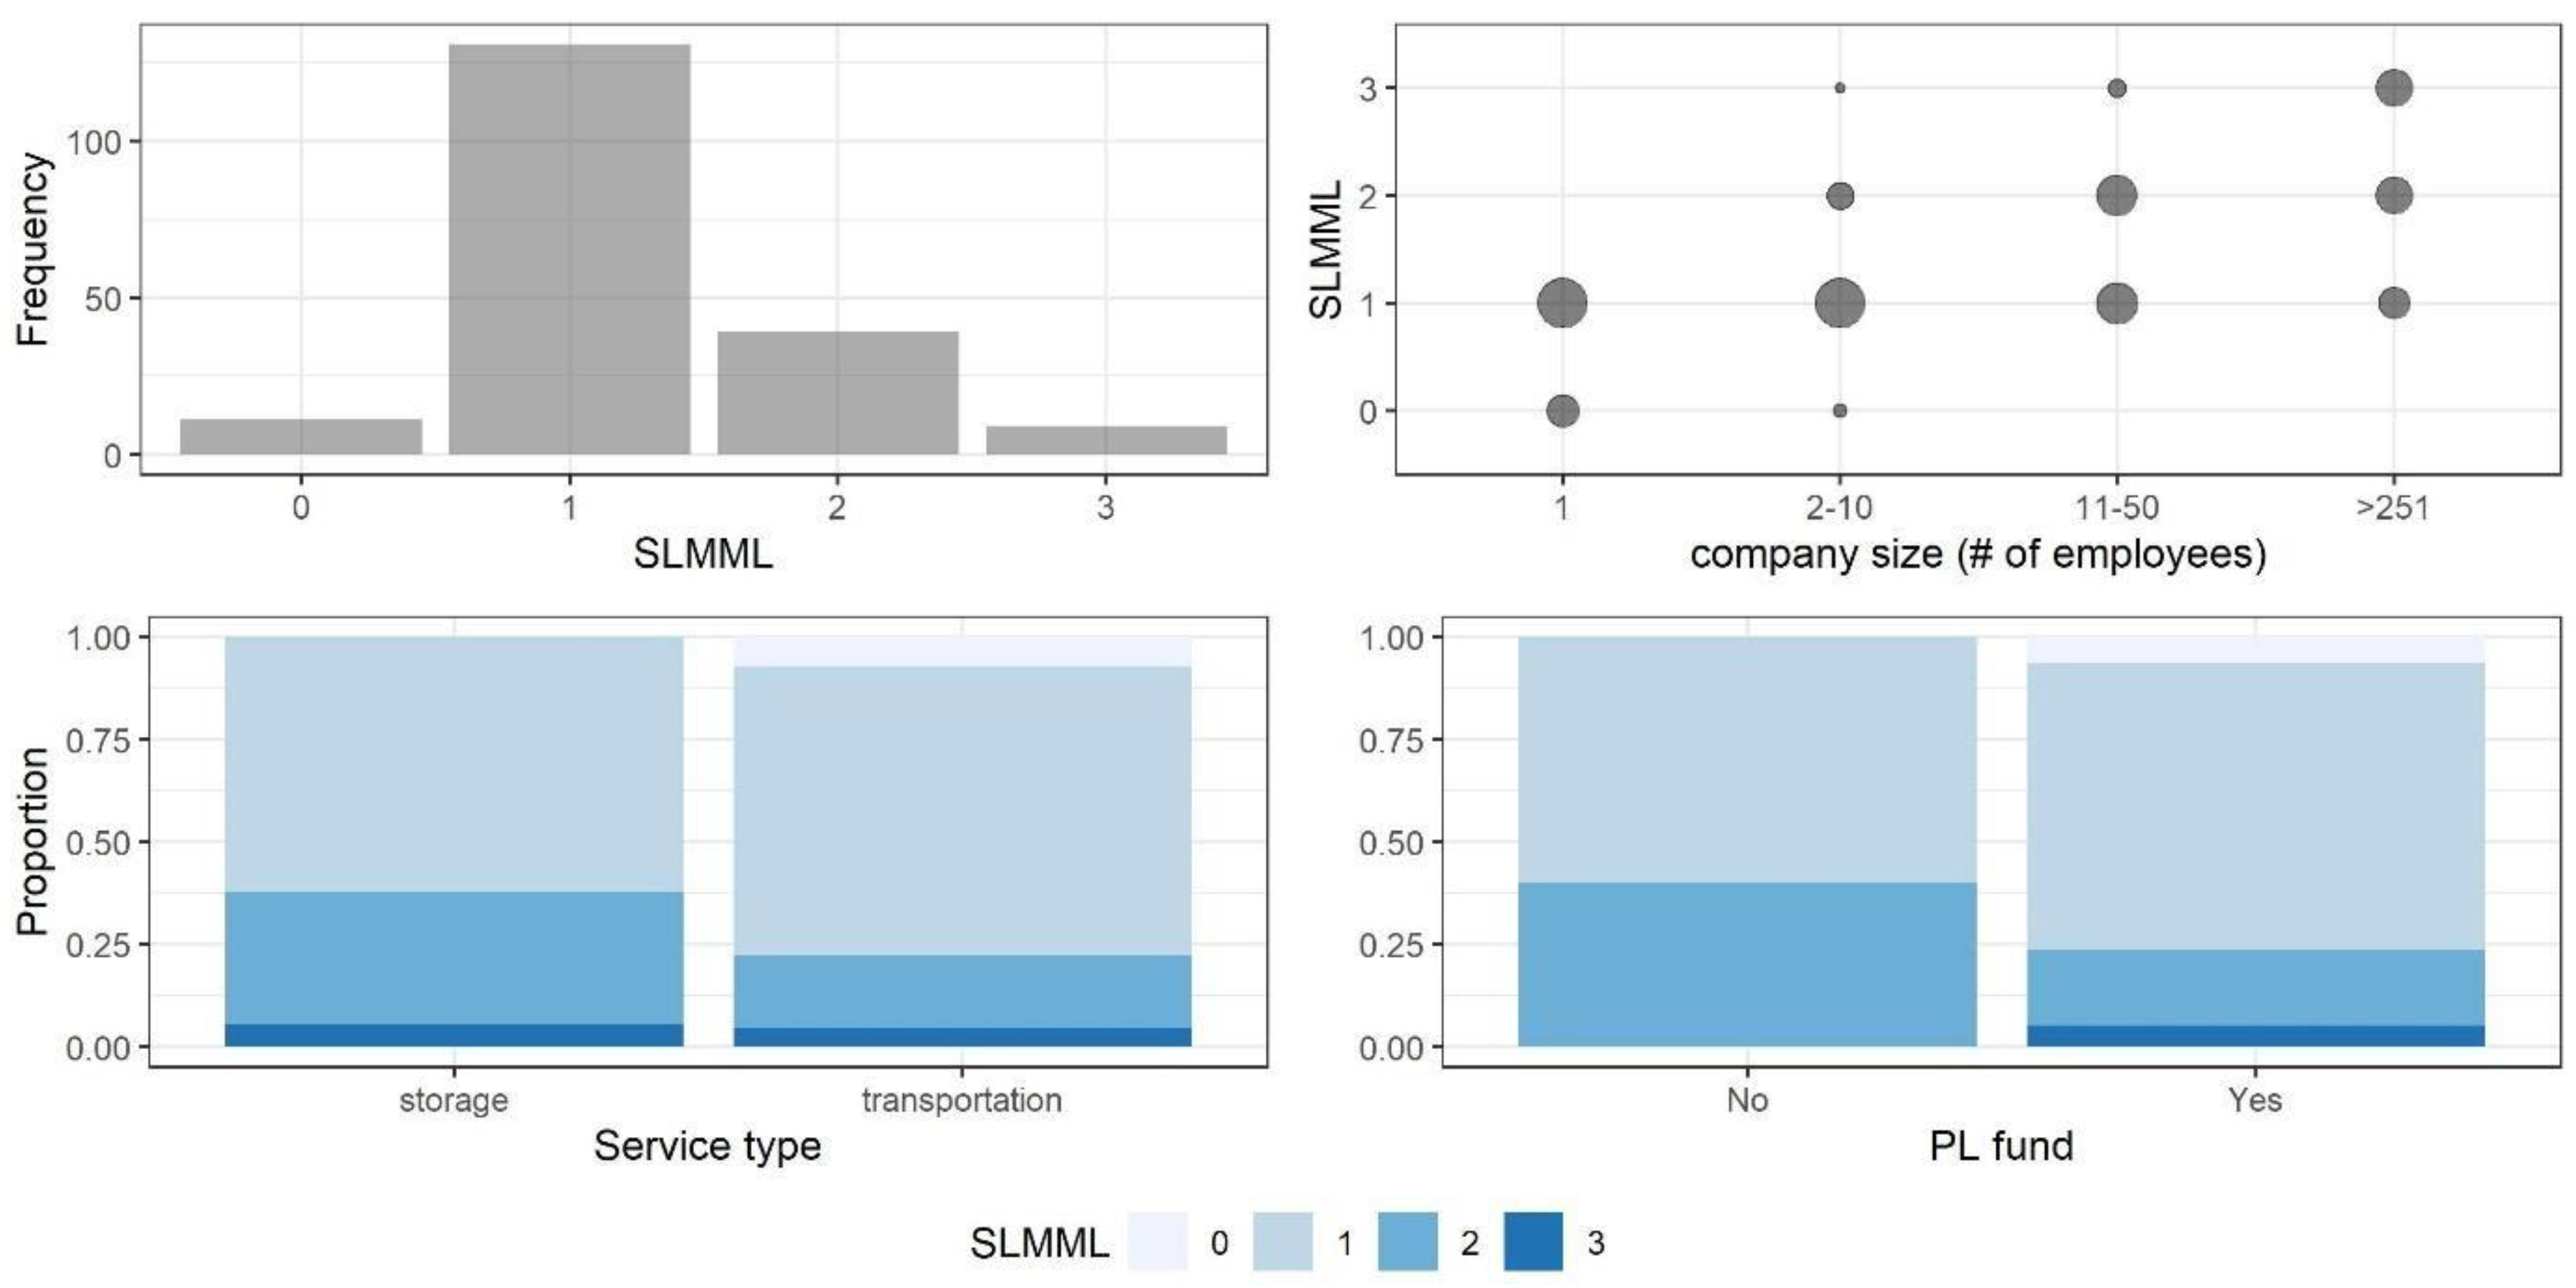
These solutions were used by approx. 1% of the surveyed service enterprises. According to the experts’ opinions, those LTs that had a strong impact on the three dimensions of sustainability, therefore, largely determined the SLMML.

3. Results

Based on the results of the research of logistics operators regarding their use of logistics tools—LTs, we calculated the OSLMI. Then, we classified enterprises for sustainable logistics management maturity level in accordance with the principles presented in Table 3. The summary of the results of the classification procedure is shown in Figure 5.
On the basis of the obtained results, we concluded that the majority of logistics service providers achieved the first level of sustainable logistics management maturity (SLMML1). This means that they were applying logistics solutions that, according to experts from the focus group, were characterized by a low impact on the dimensions of sustainability (or they were using few logistics tools with high impact strength). None of the surveyed enterprises reached the highest level of sustainable logistics management maturity (SLMML5). Some of the surveyed enterprises (11) were immature, as their OSLMI = 0%. Those enterprises provided transport services and had fewer than 10 employees, or were self-employed.
We applied the results of the OSLMI calculation for the verification of the research hypotheses.

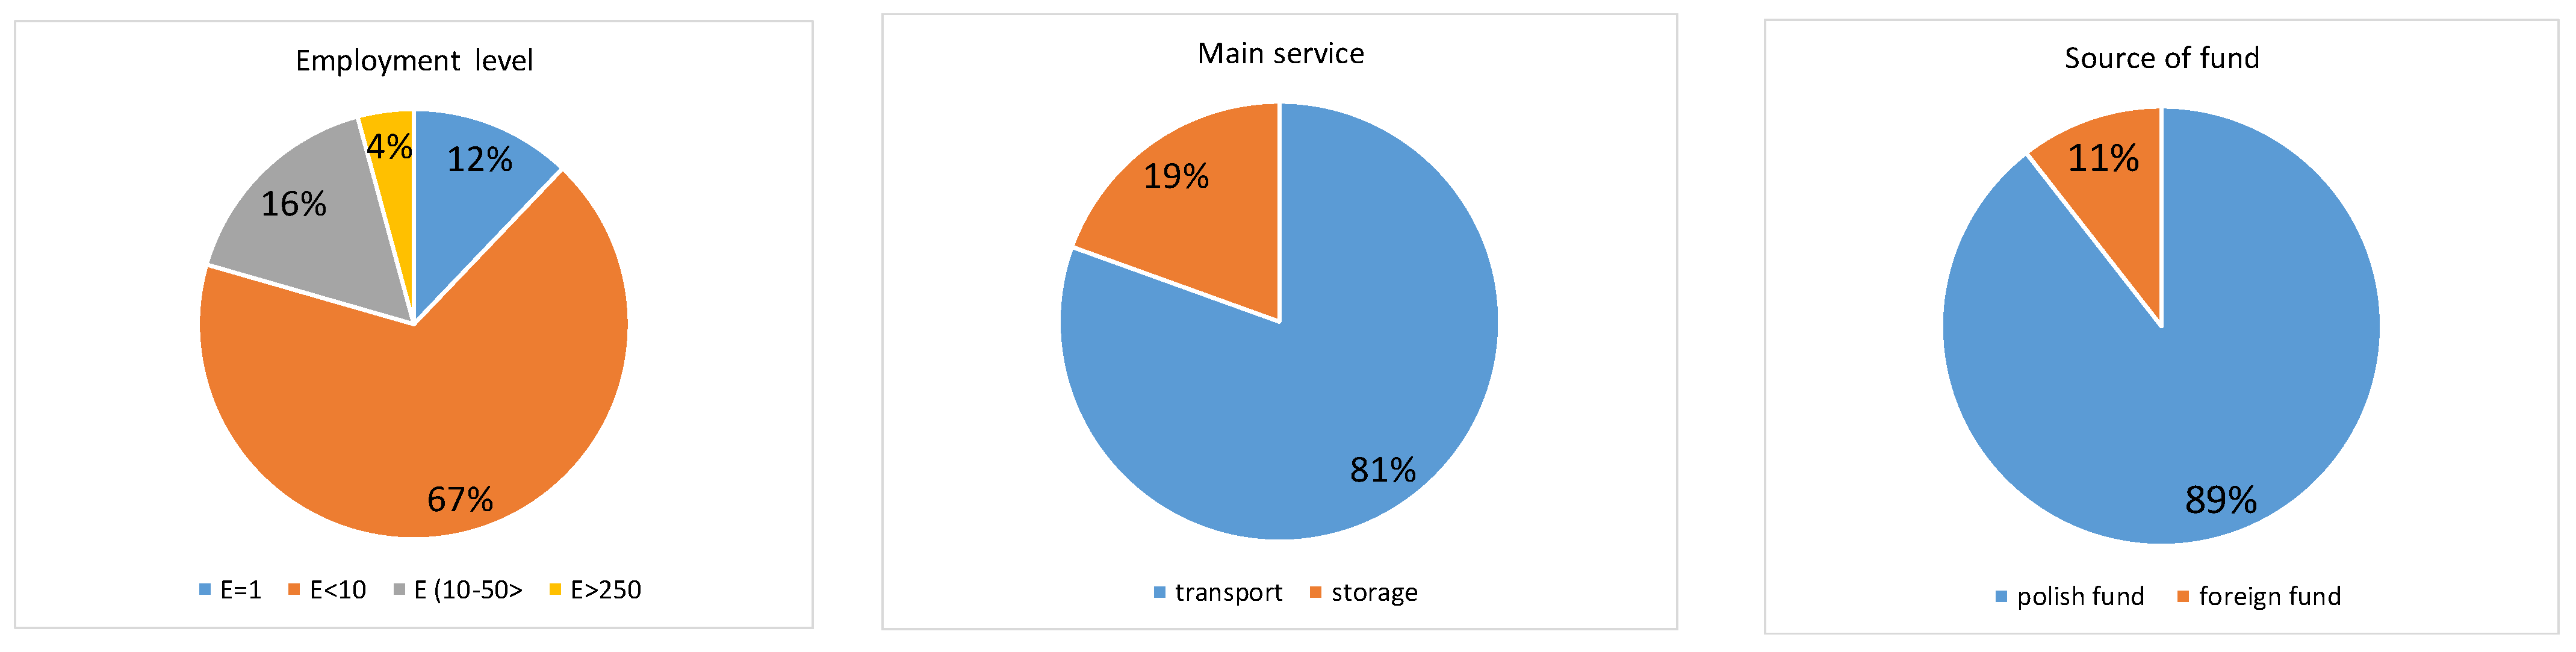
3.1. Descriptive Analyses

Data analyses were carried out using R 4.0.2 statistical software [51]. The most frequent value of the SLMML variable was 1 (Figure 6). On the descriptive level, the SLMML appeared related to company size, with proportions of higher SLMML levels increasing, as company size increased (Figure 6). The proportion of the SLMML levels equal to 2 was noticeably higher among companies offering storage, as compared to companies offering transport (Figure 6). Finally, among companies with Polish capital, the proportion of the SLMML level equal to 2 was smaller than among companies with foreign capital. Moreover, among companies with Polish capital, the SLMML levels 0 and 3 were present, as opposed to companies without foreign capital (Figure 6). In Figure 6 (for the SLMML and company size relationship) the size of the points is proportional to SLMML levels within each company’s size group.

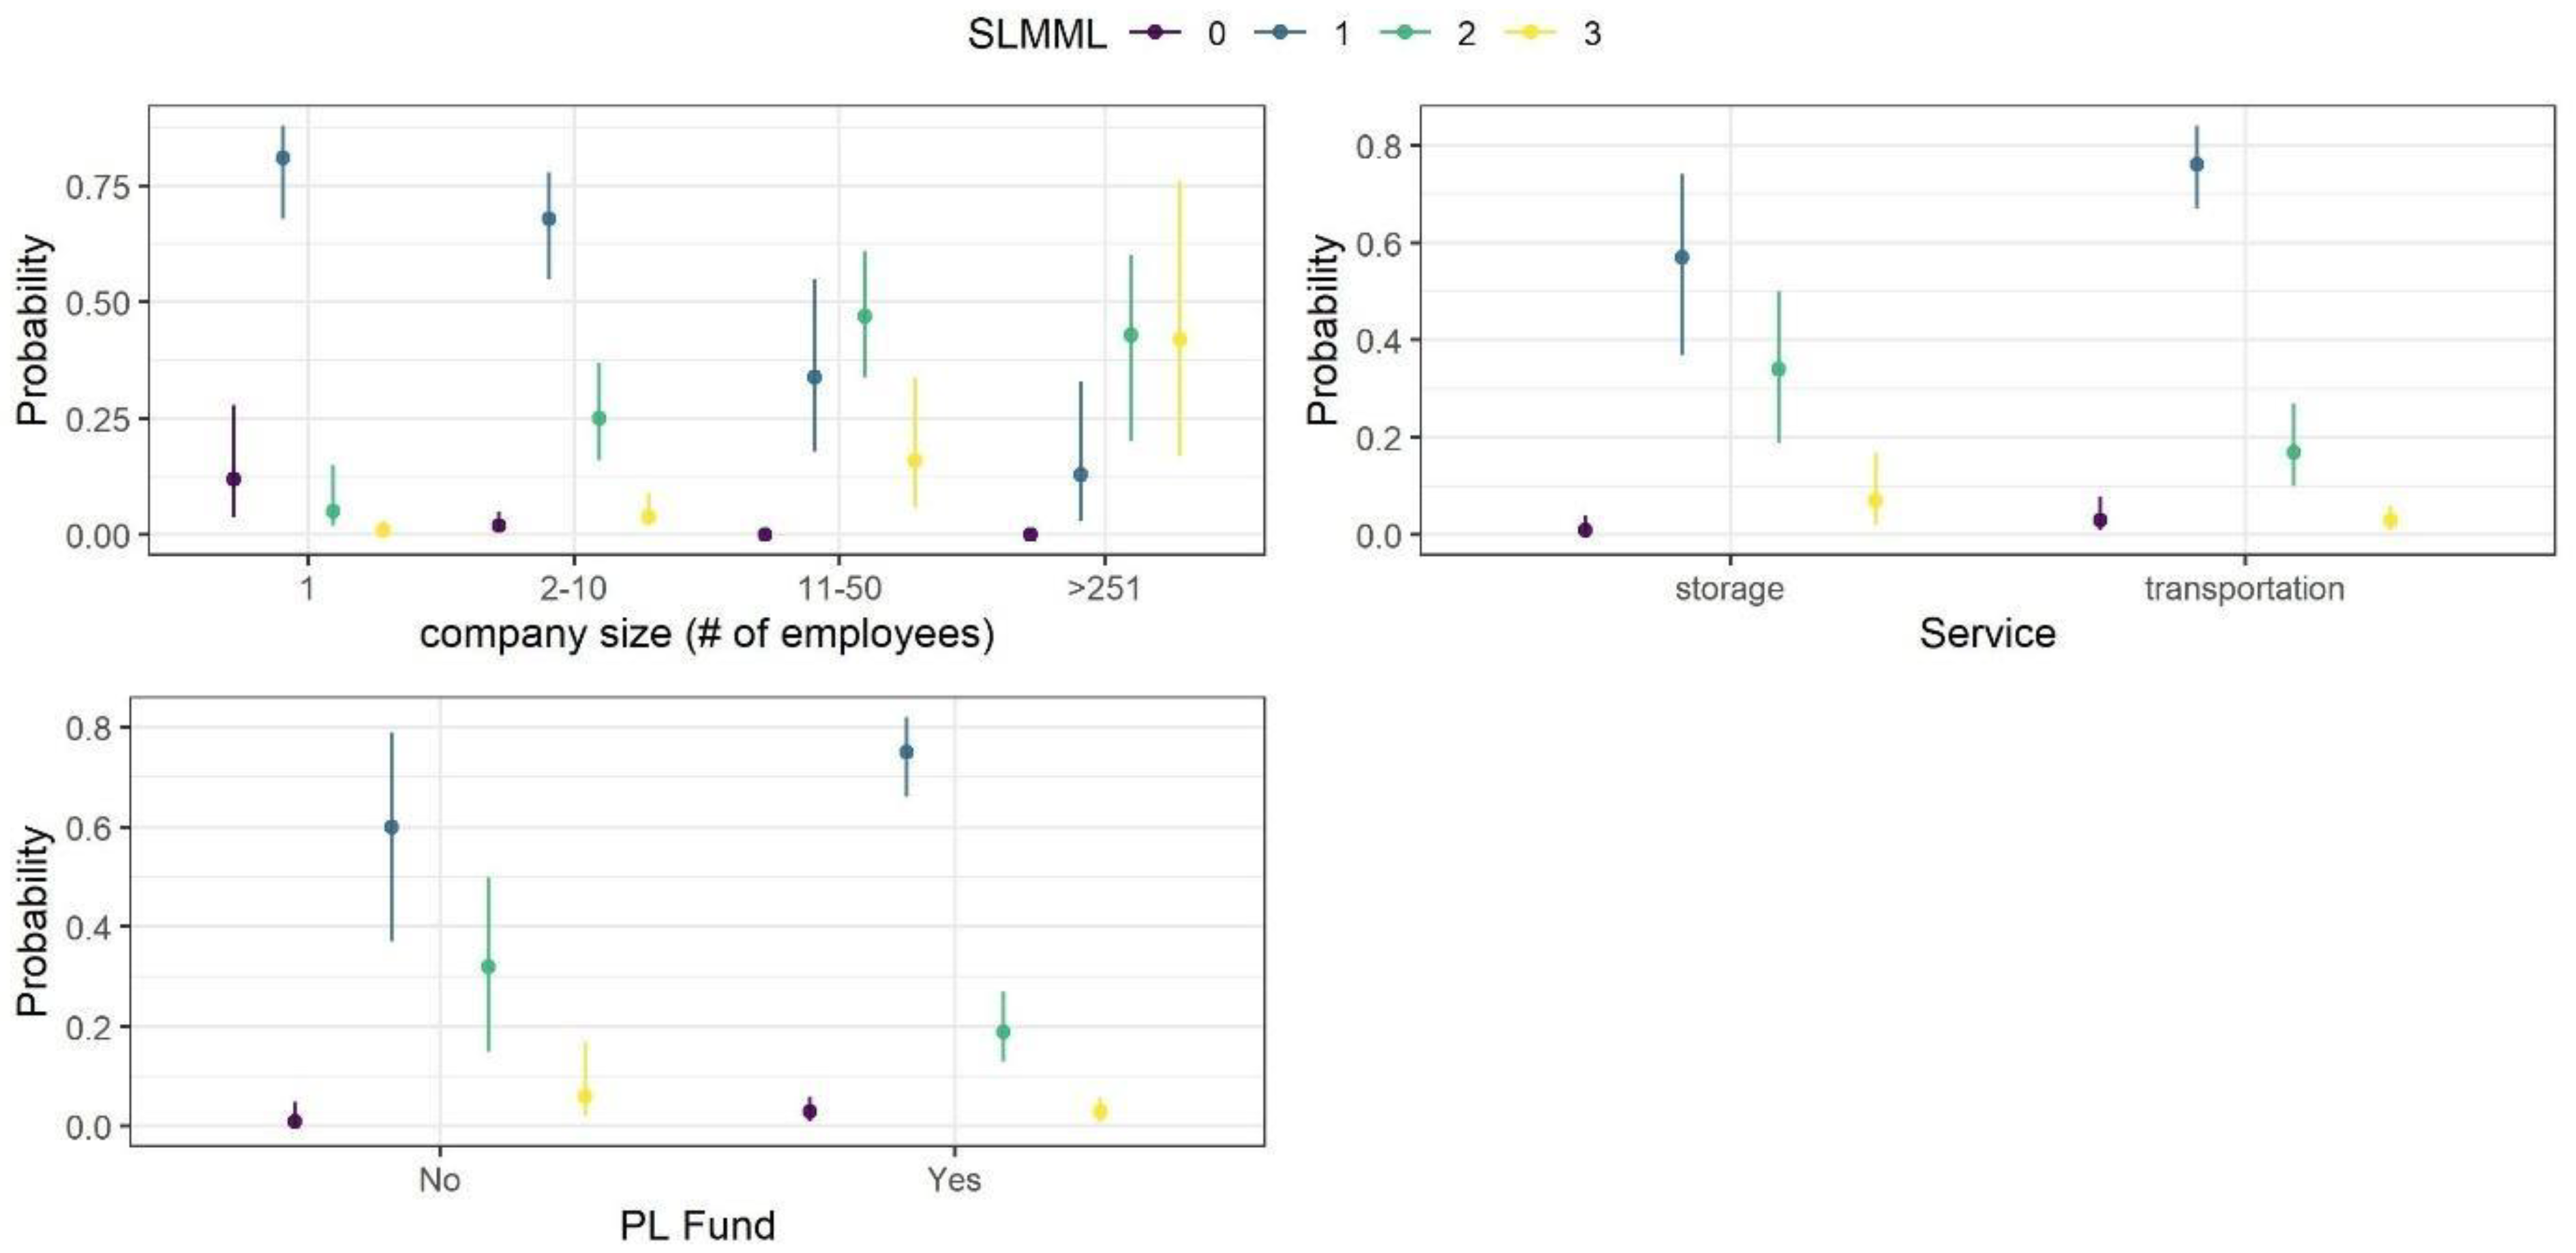
3.2. Modeling Results

To model the relationship between company size, service type, source of capital (fund source), and SLMML Bayesian ordinal regression with probabilities of each category was computed with the cumulative model [52]. Service type and the source of capital were coded with orthogonal sum-to-zero contrasts and company size was modeled as an ordered factor with monotonic effect [53].
In Bayesian statistics, the inference was based on analyzing the posterior probability distributions of model parameters (e.g., regression weights), obtained by integrating likelihood (data) with prior probability distributions. Point estimates of the effective means of the posterior distributions were presented. Regression weight should be statistically credible when 95% credibility intervals (CI) of the posterior distribution exclude zero [54]. Default improper flat priors were used for the regression weights. Point estimates of the effective means of the posterior distributions were presented. In order to achieve the approximated posterior distributions of the models, a Markov Chain Monte Carlo (MCMC) sampling procedure was conducted using the brms package [55]. Four parallel chains were used, each consisting of 8000 samples, with 4000 samples used as the warmup period and every 10th sample recorded, resulting in 2400 recorded samples in total. The sampling procedure was efficient and resulted in well-mixed and not autocorrelated chains and unimodal posteriors. Model accuracy was assessed with posterior predictive checks. Model predictions are summarized graphically in Figure 7. Please note that the probabilities indicated in Figure 7 sum to one within levels of each predictor. Vertical lines were 95% credibility intervals. Intercepts were estimated distances between consecutive levels of the SLMML on a standard normal scale.

4. Discussion

In this research, we defined three research hypotheses that corresponded to the research questions QP2–QP4. The results from the Bayesian ordinal regression allowed us to verify their credibility (see Table 4). The estimate and SE were the posterior mean and standard error of the mean. LI was the lower boundary and UI was the upper boundary of the 95% credibility interval. Bolded rows indicated statistically credible regression weights.
The credibility tests have shown that the company size was related to SLMML (Table 4). The predicted proportions of the SLMML changed with company size. The proportions of lower SMML were decreasing, as the company size was increasing. The proportions of higher SLMML were increasing as the company size was increasing.
The credibility tests have shown that a company’s business profile was credibly related to SLMML (Table 4). The term “business profile” refers to the dominant type of professional activities that a company engaged in. Among the companies that provided storage services, the predicted SLMML1 (level 1 = the lowest) was slightly higher than the proportion among the companies with transportation services, while the proportions of SLMML2 and SLMML3 were higher.
We observed that the source of capital was not credibly related to the SLMML (see Table 4). Although the SLMML predicted ratios seemed to be different between companies with and without Polish capital, the credibility interval of the regression weights suggests that this was not the case. This was mostly due to the small share of companies without Polish capital in the analyzed population. This was also reflected by the wider 95% credibility interval (Table 4).
We have proposed a new overall sustainable logistics management maturity indicator (OSLMI), which allowed us to test the research hypotheses. Due to the relatively small population sample and the difficulties in obtaining a representative sample (proportional distribution of companies in the sample) for traditional statistics analyses, we implemented Bayesian statistics. Bayesian statistics provided an alternative way to test the relationship between the sustainable logistics management maturity level, and the characteristics of companies (different company size, business profile, and source of capital) with the credibility tests. The credibility tests have confirmed the existence of a connection between the SLMML and the company size and the scope of economic activities (business profile).
The proposed assessment framework enabled classification and comparison between logistics providers with different characteristics (different company size, business profile, and source of capital) in regard to their sustainable logistics management maturity (SLMM).
This study has a managerial implication. The proposed framework supports managers in the logistics sector in their business transformation pathway. Maturity models provide an evolutionary approach from a current state “as-is” of organization capabilities to the future state “to-be”. SMEs have limited resources, and, thus, they need guidance on how to engage in the implementation of logistics solutions, when improving profit-related performance can also allow for the positive environmental and social impact. The framework facilitates benchmarking with other companies in the logistics sector.

5. Conclusions

In our research, we analyzed the typical logistics solutions through the prism of the triple bottom line (TBL) framework.
The originality of this paper results from the following:
  • Identification of the impact strength of implementation of typical logistics solutions (tool/practice) in relation to three dimensions of sustainability (by focus group method);
  • Proposing a framework for comparison of companies in the logistics sector with regard to their ability to achieve a certain level of the application of logistics solutions that are relevant to a sustainable approach in logistics management (referred to as the sustainable logistics management maturity level-SLMML);
We contribute to the existing literature with a new approach to the assessment of capabilities of logistics service providers (through applied logistics solutions) and linking it to sustainability. We tested, through research hypotheses, if the characteristics of a company (size, business profile, and source of capital) enable more mature sustainable performance. A substantial representation of micro- and small-sized enterprises is included in our, as they constitute 96% of our surveyed population. The current literature on sustainable performance in the logistics sector focuses on the corporate sustainability of large companies. Studies on the sustainable performance of SMEs are very limited, so we contribute to filling this gap.
The main benefit of the presented SLMM assessment framework is its flexibility. The catalog of relevant logistics solutions (LTs) may be expanded or reduced. For example, additional new LTs can be added, when some new technologies enter the logistics sector. However, each time their impact on each of the dimensions of sustainability should be assessed by experts.
The main limitation of this study is that the set of relevant logistics solutions and the strength of their impact (LTs) might be biased by the experts’ selection. Further research will include an updated and extended catalog of the LTs through broader participation of practitioners from the logistics sector.

Author Contributions

Conceptualization, K.W.-L. and P.G.-D.; methodology, K.W.-L.; software, K.W.-L. and P.G.-D.; validation, K.W.-L. and P.G.-D.; formal analysis, K.W.-L. and P.G.-D.; investigation, K.W.-L. and P.G.-D.; resources, K.W.-L.; data curation, K.W.-L.; writing—original draft preparation, K.W.-L. and P.G.-D.; writing—review and editing, P.G.-D.; visualization, K.W.-L.; supervision, K.W.-L. and P.G.-D.; project administration, K.W.-L.; funding acquisition, K.W.-L. All authors have read and agreed to the published version of the manuscript.

Funding

This research was funded by THE NATIONAL SCIENCE CENTRE, POLAND, grant number 2016/21/D/HS4/02116 and The APC was funded by the grant of the Poznan University of Technology no. 11/0812/SBAD/4187.

Institutional Review Board Statement

Not applicable.

Informed Consent Statement

Not applicable.

Data Availability Statement

The data presented in this study are available on request from the corresponding author after prior approval from the participating companies.

Conflicts of Interest

The authors declare no conflict of interest. The funders had no role in the design of the study; in the collection, analyses, or interpretation of data; in the writing of the manuscript, or in the decision to publish the results.

References

  1. Marchet, G.; Melacini, M.; Perotti, S. Environmental sustainability in logistics and freight transportation: A literature review and research agenda. J. Manuf. Technol. Manag. 2014, 25, 775–811. [Google Scholar] [CrossRef]
  2. Santiteerakul, S.; Sekhari, A.; Bouras, A.; Sopadang, A. Sustainability performance measurement framework for supply chain management. Int. J. Prod. Dev. 2015, 20, 221–238. [Google Scholar] [CrossRef]
  3. Björklund, M.; Forslund, H. Challenges addressed by swedish third-party logistics providers conducting sustainable logistics business cases. Sustainability 2019, 11, 2654. [Google Scholar] [CrossRef] [Green Version]
  4. Bals, L.; Tate, W. Sustainable supply chain design in social businesses: Advancing the theory of supply chain. J. Bus. Logist. 2018, 39, 57–79. [Google Scholar] [CrossRef] [Green Version]
  5. Bask, A.; Rajahonka, M.; Laari, S.; Solakivi, T.; Töyli, J.; Ojala, L. Environmental sustainability in shipper-LSP relationships. J. Clean. Prod. 2018, 172, 2986–2998. [Google Scholar] [CrossRef]
  6. Bandeira, R.A.M.; D’Agosto, M.A.; Ribeiro, S.K.; Bandeira, A.P.F.; Goes, G.V. A fuzzy multi-criteria model for evaluating sustainable urban freight transportation operations. J. Clean. Prod. 2018, 184, 727–739. [Google Scholar] [CrossRef]
  7. Stindt, D. A generic planning approach for sustainable supply chain management—How to integrate concepts and methods to address the issues of sustainability? J. Clean. Prod. 2017, 153, 146–163. [Google Scholar] [CrossRef]
  8. Chowdhury, P.; Paul, S.K.; Kaisar, S.; Moktadir, M.A. COVID-19 pandemic related supply chain studies: A systematic review. Transp. Res. Part E 2021, 148, 102271. [Google Scholar] [CrossRef] [PubMed]
  9. Martins, V.W.; Anholon, R.; Quelhas, O.L.; Leal Filho, W. Sustainable practices in logistics systems: An overview of companies in Brazil. Sustainability 2019, 11, 4140. [Google Scholar] [CrossRef] [Green Version]
  10. Hong, J.; Alzaman, C.; Diabat, A.; Bulgak, A. Sustainability dimensions and PM2.5 in supply chain logistics. Ann. Oper. Res. 2019, 275, 339–366. [Google Scholar] [CrossRef]
  11. Chowdhury, P.; Paul, S.K. Applications of MCDM methods in research on corporate sustainability: A systematic literature review. Manag. Environ. Qual. 2020, 31, 385–405. [Google Scholar] [CrossRef]
  12. Lozano, R.; Carpenter, A.; Huisingh, D. A review of ‘theories of the firm’ and their contributions to corporate sustainability. J. Clean. Prod. 2015, 106, 430–442. [Google Scholar] [CrossRef]
  13. Road Freight Transport Statistics. Available online: https://ec.europa.eu/eurostat/statistics-explained/index.php/Road_freight_transport_statistics#EU_road_freight_transport_continues_to_grow (accessed on 15 April 2021).
  14. Annual Detailed Enterprise Statistics for Services (NACE Rev. 2 H-N and S95). Available online: https://ec.europa.eu/eurostat/databrowser/view/sbs_na_1a_se_r2/default/table?lang=en (accessed on 9 March 2021).
  15. Główny Urząd Statystyczny (GUS). Rachunki Kwartalne PKB 2014–2018; Główny Urząd Statystyczny: Warszawa, Poland. Available online: http://stat.gov.pl (accessed on 10 March 2021).
  16. Huemer, L. Unchained from the chain: Supply management from a logistics service provider perspective. J. Bus. Res. 2012, 65, 258–264. [Google Scholar] [CrossRef] [Green Version]
  17. Abbasi, M.; Nilsson, F. Developing environmentally sustainable logistics: Exploring themes and challenges from a logistics service providers’ perspective. Transp. Res. Part D 2016, 46, 273–283. [Google Scholar] [CrossRef]
  18. Werner-Lewandowska, K.; Kosacka-Olejnik, M. Logistics maturity model for service company—Theoretical background. Procedia Manuf. 2018, 17, 791–802. [Google Scholar] [CrossRef]
  19. Centobelli, P.; Cerchione, R.; Esposito, E. Environmental sustainability in the service industry of transportation and logistics service providers: Systematic literature review and research directions. Transp. Res. Part D 2017, 53, 454–470. [Google Scholar] [CrossRef]
  20. Evangelista, P. Environmental sustainability practices in the transport and logistics service industry: An exploratory case study investigation. Res. Transp. Bus. Manag. 2014, 12, 63–72. [Google Scholar] [CrossRef]
  21. Evangelista, P.; Colicchia, C.; Creazza, A. Is environmental sustainability a strategic priority for logistics service providers? J. Environ. Manag. 2017, 198, 353–362. [Google Scholar] [CrossRef] [PubMed]
  22. Werner-Lewandowska, K.; Kosacka-Olejnik, M. Logistics 4.0 maturity in service industry: Empirical research results. Procedia Manuf. 2019, 38, 1058–1065. [Google Scholar] [CrossRef]
  23. Werner-Lewandowska, K.; Kosacka-Olejnik, M. Logistics maturity model for engineering management–method proposal. Manag. Syst. Prod. Eng. 2019, 27, 33–39. [Google Scholar] [CrossRef]
  24. Werner-Lewandowska, K.; Kosacka-Olejnik, M. How to improve logistics maturity?—A roadmap proposal for the service industry. Procedia Manuf. 2020, 51, 1650–1656. [Google Scholar] [CrossRef]
  25. Werner-Lewandowska, K. Logistics maturity of the polish service sector—Research results. LogForum 2020, 16, 7. [Google Scholar] [CrossRef]
  26. Kosacka-Olejnik, M. Logistics maturity model in the service industry: State of art and research implications. LogForum 2020, 16, 7. [Google Scholar] [CrossRef]
  27. Schrettle, S.; Hinz, A.; Scherrer-Rathje, M.; Friedli, T. Turning sustainability into action: Explaining firms’ sustainability efforts and their impact on firm performance. Int. J. Prod. Econ. 2014, 147, 73–84. [Google Scholar] [CrossRef]
  28. Pfohl, H.-C.; Buse, H.P. Inter-organizational logistics systems in flexible production networks. Int. J. Phys. Distrib. Logist. Manag. 2000, 30, 388–408. [Google Scholar] [CrossRef]
  29. Golinska, P.; Kosacka, M.; Mierzwiak, R.; Werner-Lewandowska, K. Grey Decision Making as a Tool for the Classification of the Sustainability Level of Remanufacturing Companies. J. Clean. Prod. 2015, 105, 28–40. [Google Scholar] [CrossRef]
  30. Kokocińska, M.; Nowak, M.; Łopatka, P. Measuring the Efficiency of Economic Growth towards Sustainable Growth with Grey System Theory. Sustainability 2020, 12, 10121. [Google Scholar] [CrossRef]
  31. Geissdoerfer, M.; Morioka, S.N.; de Carvalho, M.M.; Evans, S. Business models and supply chains for the circular economy. J. Clean. Prod. 2018, 190, 712–721. [Google Scholar] [CrossRef]
  32. Genovese, A.; Acquaye, A.A.; Figueroa, A.; Koh, S.L. Sustainable supply chain management and the transition towards a circular economy: Evidence and some applications. Omega 2017, 66, 344–357. [Google Scholar] [CrossRef]
  33. Gruchmann, T.; Melkonyan, A.; Krumme, K. Logistics business transformation for sustainability: Assessing the role of the lead sustainability service provider (6PL). Logistics 2018, 2, 25. [Google Scholar] [CrossRef] [Green Version]
  34. Correia, E.; Carvalho, H.; Azevedo, S.G.; Govindan, K. Maturity Models in Supply Chain Sustainability: A Systematic Literature Review. Sustainability 2017, 9, 64. [Google Scholar] [CrossRef] [Green Version]
  35. Machado, C.G.; de Lima, E.P.; da Costa, S.E.G.; Angelis, J.J.; Mattioda, R.A. Framing maturity based on sustainable operations management principles. Int. J. Prod. Econ. 2017, 190, 3–21. [Google Scholar] [CrossRef]
  36. Bititci, U.S.; Garengo, P.; Ates, A.; Nudurupati, S.S. Value of Maturity Models in Performance Measurement. Int. J. Prod. Res. 2015, 53, 3062–3085. [Google Scholar] [CrossRef] [Green Version]
  37. Pullen, W. A Public Sector HPT Maturity Model. Perform. Perform. Improv. 2007, 46, 9–15. [Google Scholar] [CrossRef]
  38. Benmoussa, R.; Abdelkabir, C.; Abd, A.; Hassou, M. Capability/maturity based model for logistics processes assessment: Application to distribution processes. Int. J. Product. Perform. Manag. 2015, 64, 28–51. [Google Scholar] [CrossRef]
  39. Reefke, H.; Ahmed, M.D.; Sundaram, D. Sustainable supply chain management—Decision making and support: The SSCM maturity model and system. Glob. Bus. Rev. 2014, 15, 1S–12S. [Google Scholar] [CrossRef] [Green Version]
  40. Röglinger, M.; Pöppelbuß, J.; Becker, J. Maturity Models in Business Process Management. Bus. Process Manag. J. 2012, 18, 328–346. [Google Scholar] [CrossRef]
  41. Ainsbury, R.; Grayson, D. Business Critical: Understanding a Company’s Current and Desired Stages of Corporate Responsibility Maturity. 2014. Available online: https://dspace.lib.cranfield.ac.uk/bitstream/handle/1826/8497/SOMAT%201505%202014%20final.pdf?sequence=1 (accessed on 10 March 2021).
  42. Pigosso, D.C.; Rozenfeld, H.; McAloone, T.C. Ecodesign maturity model: A management framework to support ecodesign implementation into manufacturing companies. J. Clean. Prod. 2013, 59, 160–173. [Google Scholar] [CrossRef] [Green Version]
  43. Battista, C.; Fumi, A.; Schiraldi, M. The logistic maturity model: Guidelines for logistic processes continuous improvement. In Proceedings of the POMS 23rd Annual Conference, Chicago, IL, USA, 27–30 April 2012. [Google Scholar]
  44. Battista, C.; Schiraldi, M.M. The logistic maturity model: Application to a fashion company. Int. J. Eng. Bus. Manag. 2013, 5, 5–29. [Google Scholar] [CrossRef] [Green Version]
  45. Sanchez, R.; Heene, A.; Thomas, H. Introduction: Towards the Theory and Practice of Competence-Based Competition. In Dynamics of Competence-Based Competition; Sanchez, R., Heene, A., Thomas, H., Eds.; Pergamon: Oxford, UK, 1996; pp. 1–35. [Google Scholar]
  46. Pfohl, H.C. Logistikmanagement; Springer: Berlin, Germany, 2004; Volume 1. [Google Scholar]
  47. Drucker, P. The Effective Executive; Routledge: London, UK, 2018. [Google Scholar]
  48. The Warehousing. Available online: https://info.cushmanwakefield.com/l/263412/2020-08-07/2t7zf3] (accessed on 10 March 2021).
  49. Yield Rates on Warehouse Investments in Poland Are Higher than in Other European Countries. Available online: https://www.axiimmo.com/wp-content/uploads/2020/08/axi-immo-raport-polski-rynek-magazynowy-1-polowa-2020-r.pdf (accessed on 10 March 2021).
  50. Available online: https://www.statista.com/statistics/920233/prime-yields-of-warehouses-over-five-thousand-square-meter-in-europe-by-city/ (accessed on 10 March 2021).
  51. R Core Team. R: A Language and Environment for Statistical Computing; R Foundation for Statistical Computing: Vienna, Austria, 2021; Available online: https://www.R-project.org/ (accessed on 10 March 2021).
  52. Bürkner, P.C.; Vuorre, M. Ordinal regression models in psychology: A tutorial. Adv. Methods Pract. Psychol. Sci. 2019, 2, 77–101. [Google Scholar] [CrossRef] [Green Version]
  53. Bürkner, P.C.; Charpentier, E. Modelling monotonic effects of ordinal predictors in Bayesian regression models. Br. J. Math. Stat. Psychol. 2020, 73, 420–451. [Google Scholar] [CrossRef] [PubMed]
  54. Kruschke, J. Doing Bayesian Data Analysis: A tutorial with R, JAGS, and Stan; Academic Press: Cambridge, MA, USA, 2014. [Google Scholar]
  55. Bürkner, P. Brms: An R Package for Bayesian Multilevel Models Using Stan. J. Stat. Softw. 2017, 80, 1–28. [Google Scholar] [CrossRef] [Green Version]
Figure 1. Conceptual model.
Sustainability 13 05102 g001
Figure 2. SLMML classification—procedure.
Sustainability 13 05102 g002
Figure 3. Characteristics of the population, N = 190.
Sustainability 13 05102 g003
Figure 4. Logistics solutions (LTs) used by the logistics service providers, N = 190.
Sustainability 13 05102 g004
Figure 5. SLMML in the logistics service sector N = 190.
Sustainability 13 05102 g005
Figure 6. Descriptive plots.
Sustainability 13 05102 g006
Figure 7. Posterior means (points) of the predicted probabilities of the SLMML.
Sustainability 13 05102 g007
Table 1. Characteristics of the focus group.
CriterionEx1.Ex.2Ex.3Ex.4Ex5.Ex.6Ex.7Ex.8Ex.9
C1XX X X
C2XXX XXXX
C3 X X
C4 X X XXX
Table 2. The strength of impact of LTs on the dimensions of sustainable development-wix.
ID LTLogistics Tool–LTsEconomywixSocial
Environment
LT01Selecting warehouse storage equipment0.890.780.561.67
LT02Selecting warehouse material handling equipment (MHE)0.670.560.331.56
LT03Warehouse location1.001.000.782.78
LT04Warehouse space calculation0.890.560.221.67
LT055S or 5C, also known as Gemba Kanri0.780.440.892.11
LT06Resource planning (including MRPII)1.000.670.562.23
LT07Task interleaving0.890.560.562.01
LT08Using WMS0.890.560.672.12
LT09Warehouse maturity scan, by Jeroen van den Berg0.890.670.782.34
LT10Warehouse risk assessment0.670.331.002
LT11How to ‘green’ your warehouse and save energy and CSR0.671.000.892.56
LT12Calculating road freight transport charges and rates0.890.220.221.33
LT13TSM1.000.670.332
LT14Transport problems—matching customer demand with supplier capacity1.000.890.222.11
LT15Transport audit checklists1.000.670.562.23
LT16Calculating emissions in freight transport0.441.000.562
LT17Vendor assurance of transport logistics service providers1.000.670.562.23
LT18Replenishment order quantities 1.000.500.632.13
LT19Measuring demand variation 1.000.130.501.63
LT20Periodic review inventory management system 1.000.630.502.13
LT21Reorder point inventory management system 0.880.250.501.63
LT22Economic order quantity (EOQ)1.000.500.381.88
LT23Safety stock calculation 1.000.500.502
LT24Vendor-managed inventory (and co-managed inventory) 1.000.750.502.25
LT25Identification and disposal of surplus stock 1.000.880.632.51
LT26Demand forecasting1.000.500.632.13
LT27Supplier relationships0.880.500.632.01
LT28Calculating ordering cost0.880.000.251.13
LT29Calculating stockholding cost0.880.130.381.39
LT30Performance measures for freight transport1.000.750.502.25
LT31Warehouse KPIs0.880.750.882.51
LT32Balanced scorecard 0.880.750.882.51
LT33Activity-based costing (ABC) and time-driven activity-based costing (TDABC) 1.000.130.251.38
LT34Supply chain financial ratios and metrics 1.000.130.251.38
LT35Z-WAVE1.000.750.632.38
LT36Cloud1.000.750.382.13
Table 3. Maturity level—classification rules.
OSLMI Score Maturity Level
(0–1.56%) SLMML1
<1.56–12.50%) SLMML2
IF<12.50–42.19%)THENSLMML3
<42.19–100%) SLMML4
100% SLMML5
Table 4. Results of the Bayesian ordinal regression with the SLMML as a dependent variable.
EstimateSELIUI
Business profile0.530.20.140.91
Source of capital (PL Fund)0.390.28−0.150.91
Number of enterprises1.580.320.982.24
Publisher’s Note: MDPI stays neutral with regard to jurisdictional claims in published maps and institutional affiliations.

