Article

Bus Rapid Transit System Introduction in Johor Bahru: A Simulation-Based Assessment

by
Sitti Asmah Hassan
1,*,
Intan Nurfauzirah Shafiqah Hamzani
1,
Abd. Ramzi Sabli
1 and
Nur Sabahiah Abdul Sukor
2
1
School of Civil Engineering, Faculty of Engineering, Universiti Teknologi Malaysia, Skudai 81310, Malaysia
2
School of Civil Engineering, Universiti Sains Malaysia, Nibong Tebal 14300, Malaysia
*
Author to whom correspondence should be addressed.
Sustainability 2021, 13(8), 4437; https://doi.org/10.3390/su13084437
Submission received: 15 March 2021 / Revised: 5 April 2021 / Accepted: 13 April 2021 / Published: 15 April 2021
(This article belongs to the Collection Sustainable Urban Mobility Project)

Abstract

:
Bus rapid transit (BRT) is one of the strategies to promote improvements in urban mobility. In this study, BRT scenarios, which integrate exclusive bus lanes and bus priority signal control in mixed traffic scenarios, were modelled using a VISSIM microsimulation. Three scenarios of BRT were modelled to represent 16:84, 38:62 and 54:46 modal splits between public transport and private vehicles. It was found that Scenario 4 (the 54:46 scenario) offers better benefits in terms of delay time saving and economic benefits. In general, it was found that the BRT system enhances the functioning of the transport system and provides people with faster and better mobility facilities, resulting in attractive social and economic benefits, especially on a higher modal split of public transport. It is regarded as one strategy to alleviate traffic congestion and reduce dependency on private vehicles. The finding of this study provides an insight on the effective concept of the BRT system, which may promote the dissemination of an urban mobility solution in the city. The results can help policymakers and local authorities in the management of a transport network in order to ensure reliable and sustainable transport.

1. Introduction

The combination of the rapid growth of urban populations and economic wealth has resulted in an increase in demand for private vehicles, hence putting significant strain on transportation networks and infrastructures. People prefer to use private vehicles over public transport due to obvious reasons such as safety and security [1,2], punctuality and reliability [2,3,4,5], travel comfort and convenience [2,4,6,7], travel time and cost [6] and quality [8]. The increasing number of vehicles has inevitably led to the increased level of congestion especially during peak hour periods [9,10,11] and led to greater exposure to road accidents [12,13,14] and environmental problems [15,16]. While private vehicles including motorcycles have helped to improve the mobility needs in developing countries, there are valid reasons to worry about the rising trend of single occupancy vehicles such as the need for bigger and wider spaces. Road development, including widening roads or building new ones, often works for temporary relief only as the number of vehicles on the road grows at a faster rate than the expansion of the road network. Hence, the enhancement of public transport services is particularly important and could provide a practical solution to alleviate urban mobility issues.
Bus rapid transit (BRT) is adopted as one of the key strategies in relieving traffic problems in major cities [17,18,19,20,21,22,23,24]. BRT is a leading mode of public transit due to its high capacity and minimum operating costs compared to other types of public transportation [11,19]. It provides better service quality in terms of frequency of service, reliability and travel speed, increased ridership [22,25,26] and accessibility [27] and improved urban livelihoods [28]. Due to this, BRT could attract private vehicle users to change their mode of transport [29]. The improvement of environmental conditions such as noise reduction, better air quality and energy consumption was also a positive impact of the BRT system [30]. The development of BRT resulted in an increase of urban density, population density and economic impact, which, in turn, brings potential land-use transformation to the surrounding area [31,32,33,34].
The integration of an intelligent transportation system (ITS) and exclusive bus lanes with a priority control system has substantially improved the overall operation of BRT [35,36,37,38]. Chen et al. [39] evaluated signal priority for BRT under heterogenous traffic conditions using a VISSIM microscopic simulation, and it was found that the BRT system improves the delay time for BRT vehicles with little negative impact on the overall system. Ye and Xu [40] found that the proposed transit signal priority for BRT at a signalised junction improves the delay of all vehicles. Zhou et al. [37] proposed an active signal priority control method for BRT vehicles that runs on median-road exclusive BRT lanes at a single junction. In this study, eight signal priority controls for eight BRT arrival modes were tested in VISSIM modelling, and it was found that there was a reduction in the average passenger delay by 13.43–25.27% and an improvement in the travel speed of BRT vehicles by 7.10–7.55%. Islam et al. [41] introduced a numerical framework of a transit signal priority system for BRT, namely the Bus Priority System Optimal Dynamic Traffic Assignment with Signal Control, which considers dedicated bus lanes, bus routes, and priority for public bus transport in mixed bus–car scenarios. It was found that the developed framework reduced total system-wide passenger travel time and minimised the total intersection delay of the buses. Yue et al. [42] proposed that shared threshold constraints such as road section operation efficiency, station queuing probability and runtime can be used as guidance in a strategy for sharing BRT exclusive lanes with conventional buses, with the departure volume of conventional buses used as the shared threshold control index. Generally, the strategy of sharing BRT exclusive lanes with conventional buses improves the overall operational efficiency of an urban public transportation system. In most cases, the need to address urban mobility issues has been the initial intention for the implementation of BRT.
Though BRT implementation has been widely known to produce better performance for its users in a well-designed city plan, the effects of BRT implementation on mixed traffic in developing countries is unknown and needs to be addressed. There are some unique characteristics that become constraint factors to the implementation of such a system in developing countries, especially Malaysia, such as insufficient demand for the BRT system due to the user’s acceptance of public transport and the difficulty in obtaining system integration. The BRT system requires good system designs that integrate signal control priority and an exclusive lane at a junction. It is challenging to provide such a system as most roads are critically congested, especially during peak hours. Rapid motorisation is seen as a result of rapid economic development in Malaysia. Due to the increasing development of the city, providing efficient urban public bus transportation has become a challenge [43]. It was reported by the Malaysian Institute of Road Safety Research [44] that the number of registered vehicles in Malaysia had increased from 8 million in 1997 to more than 27 million in 2016, representing an increase of more than 300% in 19 years, whereas the population has only had an increase of 146% in the last 19 years.
In an attempt to improve urban mobility, specific strategies need to be developed and evaluated prior to their implementation. The efficiency of the BRT system is evaluated through a case study of a selected junction in Johor. This study attempts to investigate the conceptual framework of the BRT system and its impact on the road network in Johor. It considers the role of signal priority and an exclusive lane at a junction in influencing the operational efficiency and cost associated with BRT. In this paper, BRT strategies such as changes in modal split between private vehicles and public transport (BRT) are developed and tested in a VISSIM microsimulation model. While traffic simulation models will never be able to completely capture reality, they are possibly the best way to test possible strategies for traffic management before they are implemented. The findings of this study provide insights into future practices of BRT in Malaysia.
Following this introduction, Section 2 describes the methodology. The results and discussion are presented in Section 3. Finally, conclusions are presented in Section 4.

2. Materials and Methods

2.1. Site Description

Johor state is located at the southern part of Peninsular Malaysia and had a total population of 3.76 million in 2019 (about 9% of the 32.7 million total population of Malaysia) [45]. The traffic volume in Johor for 2019 was 2.1 million [46]. Johor Bahru district is the capital city of Johor and contributes 1.6 million of the population with a 1.3% annual population growth rate.
The study stretch is located about 250 m from the residential areas of Taman Impian Emas. It is centrally located in Johor Bahru district. Taman Impian Emas covers an area of 2953 acres located about 13 km north-west of Johor Bahru city centre, with more than 4000 units of homes and the number is still growing. Other than private vehicles, the area is accessible by a limited number of buses. The study stretch at Jalan Bukit Impian is located in Corridor 9, which is one of the proposed BRT corridors as indicated in the Johor Public Transport Masterplan (2015–2045) [47]. Corridor 9 with a length of 31.2 km is proposed to connect Kangkar Pulai and Kempas–Bukit Indah as shown in Figure 1.
Jalan Bukit Impian carries a high traffic volume during peak hours because the road connects the city business district and educational institutes to residential areas. Figure 2 shows the close-up area of Jalan Bukit Impian.

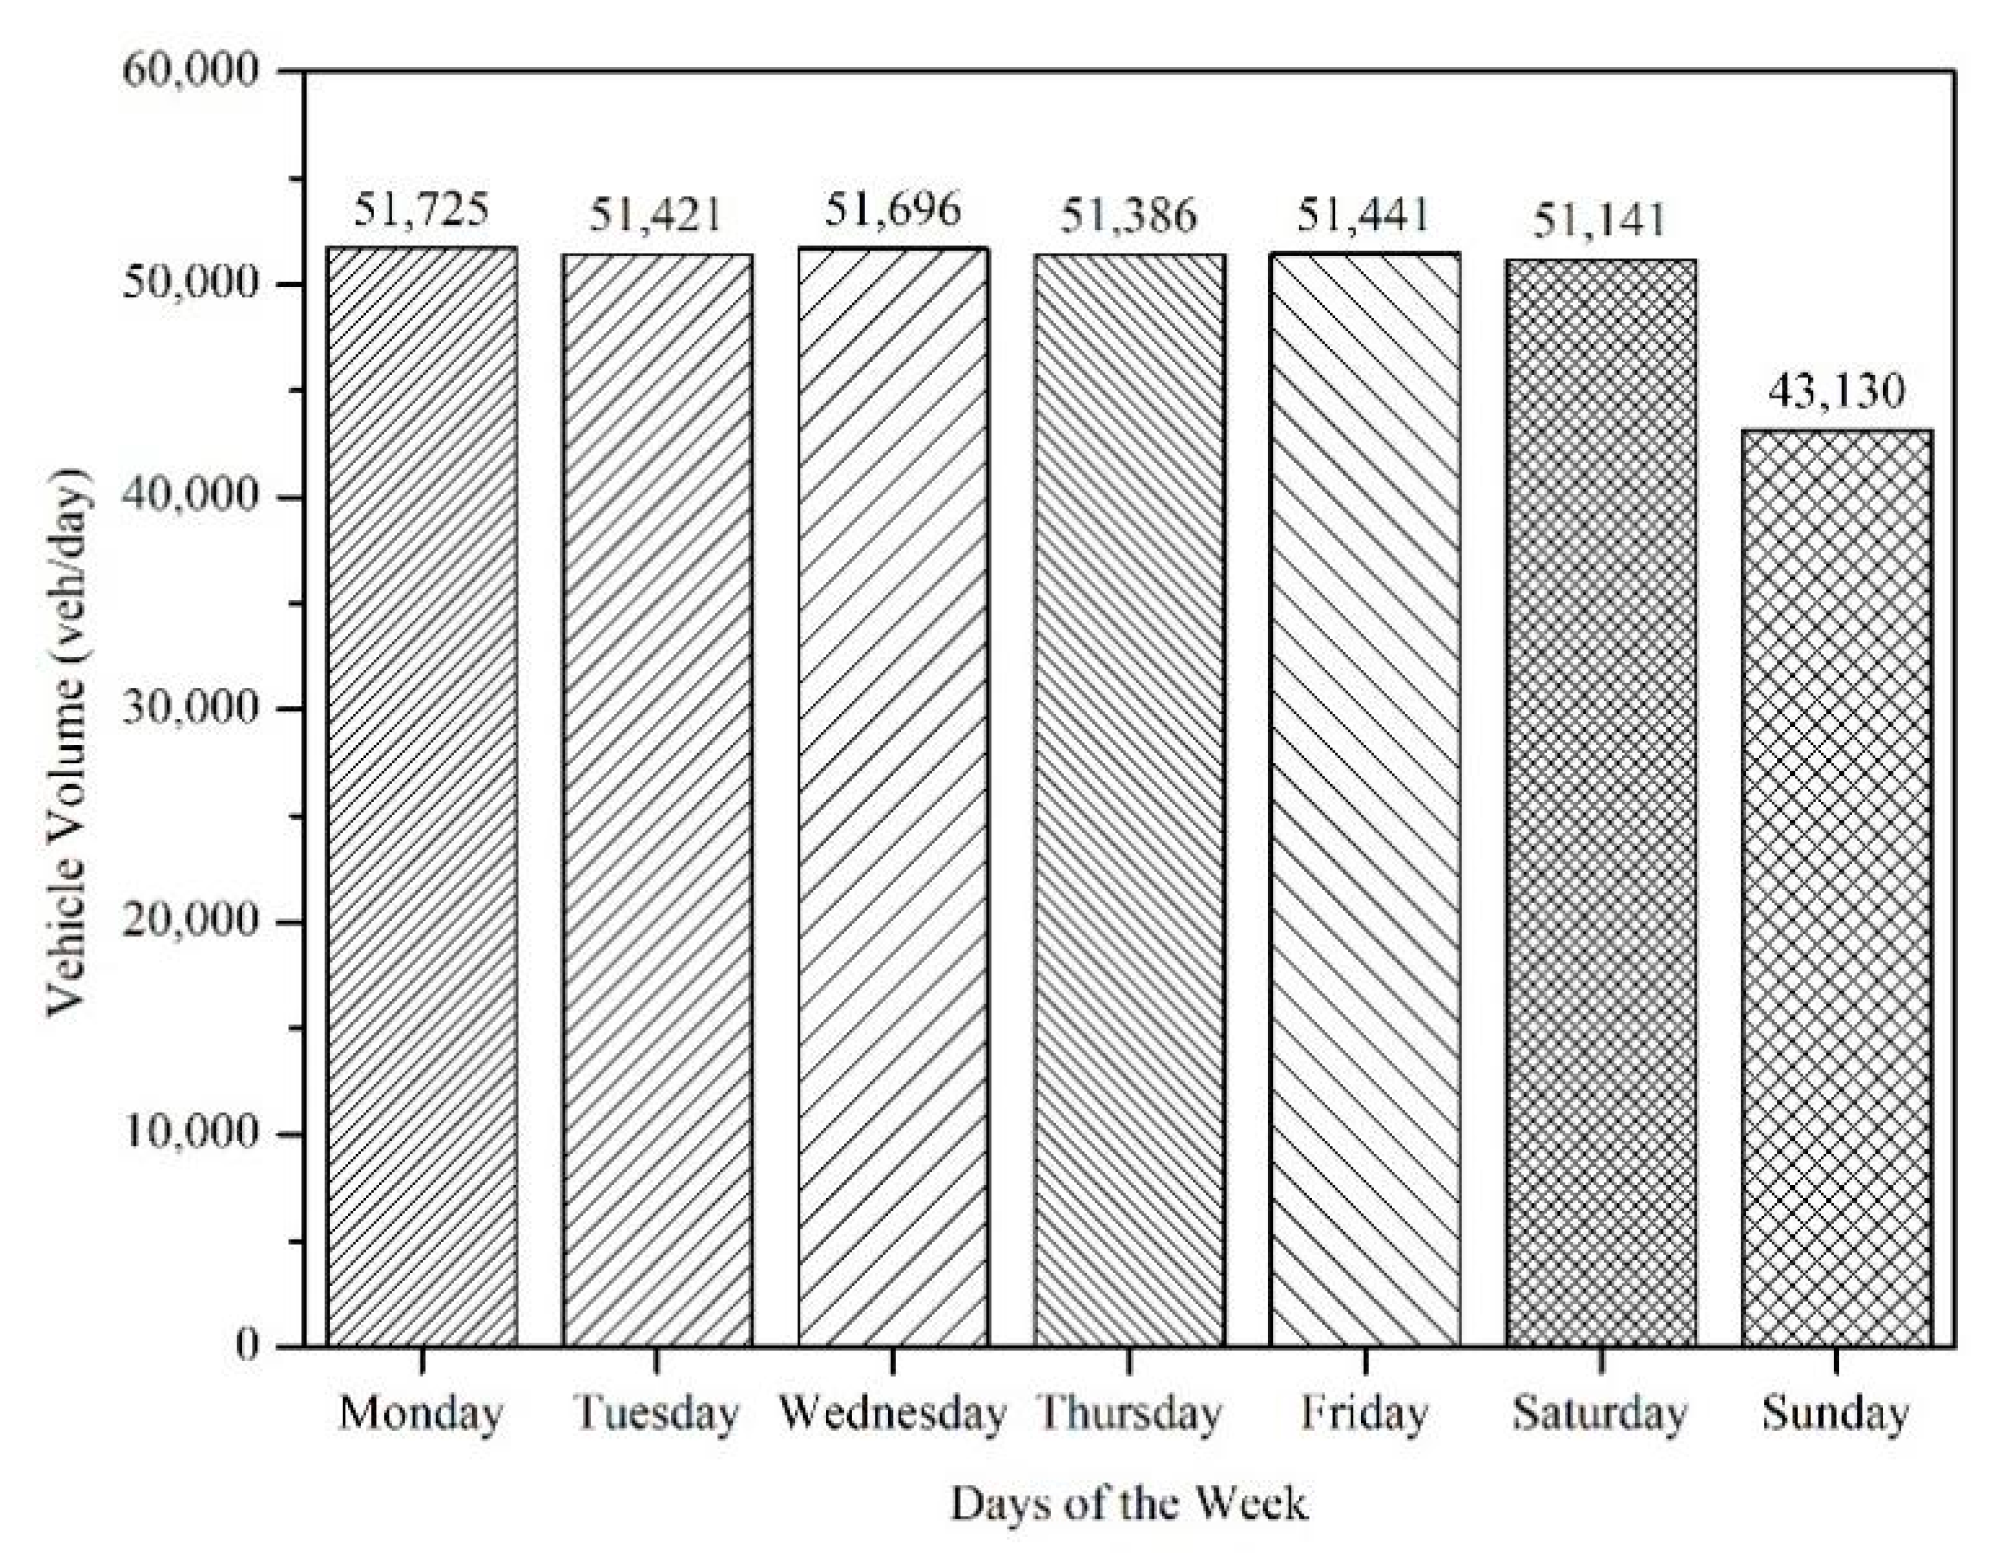
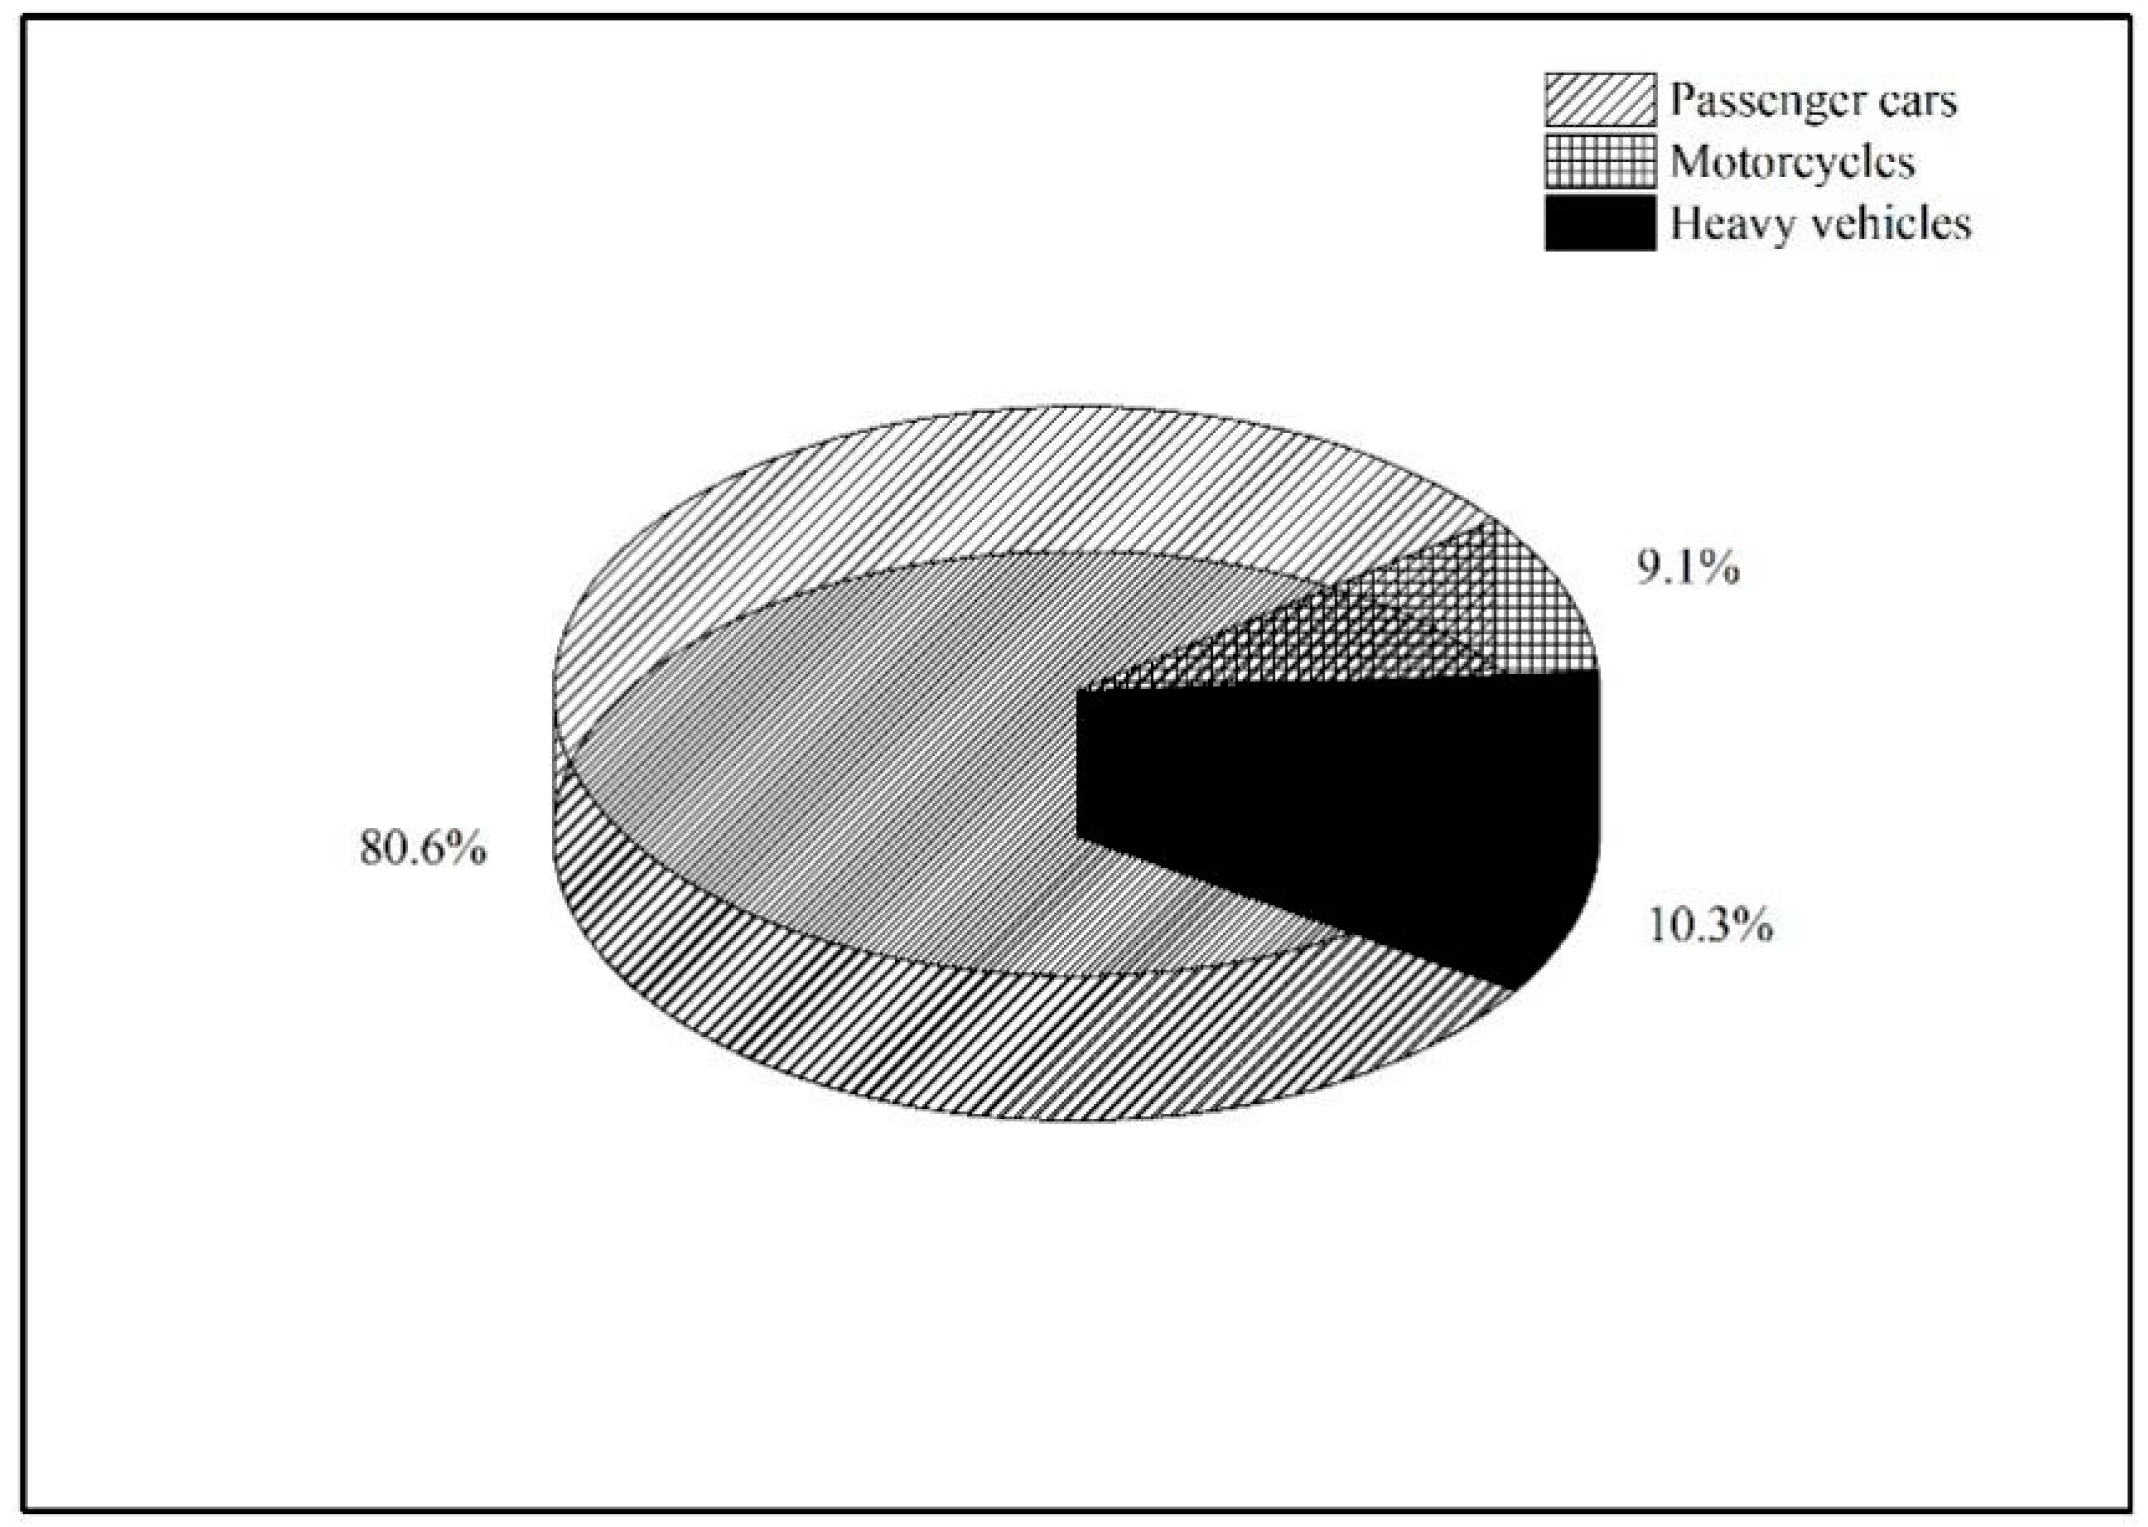
2.2. Data Collection

Automatic traffic counters (ATCs) were installed for one week on all junction approaches to obtain traffic volume and speed data. Figure 3 and Figure 4 show the daily traffic volume and peak hour traffic volume at the junction for one week. On average, 50,209 vehicles per day travelled on the junction at Jalan Bukit Impian.
The detailed traffic characteristic of the highest peak hour volume is shown in Table 1.
The traffic composition of the road section consisted of 80.6% passenger cars, 9.1% motorcycles and the rest of the traffic were heavy vehicles, as shown in Figure 5.
Figure 6 shows the desired speed distribution for motorcycles, passenger cars and heavy vehicles.
The junction operates under a fully vehicle-actuated signal control and all the approaches have an equal priority. The signal timing data of the site, as indicated in Table 2, were adopted in the modelling strategies. The Visual Vehicle-Actuated Program (VisVAP), a built-in program in VISSIM, was used in coding the signal timing of the junction.

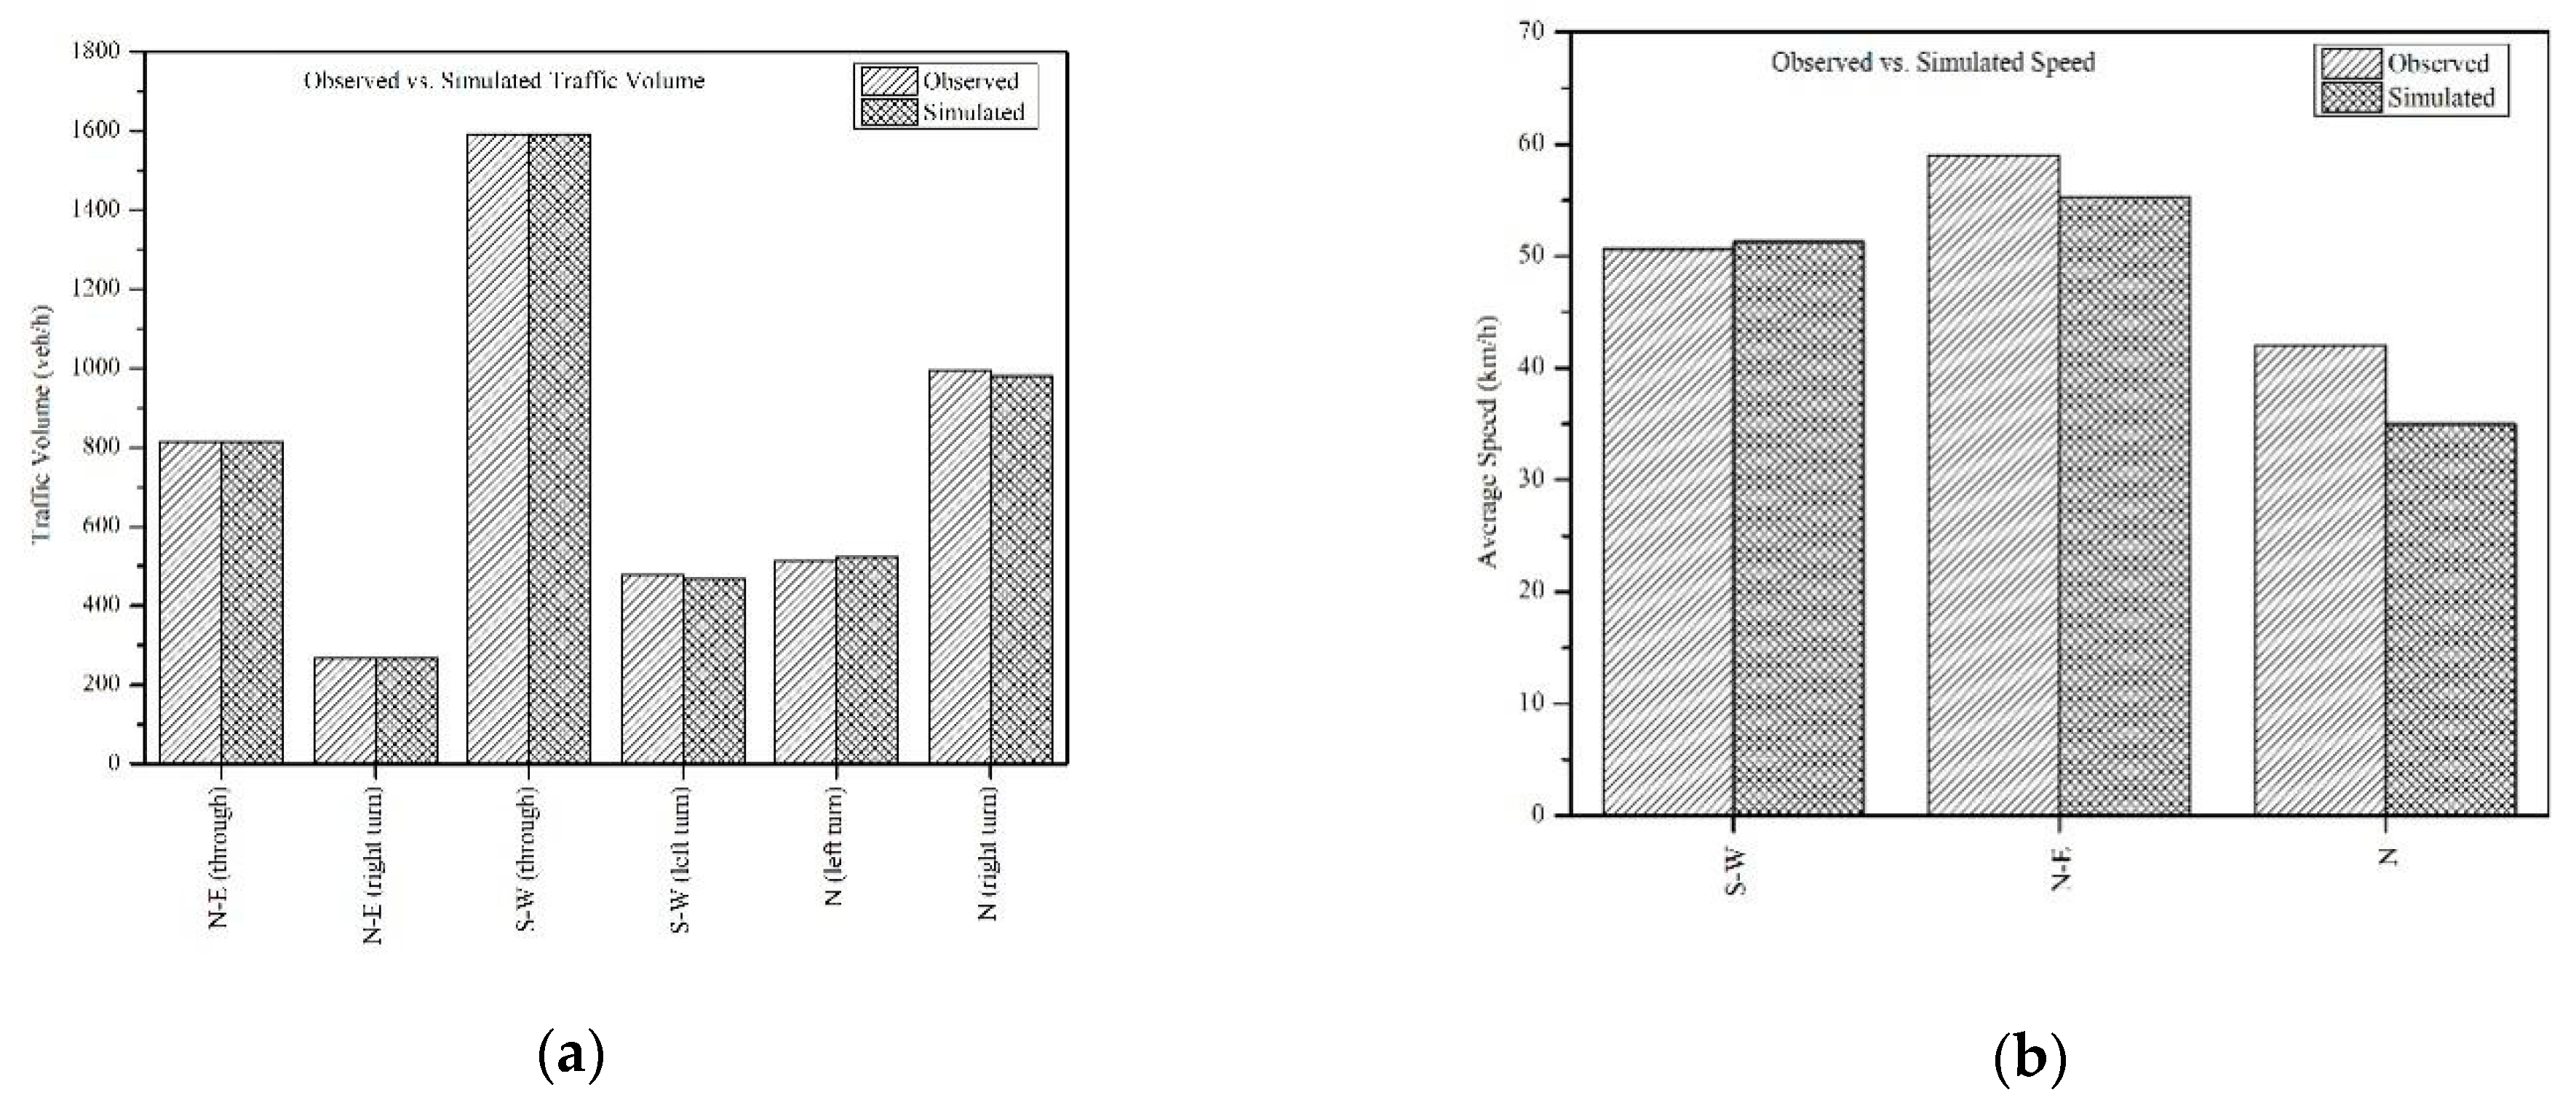
2.3. Base Model Development

A simulated model was developed based on the data collected on site at the T-junction of Jalan Bukit Impian to test the BRT strategy. The existing layout of the road, the highest peak hour traffic volume, desired speed distribution and signal operation of the junction were coded in a VISSIM microsimulation to model the base case scenario. Ten simulation runs were performed with an initial random seed value of 199 with a 210 increment in each random seed value. All the simulations were run for a total time of 4500 s including a temporal warm-up period of 900 s to ensure accurate simulation results.
Model error checking is an essential step after the base model development. This is to ensure that the base model runs as intended and rectification can be done if necessary. Model calibration is the process by which the model is fine tuned to replicate observed field conditions within a relatively small margin of error [48,49]. The calibration of the model was conducted based on the driver’s behaviour, while the validation was conducted based on traffic counts and traffic performance [48,50,51]. The driving behaviour characteristics mainly include car-following behaviour and lateral distance. The psycho-physical Wiedemann 99 car-following model and lane-changing behaviour parameters in VISSIM were adjusted to simulate drivers’ behaviours at the junction [48,49]. Through literature search, it was found that there are a few parameters of the car-following model that are critical to the model development and that could achieve realistic model outputs, such as standstill distance (CC0), time headway (CC1) and additional following distance (CC2) [52,53], as well as look ahead distance and look back distance [54,55]. The values for the car-following model and lane-changing parameters were chosen based on the values that best replicate the field conditions. The waiting time before diffusion in lane-changing behaviour parameters was set to 200 s following the recommendation by WSDOT [48]. The parameter set is shown in Table 3 and Table 4.
Peak hour vehicle volume and speed characteristics of the traffic were validated to make sure the model represented the real site situations. The root square mean percentage error (RSMPE) and the Geoffrey E. Havers (GEH) technique were used to determine the validity of the model developed in this study [48]. Figure 7a,b shows the validation analysis for traffic volume and speed.
Traffic volume and speed data for both field data and simulated data were compared, as shown in Figure 7. The RSMPE and the GEH values for both traffic parameters are within the validation threshold of 5% and 3%, respectively; hence the base model was validated [48]. A calibrated and validated model is essential in model development to ensure a valid and reliable evaluation [56,57,58]. The calibrated and validated base case model was then expanded further to model the bus rapid transit (BRT) strategies.

2.4. Bus Rapid Transit (BRT) Scenario Model Development

The proposed BRT system at the junction has a dedicated BRT lane with signal priority in mixed traffic scenarios. In the BRT scenarios, the road section is widened to accommodate an additional 9 m lane width for two-way directions of BRT. The median on the existing layout is replaced with a BRT lane. The existing geometrical layout of the junction such as the number of lanes and turning movements remains unchanged. All parameters such as driving behaviour, lane-changing behaviour, reduced speed areas and simulation run parameters are same as the base case model. The occupancy of the vehicle was 1.21, 1.41 and 10.54 for motorcycles, passenger cars and buses, respectively [43]. The layout of the BRT scenario on the road network is shown in a red-painted road segment in Figure 8.
In the BRT scenarios, three different modal split scenarios were modelled. The modal split between bus rapid transit (BRT) and private vehicles were pre-specified and modelled as 16:84 (Scenario 2), 38:62 (Scenario 3) and 54:46 (Scenario 4) to replicate the short-term, medium-term and long-term goals of public transport in Johor, respectively. The Iskandar Regional Development Authority’s transformation plan was used as a basis to develop the modal split scenarios used in this study but with a more condensed scenario [58].
The recall and extension methods were incorporated in the vehicle-actuated signal control to accommodate the BRT scenarios. The BRT lane became a priority approach on the junction. When a bus is detected on the priority approach during red signal indication, the recall method is used in which the green time is given to the bus. The extension method is used when a bus is detected on the priority approach during the end of green time indication so that the bus can pass through the junction without having to stop. The similar condition of phase demand requirement as in the existing signal control system is embedded in the recall and extension methods. The phase is given to the priority approach if one of these conditions are met: (1) no vehicles are present on the current phase; (2) signal phase has reached minimum green time and gap out time; or (3) the phase has reached maximum green time.

3. Results and Discussion
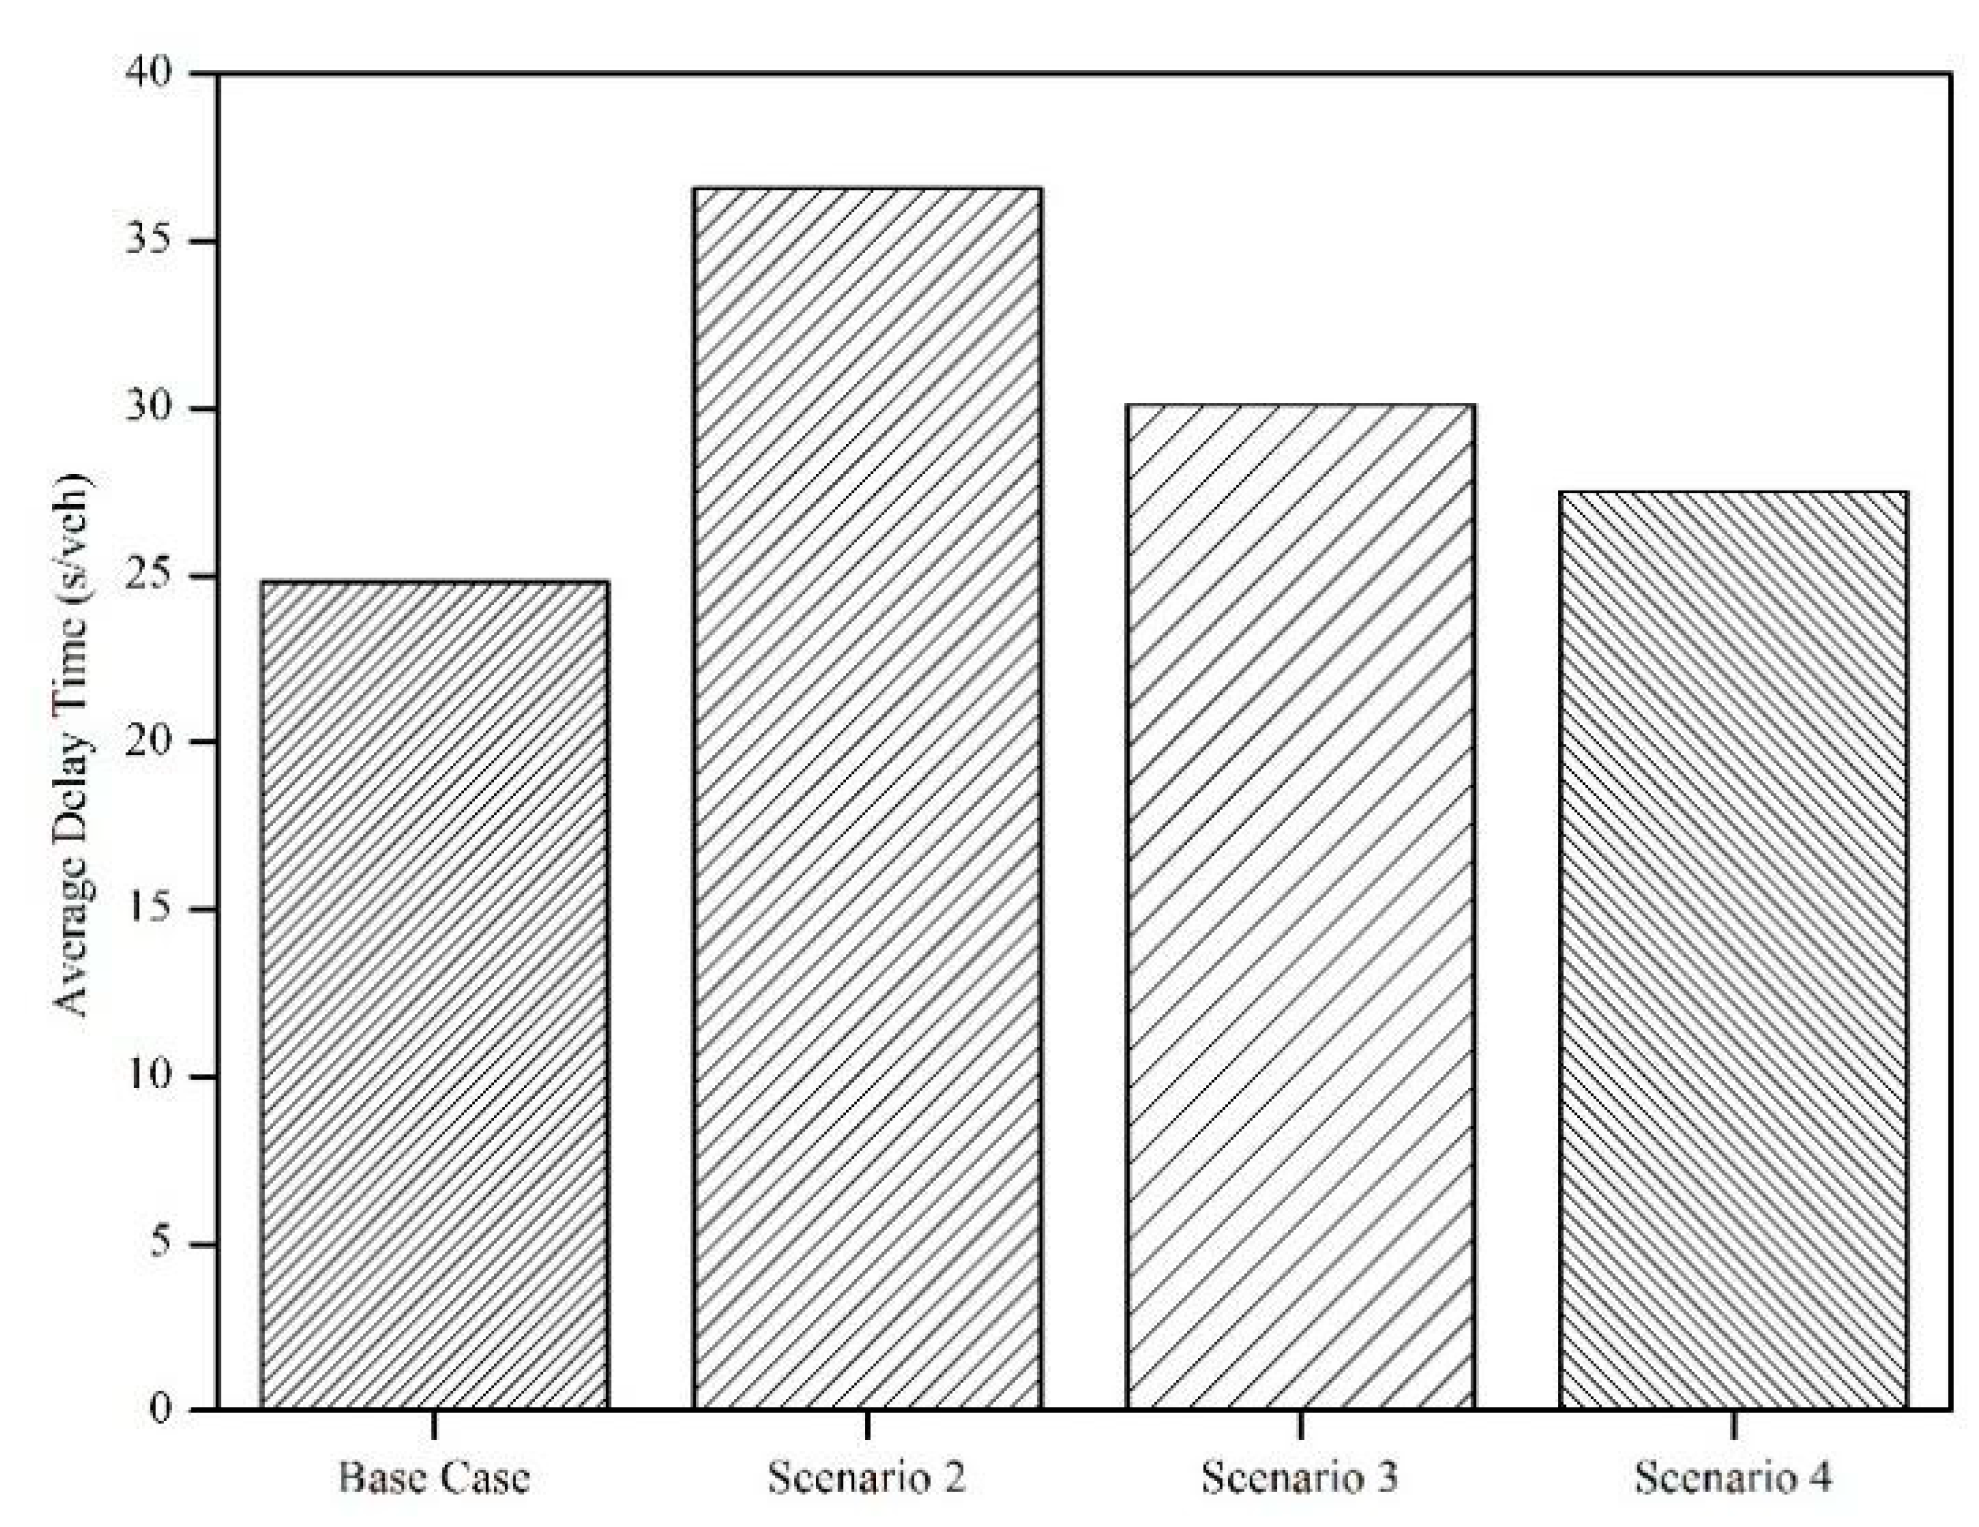
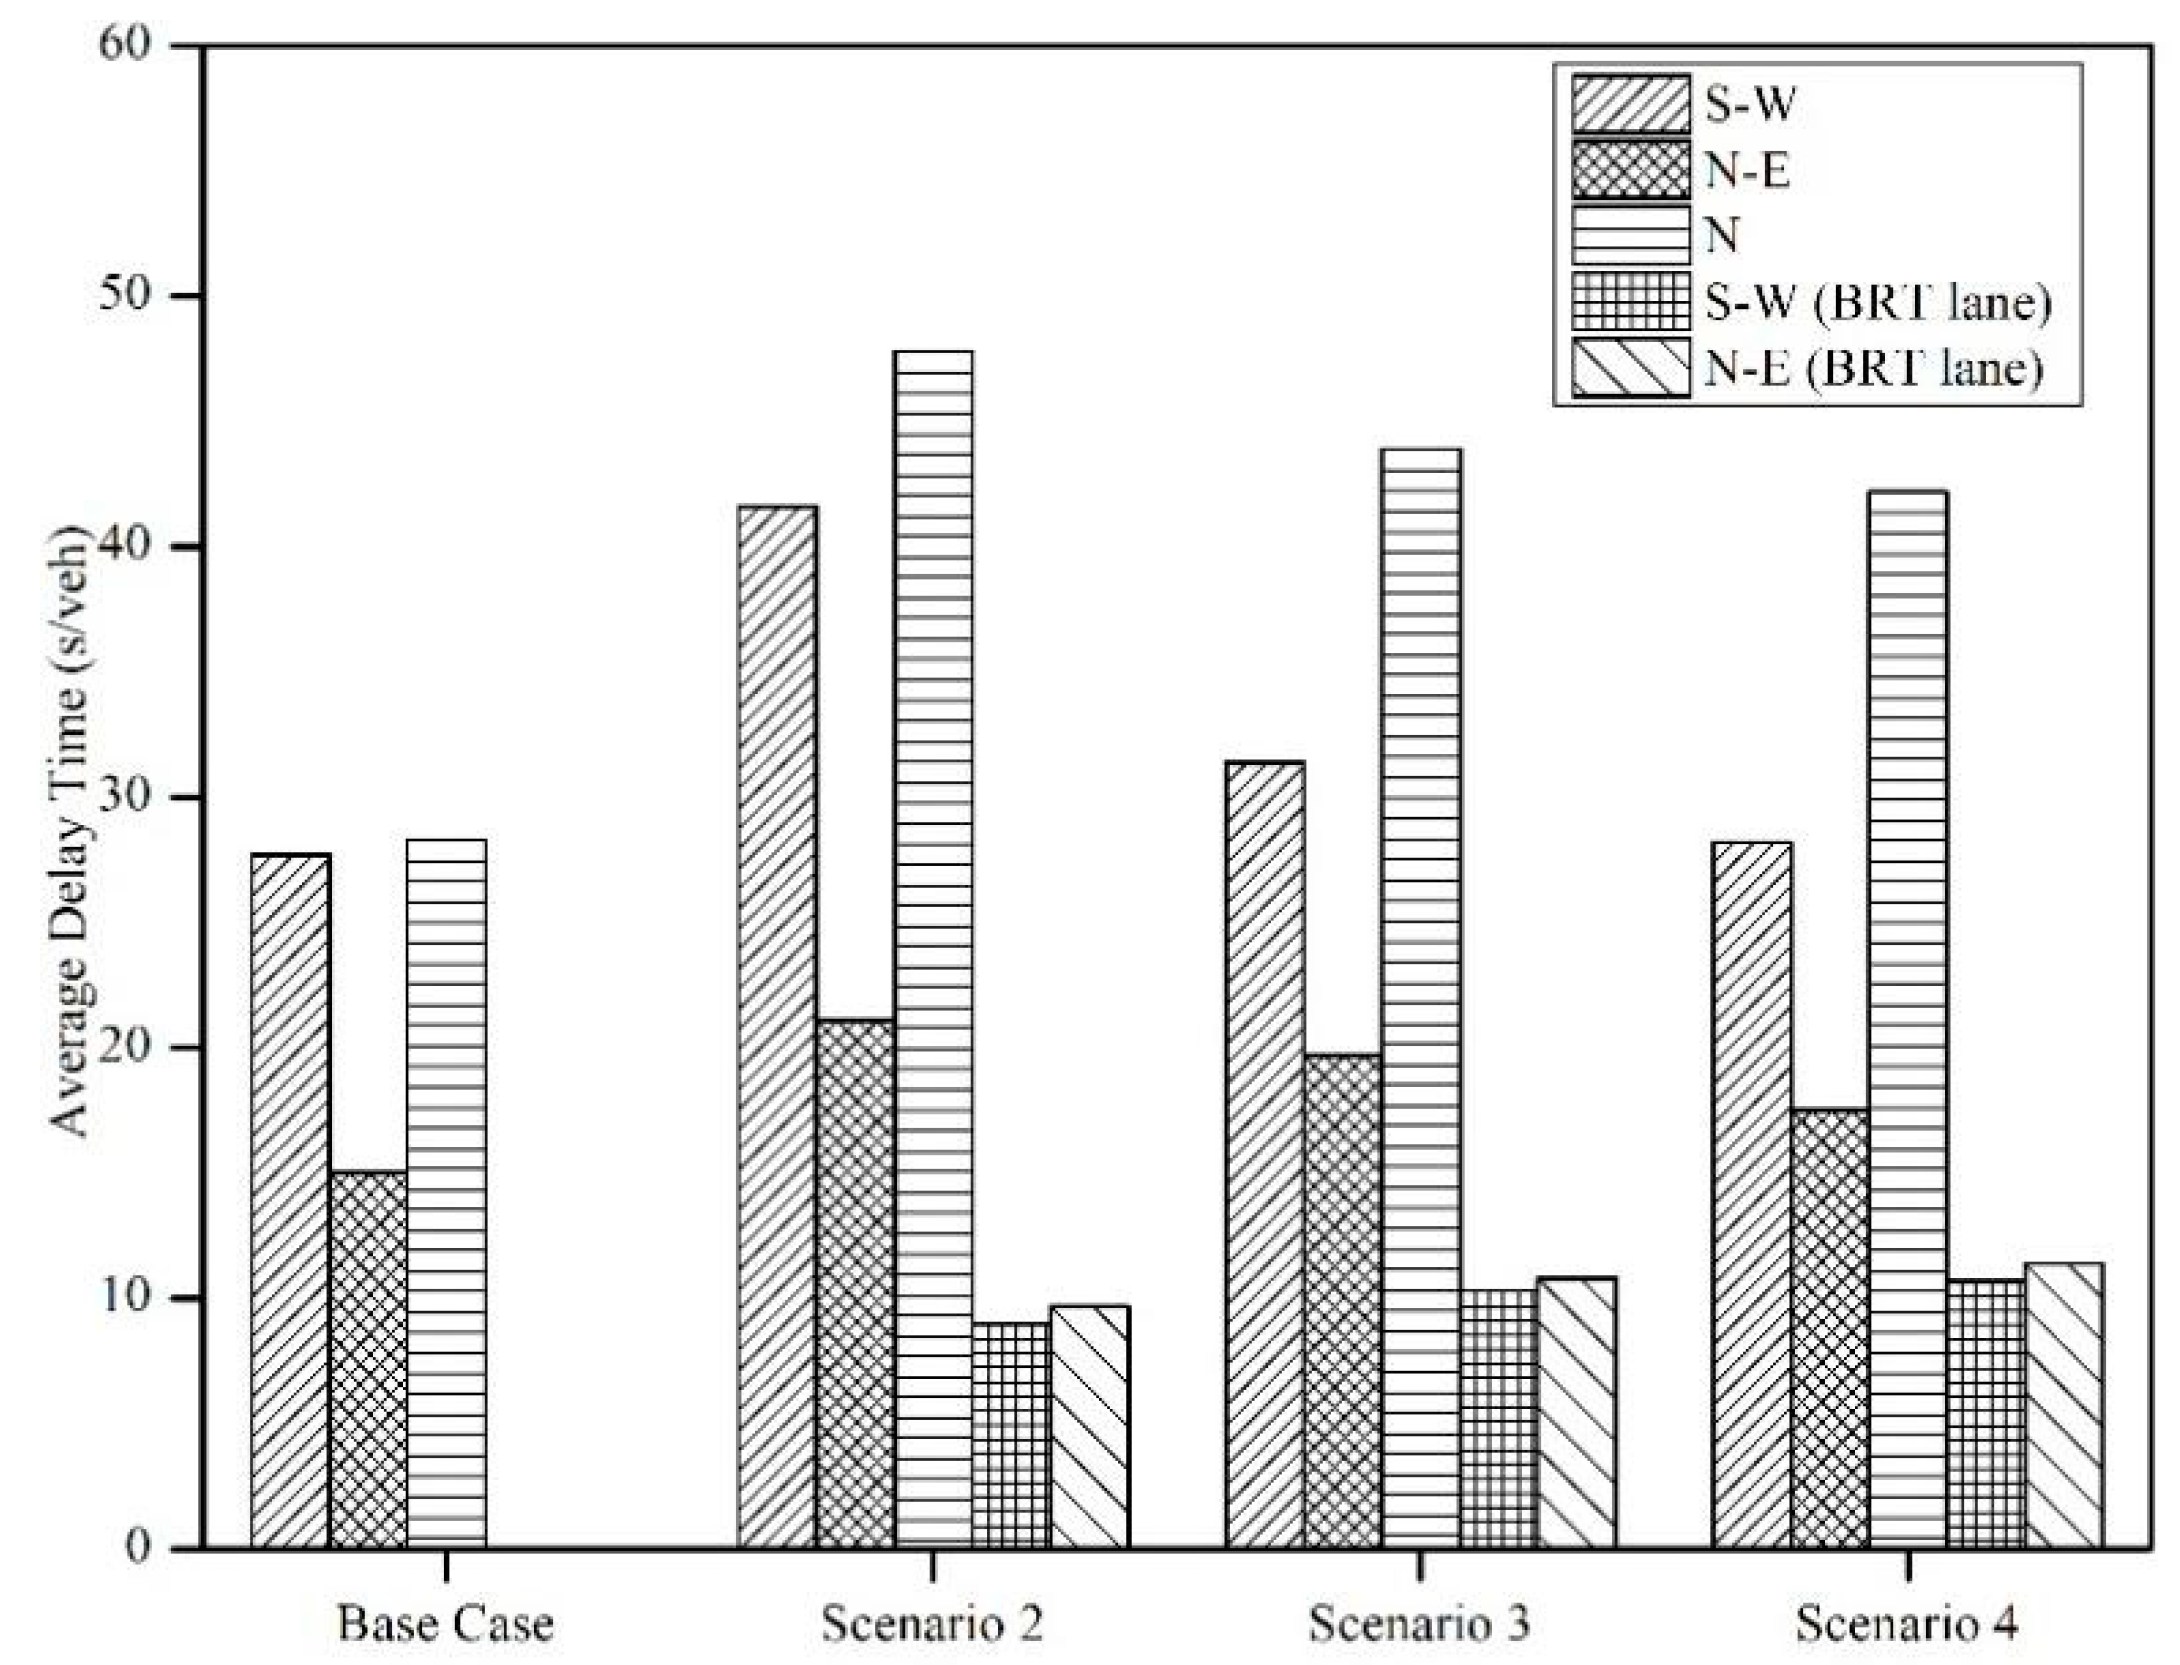
3.1. Vehicle Delay

The results collected from the VISSIM were compared between the base case and the BRT scenarios as shown in Figure 9 and Figure 10. Figure 9 shows that generally the implementation of BRT caused an increase in average delay time compared to the base case scenario. Scenario 4 (54% public transport) had the lowest average delay per vehicle per junction and it is slightly higher than the base case scenario. The results for all approaches in each scenario are presented in Figure 10. All non-priority approaches (S-W, N-E and N) experienced a higher delay with BRT implementation. With the BRT implementation, Scenarios 2, 3 and 4 imposed a higher delay to all non-priority approaches and bus priority approaches, respectively. For the S-W approach, the BRT scenarios imposed an increase in average delay time compared to the base case by 50.1%, 13.4% and 1.8% for Scenarios 2, 3 and 4, respectively. Similarly, for the N-E approach, compared to the base case, there was an increase in average delay time for Scenarios 2, 3 and 4 by 40.7%, 31.5% and 16.8%, respectively. For the N approach, the BRT scenarios caused an increase in average delay time compared to the base case by 69%, 55.2% and 49.3%, respectively, for Scenarios 2, 3 and 4. This shows that creating bus priority by extension and recall methods gives less benefits to non-priority stages as a higher number of recalls and extension time will cause higher delays to non-priority approaches. Among all scenarios, Scenario 4, which had a higher proportion of public transport, was seen as the best strategy.

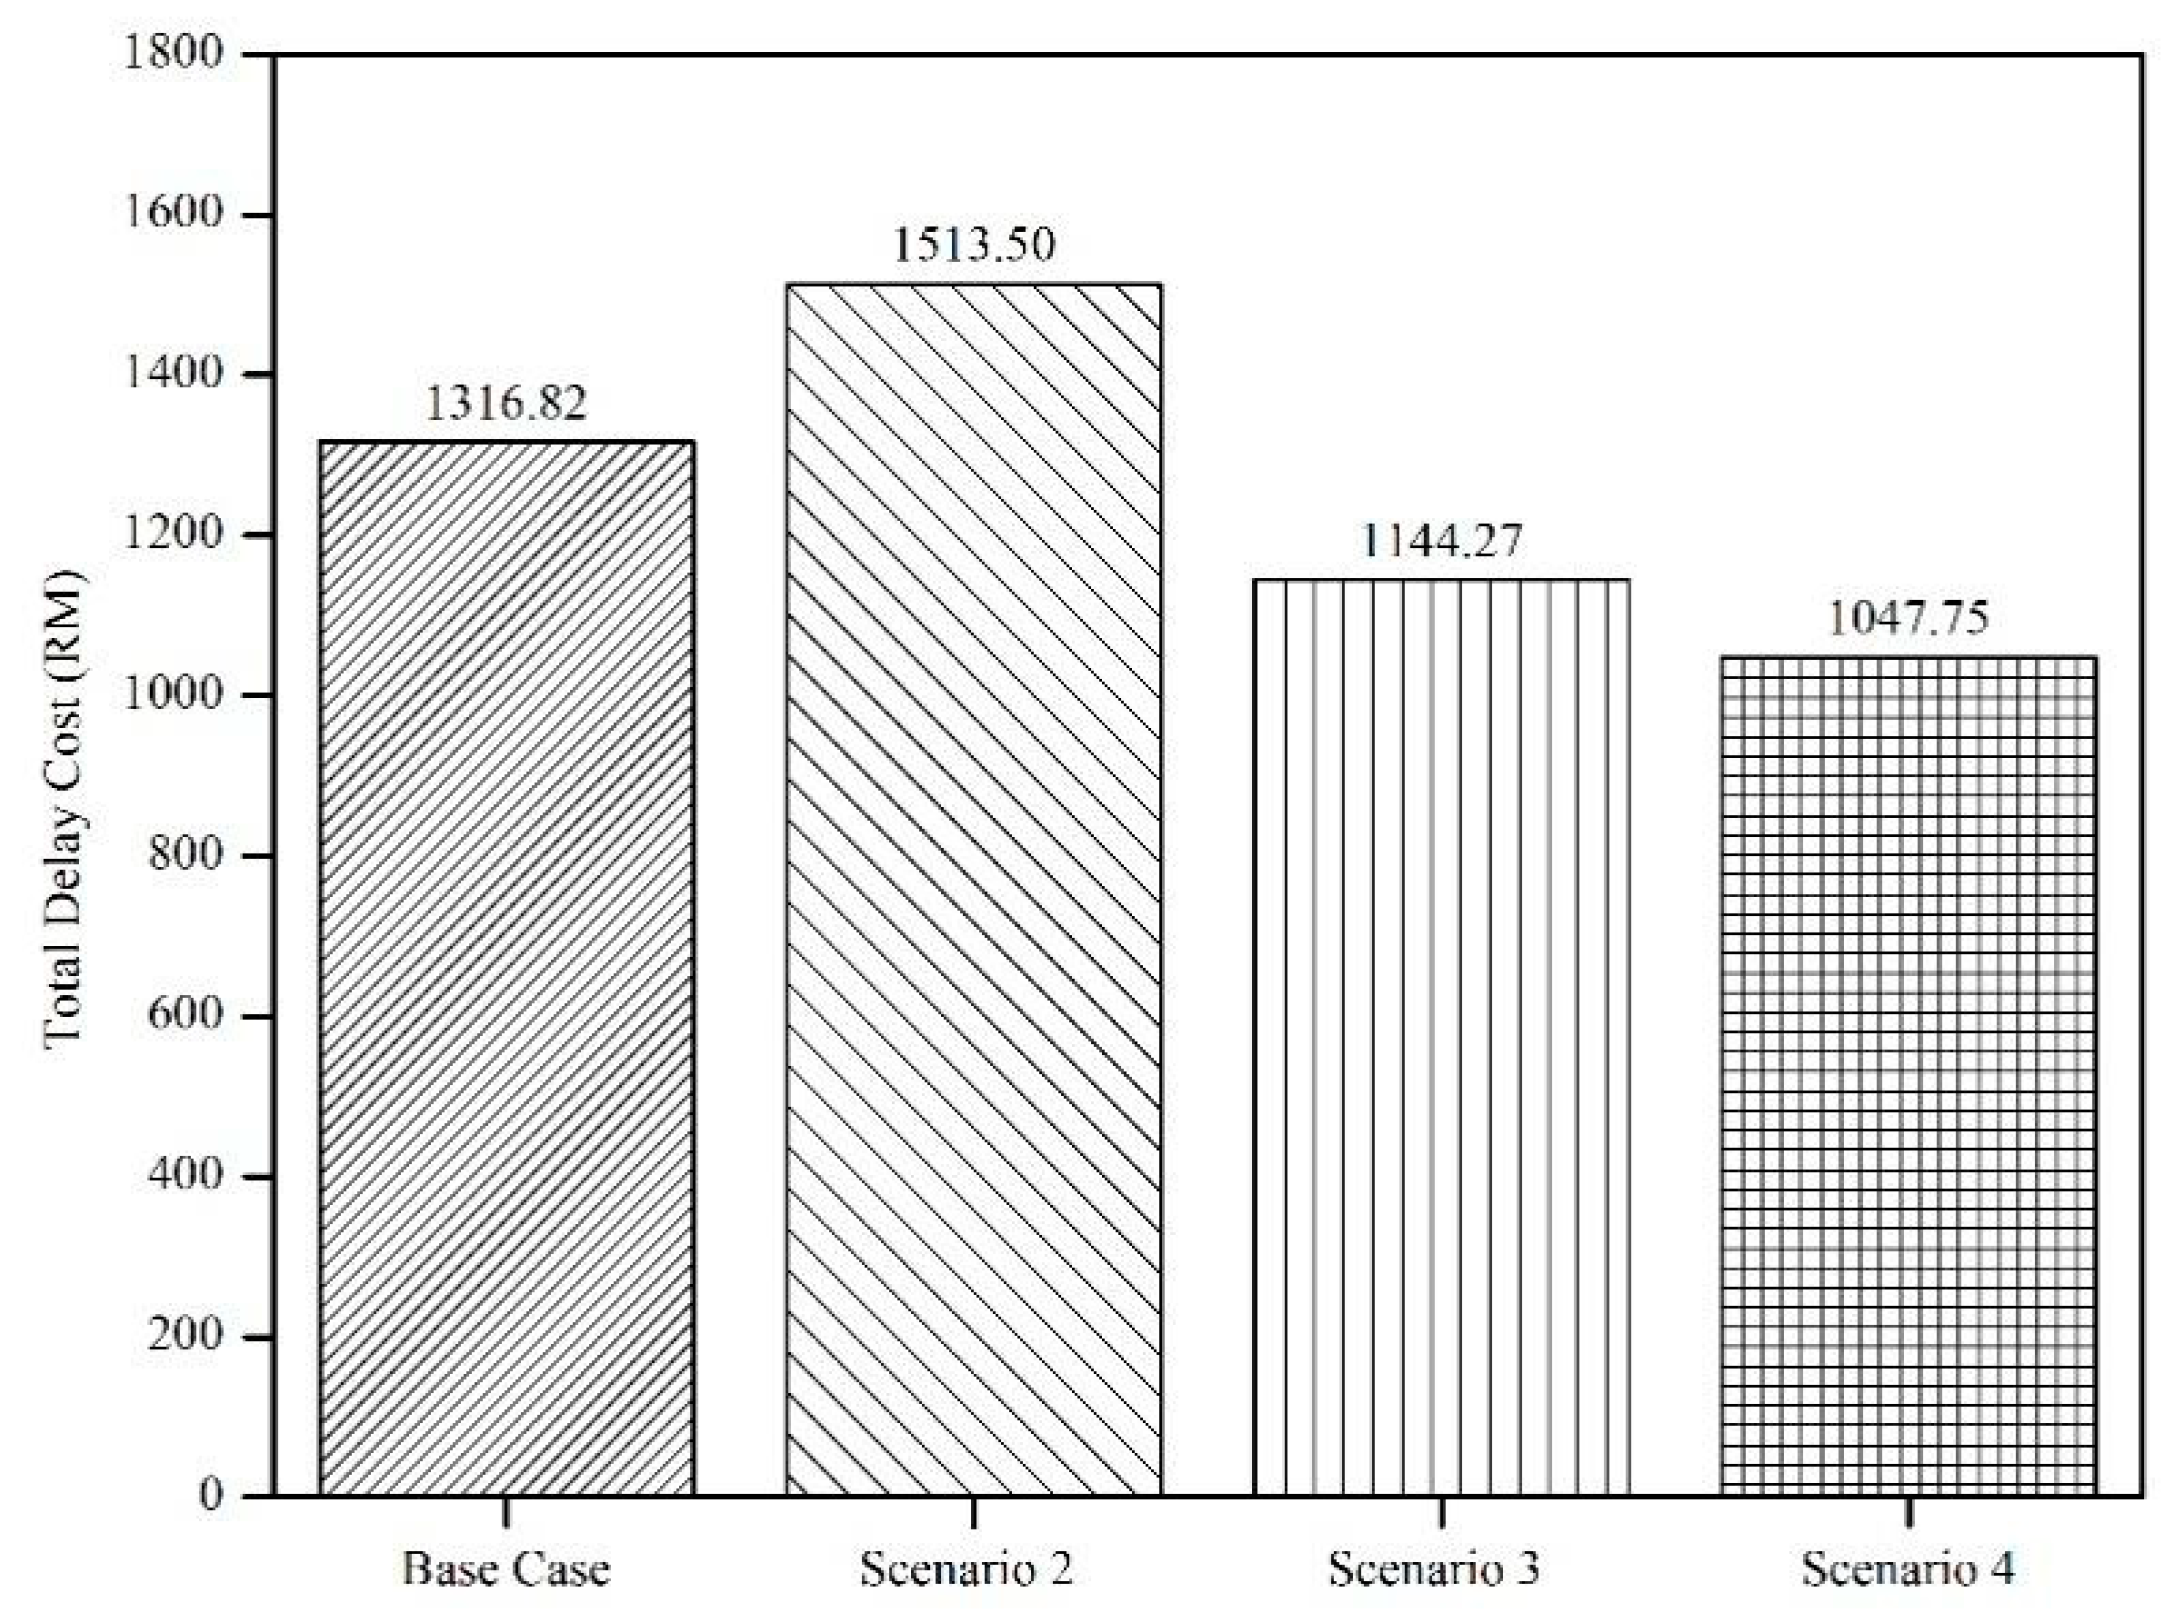
3.2. Economic Evaluation

The delay was then used to evaluate the economic benefit of the modal split changes of the scenarios. The monetary value used in the analysis is an average nominal labour per person per hour which is RM40.10 per person per hour (USD1 = RM4.14) [59]. The delay cost was calculated based on delay time per person. Figure 11 shows the total delay costs for each of the scenarios.
As shown in Figure 11, Scenario 2 (modal split: 16% BRT and 84% private vehicles) shows the highest delay cost among all scenarios. It can be seen that the bus priority signal control caused a frequent call to buses; hence, there were higher delays due to frequent stops of private vehicles in Scenario 2. However, as the ratio between BRT and private vehicle increases, more benefits in terms of travel time savings are expected due to the reduction of private vehicles on the road. Figure 12 shows the summary of benefits gained from the BRT scenarios.
Based on Figure 12, Scenario 4 brings more benefits compared to other scenarios. Scenario 4 incurred about 10.8% more in average delay and 20.4% reduction in total delay cost compared to the base case. Among all other scenarios, Scenario 4 incurred the smallest increment in average delay and the highest reduction in total delay cost relative to the base case. It is perceived that as more people opt to use public transport instead of private vehicles the congestion on the road network can be reduced, thus providing a smoother travelling experience and better financial benefits.

4. Conclusions

Based on a microsimulation-based evaluation, in general, the BRT system improved the operation of the transport system and providing faster and better services to people in terms of mobility, resulting in an attractive value for society and the economy. Practically, in whatever situation, it is expected that there is a trade-off between private vehicle delay and public transport delay at the signalised junctions, especially when we look into an individual approach of the junction. However, the positive impact of the utilisation of BRT at signalised junctions is seen to be more significant compared to the negative consequences. As the number of people opting for public transport is higher, the social and economic benefits are prevalent. It was found that Scenario 4 with 54% public transport had more benefits compared to other scenarios, where it provided the lowest average delay to vehicles and the most positive saving in total delay cost. By the development and expansion of public transport systems, the total cost of delay reduces significantly due to the fact that more people can be transported on public transport; hence there is less congestion on the road and lesser delay time for people. The implementation of BRT is seen as an important strategy towards sustainable transportation in Malaysia. This study contributes to the conceptual design of BRT implementation for developing cities at micro level, which has limiting conditions.
This study has used an assumption that the total traffic volume would be the same for all modelled scenarios at the selected location. This acts as a controlled variable in this study. Therefore, it would be recommended to apply demand forecasting rate for different scenarios to accommodate the different years of target. The study can be further extended to include BRT development in a higher level of network system to allow for a more realistic evaluation, as there are many possible considerations that influence the BRT operation and general traffic.
To the best of our knowledge, there are many factors shaping BRT’s ambitious strategy. Firstly, the powerful political will of the authorities with the right amount of investment in public transport should be the ultimate strategy. In Asia, most countries are experiencing an increasing trend in motorisation and the number of vehicles is expected to continue to grow. Therefore, BRT should be regarded as an alternative for urban transport by policymakers in many large cities in Asia, including Malaysia. This would involve a radical change in urban mobility transformation in the adoption of a new BRT system and its acceptance in the urban population. The introduction of a BRT system is a bold step to minimise reliance on private cars, thus providing socially and economically viable transportation. However, the success of any transportation strategies relies on the fast and reliable services of public transport. Therefore, it is important that BRT receives priority over other vehicles with the addition of a dedicated bus lane.
The findings from this study may help relevant authorities in providing better urban planning and traffic management strategies for future traffic conditions in Malaysia. It provides a basis to formulate an effective strategy of BRT in a mixed traffic environment. The findings of this study serve as an entry point to highlight future directions of urban mobility in Malaysia.

Author Contributions

Conceptualisation, S.A.H.; methodology, S.A.H.; software, S.A.H.; formal analysis, I.N.S.H. and A.R.S.; resources, S.A.H.; I.N.S.H. and A.R.S.; data curation, I.N.S.H. and A.R.S.; writing—original draft preparation, S.A.H.; writing—review and editing, S.A.H.; visualisation, S.A.H.; supervision, S.A.H.; project administration, S.A.H. and N.S.A.S.; funding acquisition, S.A.H. All authors have read and agreed to the published version of the manuscript.

Funding

This research was funded by the Malaysia Ministry of Higher Education under the Fundamental Research Grant Scheme (FRGS/1/2018/TK08/UTM/02/1).

Conflicts of Interest

The authors declare no conflict of interest.

References

  1. Joewono, T.B. Safety and security improvement in public transportation based on public perception. Transportation 2006, 30, 86–100. [Google Scholar] [CrossRef] [Green Version]
  2. Eboli, L.; Mazzulla, G. A new customer satisfaction index for evaluating transit service quality. Transit 2009, 12, 21–37. [Google Scholar] [CrossRef] [Green Version]
  3. Hashim, R.; Haron, S.; Mohamad, S.; Hassan, F. Assessment of campus bus service efficacy: An application towards green environment. Proc. Soc. Behav. Sci. 2013, 105, 294–303. [Google Scholar] [CrossRef] [Green Version]
  4. Joewono, T.B.; Tarigan, A.K.M.; Susilo, Y.O. Road-based public transportation in urban areas of Indonesia: What policies do users expect to improve the service quality? Transp. Policy 2016, 49, 114–124. [Google Scholar] [CrossRef]
  5. Minhans, A.; Shahid, S.; Hassan, S.A. Assessment of bus service-quality using passengers’ perceptions. J. Teknol. 2015, 73, 61–67. [Google Scholar] [CrossRef] [Green Version]
  6. Kamba, A.N.; Rahmat, R.A.O.K.; Ismail, A. Why do people use their cars: A case study in Malaysia. J. Soc. Sc. 2007, 3, 117–122. [Google Scholar] [CrossRef] [Green Version]
  7. Minhans, A.; Shahid, S.; Ahmed, I. An investigation into qualitative differences between bus users and operators for intercity travel in Malaysia. J. Teknol. 2014, 70, 71–81. [Google Scholar] [CrossRef] [Green Version]
  8. Fujii, S.; Van, H.T. Psychological determinants of the intention to use the bus in Ho Chi Minh City. J. Public Transp. 2009, 12, 97–110. [Google Scholar] [CrossRef]
  9. Bull, A.; Cepal, N. Traffic Congestion: The Problem and How to Deal with I; ECLAC: Santiago, Chile, 2003. [Google Scholar]
  10. Asri, D.U.; Hidayat, B. Current transportation issues in Jakarta and its impact on environment. East. Asia Soc. Transp. Stud. 2005, 5, 1792–1798. [Google Scholar]
  11. Papageorgiou, G.; Maimaris, A. Planning for effective bus rapid transit systems: A scenario simulation modelling based approach. In Proceedings of the IFAC Symposium on Control in Transportation Systems, The International Federation of Automatic Control, Sofia, Bulgari, 12–14 September 2012. [Google Scholar] [CrossRef]
  12. Mohamad, J.; Kiggundu, A.T. The rise of the private car in Kuala Lumpur, Malaysia-assessing the policy options. IATSS Res. 2007, 31, 69–77. [Google Scholar] [CrossRef] [Green Version]
  13. Ministry of Transport. Transport Statistics Malaysia; Ministry of Transport Malaysia: Putrajaya, Malaysia, 2016.
  14. Musa, M.F.; Hassan, S.A.; Mashros, N. The impact of roadway conditions towards accident severity on federal roads in Malaysia. PLoS ONE 2020, 15, e0235564. [Google Scholar] [CrossRef]
  15. Ghose, M.K.; Paul, R.; Banerjee, S.K. Assessment of the impacts of vehicular emissions on urban air quality and its management in Indian context: The case of Kolkata (Calcutta). Environ. Sci. Policy 2004, 7, 345–351. [Google Scholar] [CrossRef]
  16. Kakouei, A.; Vatani, A.; Idris, A.K.B. An estimation of traffic related CO2 emissions from motor vehicles in the capital city of, Iran. Iran. J. Environ. Health Sci. Eng. 2012, 9, 13. [Google Scholar] [CrossRef] [Green Version]
  17. Sandoval, E.E.; Hidalgo, D. TransMilenio: A high capacity-low cost bus rapid transit system developed for Bogotá, Colombia. In Proceedings of the Second International Conference in Urban Public Transportation Systems, Alexandria, VA, USA, 14–18 April 2002; pp. 37–49. [Google Scholar] [CrossRef] [Green Version]
  18. Ernst, J.P. Initiating bus rapid transit in Jakarta, Indonesia. Transp. Res. Rec. 2005, 1903, 20–26. [Google Scholar] [CrossRef]
  19. Deng, T.; Nelson, J.D. Recent developments in bus rapid transit: A review of the literature. Transp. Rev. 2011, 31, 69–96. [Google Scholar] [CrossRef]
  20. Alpkokin, P.; Ergun, M. Istanbul Metrobüs: First intercontinental bus rapid transit. J. Transp. Geogr. 2012, 24, 58–66. [Google Scholar] [CrossRef]
  21. Deng, T.; Nelson, J.D. Bus Rapid Transit implementation in Beijing: An evaluation of performance and impacts. Res. Transp. Econ. 2013, 39, 108–113. [Google Scholar] [CrossRef]
  22. Wan, D.; Kamga, C.; Liu, J.; Sugiura, A.; Beaton, E.B. Rider perception of a “light” bus rapid transit system-The New York City select bus service. Transp. Policy 2016, 49, 41–55. [Google Scholar] [CrossRef]
  23. Zolnik, E.J.; Malik, A.; Irvin-Erickson, Y. Who benefits from bus rapid transit? Evidence from the Metro Bus System (MBS) in Lahore. J. Transp. Geogr. 2018, 71, 139–149. [Google Scholar] [CrossRef]
  24. Matsumoto, N. Analysis of Policy Processes to Introduce Bus Rapid Transit Systems in Asian Cities from the Perspective of Cases of Jakarta, Seoul, and Beijing; Better Air Quality Workshop: Yogyakarta, Indonesia, 2006. [Google Scholar]
  25. Dong, X.; Lin, Y.; Shen, D.; Li, Z.; Zhu, F.; Hu, B.; Xiong, G. A Parallel transportation management and control system for bus rapid transit using the ACP approach. IEEE Trans. Intell. Transp. Syst. 2017, 18, 2569–2574. [Google Scholar] [CrossRef]
  26. Basso, L.J.; Feres, F.; Silva, H.E. The efficiency of bus rapid transit (BRT) systems: A dynamic congestion approach. Transp. Res. Part B Methodol. 2019, 127, 47–71. [Google Scholar] [CrossRef]
  27. Pereira, R.H.M. Future accessibility impacts of transport policy scenarios: Equity and sensitivity to travel time thresholds for Bus Rapid Transit expansion in Rio de Janeiro. J. Transp. Geogr. 2019, 74, 321–332. [Google Scholar] [CrossRef] [Green Version]
  28. Krüger, F.; Titz, A.; Arndt, R.; Groß, F.; Mehrbach, F.; Pajung, V.; Suda, L.; Wadenstorfer, M.; Wimmer, L. The Bus Rapid Transit (BRT) in Dar es Salaam: A pilot study on critical infrastructure, sustainable urban development and livelihoods. Sustainability 2021, 13, 1058. [Google Scholar] [CrossRef]
  29. Satiennam, T.; Jaensirisak, S.; Satiennam, W.; Detdamrong, S. Potential for modal shift by passenger car and motorcycle users towards Bus Rapid Transit (BRT) in an Asian developing city. IATSS Res. 2016, 39, 121–129. [Google Scholar] [CrossRef] [Green Version]
  30. Fukuda, A.; Satiennam, T.; Oshima, R. A study on the introduction of bus rapid transit system in Asian developing cities. IATSS Res. 2006, 30. [Google Scholar] [CrossRef] [Green Version]
  31. Deng, T.; Ma, M.; Nelson, J.D. Measuring the impacts of Bus Rapid Transit on residential property values: The Beijing case. Res. Transp. Econ. 2016, 60, 54–61. [Google Scholar] [CrossRef]
  32. Dubé, J.; Andrianary, E.; Assad-Déry, F.; Poupart, J.; Simard, J. Exploring difference in value uplift resulting from new bus rapid transit routes within a medium size metropolitan area. J. Transp. Geogr. 2018, 72, 258–269. [Google Scholar] [CrossRef]
  33. Yang, L.; Chau, K.W.; Chu, X. Accessibility-based premiums and proximity-induced discounts stemming from bus rapid transit in China: Empirical evidence and policy implications. Sustain. Cities Soc. 2019, 48, 101561. [Google Scholar] [CrossRef]
  34. Basheer, M.A.; Boelens, L.; Bijl, R.V.D. Bus rapid transit system: A study of sustainable land-use transformation, urban density and economic impacts. Sustainability 2020, 12. [Google Scholar] [CrossRef] [Green Version]
  35. Sharma, H.K.; Swami, B.L. Optimizing performance of at-grade intersection with bus rapid transit corridor and heterogeneous traffic. Int. J. Transp. Sci. Technol. 2012, 1, 131–146. [Google Scholar] [CrossRef] [Green Version]
  36. Al-deek, H.; Sandt, A.; Alomari, A.; Hussain, O.; Author, C. A technical note on evaluating the effectivess of bus rapid transit with transit signal priority. J. Intell. Transp. Syst. 2017, 21, 227–238. [Google Scholar] [CrossRef]
  37. Zhou, L.; Wang, Y.; Liu, Y. Active signal priority control method for bus rapid transit based on Vehicle Infrastructure Integration. Int. J. Transp. Sci. Technol. 2017, 6, 99–109. [Google Scholar] [CrossRef]
  38. Ni, Y.C.; Lo, H.H.; Hsu, Y.T.; Huang, H.J. Exploring the effects of passive transit signal priority design on bus rapid transit operation: A microsimulation-based optimization approach. Transp. Lett. 2020, 1–14. [Google Scholar] [CrossRef]
  39. Chen, X.; Yu, L.; Zhu, L.; Yu, L.; Guo, J. Microscopic simulation approach to effectiveness analysis of transit signal priority for bus rapid transit a case study in Beijing. Transp. Res. Rec. 2008, 2072, 64–76. [Google Scholar] [CrossRef]
  40. Ye, Z.; Xu, M. Decision model for resolving conflicting transit signal priority requests. IEEE Trans. Intell. Transp. Syst. 2017, 18, 59–68. [Google Scholar] [CrossRef]
  41. Islam, T.; Vu, H.L.; Hoang, N.H.; Cricenti, A. A linear bus rapid transit with transit signal priority formulation. Transp. Res. Part E Logist. Transp. Rev. 2018, 114, 163–184. [Google Scholar] [CrossRef]
  42. Yue, Y.; Chen, J.; Yang, Q.; Ye, J. Threshold determination for sharing bus rapid transit-exclusive lanes with conventional buses. Sustainability 2019, 11. [Google Scholar] [CrossRef] [Green Version]
  43. Perbadanan Pengangkutan Awam Johor. Pelan Induk Pengangkutan Awam (2015–2045)—Volume 1; Perbadanan Pengangkutan Awam Johor: Johor, Malaysia, 2016. [Google Scholar]
  44. Malaysian Institute of Road Safety Research. General Road Accident Data in Malaysia (1997–2016); Department of Statistics Malaysia: Putrajaya, Malaysia, 2017. [Google Scholar]
  45. Department of Statistics Malaysia. Statistik Penduduk. Malaysia. 2019. Available online: https://www.dosm.gov.my/v1/index.php?r=column/cthree&menu_id=UmtzQ1pKZHBjY1hVZE95R3RnR0Y4QT09 (accessed on 5 April 2021).
  46. Road Traffic Volume Malaysia (RTVM) 2019; Ministry of Works Malaysia: Putrajaya, Malaysia, 2019.
  47. Perbadanan Pengangkutan Awam Johor. Pelan Induk Pengangkutan Awam (2015–2045)—Volume 2; Perbadanan Pengangkutan Awam Johor: Johor, Malaysia, 2016. [Google Scholar]
  48. Washington State Department of Transportation. Protocol for VISSIM Simulation; Washington State Department of Transportation: Washington, DC, USA, 2014.
  49. Virginia Department of Transportation. VDOT VISSIM User Guide Version 2.0; Virginia Department of Transportation: Richmond, VA, USA, 2020.
  50. TfL. Traffic Modelling Guidelines TfL Traffic Manager and Network Performance Best Practice Version 3.0; Transport for London: London, UK, 2010. [Google Scholar]
  51. Maheshwary, P.; Bhattacharyya, K.; Maitra, B.; Boltze, M. A methodology for calibration of traffic micro-simulator for urban heterogeneous traffic operations. J. Traffic Transp. Eng. (English Edition) 2020, 7, 507–519. [Google Scholar] [CrossRef]
  52. Jehn, N.L.; Turochy, R.E. Calibration of vissim models for rural freeway lane closures: Novel approach to the modification of key parameters. Transp. Res. Rec. 2019, 2673, 574–583. [Google Scholar] [CrossRef]
  53. Arafat, M.; Nafis, S.R.; Sadeghvaziri, E.; Tousif, F. A data-driven approach to calibrate microsimulation models based on the degree of saturation at signalized intersections. Transp. Res. Interdiscip. Perspect. 2020, 8. [Google Scholar] [CrossRef]
  54. Arkatkar, S.; Velmurugan, S.; Puvvala, R.; Ponnu, B.; Narula, S. Methodology for simulating heterogeneous traffic on expressways in developing countries: A case study in India. Transp. Lett. 2016, 8, 61–76. [Google Scholar] [CrossRef]
  55. Bharadwaj, N.; Mathew, S.; Pani, A.; Arkatkar, S.; Joshi, G.; Ravinder, K. Effect of traffic composition and emergency lane on capacity: A case study of intercity expressway in India. Transp. Lett. 2018, 10, 316–332. [Google Scholar] [CrossRef]
  56. Hassan, S.A.; Hounsell, N.B.; Shrestha, B.P. Verification of puffin modelling using VISSIM. J. Teknol. 2013, 65, 81–84. [Google Scholar] [CrossRef] [Green Version]
  57. Azam, M.; Puan, O.C.; Hassan, S.A.; Mashros, N. Calibration of microsimulation model for tight urban diamond interchange under heterogeneous traffic. IOP Conf. Ser. Mater. Sci. Eng. 2019, 527. [Google Scholar] [CrossRef]
  58. Blueprint 2010–2030 for Iskandar Malaysia; Iskandar Regional Development Authority (IRDA): Johor Bahru, Malaysia, 2011.
  59. The World Bank. Malaysia Economic Monitor Transforming Urban Transport; Southeast Asia Country Management Unit: Bangkok, Thailand, 2015. [Google Scholar]
Figure 1. Proposed Bus Rapid Transit (BRT) Corridor 9 connecting Kangkar Pulai–Kempas–Bukit Indah [47].
Sustainability 13 04437 g001
Figure 2. Site location. (The following url can be used to open the close-up view of the study area: https://pegis.penang.gov.my/geoportal/home/webmap/print.html accessed on 5 April 2021).
Sustainability 13 04437 g002
Figure 3. Daily traffic volume at the junction.
Sustainability 13 04437 g003
Figure 4. Peak traffic volume at the junction.
Sustainability 13 04437 g004
Figure 5. Vehicle composition.
Sustainability 13 04437 g005
Figure 6. Desired speed distribution for each vehicle type.
Sustainability 13 04437 g006
Figure 7. Validation of traffic data: (a) traffic volume and (b) average traffic speed.
Sustainability 13 04437 g007
Figure 8. BRT scenario layout.
Sustainability 13 04437 g008
Figure 9. Average delay for the junction.
Sustainability 13 04437 g009
Figure 10. Average delay for each approach.
Sustainability 13 04437 g010
Figure 11. Total delay cost for each scenario.
Sustainability 13 04437 g011
Figure 12. Comparison of savings between the base case and BRT.
Sustainability 13 04437 g012
Table 1. Peak hour traffic volume (veh/h).
DirectionTurning Volume (veh/h)
Left-TurnThroughRight-TurnTotal
North512-9941506
South-West4781589-2067
North-East-8142671081
Total4654
Table 2. Signal timing data.
Parameters Value (s)
Minimum Green 5
Maximum Green 40
Minimum Intergreen 4
Minimum Amber 3
Minimum Red 1
Table 3. Parameters of car-following behaviour.
ParametersLook Ahead Distance (m)Look Back Distance (m)Standstill Distance, CC0 (m)Following Distance, CC1 (s)Longitudinal Oscillation, CC2 (m)
MinMaxMinMax
Default0.00250.000.00150.001.500.94.00
Modified0.00267.060.00147.641.220.92.00
Table 4. Lane-changing behaviour.
Lane ChangeDefaultMinMaxModified
Max. deceleration—own (m/s)−4.00−4.57−3.66−4.50
Accepted deceleration—own (m/s)−1.00−0.76−1.22−1.00
Max. deceleration—trailing (m/s)−3.00−3.66−2.44−3.66
Min. headway (front/rear) (s)0.500.461.830.50
Waiting time before diffusion (s)60--200
Publisher’s Note: MDPI stays neutral with regard to jurisdictional claims in published maps and institutional affiliations.

