Article

Assessment of the Local and Global Stability of the Luzzone Arch Dam Including Visualisation of the Data Analysis

1
School of Civil Engineering, The University of Sydney, Sydney, NSW 2006, Australia
2
Faculty of Built Environment, The University of New South Wales, Sydney, NSW 2052, Australia
*
Author to whom correspondence should be addressed.
Sustainability 2021, 13(7), 4062; https://doi.org/10.3390/su13074062
Submission received: 8 January 2021 / Revised: 24 March 2021 / Accepted: 25 March 2021 / Published: 6 April 2021

Abstract

:
This study investigates the local and global stability of the Luzzone Dam. Two finite element models were built; one with foundation rock, the other without. The purpose of this was to demonstrate a potential gulf between rigid connection modelling, and rock–structure interaction (RSI). Strand7 is not a traditional geotechnical finite element model (FEM) program, though performed well when modelling radial displacement on the Luzzone Dam. Generally, the percentage between a rigid base and RSI model displacement was 10%. This result was validated against previous numerical models on the structure. Static loads produced a radial displacement on the crown structure of 9.01 cm. Uneven stress distributions at the base of the structure were shown to be the most unpredictable result. With rigid base connections, these loads produced peak tensile stresses of 10.7 MPa. This was greater than its dynamic counterpart, asking questions about fully fixed restraints. It is noted that this is above yield and should be investigated further. Special attention will be devoted to determining the failure criteria in the simulated dams to suggest better practical guide lines for the practical engineers on site.

1. Introduction

Several factors dictate the safety and adequacy of a dam structure, allowing appropriate uniqueness to each application. Storage reservoirs are often subjected to continual safety evaluations from governing authorities, verifying suitability to their intended design purpose—avoiding detrimental failure. The Swiss Federal Office of Energy regularly publishes guideline documentation relating to seismic action [1]. This is completed to ensure correct analyses are being conducted on the 206 dams located in Switzerland. Luzzone Dam is a unique arch-shaped reservoir constructed in one of these localities; being potentially exposed to critical seismic action. This seismic activity comes with associated safety risks, leading to an international benchmark on the numerical methods of seismic dam safety [2]. The structural behaviour of dams such as Luzzone is dictated by geometric formulators, also relative loading characteristics on the structure. Commonly, dam walls have significant imposed static loading due to hydrostatic pressure, along with other forces such as silt pressure, and thermal gradients [3]. Considering this, generally the dynamic response is the most critical parameter in the global stability of a dam structure [4]. Properly quantifying dynamic response requires an understanding of local geological conditions [5]. Correctly modelling the rock–structure interaction (RSI) can be challenging, particularly as geotechnical conditions worsen [6]. Typically, factors of safety are the most useful indicators for the analysis of large structures. The safety factors for concrete dams usually encompass displacement and critical stress limits for the concrete or foundation interface. Plausibly this acts as a reference for further safety analyses. Quantifying these factors of safety can be difficult, as design factors are frequently far more conservative than required [7]. Safety factors are critical in providing a leverage in unfavourable circumstances. With the implementation of mass retaining water structures such as the Luzzone dam, it is essential a compound approach is taken to ensure it is fit for its intended purpose. The Luzzone Dam is in the southeastern part of Switzerland. It is a double curvature arched dam which was constructed in the 1960s, then heightened in the 1990s. The dam offers engineering challenges, being of interest to dam engineering professionals. The dam’s structure was originally designed as an arch dam of parabolic layout, until an incident occurred on the left bank of the dam, where several decompressed joints opened, resulting in instability. These instabilities caused alterations to the dam’s geometrical definition and abutment stability. A dynamic analysis of the Luzzone dam, in accordance with the Swiss Directives is required. This allows for an evaluation and verification of the seismic safety of the arch dam, primarily by checking its global and local stability. Maximum tensile and compressive stresses have been determined using three dynamic load combinations, along with static conditions. Two finite element models (FEM) have been developed in Strand7 to achieve this. The aim of this report is to develop a FEM that accurately represents the dam structure, geology, and loading conditions; along with structural analysis regarding tensile stress and local stability. Another key objective is to assess the local and global stability of the dam structure and foundation rock.

2. Materials and Methods

2.1. Dam Wall and Foundation Geological Setting

The parameters of the dam, concrete and foundation rock are assumed to behave in a linear-elastic way and are shown in Table 1. The fluid is assumed to have density of 1000 kg/m3 and sound velocity of 1440 m/s.
The arch dam’s shape is defined by parabolic curves in the horizontal and vertical direction, with the arches increasing in thickness in the direction of the abutments. The as-built drawings and the topographic site plans have been used to create the geometric model of the dam. From this, the arch dam’s dimensions were determined to have a crest length of 510 m, a maximum height of 225 m, also a crown section thickness ranging from 4.55 m to 36 m. The foundation model has a domain which extends from the dam to a length of 760 m, a width of 1200 m, and thickness of 345 m below the lowest point of the dam base.

2.2. Strand7 Model

2.2.1. Elements

The arch dam wall utilises the near exact geometry of the surveyed Luzzone dam. The foundation structure represents the accurate rock type and size at the location. For this study, two Strand7 finite element models of the structure were developed. The first model composed was an isolated concrete dam structure used to purely examine the behavioural aspects of the concrete (Figure 1 and Figure 2). It acts as a benchmark to quantify how the rock–structure interaction (RSI) is behaving when compared to a fully restrained base. The second model included the massless supporting foundation, purposely built for global stability and dynamic analysis (Figure 3 and Figure 4).
In both Strand7 finite element models, the structures were built with iso-parametric 20-node rectangular bricks, to idealise the dam’s behavioural properties. Triangular 15-node brick elements were also incorporated to resolve the complex dam geometry. The use of varying 3D brick elements of higher order polynomials was adopted to reduce domain approximation and piecewise polynomial errors in the results [8]. When building the model, the actual element was kept as close to the master element as possible. This aimed to reduce distortion that can cause large computational errors, a result from approximating the integral by Gaussian Quadrature.

2.2.2. Solvers

To fully analyse the complex loading behaviour of the arch dam, a multitude of solver were utilised in Strand7 to accurately assess the structural response. Mainly, the solvers varied based on the required static or dynamic loading of the structure. The following list summarises the use of solvers for the finite element analysis:
  • Linear Static: Principle stresses and displacements.
  • Non-Linear Static: Used as an initial condition in the nonlinear transient dynamic solution.
  • Non-Linear Transient Dynamic: Used to calculate the time history of the dynamic response under a forcing function.
  • Natural Frequency: Oscillation natural mode shapes of the dam.
  • Spectral Response: Dynamic loading response and mass participation.
  • Steady State Heat: Thermal gradient used for grout temperatures.

2.3. Model Parameters

2.3.1. Static Loading

The dam wall is subjected to a combination of individual static loading conditions. These loads are subject to the most dominant forces that effect the global and local stability. For the finite element analysis of the dam, these forces include self-weight, hydrostatic pressure, silt pressure, and thermal gradients with respect to grouted joints (Figure 5).
  • Self-Weight
The self-weight was analysed with consideration of the four construction phases of the dam wall (1960, 1961, 1962, and the 1999 height extension). The dam was modelled with isotropic elements to reflect the concrete joints during these phases.
  • Hydrostatic Pressure
The dam wall is subject to a hydrostatic pressure on the upstream wall for a maximum nominal operating height of 1606 m above sea level. This hydrostatic pressure is applied to all faces of the upstream wall that share an interface with the water level, as shown in Figure 6. of the finite element model.
  • Silt Pressure
The sedimentary deposits of saturated silt against the dam provides a horizontal force on the upstream wall. For a silt elevation of 1440 m above sea level, the force on the dam is taken with an effective density of the silt at 400 kg/m3 (buoyant).
  • Thermal Gradients
Temperature gradients of both the upstream and downstream walls were considered with respect to the grouting temperature. Changes relative to the temperature of the grouting may typically produce residual stresses in the structural joints in summer and winter expansions and contractions. Dam face temperatures and the thermal gradient at the cross section are outlined below (See Figure 7 and Figure 8).

2.3.2. Dynamic Loading Conditions

  • Peak Ground Acceleration
Following guidelines that correspond with the dam locality, safety should be confirmed for an earthquake return period of 10,000 years. This is due to the foundation being sound rock, classified as Class A [9]. The dependent parameter peak ground acceleration (PGA), is the amplitude of the largest peak acceleration registered at a location on the accelerogram [10]. In the region of Ticino, the Seismic Intensity Map corresponds to 7.7 on the MSK Scale. As outlined by OFEG [2], both the horizontal and vertical PGA can be defined.
l o g a h = 0.26 ( I m s k ) + 0.19
a h = 1.56   ( m s 2 ) = 0.16 g
Following ICOLD [1] the vertical direction is assumed 2/3 of ah.
a h = 1.04   ( m s 2 ) = 0.106 g
  • Response spectrum of the dam and acceleration time histories
Quantifying the response of the structural system through time is an important consideration in engineering design, with the peak response generally studied [3,10]. Swiss guidelines state that the site-specific design spectrum is ζ = 5%. More exhaustive details on this assumption can be found in OFEG [1]. By defining the site-specific spectrum, compatible acceleration time histories (ATH) can be derived. Following the work from ICOLD [11], three sets of stochastically independent time histories will be used in this analysis. Figure 9 below shows ATH1, with its corresponding directional components.

3. Results

3.1. Static Linear-Elastic Model, Fully Restrained

An analysis was conducted on the dam structure with a fully restrained base, having no foundation. Static loads on the dam wall are typically the most common forces on the retaining structure. For the Luzzone dam, a combination of self-weight, hydrostatic pressure, silt pressure, and grout temperature stresses are studied as a combined load case.

3.1.1. Stresses

To accurately assess the structural response of the dam wall, the minimal and maximal principal stresses are examined to determine the behavioural stress concentrations. The stress Figure 10 and Figure 11 below outline the principal stress envelopes of the dam wall.
The maximum stresses in the structure are found at the lower base of the upstream wall. More specifically, a stress of 9.25 MPa is localised around the lower interface between the concrete and rock/foundation. Further from this, both the upstream and downstream faces around the centre have stable and consistent maximal stress envelopes that range between 0–1 MPa.
As shown in Figure 12 and Figure 13, the minimal stress envelops typically have more variation than the maximal stresses on the dam wall. With the largest minimal stress of -10.7 MPa, a significant portion of the force is concentric around the lower downstream wall. Due to the parabolic shape of the dam, the load paths of the applied forces are typically resolved around the lower downstream interfaces. On the upstream wall, the centre portion of the dam outlines a tensile stress concentration of -6.3 MPa at the cantilever. As identified in Figure 14, the tensile stresses at the cantilever do not exceed this force for the centre cross section.

3.1.2. Displacement

Under the static loading combinations, the dam wall radial displacement peaked at 9.87 cm at the top of the central cantilever. The dam concaves outward from the downstream wall typically due to the hydrostatic and silt pressures on the upstream wall. Figure 15 and Figure 16 outlines the extent of the displacement on the dam wall.

3.2. Dynamic Analysis with RSI

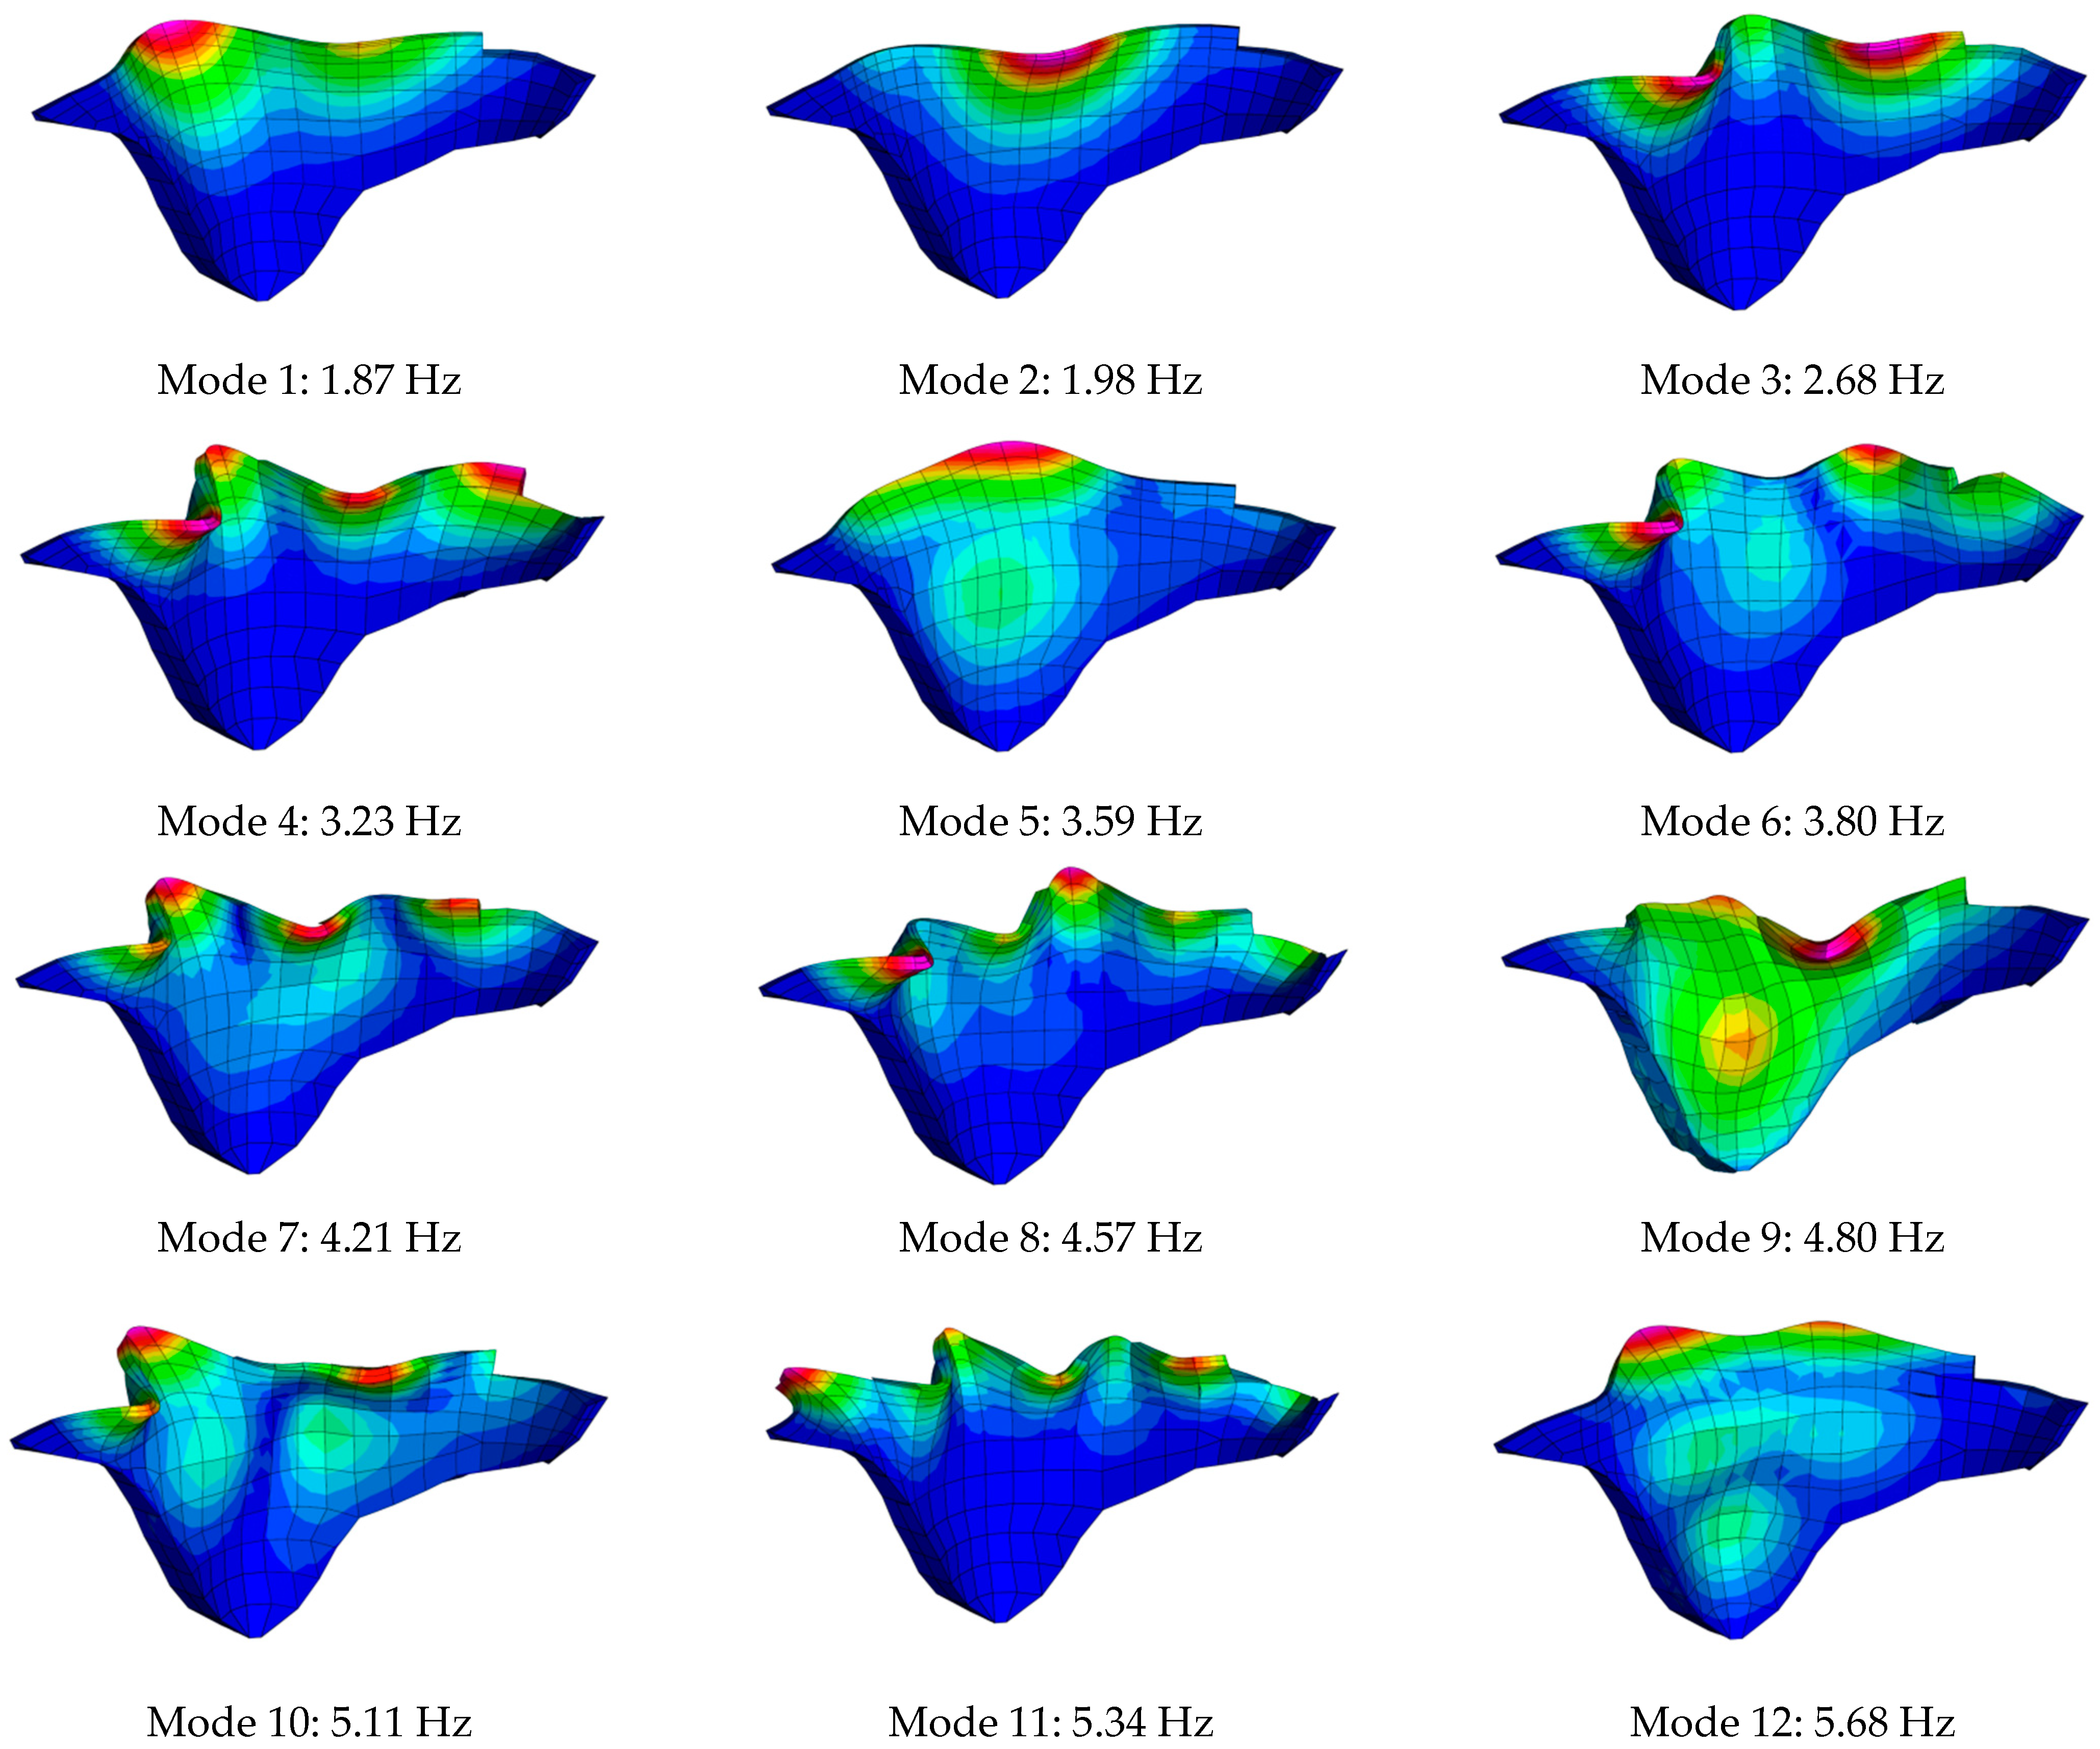
3.2.1. Natural Frequency and Mode Shapes

To determine the natural frequencies and mode shapes of the dam and foundation retaining system, a spectral response analysis is required. The first twelve modes of undamped free vibrations of the arch dam structure are outlined in Figure 17. Respectively, it is the effective mass participation of the frequencies that dictates the most significant eigenfrequency of the dam. It is seen from Table 2 modes 9, and 10 are the largest contributors to the total mass participation of 80.536%. This is generally attributed to the symmetry of the eigenfrequencies in these cases. Typically, a lower participation of the modal masses provides a more accurate modal analysis result. By principle, a global behaviour below 90% total mass is considered a satisfactory approximation.

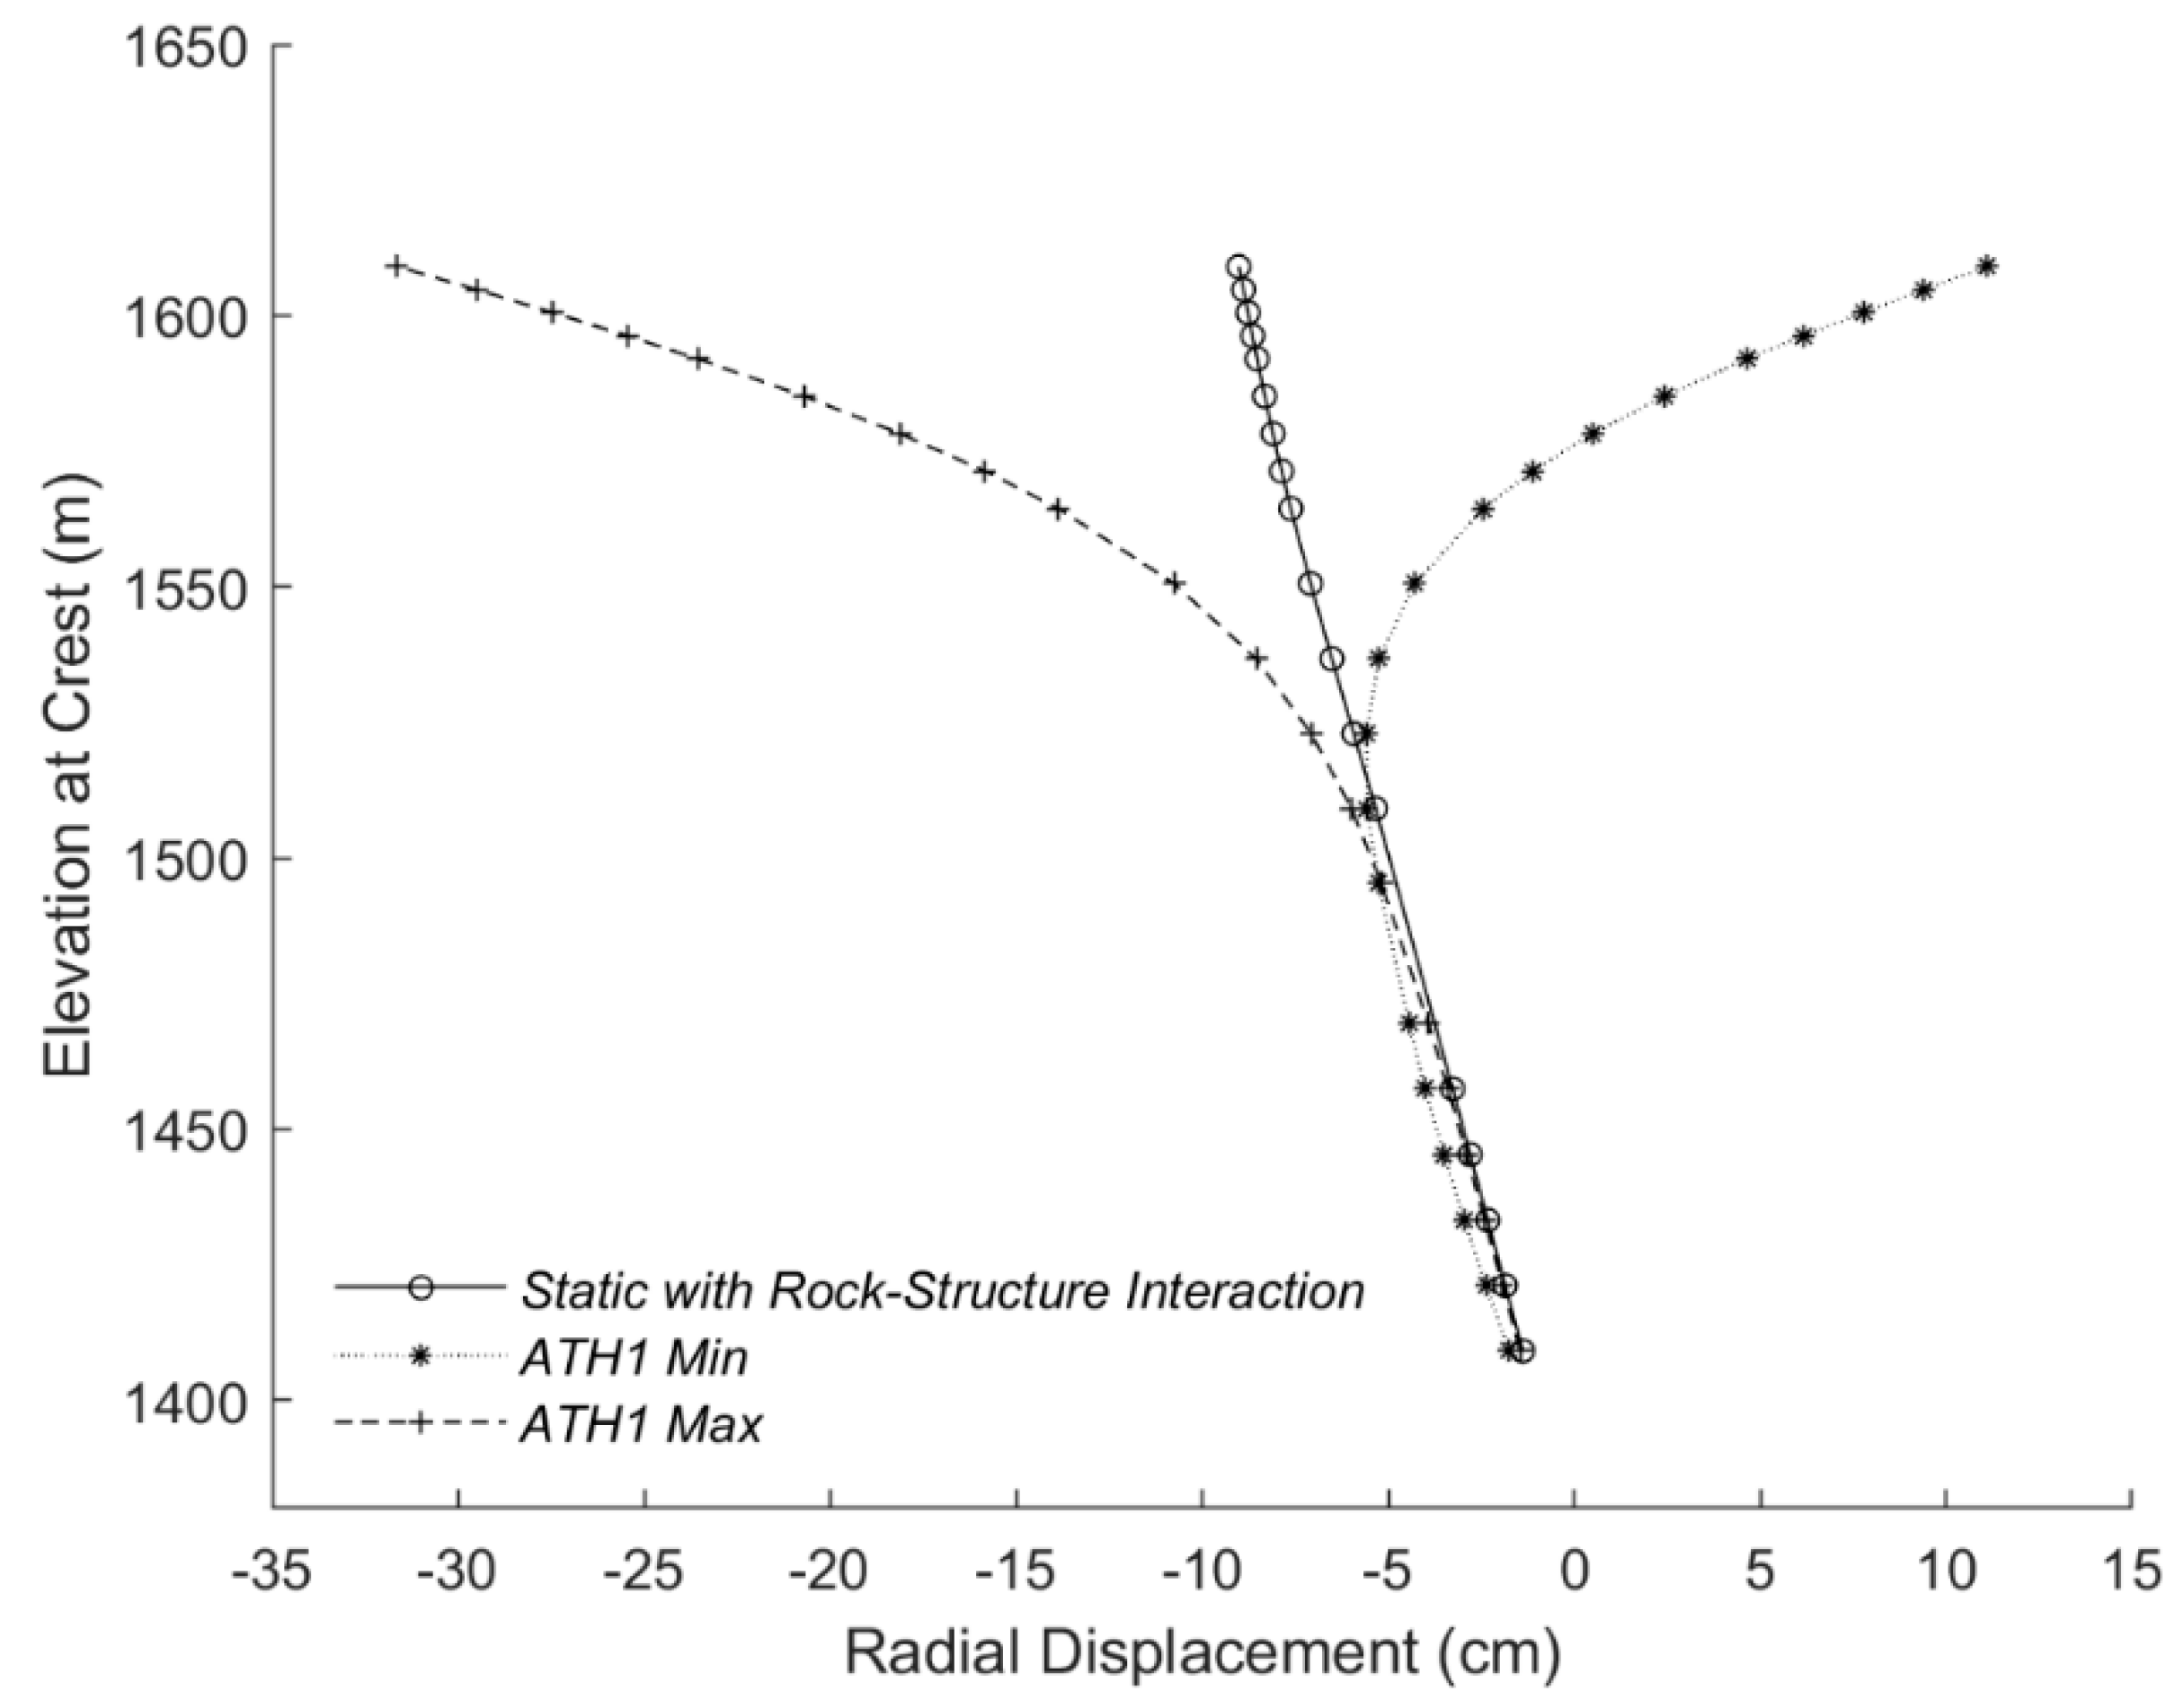
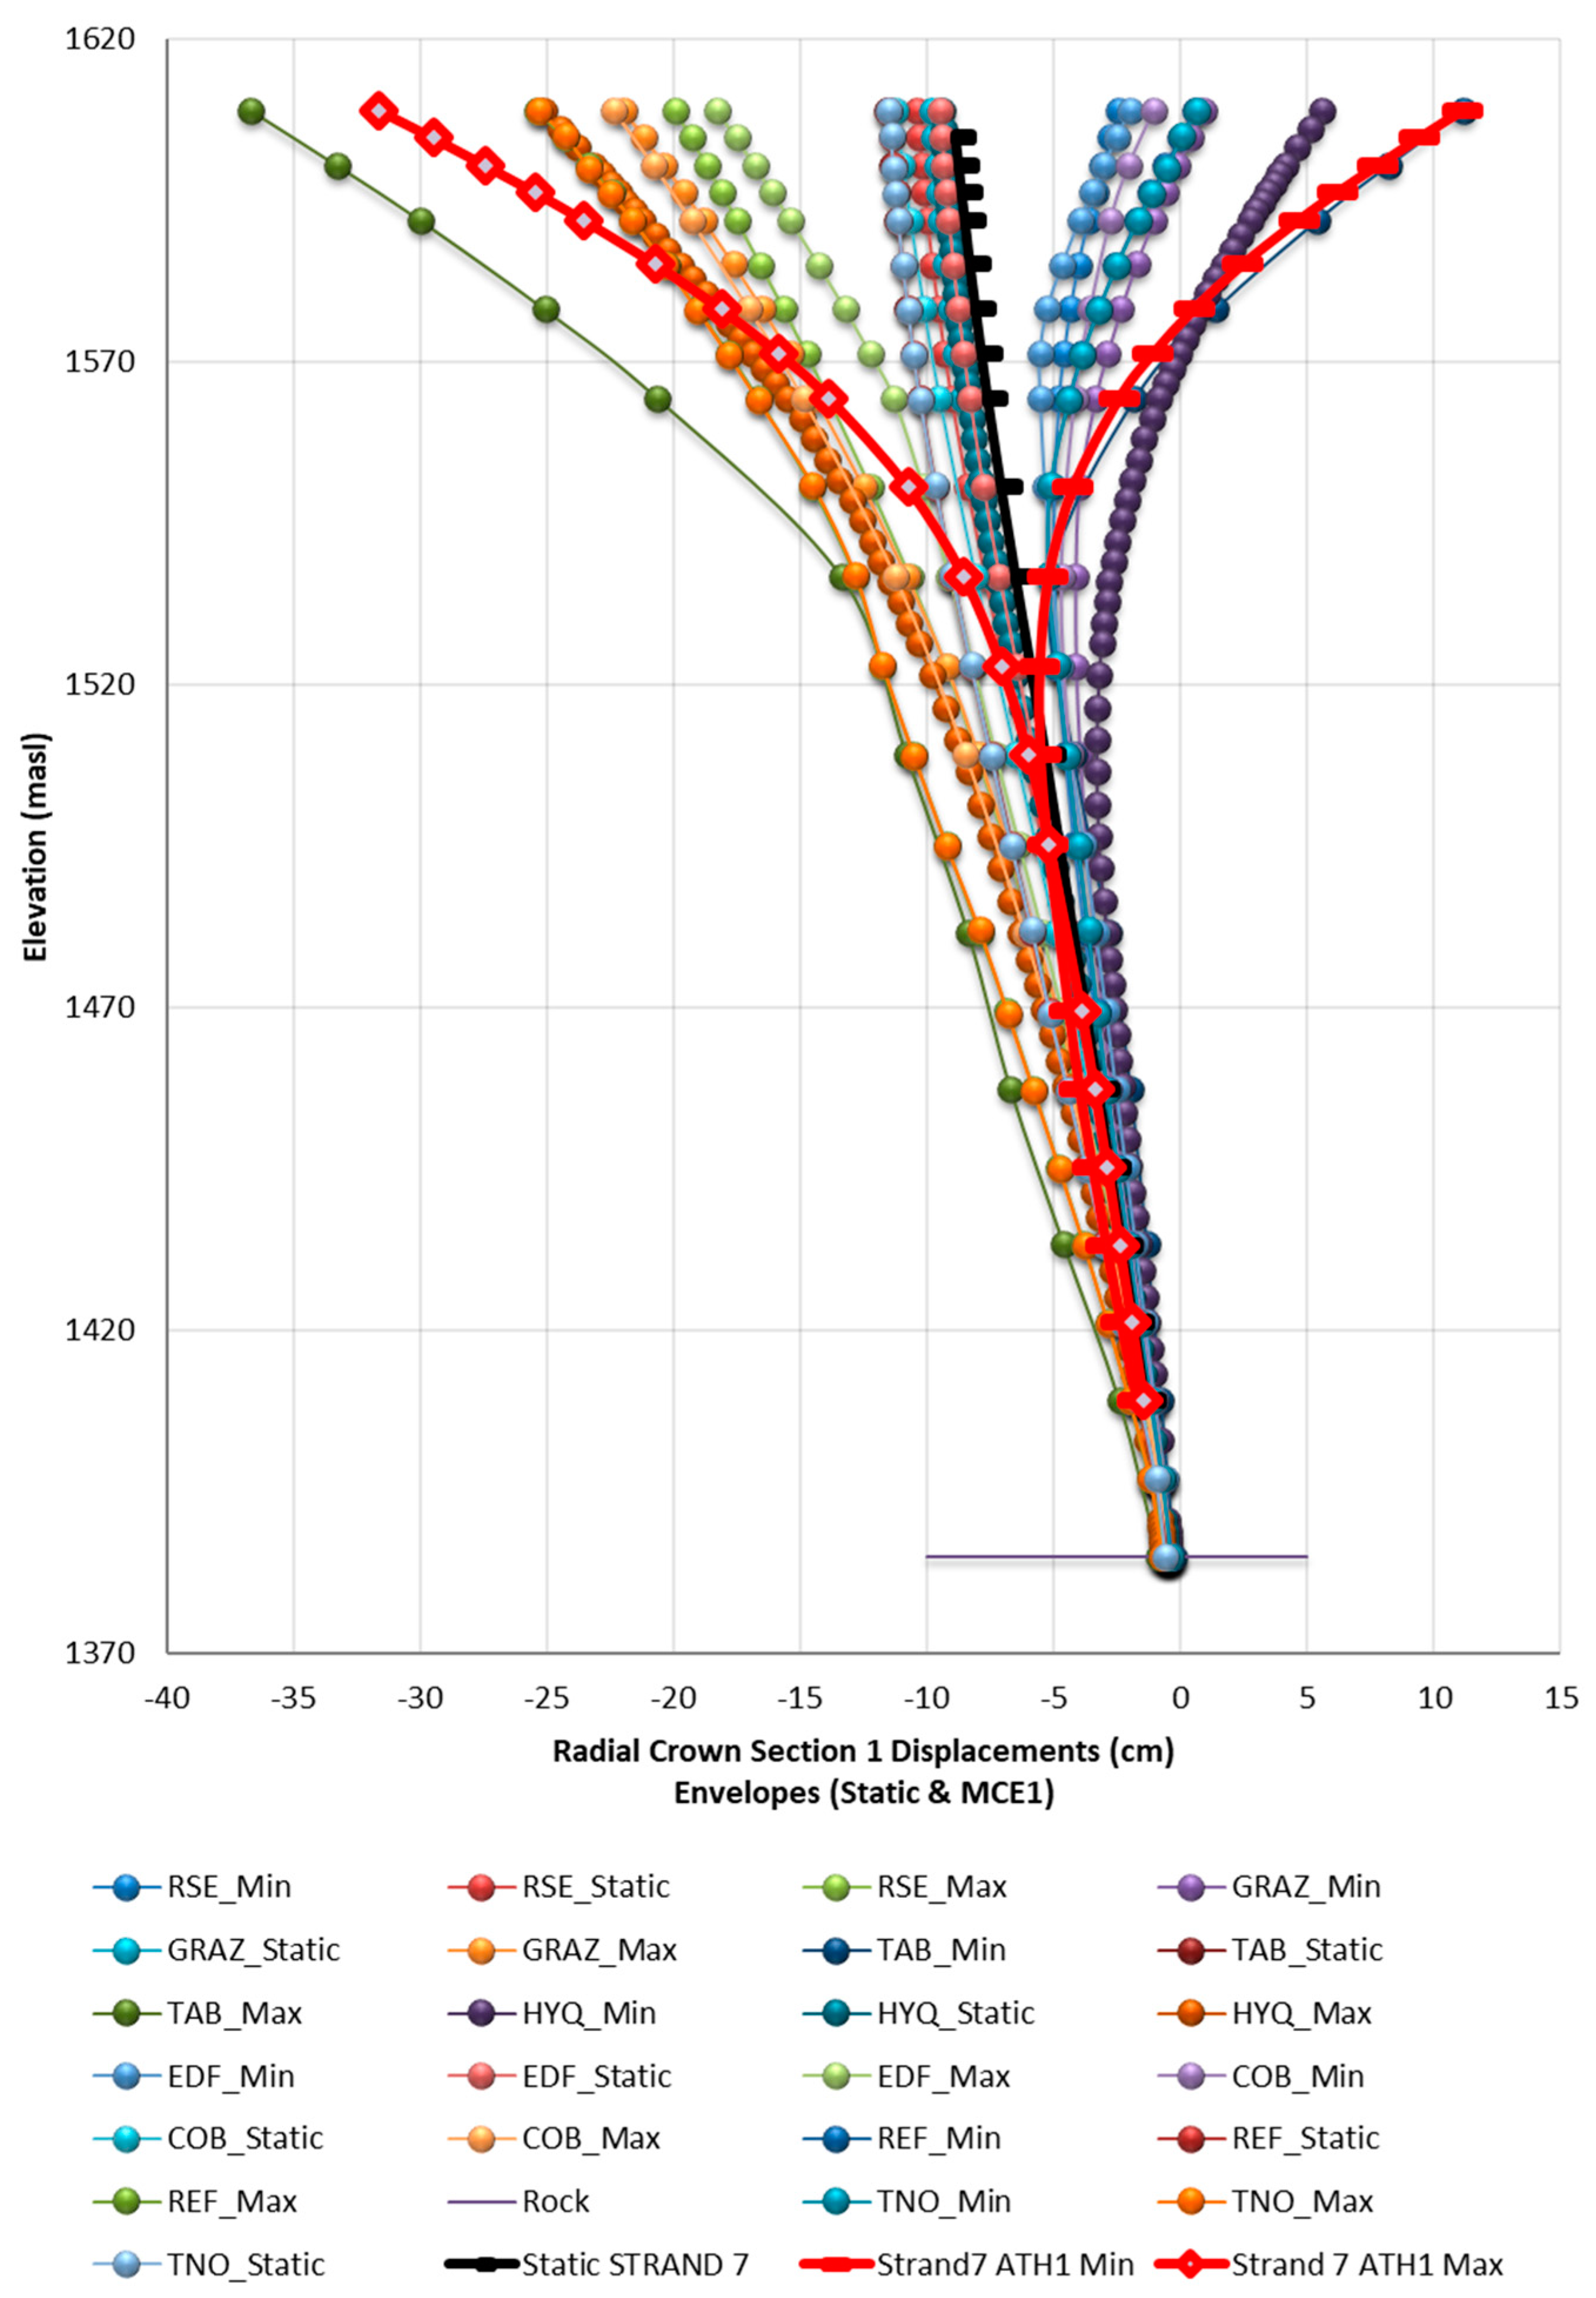
3.2.2. Displacement Envelopes

The dynamic analysis was conducted, running the nonlinear static solver, and then the nonlinear transient dynamic solver. Figure 18 shows the static, maximum, and minimum dynamic displacement envelopes, for the critical ATH1 case. The results show the static analysis is almost linear, with an absolute peak of 9.01 cm. For this analysis, centimetres have been used, generally due to most of the corresponding literature aligning with this. The dam exhibits sharp deflection downstream beginning at 1530 m elevation. The minimum and maximum envelope under seismic action are almost symmetrical, though understandably the downstream deflection is greatest at 31.2 cm. These dynamic displacements occurred 5.01 s and 19.2 s, respective for minimum and maximum. The 3072 steps at 0.01 s intervals produced a thick band of data that occupied the space in between the maximal and minimal, hence it has not been plotted.

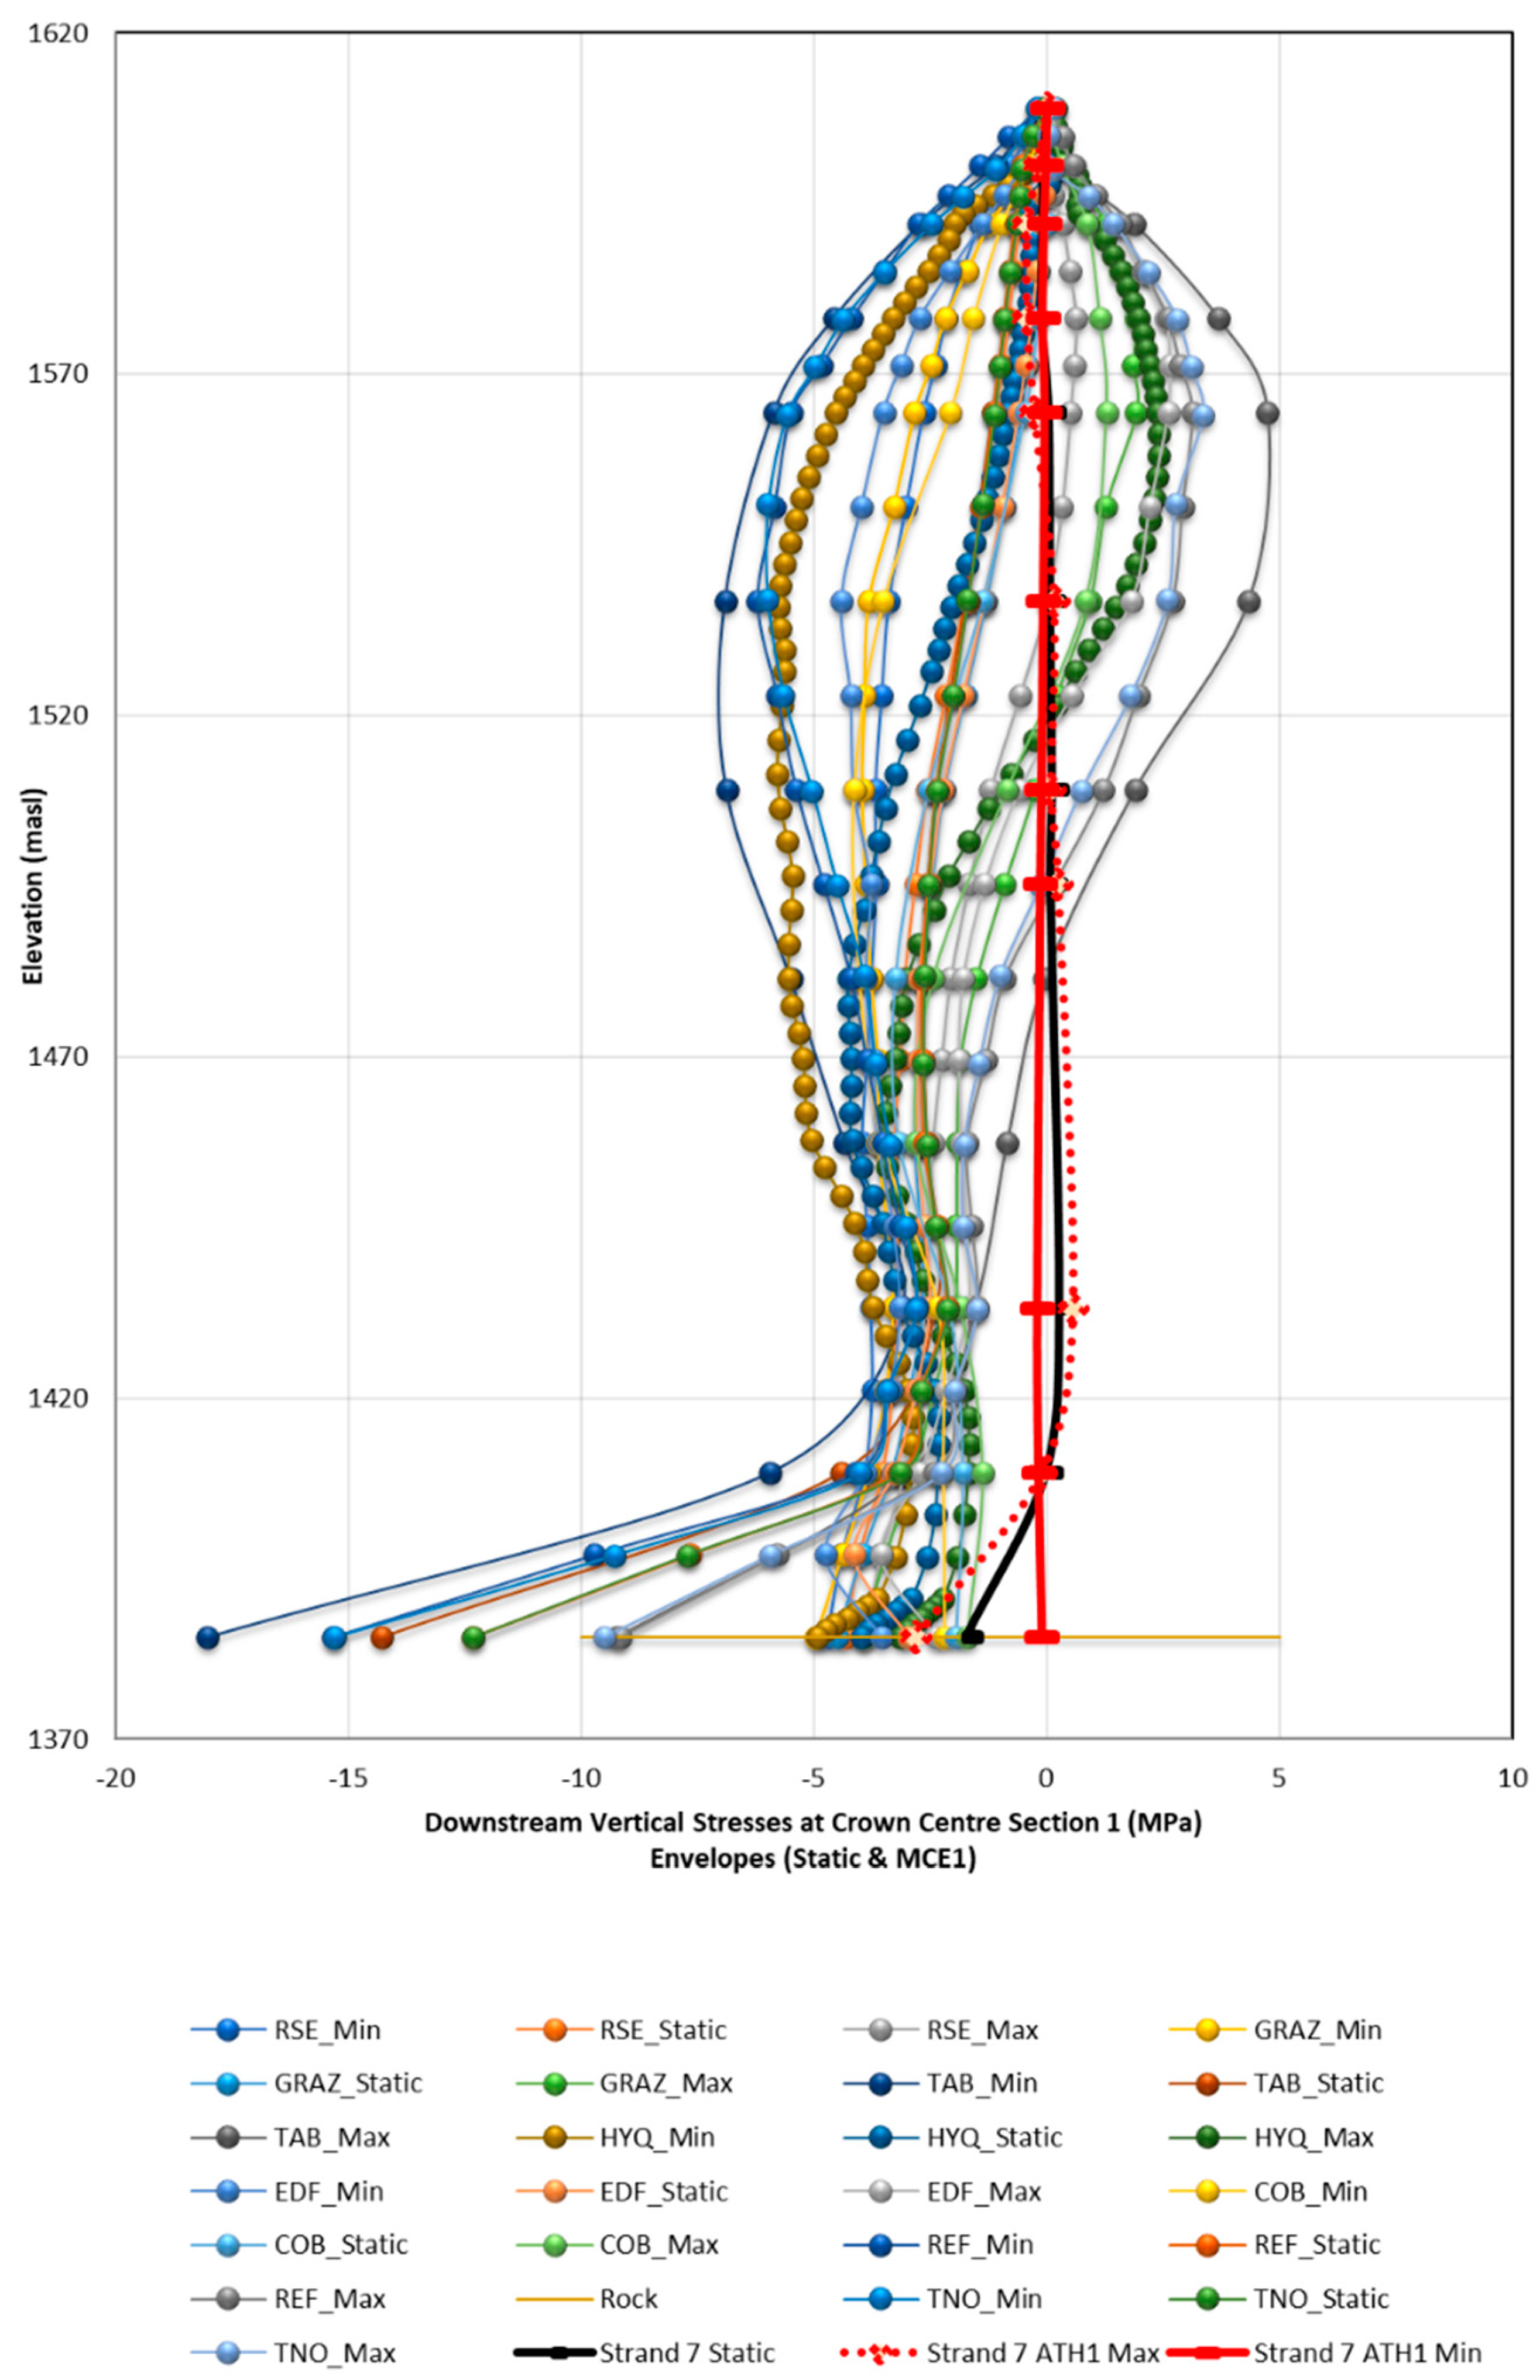
3.2.3. Stress Envelopes

The results from executing the dynamic stress analysis are shown in Figure 19 above, displaying the downstream vertical stress at the centre crown. As the elevation decreases, the geometry becomes more complex, funnelling into a small zone of Schist basement. Stress concentrations are directed towards the RSI, becoming more erratic as the foundation connection occurs. The slow increase in tensile stress coincides with these complex joins in materials. It reaches a peak of 2.83 MPa tension at the lowest brick in the structure, calculated at the Gauss Point. Understandably, these tensile base stresses would become significant as the structure bends under combined actions. Some of these values are close to tensile yield, which demands more attention. The reinforcement arrangement is not known in the structure. The compressive stresses are minimal when factoring in the concrete’s capability in compression.

4. Discussion

4.1. Static Loading Fixed Restraints vs. RSI

Key to this numerical analysis was identifying the merits of fully fixing restraints, compared to modelling RSI. When considering the local stability of the dam under static loading, significant sections of the upstream face provided large tensile stresses at the base, without the rock interface included. More specifically, in the left and right banks of the lower portion of the dam, tensile stress concentrations typically exceeded the allowable stresses in the concrete by nearly 3 MPa. The nonuniform stress distribution at the base connection was the key differentiator, with displacement between models being within a close 9% of each other.
Generally, these high stresses are attributed to the stiffness of the restraints used in the model for the arch dam that did not include the foundation rock. With respect to the complexity of the dam and foundation interface, a vertically integrated model that realistically captures the true restraints only for the arch dam is largely inconceivable. When the structure was assessed with a composite foundation in the model, a more accurate structural behaviour was observed that resolved localised tensile behaviours. Globally, the dam was well below the compressive strength limits of the old and new concrete sections and did not exceed a displacement of 10 cm at the central cantilever.

4.2. Displacement Envelopes

The displacement envelopes shown in Figure 20 are a meta-analysis on an identical cross section to Figure 13. This compares the STRAND7 model to RSE [7], GRAZ [12], LNEC [12], and HQY [3]. When comparing the output from the Strand7 model, the results are similar. Similar displacement patterns to the Strand 7 [4] model occur in the work of Oliveira [12]. The STRAND7 maximal and minimal dynamic displacements follow a similar shape to the above authors. This is surprising, generally due to this program not being conducive to modelling rock–structure interaction or soil–structure interaction. The model merely reflects a bonded connection, with differing stiffness values. More investigation would need to be completed to determine the validity of this result.

4.3. Stress Envelopes

The downstream vertical stress from meta-analysis discussed above is shown in Figure 21. The correlations with RSE [7], GRAZ [12], LNEC [12], and HQY [3], are reasonable, but not to the same accuracy as displacement. Figure 22 below shows the stress experienced in the system 27.09 s into loading.
The stress distributions show signs of computational error, even though due process has been taken. The geometry is complex connecting the geology to the dam. It highlights the complexities of numerical modelling—particularly connecting to rock, and how stress flows between this interaction. Results shown in Figure 22 demonstrate a need for more model refinement.

5. Conclusions

Two FEMs were built in Strand7 to model the Luzzone Dam where one of the models with a foundation, on the other hand, another model without simulating foundation. These models demonstrated that rigid base connections led to an over the computation of tensile stress on the base of Luzzone Dam. Whilst not traditionally a program that models RSI or SSI well, STRAND7 [4] appropriately performed when modelling displacement values. Generally, the percentage between a rigid base and RSI were 10%. These values aligned well in distribution with published literature on the Luzzone Dam, though the stress envelopes were not adequate, and needed more model refinement.
Signs with displacements were encouraging, though. Under rigid and static loads, the structure experienced a maximum radial displacement of 9.01 cm at the top of the central cantilever. Though, these loads also produced peak tensile stresses of 10.7 MPa. This is greater than its dynamic counterpart, asking questions about fully fixed restraints. It is noted that this is above yield and should be investigated further.
The dynamic loading involved three spectrum compatible acceleration histories, giving rise to a maximal radial displacement of 31.2 cm. Peak vertical stress for these loading conditions was 2.83 MPa tension, forging closer to the tensile yield stress of concrete. Almost all authors that have studied the Luzzone Dam have mainly focused on hoop stress. Regrettably, this is not easily obtained in brick structures in Strand7 [4].
Further research should be involved to use of Abaqus [5] for simulation. By using ABAQUS [5] it would be possible to simulate the complex rock–structure interaction. Thus, the full stress–time and displacement–time histories could not be presented due to the lack of computational power. In a more expanded study, sliding and overturning should be assessed following Gilani [13].

Author Contributions

Conceptualization: F.T., R.D., O.E., D.K., S.S. and F.A.M.; Literature review: Research Method: All authors; Software: R.D., O.E. and D.K., Drafting the article based on the numerical reports: F.T., R.D., O.E., D.K. and S.S., Resources and interpretation: F.T., S.S. and F.A.M. All authors have read and agreed to the published version of the manuscript.

Funding

This research received no external funding.

Institutional Review Board Statement

Not applicable.

Informed Consent Statement

Not applicable.

Acknowledgments

Authors would like to express the deepest appreciation to the University of New South Wales and the University of Sydney to provide convenient places and resources to undertake the current research.

Conflicts of Interest

The authors declare no conflict of interest.

References

  1. OFEG. Sécurité des Ouvrages D’accumulation—Documentation de Base pour la Vérification des Ouvrages D’accumulation aux Séismesde l’OFEG. de l’OFEG, Série Eaux; Version 1.2; Departement für Umwelt, Verkehr, Energie und Kommunikation UVEK: Ittigen, Switzerland, 2003.
  2. Wiemer, S.; Giardini, D.; Fäh, D.; Deichmann, N.; Sellami, S. Probabilistic seismic hazard assessment of Switzerland: Best estimates and uncertainties. J. Seism. 2009, 13, 449. [Google Scholar] [CrossRef] [Green Version]
  3. Roth, S.-N.; Roberge, M. Seismic Safety Assessment of the Luzzone Arch Dam. In Proceedings of the 13th International Benchmark Workshop on Numerical Analysis of Dams, Lausanne, Switzerland, 9–11 September 2015. [Google Scholar]
  4. Fouque, J.R.E. Seismic safety evaluation of a concrete dam based on guidelines. In Proceedings of the 13th ICOLD International Benchmark Workshop on the Numerical Analysis of Dams, Lausanne, Switzerland, 9–11 September 2015. [Google Scholar]
  5. Dumanoglu, A.; Severn, R. Dynamic Response of Dams and other Structures to Differential Ground Motions. Proc. Inst. Civ. Eng. 1984, 77, 333–352. [Google Scholar]
  6. Wang, X.; Chen, J.; Zhang, Y.; Xiao, M. Seismic responses and damage mechanisms of the structure in the portal section of a hydraulic tunnel in rock. Soil Dyn. Earthq. Eng. 2019, 123, 205–216. [Google Scholar] [CrossRef]
  7. Faggiani, G.M.P. Seismic Safety Assessment of Luzzone Dam Finite element Modelling. In Proceedings of the 13th ICOLD International Benchmark Workshop on the Numerical Analysis of Dams Workshop, Lausanne, Switzerland, 9–11 September 2015. [Google Scholar]
  8. Alonso-Marroquin, F. Finite Element Modelling for Civil Engineering; Quantumfi Publishers: Sydney, Australia, 2016. [Google Scholar]
  9. Mellal, A.; Tzenkov, A. Seismic Safety Assessment of a Weir Dam and Appurtenant Structures-3D Static and Dynamic Analyses. In Proceedings of the 15th World Conference on Earthquake Engineering 2012, Lisbon, Portugal, 24–28 September 2012. [Google Scholar]
  10. Douglas, J. Earthquake ground motion estimation using strong-motion records: A review of equations for the estimation of peak ground acceleration and response spectral ordinates. Earth Sci. Rev. 2003, 61, 43–104. [Google Scholar] [CrossRef] [Green Version]
  11. ICOLD. Benchmark Workshop on the Numerical Analysis of Dams. In Proceedings of the International Commission on Large Dams, Lausanne, Switzerland, 9–11 September 2015. [Google Scholar]
  12. Oliveira, S.; Alegre, A.; Silvestre, A.; Espada, M.; Câmara, R. Seismic safety evaluation of Luzzone dam. Use of a 3DFEM state formulation in pressures and displacements. In Proceedings of the 13th ICOLD Internacional Benchmark Workshop on Numerical Analysis of Dams, EPFL, Lausanne, Switzerland, 9–11 September 2015. [Google Scholar]
  13. Gilani, M.S.; Feldbacher, R.; Zenz, G. Stability of dam abutment including seismic loading. In Proceedings of the 10th Benchmark Workshop on Numerical Analysis of Dam, ICOLD, Paris, France, 16–18 September 2009; pp. 16–18. [Google Scholar]
Figure 1. Dam wall isometric 1.
Sustainability 13 04062 g001
Figure 2. Dam wall isometric 2.
Sustainability 13 04062 g002
Figure 3. Dam and foundation isometric 1.
Sustainability 13 04062 g003
Figure 4. Dam and foundation isometric 2.
Sustainability 13 04062 g004
Figure 5. Luzzone dam construction phases.
Sustainability 13 04062 g005
Figure 6. Hydrostatic pressure on upstream wall.
Sustainability 13 04062 g006
Figure 7. Applied temperatures on dam faces.
Sustainability 13 04062 g007
Figure 8. Temperature gradient at cross section.
Sustainability 13 04062 g008
Figure 9. Set 1 of 3 independent acceleration time histories used for dynamic loading. Shown are the three major directions for ATH1.
Sustainability 13 04062 g009
Figure 10. Upstream maximal stress envelopes (σ1).
Sustainability 13 04062 g010
Figure 11. Downstream maximal stress envelopes (σ1).
Sustainability 13 04062 g011
Figure 12. Upstream minimal stress envelopes (σ3).
Sustainability 13 04062 g012
Figure 13. Downstream minimal stress envelopes (σ3).
Sustainability 13 04062 g013
Figure 14. Centre cross section upstream face stresses.
Sustainability 13 04062 g014
Figure 15. Static loading radial displacement (DY).
Sustainability 13 04062 g015
Figure 16. Static loading combined displacement (DXYZ).
Sustainability 13 04062 g016
Figure 17. Mode Shapes.
Sustainability 13 04062 g017
Figure 18. Static, along with maximal and minimal dynamic radial displacements for the dam-foundation system. ATH1 proved critical, hence it is plotted.
Sustainability 13 04062 g018
Figure 19. Maximum upstream vertical stress along the crest cross section under dynamic loading.
Sustainability 13 04062 g019
Figure 20. Results from ICOLD [1], when compared to the STRAND7 model.
Sustainability 13 04062 g020
Figure 21. Stress envelope results from ICOLD [1], when compared to the STRAND7 Model.
Sustainability 13 04062 g021
Figure 22. Stress distribution at 27.09 s into dynamic loading under the ATH1 regime.
Sustainability 13 04062 g022
Table 1. The material parameters used are based on ICOLD [1].
ParameterRock MassOld ConcreteNew Concrete
Static elastic modulus (MPa)18,60020,00018,000
Dynamic elastic modulus (MPa)23,30025,00022,500
Poisson’s ratio0.200.180.18
Density (kg/m3)025002400
Static compressive strength (MPa)-3832
Dynamic compressive strength (MPa)-5748
Static tensile strength (MPa)-32.3
Dynamic tensile strength (MPa)-43.5
Table 2. Spectral response modal participation factors.
ModeSpectral ValueExcitationAmplitudeParticipation (%)
11.90506379506957490.782
21.98726869309316771.611
32.43793141306764761.918
42.5742421004495951.681
52.51149300005643214.028
62.51166789005107424.152
72.5832066402965952.111
82.5606899601842251.123
92.5423083800116276154.589
102.51544943003745897.279
112.5460673701023700.647
122.544874870882290.614
Total Mass Change 80.536%
Publisher’s Note: MDPI stays neutral with regard to jurisdictional claims in published maps and institutional affiliations.

