1. Introduction
In today’s transportation industry, there is a large operational gap between private end-to-end services such as taxis (We note that the taxi market is often highly regulated and in some cases, taxi companies are government-owned. Due to these reasons, some authors consider taxis as part of public transportation. Nevertheless, for the purposes of the current work, we believe the important distinction is along the lines presented here.) and ride-sharing, and fixed-route public transportation such as buses and subways [
1,
2]. While the former provide more convenience for passengers and usually a significantly shorter travel time at a higher price, the latter operate on inflexible schedules and routes, with many intermediate stops that slow down the service, but at a significantly lower cost. In many countries, government policies in the past decades have favored private transportation by ensuring low fuel prices and investing in road infrastructure, despite the increasing evidence of the significant societal cost of private transportation, up to 28 times higher than public transportation [
3]. Due to the large increase of vehicles on roads, cities around the world face significant problems due to congestion; in peak hours, public transportation options can provide a shorter travel time when separated from general traffic [
4].
Recently, disruptive changes caused by the emergence of Transportation Network Companies (TNCs), such as Uber, DiDi or Grab contributed to an increase in congestion in cites across the world [
5]. While originally perceived as competitors to taxis [
6,
7], it soon became apparent that TNCs serve as competitors to public transportation as well [
8,
9,
10]. With the expected availability of Autonomous Vehicles (AVs) in the near future [
11,
12,
13], congestion trends are likely to continue at an increased pace. Eliminating drivers’ salary can result in Autonomous Mobility On Demand (AMOD) services becoming dramatically cheaper than services with human drivers today [
14,
15], raising concerns if public transportation can remain competitive at all [
16]. A shift to AMOD from public transportation can have drastic effects in terms of congestion and total energy use, even if we account for more efficient traffic flows [
17] and greener drive-chain technologies [
18,
19]. At the same time, these cost savings will allow public transportation operators to explore innovative in-between solutions with new vehicle form factors to provide increased level of service for commuters without increasing costs [
20,
21]. Still, it is yet unclear what role will AVs play in the future of transportation. Previous research has considered cases of individually owned AVs [
16,
22,
23,
24,
25], AMOD fleets, both with and without ridesharing [
14,
15,
21], and also using AVs as first- and last-mile transportation options in a close integration with transit [
20,
26,
27].
Given the above concerns, there will be a strong need for policies that limit demand and promote sustainable, shared forms of transportation. Multiple cities have recently started implementing congestion charges and regulation specifically aimed at TNC companies [
5,
28,
29,
30]. At the same time, there is significant research done on proposed new ways of collaboration between AMOD and public transportation [
26,
27,
31]. In this regard, AVs present not only challenges, but opportunities as well: since the cost of operation will be much lower than of human-driven taxis of today [
14,
15], such services will have a lot of flexibility in terms of pricing, giving powerful tools for governments to influence demand and incentivize more sustainable solutions [
32,
33]. Thus, we envision a future where private (i.e., non-shared) on-demand transportation remains a “premium” option, with a large portion of the price being a congestion fee levied by governments, while a flexible array of shared options are presented with the aim to attract both private and public transportation users of today [
1].
In this paper, we investigate the feasibility of an ad-hoc shared transportation option for private and public transportation users. With such a pairing, public transportation passengers can reduce their travel time, while AMOD passengers can be offered discounts; all of this will result in an increase of overall service quality without adding to the traffic volume. The idea of combining different modes of transportation for one trip is not a new one, with Mobility-as-a-Service (MaaS) term denoting exactly that—
bundling different transport means, public and private, into one easy-to-use package for customer [
34]. The potential for MaaS was explored in different countries such as Sweden [
35], Finland [
36] and Germany [
37]. However, most of the existing research on MaaS is assuming that the modes of transportation are chosen before the trip starts and different modes are taken in sequence by the same passenger, while in this paper, we investigate the situation where the matching is done “on the go”, in an opportunistic manner, with faster and more convenient modes substituting for slower ones wherever possible. Moreover, unlike most of the existing work on AVs and public transportation, where AVs are used as a first/last mile solution [
27,
38,
39], we allow the whole public transportation segment to be replaced with a shared trip in an AV.
We note that the sharing scheme proposed in our paper could be implemented even today with taxi and TNC operators instead of AVs. However, currently the cost and pricing structure of taxi and TNC operations are such that implementing the above-mentioned sharing solution makes little economic sense. This way, we only expect this concept to be relevant when AVs become a reality and government actors implement an integrated framework for regulation, pricing and demand management, as outlined above. With that being said, we aim to answer the following two research questions in this paper: (i) what is the percentage of public transportation passengers who could be matched with the private transportation passengers; and (ii) what is the benefit for matched passengers, measured as average travel time savings.
We base our analysis on the current demand of bus and taxi trips; while we acknowledge that introduction of AMOD will alter demand, using the current demand allows us to establish a baseline about the benefits that can be expected without increasing the road traffic. This will be important when considering the relationship between policy choices, future demand scenarios and outcomes. We expect that our methodology can be readily adapted to these scenarios in future works, and comparisons with the current results will help in understanding the benefits and trade-offs of various pricing and policy decisions. In the current work, we present results for two cities (Singapore and Shenzhen, China), showing the potential of generalizability of the concept of partial integration between private and public transportation and the evaluation methodology, at least in the context of Asian metropolises.
The rest of the paper is organized as follows.
Section 2 gives an overview of the datasets used in our analysis. As we are comparing bus and taxi trips for two different cities, we have four different sources describing people’s mobility patterns.
Section 3 describes our methodology, formally defining the matching process between trips and explaining the steps of our analysis in detail.
Section 4 shows our main findings answering the two research questions we pose in this paper, i.e., the percentage of bus trips that can be matched and the average travel time saved for those matched trips. Finally,
Section 5 discusses our results and shows directions for future work.
2. Data
In this paper, we compare the percentage of bus trips that can be shared with taxi trips in two cities, namely Singapore and Shenzhen, China. The taxi dataset for Singapore consists of more than 30 million of taxi trips recorded for 77 consecutive days, a total of 10 weeks. Distribution of the number of taxi trips per each day is given in
Figure A1, where each day in a week is marked with a different color. What we can observe from the figure is that the number of taxi trips is always the largest on Friday and the smallest on Sunday, while between Sunday and Friday the number gradually grows. What is also evident is that there is a little of variance across the observed weeks, with an exception of the second to last week, where Thursday was a public holiday and consequently the number of taxi trips on the preceding Wednesday was higher and on Thursday itself it was significantly lower. From those 10 weeks, we chose the second week as a representative week for the further analysis. In Shenzhen, we used one week of taxi trips as well, that has 3 million trips in total, while in Singapore, we have about 2.8 million trips in the chosen week. Neither dataset includes any personal data of passengers.
Bus trips for Shenzhen were collected during the same week as taxi trips and include tap-in data for 15 million trips in total, made by 6.5 million anonymized passengers who are represented by randomly generated IDs used throughout the data collection period. Using the algorithm developed by Tu et al. [
40], we were able to infer destinations for a total of 3.4 million trips that we use in the following analysis (for a more detailed description, see the
Appendix A). Bus trips for Singapore were generated based on the aggregate counts of bus usage available in the DataMall public interface [
41]. The data is based on smart card tap-in and tap-out events, and includes the hourly total number of bus trips made between any two bus stops in the city over the course of a month, separately counted for weekdays and weekends. In total, we have generated a bit more than 20 million bus trips for one week. We generated daily numbers based on this, assuming a Poisson distribution of individual daily counts and assigned trips in the hourly intervals based on a Poisson distribution of bus arrivals as described in more detail in the
Appendix A.
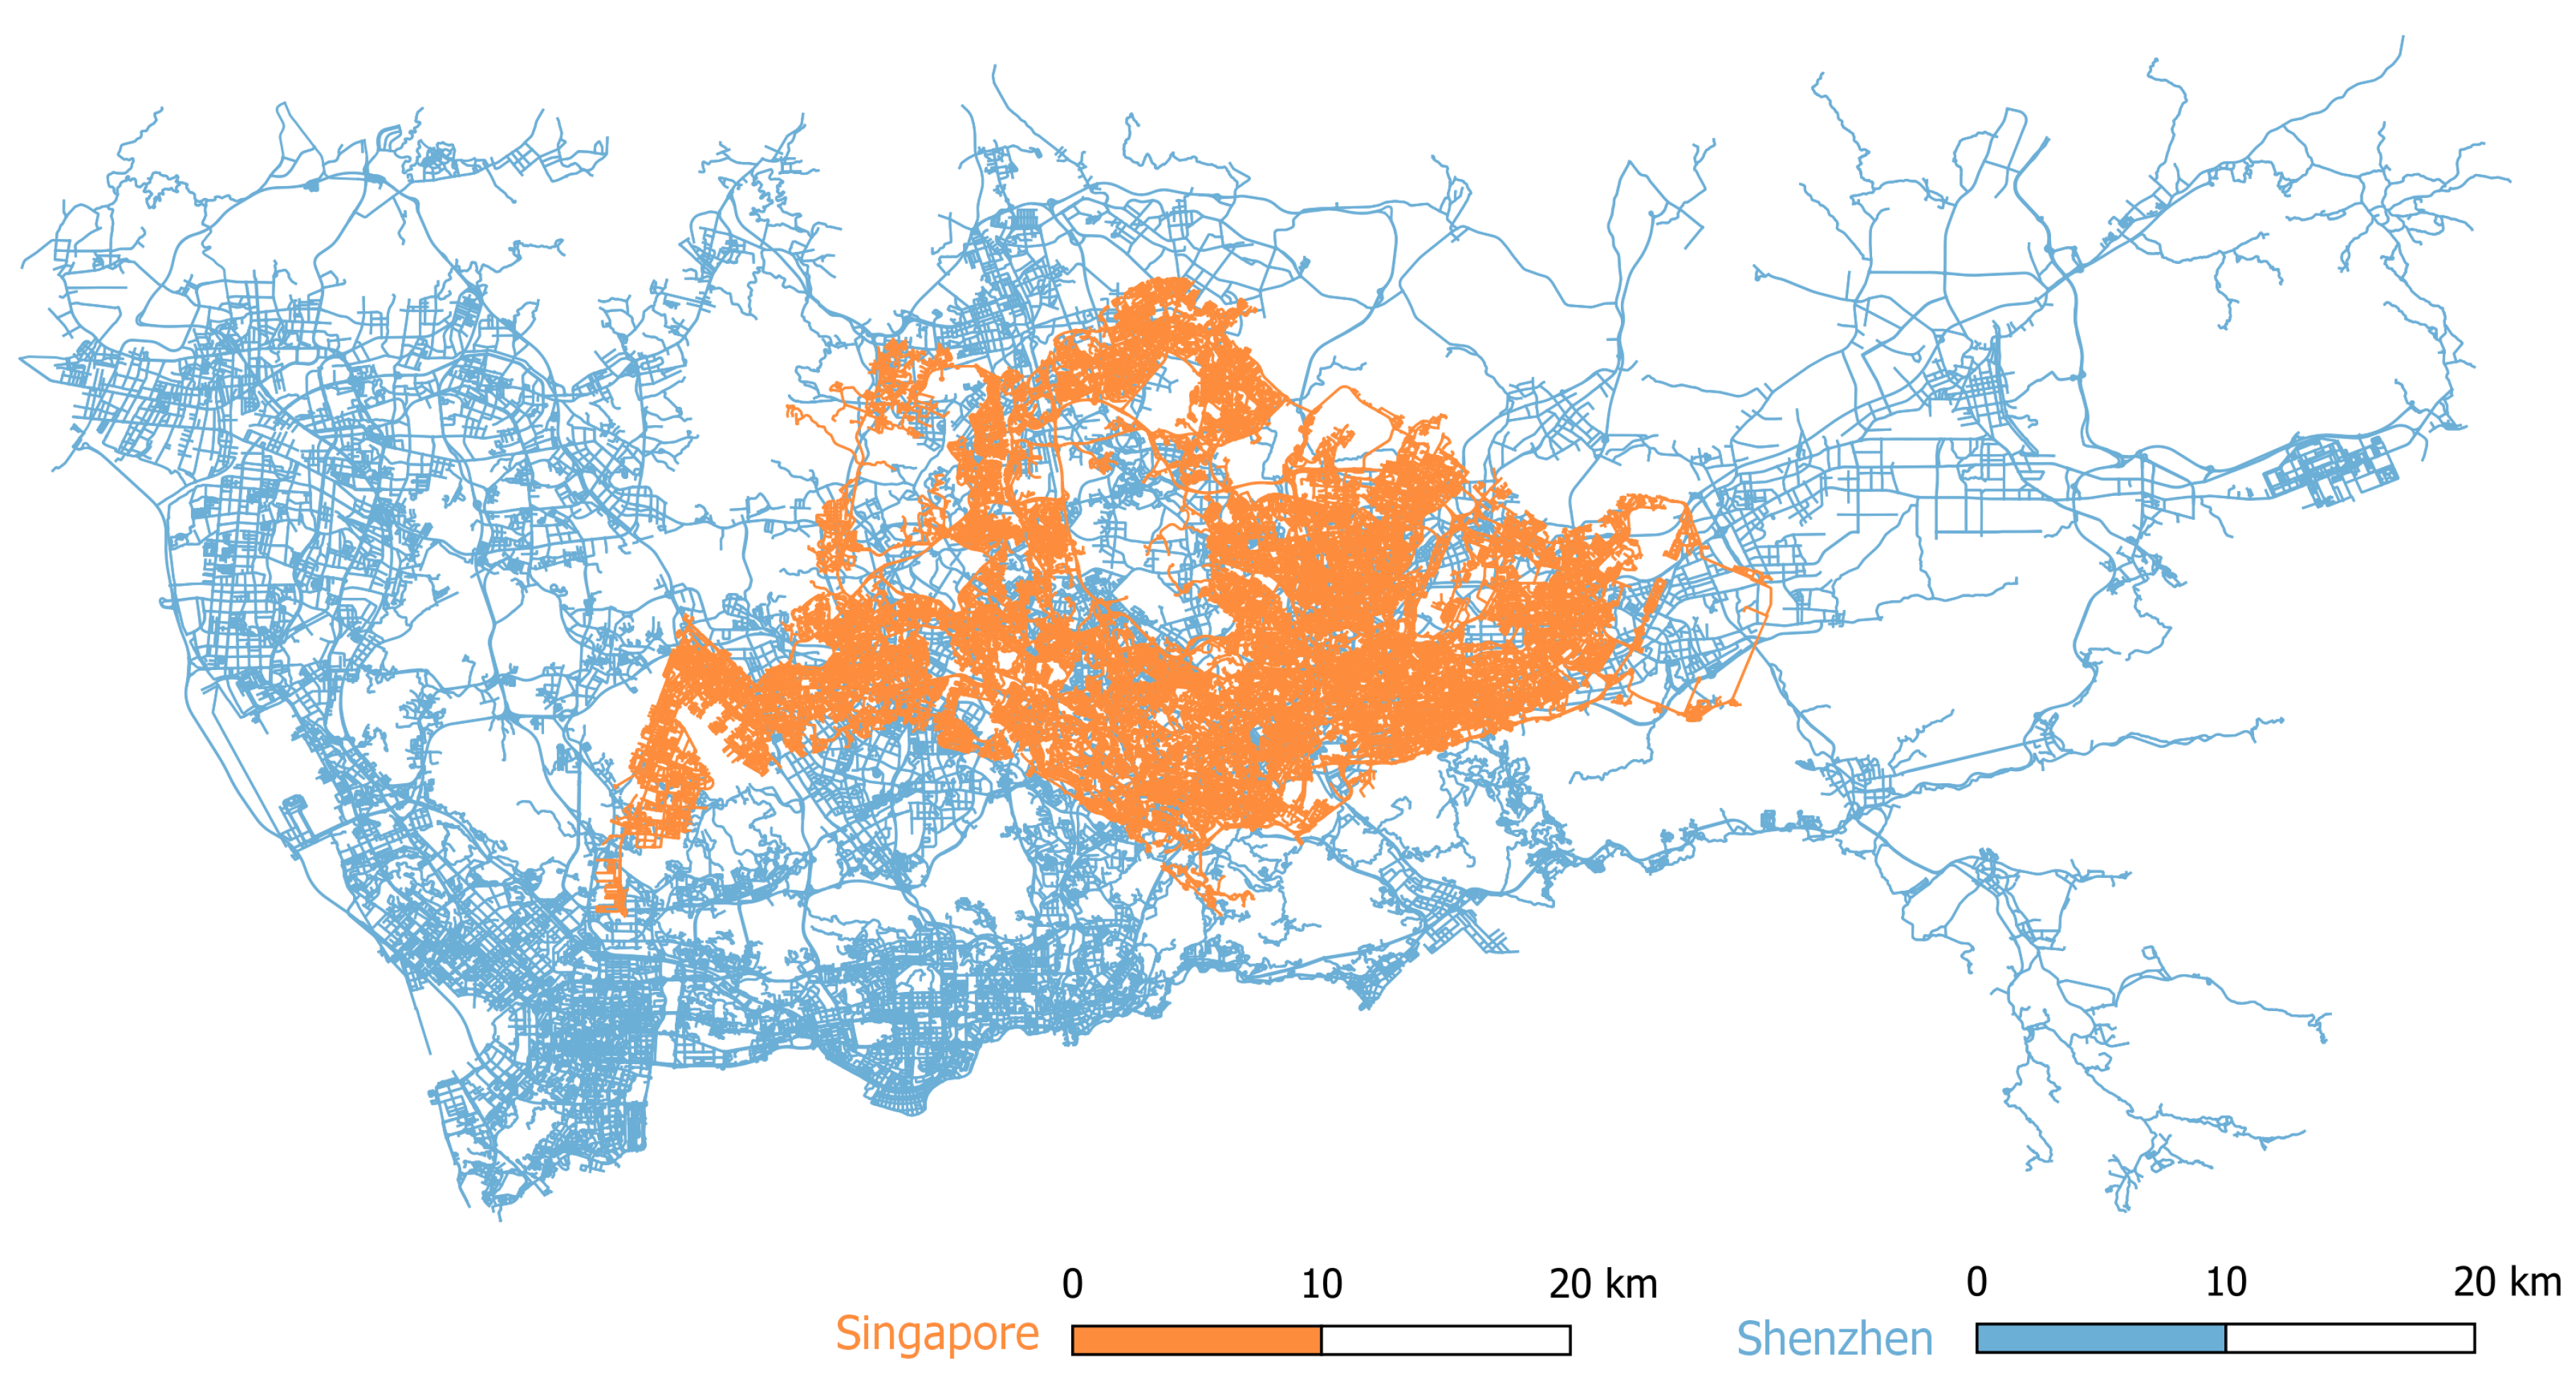
In addition to the taxi and bus datasets, we also downloaded the road networks for the two cities from OpenStreetMap [
42]. For Singapore, we used a bounding box that covers the whole island, and then manually excluded roads that provide connections to Malaysia, and finally, kept the largest connected component of the resulting road network, yielding the network shown in
Figure 1. For Shenzhen, we used a bounding box that covers the official boundary of Shenzhen and then removed the connections to Hong Kong and kept the largest connected component, similarly to the case of Singapore. We further processed the raw networks by performing a friend-of-friend clustering, grouping together nodes with a threshold radius of
, reducing the network size to simplify processing and remove uncertainties from small errors in GPS data. After the clustering procedure, the road network for Singapore had more than 50,000 nodes and 120,000 edges, while the one for Shenzhen had almost 40,000 nodes and 100,000 edges.
When comparing the numbers of records in Singapore and Shenzhen datasets, what we can conclude is that the number of taxi trips for both cities is comparable, i.e., around 3 million, with Singapore recording a bit less. However, due to limitation of Shenzhen bus dataset not including tap-out data, out of around 15 million records initially recorded in the dataset, we were able to use only a bit more than 25%. With that being said, what we can see is a large difference in the ratio of bus trips recorded in each city, with Singapore having around six times more bus trips than Shenzhen. However, on the other hand, in the Shenzhen dataset we have individual trips with the exact starting time, which is information that is missing from the Singapore dataset as there we only have aggregated numbers of people traveling between each pair of origin/destination bus stops within one hour. When comparing the numbers of nodes in each city’s road network, we note that the area of Shenzhen is
larger than Singapore; this indicates that the road network of Shenzhen is more sparse, which is also evident in
Figure 1.
3. Methodology
The taxi trip datasets for both Singapore and Shenzhen are in the same format of Global Positioning System (GPS) traces. As taxis move through the city, their geolocation (i.e., latitude and longitude) is recorded at irregular time intervals. In that sense, for each taxi trip in the dataset, there are multiple spatio-temporal points allowing us to reconstruct the route that it took. As the first step, we mapped the taxi trajectories to the road network, using the algorithm of Yang et al. [
43]. The result of this procedure is an ordered list of network nodes that are present in the most likely trajectory corresponding to the trip. The advantage of this method is that we are not limited by the irregularity in recording GPS points, and we can thus identify all possible matching opportunities. A taxi trip
is then represented as an ordered set of tuples
,
, where
denotes the sequence of road network nodes identified as a part of the trajectory,
are the estimated timestamps for each node based on the GPS timestamps and finally
denotes the total number road network nodes in a trajectory
.
For each bus trip, we assign a set of road network nodes as candidate sets for the beginning and end of the trip, based on their proximity to the coordinates of the bus stop. This way, a bus trip is represented as the following: , where and are the candidate sets for the start and end of the trip respectively, and and are the estimated start and end times of the trip. We control the selection of the candidate sets with the parameter d that we refer to as the spatial buffer. For the special value of , the candidate sets only include the closest node to the bus stop. For , the candidate sets include all road network nodes within an Euclidean distance of d. In practice, we use and . The significance of d is to allow a match where the pick-up does not exactly take place at the bus stop. Since the actual start of a passenger’s trip is typically not the exact location of a bus stop, this buffer is interpreted in the sense that instead of going to the bus stop, a passenger would walk to a pick-up location that is within an acceptable distance of their original location.
We then compile a set of
potential matches between bus and taxi trips,
, as pairs of trips where a taxi trip includes road network nodes from the start and the end candidate set of a bus trip in the correct order. We also require that the node in the bus start set is visited by the taxi within a short time interval,
, defined as a
time buffer within the start of the bus trip and that the end node is visited earlier than the end of the bus trip, allowing time savings for the bus passenger. Formally, we define:
The conditions listed here guarantee that (1) road network nodes are visited in the correct order; (2) both the start and the end of the bus trip are visited by the taxi trip; (3) the bus passenger can take the taxi within a temporal buffer of the start of their original trip; (4) they arrive earlier than with their original bus trip; and (5) that the actual travel time is shorter, where we define as the travel time saving achieved. Note that this matching procedure does not require a bus trip origin/destination (O/D) pair to be exactly the same as a taxi trip O/D pair in order for two trips to be matched, but simply that a subset of the taxi trip matches the bus trip O/D pair.
The selection of the time buffer assumes that a passenger would go to the bus stop time before boarding the bus and is willing to wait up to after the original departure time if matched with a taxi trip that still arrives earlier at their destination. Of course, in a more detailed model, could be selected on a per-trip basis, if an estimate of the actual waiting time for the bus and individual tolerance for the extra waiting time could be established. The travel time saving is defined as the actual travel time saving, i.e., how much faster the trip is realized with the taxi than the original bus trip. Notably, we do not include any time savings due to the taxi trip starting earlier. This likely underestimates the total time savings achievable for passengers, but since we do not have a reliable estimate of the waiting times for bus passengers, we chose to only focus on the part of the trip spent traveling. We acknowledge that minimizing waiting time could be an important additional goal of any combined on-demand mobility service.
Pairs in
represent all possible sharing opportunities and form a bipartite graph, where the
time savings are interpreted as edge weights. Potentially, any trip can have multiple match candidates (i.e., will be present with a degree > 1). Using this graph, we then calculate a maximal weighted matching [
44,
45] to arrive at an ideal assignment of trips that maximize time saved for the bus passengers while respecting the condition that each trip can be matched only at most once. To be able to provide a tractable solution and also to limit inconvenience to the taxi passengers, we do not consider the possibility of a taxi trip being matched to multiple bus trips consecutively; if there are multiple such candidates, we choose the one that contributes to maximizing time savings globally. In future work this could be extended in such a way that instead of maximizing the total travel time savings on a system level, we could prioritize to match trips considering the purpose of the travel.
4. Results
The results of our analysis are presented with two main figures, each one answering one main research question.
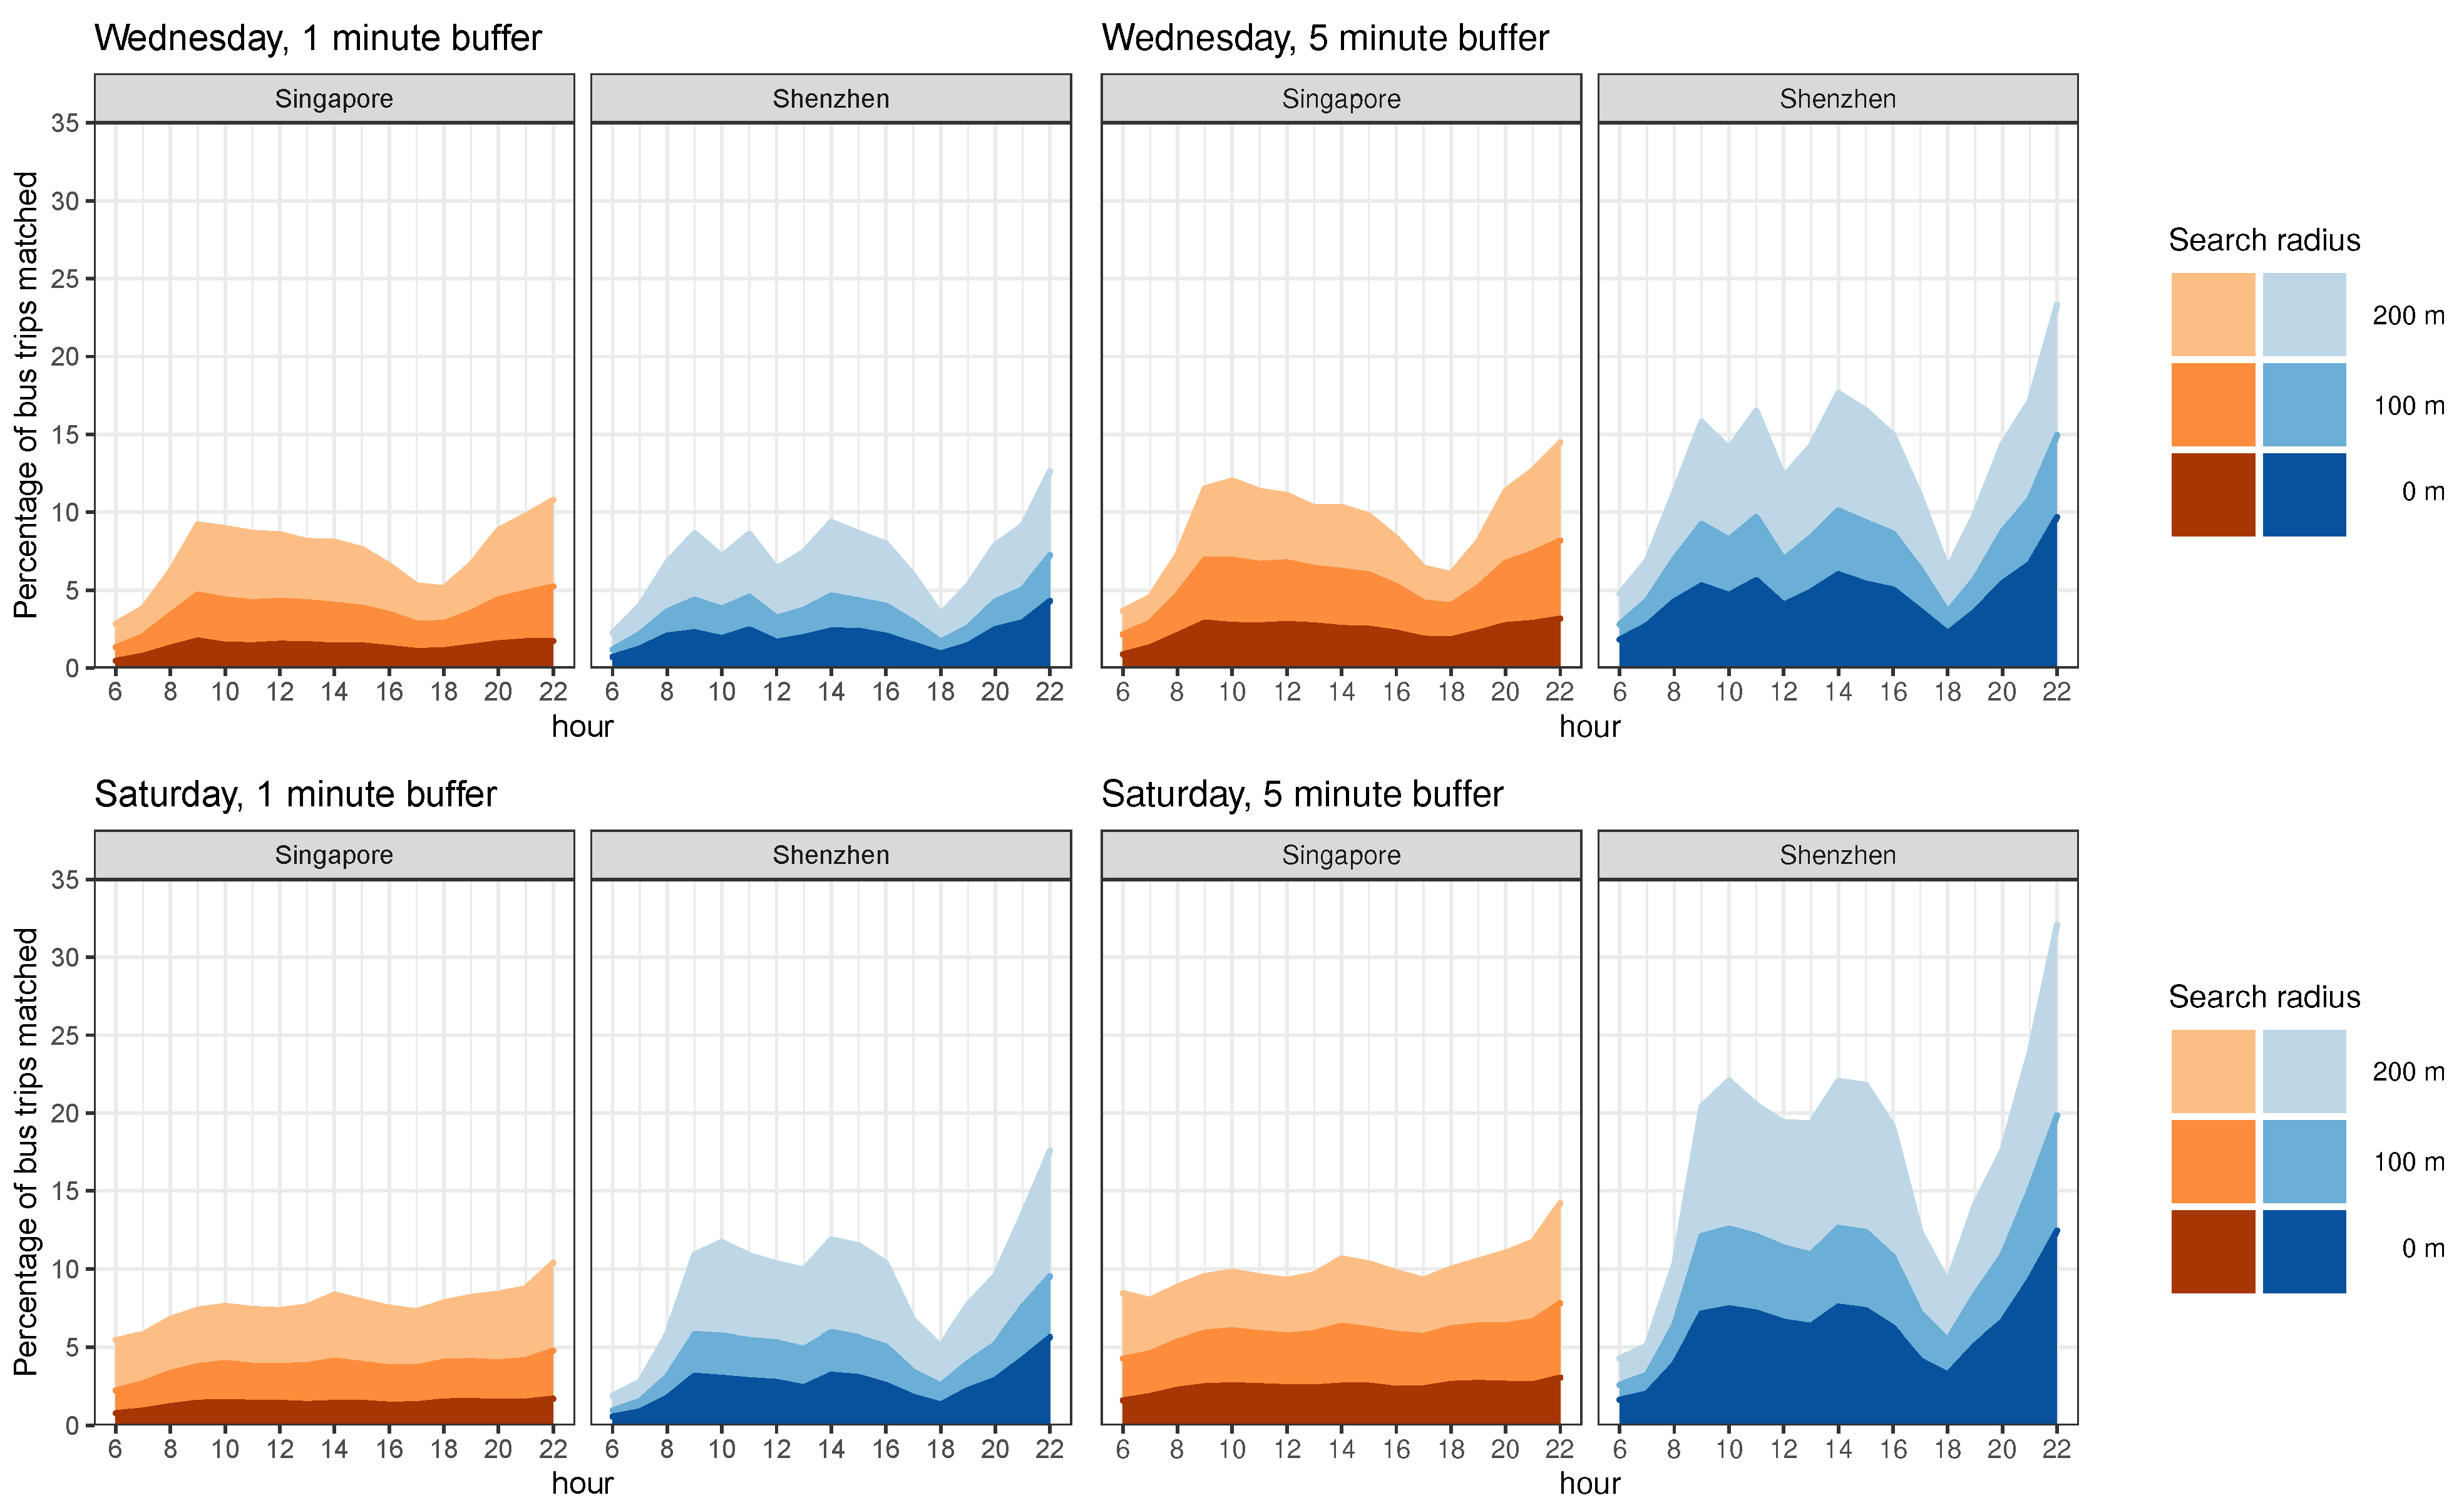
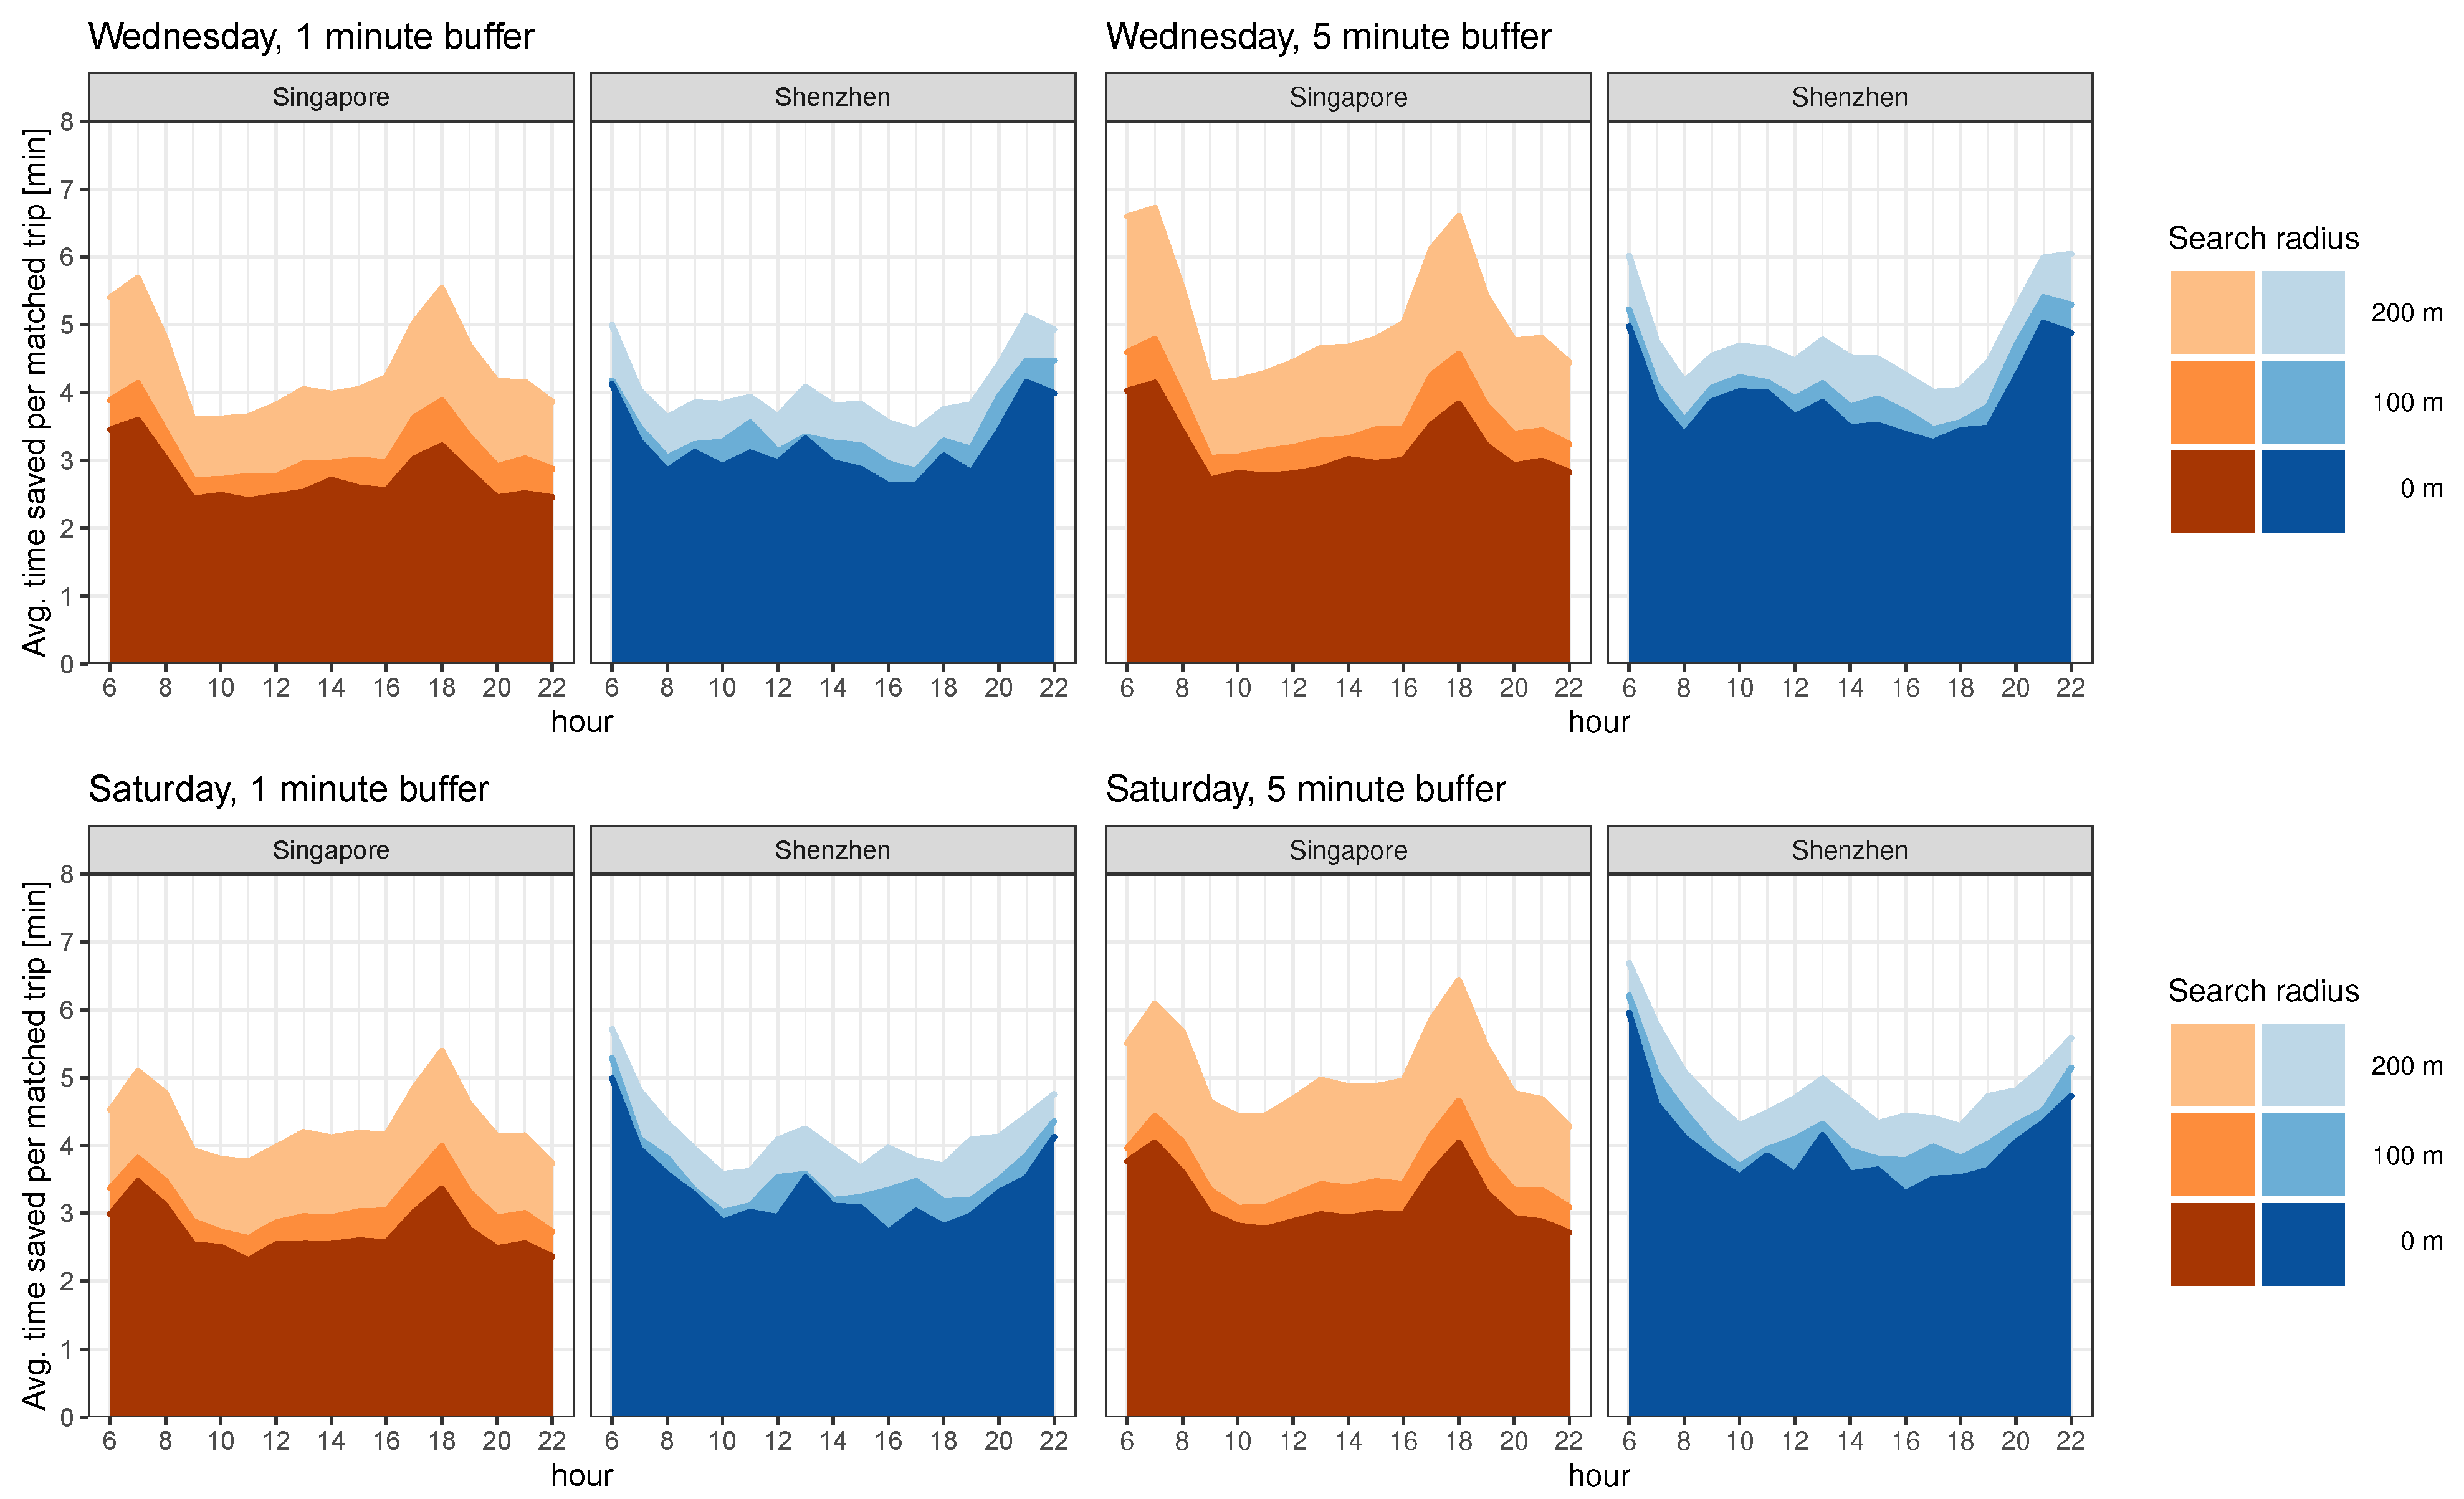
Figure 2 shows the percentage of bus passengers who were able to be matched with the taxi passengers, while
Figure 3 shows the average travel time saved per a matched bus trip expressed in minutes. Results for the percentage of matched trips and average time savings are calculated for one hour windows during the time period of a significant bus service, between i.e., 6 a.m. and 11 p.m. in both cities; correspondingly,
x-axes are limited between 6 a.m. and 10 p.m.
y-axes show the percentage of matched trips in
Figure 2 and the time savings in minutes in
Figure 3. Each main figure is divided into eight sub-figures denoting results for Singapore and Shenzhen separately, as well as for different time buffers and for two days (Wednesday and Saturday) that represent typical results for workdays and weekends. Each panel shows the results for three different values of the space buffer, i.e.,
and
. The results for the remaining days of week are displayed in the
Appendix A as
Figure A6,
Figure A7,
Figure A8,
Figure A9.
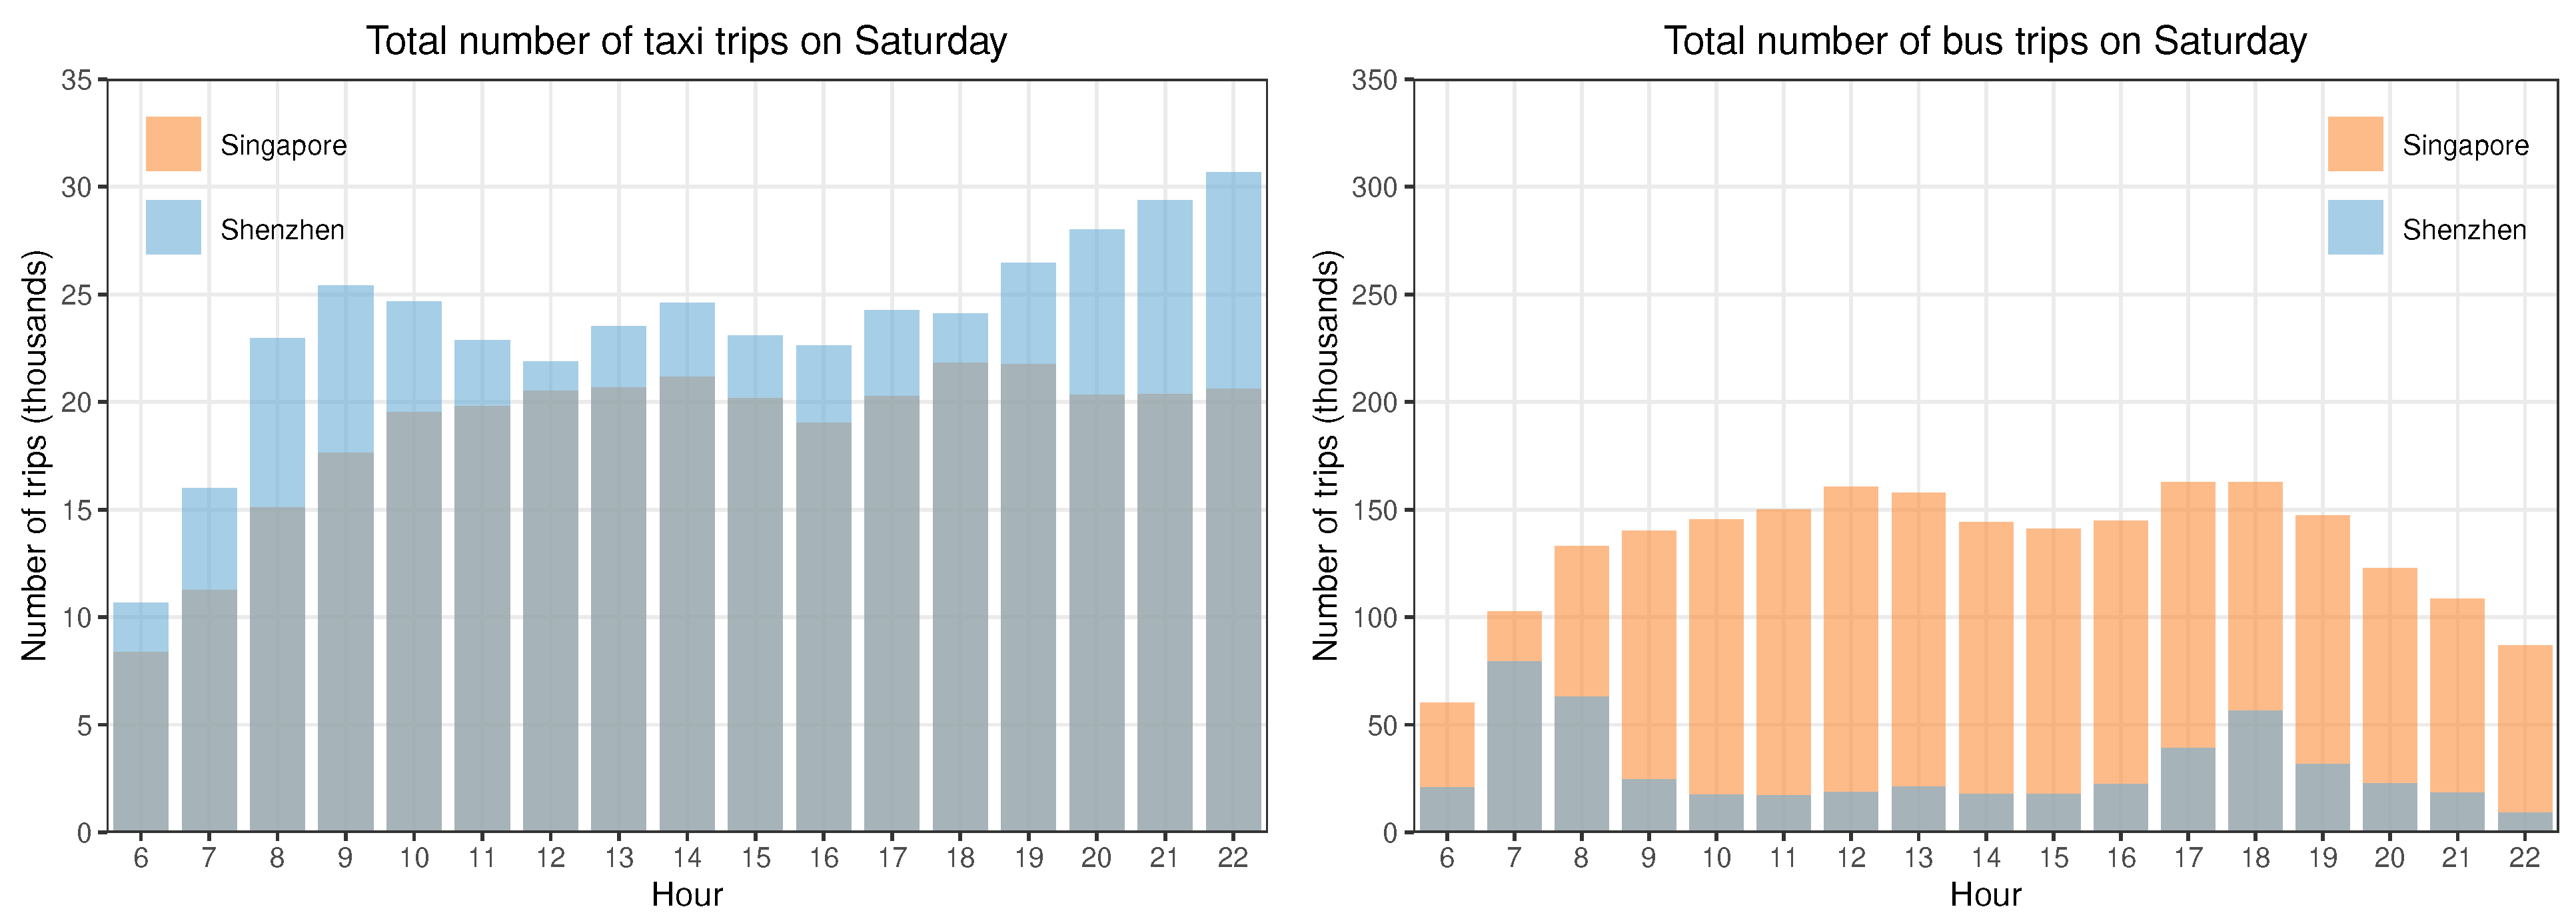
As expected, the percentage of bus trips matched goes up as we increase the space and time buffers. For example, if we set the time buffer to 1 min, the percentage of matched bus trips on Wednesday for Singapore for the radius of 200 m is on average a bit less than 10% in morning hours (i.e., between 9 to 12 a.m.), drops to 5% around 6 p.m. and then goes up to a bit more than 10% in the late night (i.e., around 10 p.m.). Similar, but slightly lower percentages of matched trips could be also observed for Shenzhen. However, there is a bit of different pattern during the day with two drops around 10 a.m. and midday and a much sharper drop around 6 p.m. The reason for this is the drop of the total number of taxi trips during those periods as shown in
Figure A3 in the
Appendix A. Namely, whereas the total number of taxi trips in Singapore stays more stable from 10 a.m. to 1 p.m., in Shenzhen there are two drops at 10 a.m. and midday. Given that the number of bus trips during the same time does not change that much either, chances for the bus passengers to share a ride with the taxi passengers are lower around 10 a.m. and 12 p.m.
For Saturday, the percentage of matched bus tips for Singapore is slightly lower than 10% and is flatter during the day, with no drop around 6 p.m. and also rising in late night hours. In Shenzhen, the percentage of bus trips matched on Saturday is slightly larger than 10%, with two drops around 1 p.m. and 6 p.m. and a large spike in late night hours. The reason for this kind of behavior is that there is a little of difference in bus distribution in Shenzhen between Wednesday and Saturday, while the number of taxi trips on Saturday is on average larger than the one on Wednesday. The same patterns are observed for 5 min time buffers, but as expected with a higher percentage of bus trips matched. However, the percentage of bus trips matched go much higher for Shenzhen than for Singapore, around 15% on Wednesday and 20% on Saturday for 200 m search radius.
When looking at the average absolute travel time saved for Singapore and Shenzhen (as illustrated in
Figure 3), what we can see is that the bus passengers in Singapore who get matched with the taxi riders can save a bit more than 4 min per their trip for 1 min time buffer and 200 m space buffer. At the same time, the time savings in Shenzhen (with the same parameters) on average are a bit less than 4 min. The time savings with 5 min time radius and 200 m space buffer can go over 5 min in the case of Singapore and over 4 min in the case of Shenzhen. This also indicates that the increased sharing opportunities contribute to more travel time savings even without including the effect of potentially starting trips earlier that is possible with a larger
time buffer. Regarding time patterns, in Singapore we can see larger time savings around 6 a.m. and 6 p.m. for both Wednesday and Saturday, while the pattern for Shenzhen is flatter and also does not show a lot of variety between a workday and weekend. This is an interesting finding as when comparing the average bus trip lengths of Singapore and Shenzhen (as shown in
Figure A5), we can see that on average, bus trips in Singapore are shorter (i.e., mean for Singapore is around 10 min and for Shenzhen 14 min). This is understandable given that the area of Shenzhen is significantly larger. Consequently, when putting time savings into a perspective, this means that on average, absolute travel time saved in Singapore is up to 50% of mean bus duration and around 30% for Shenzhen.
5. Discussion
Until very recently, private and public transportation have been two systems that were very much separated [
1,
3]. However, with the emergence of Transportation Network Companies (TNCs) and the Mobility-as-a-Service (MaaS) concepts, those lines are becoming unclear [
35,
37,
46]. This will be even more evident once Autonomous Vehicles (AVs) hit the roads bringing further disruptive changes to urban mobility [
11,
13,
16]. If drivers’ costs are removed from the equation, reduced fares will likely attract further passengers [
14,
15]; this in turn can result in negative externalities, such as increased congestion and energy use. This way, governments and operators will need to present new, innovate mobility concepts that allow exploiting the shareability potential that is present in the current demand and trips, including dynamic integration of private and public transportation modes in a sustainable way.
In this paper, we thus analyzed the first step of exploiting parallels between public and private transportation using today’s travel demand. Using mobility patterns recorded by taxi companies and bus operators in Singapore and Shenzhen, we investigated how passengers on public transportation could reduce their travel time if paired with already existing taxi riders. While we expect that such an arrangement will only make economic sense in a future where AVs allow drastically reduced operating costs, our results show the validity of the concept, and the need to explore such possibilities in scenario-based analysis of future transportation systems as well.
The results of our analysis showed that 10–20% of the bus passengers could be potentially matched with the taxi riders, which would contribute to on average between 4 to 6 min of savings of their travel time. These results are consistent across two cities in Asia, although there are individual differences in the temporal pattern of matching ratios. The main source of difference is explained by how the total volume of taxi and bus trips changes during the day. Namely, first we see a clear difference between the distribution of total bus trips in Singapore between a weekday and a weekend, whereas this difference is less obvious in case of Shenzhen. This possibly means that in Shenzhen, more people also work on Saturdays. Second, the total amount of taxi trips on Saturday in Shenzhen is larger than on Wednesday, which is not true for Singapore.
In conclusion, our analysis shows that there is a practical potential for partial integration of public and private transportation even under the current conditions. This is an important first step when envisioning a future where AV technology allows a variety of novel transportation service types [
21,
27,
38,
39]. Researchers and policymakers can build on our work when considering a scenario-based analysis of future mobility to evaluate policy choices [
13,
32]; including dynamic, opportunistic sharing of rides between public and private transportation users could increase flexibility and passenger convenience without additional externalities, and thus can be an important component of any integrated mobility offering of the future.
Extensions of the current work could look into incorporating predicted demand in presumed future scenarios of regulatory and pricing environment and mode choice models that incorporate new mobility modes [
47]. This will allow a more comprehensive evaluation of benefits, and inform about strategies that governments can employ to ensure sustainable urban transportation in the age of autonomous driving. Furthermore, incorporating a more detailed model of passenger choices can account for how differences in trip purpose affect the value of time and willingness to take part of such shared transportation options [
47]; this in turn will inform on how the implementation of opportunistic ride-sharing can be optimized to cater more closely to the subset of public transportation users who are most eager to use it, and where maximal benefits can be realized [
1,
39].
Lastly, extensions of the current work could consider other form factors, such as medium sized (i.e., 6–10 passenger) vehicles as alternatives to both taxis and buses and evaluate the total impact in terms of congestion, energy use, passenger comfort and convenience. We note that previous work in this area was limited to using taxi trips as an estimate of demand [
21,
47]; our results show the importance of including the
complete picture of urban transportation demand, i.e., both public and private transportation users. Furthermore, while our work shows a potential for matching trips, any such service will face challenges in implementing user interaction solutions that can be conveniently used without excluding groups of users, e.g. those who do not use a smartphone. This means that investigating new user interaction concepts for the fluid transportation services of tomorrow will become increasingly important as more and more optimization opportunities in on-demand transportation are realized.


