Article

Research on the Construction of a Knowledge Graph and Knowledge Reasoning Model in the Field of Urban Traffic

Beijing Key Lab of Urban Intelligent Traffic Control Technology, North China University of Technology, Beijing 100144, China
*
Author to whom correspondence should be addressed.
Sustainability 2021, 13(6), 3191; https://doi.org/10.3390/su13063191
Submission received: 21 February 2021 / Revised: 11 March 2021 / Accepted: 11 March 2021 / Published: 15 March 2021
(This article belongs to the Special Issue Modeling Activity-Travel Behavior for Sustainable Transportation)

Abstract

:
The integration of multi-source transportation data is complex and insufficient in most of the big cities, which made it difficult for researchers to conduct in-depth data mining to improve the policy or the management. In order to solve this problem, a top-down approach is used to construct a knowledge graph of urban traffic system in this paper. First, the model layer of the knowledge graph was used to realize the reuse and sharing of knowledge. Furthermore, the model layer then was stored in the graph database Neo4j. Second, the representation learning based knowledge reasoning model was adopted to implement knowledge completion and improve the knowledge graph. Finally, the proposed method was validated with an urban traffic data set and the results showed that the model could be used to mine the implicit relationship between traffic entities and discover traffic knowledge effectively.

1. Introduction

1.1. Background

With the rapid development of information technology, such as Big Data, cloud computing, artificial intelligence, and the Internet of Things, various terminals have generated massive traffic data, such as mobile phone signaling and public traffic card swiping data containing travel records and vehicle information obtained by video surveillance equipment on the road. Traffic Big Data have the characteristics of large quantity, variety, wide coverage, fragmentation, and so on [1].
A knowledge graph describes the various concepts, entities, and relationships between entities in the objective world in a structured way, and provides a better ability to organize, manage, and understand massive amounts of information [2]. There are already some vertical knowledge graphs for specific fields, but data sparseness still exists. Therefore, the kind of reasoning method to be used to solve the problem of completeness of a knowledge graph is the current research hotspot in the field of knowledge graphs.
The manner in which to determine whether distributed storage and management of traffic data and data with different semantics are associated, to fully explore the value of data in the traffic field, and to promote the efficient use of information resources is key to promoting the construction of smart traffic, as well as the query and retrieval of traffic information resources, traffic guidance systems, intelligent scheduling management, and other applications.
It is of great significance to improve the level of intelligent management in the traffic field and to assist managers in decision-making analysis. Therefore, research on the construction of knowledge maps in the field of traffic has significant practical value.

1.2. Related Works

Knowledge graphs were originally proposed by Google in 2012 as a knowledge base used to enhance the functions of search engines [3]. Essentially, a knowledge graph is a semantic network that reveals the relationships between entities, can effectively represent data resources, can efficiently find complex related information, and has semantic processing capabilities.
In the early stage, the method for constructing knowledge graphs is to use structured data such as encyclopedia websites. Representative large-scale general knowledge graphs include YAGO [4], Freebase [5], and DBpedia [6]. The Chinese general knowledge graphs include Zhishi.me (accessed on 7 November 2020) [7] built and launched by Shanghai University and CN-DBpedia [8] developed by the Knowledge Workshop Laboratory of Fudan University. They mainly integrate Chinese encyclopedia websites (such as Baidu Encyclopedia, HDwiki and Chinese Wikipedia). In addition to general purpose large-scale knowledge graphs, various industries are also building knowledge graphs in vertical fields, such as a knowledge graph for the medical field [9], a knowledge graph of breast cancer [10], and a knowledge graph of maritime dangerous goods [11].
At present, one of the main research work based on traffic Big Data mining is traffic flow prediction [12]. For the free flow forecast of the expressway, Ma et al. [13] proposed a forecasting method for daily traffic flow using a contextual convolutional long short-term memory recurrent neural network. Mohammed et al. [14] investigated the application of four machine learning methods (the deep neural networks, distributed random forest, gradient boosting machine, and generalized linear model) for short-term traffic flow prediction on urban freeways. For urban road intersections, traffic demand forecasts are used to optimize signal timing plans. Shen et al. [15] proposed a dynamic platoon dispersion models which could be applied to predict the evolution of traffic flow, and further used to produce signal timing plans. Ma et al. [16] propose a new back-pressure-based signal optimization method that combines fixed phase sequences with spatial model predictive control.
There are also many scholars who have constructed a knowledge graph in the field of urban transportation and have studied its application, such as traffic flow prediction. Zhang et al. proposed a semantic framework for integrating the Internet of Things with machine learning for smart city applications, and conducted two case studies: Pollution detection from vehicles and traffic pattern detection [17]. They also proposed a method to use structured prior knowledge in the form of knowledge graphs to solve practical problems in urban computing, such as optimal store placement and traffic accident inference [18]. Muppalla et al. proposed the imagery-based traffic-sensing knowledge graph framework, which utilizes stationary traffic camera information as sensors to identify dynamic traffic conditions [19]. Zhou et al. proposed an approach by combining a knowledge graph and a deep spatio-temporal convolutional neural network to collaboratively forecast the congestion area in a city [20]. Putu et al. proposed a method to compute the degree of traffic congestion using social networking site messages based on graph structure [21]. Because of the complexity and spatio-temporal nature of traffic data, there are differences in the knowledge graphs constructed by everyone in the traffic field, and the way knowledge graphs are constructed will directly affect the subsequent application effects in traffic scenarios. In order to study urban traffic travel data, this paper also constructed a knowledge graph in the field of transportation that is different from others.
At present, a large amount of knowledge is included in existing large-scale open knowledge graphs, but they are still incomplete, meaning there is a problem of data sparseness, a lot of information is missing, and the implicit relationship between entities has not been fully explored. Therefore, many scholars have conducted research on the complementation method of knowledge graphs to expand and perfect knowledge graphs.
The earliest known way to expand a knowledge graph is to perform knowledge inference according to logical rules [22], such as the DL_Learning system deriving T_box, A_box and other axiom assumptions from a large number of examples [23]. Formal concept analysis (FCA) is used to generate an axiom hypothesis of missing ontology from the collected facts [24]. However, as the scale of a knowledge graph becomes larger and the structure becomes more complicated, theses methods are inefficient and costly. Therefore, some scholars have proposed a representation learning method to embed the entities and relationships in a knowledge graph into a low-dimensional vector space. This representation can reflect the semantic information of entities and relationships, and it can efficiently calculate complex semantic associations between entities [25]. There are many methods for representation learning when solving low-dimensional vector representations. The typical methods include structured embedding representation models, tensor neural network models, matrix decomposition methods, and translation models.
The structured embedding (SE) proposed by Bordes et al. projects the head and tail entities into the space of r through two matrices of the relationship r, and calculates the distance between the two projection vectors in space. A smaller distance between entities indicates that this relationship exists between said entities [26]. This model uses different matrices to project the head and tail entities, so the coordination is poor. Socher et al. proposed the neural tensor network (NTN), which replaces the traditional neural network layer with a bilinear tensor layer and connects the head and tail entities in different dimensions to describe a complex semantic connection [27]. However, this model has high computational complexity and poor performance on large-scale sparse knowledge graphs. The RESACL model proposed by Nickel et al. is a representative model of the matrix decomposition method, which aims to decompose the tensor value X h r t corresponding to each triplet ( h , r , t ) into entity and relationship representations, making it as close as possible to l h M r l t [28].
The word2vec word representation learning method proposed by Mikolov et al. found that there is a translation invariance phenomenon in the word vector space [29]. Bordes et al. [30] were inspired by this and proposed the first translation model, TransE. The entities and relationships in this model are represented by a single vector, which cannot accurately describe complex relationships such as reflexivity, 1-N, N-1, and N-N. Therefore, many models have been improved and extended on the basis of this model. For example, the TransH model [31] proposes to project the head entity h and the tail entity t into the corresponding hyperplane of the relationship r. The translation operation better solves the problem of TransE’s poor effect in dealing with complex relationships, but it does not break the assumption that entities and relationships are in the same space. Therefore, the TransR model proposes to project the head entity h and the tail entity t into the corresponding relationship space of the relationship r, and to realize the translation operation from the head entity to the tail entity in the relationship space [32]. The CTransR model is based on the TransR model. First, the head and tail entity pairs are grouped by clustering, and different relationship vectors are learned for each group to make the projection expression more accurate. However, due to the introduction of the projection matrix, the model parameters have increased sharply, and the computational complexity has also greatly increased. Therefore, Ji et al. proposed a method of dynamically constructing a projection matrix—the TransD model [33], which takes into account the interaction between entities and relationships and defines the projection matrix of the head and the entities in the relationship space, respectively.
At present, most traffic knowledge graph research focuses on the detection and prediction of road congestion. However, a comparatively small amount of work focuses on discovering the implicit relationship between traffic entities. Additionally, research about knowledge reasoning methods based on representation learning mainly focus on general knowledge graphs. There are few papers that use the representation learning model to perform knowledge reasoning on constructed traffic knowledge graphs. Therefore, this paper used the representation learning model (TransD) to perform knowledge reasoning using the existing knowledge in knowledge graphs, which can discover the implicit relationship between traffic entities, such as the relationship between the points of interest and the road traffic state.

2. Framework and Data

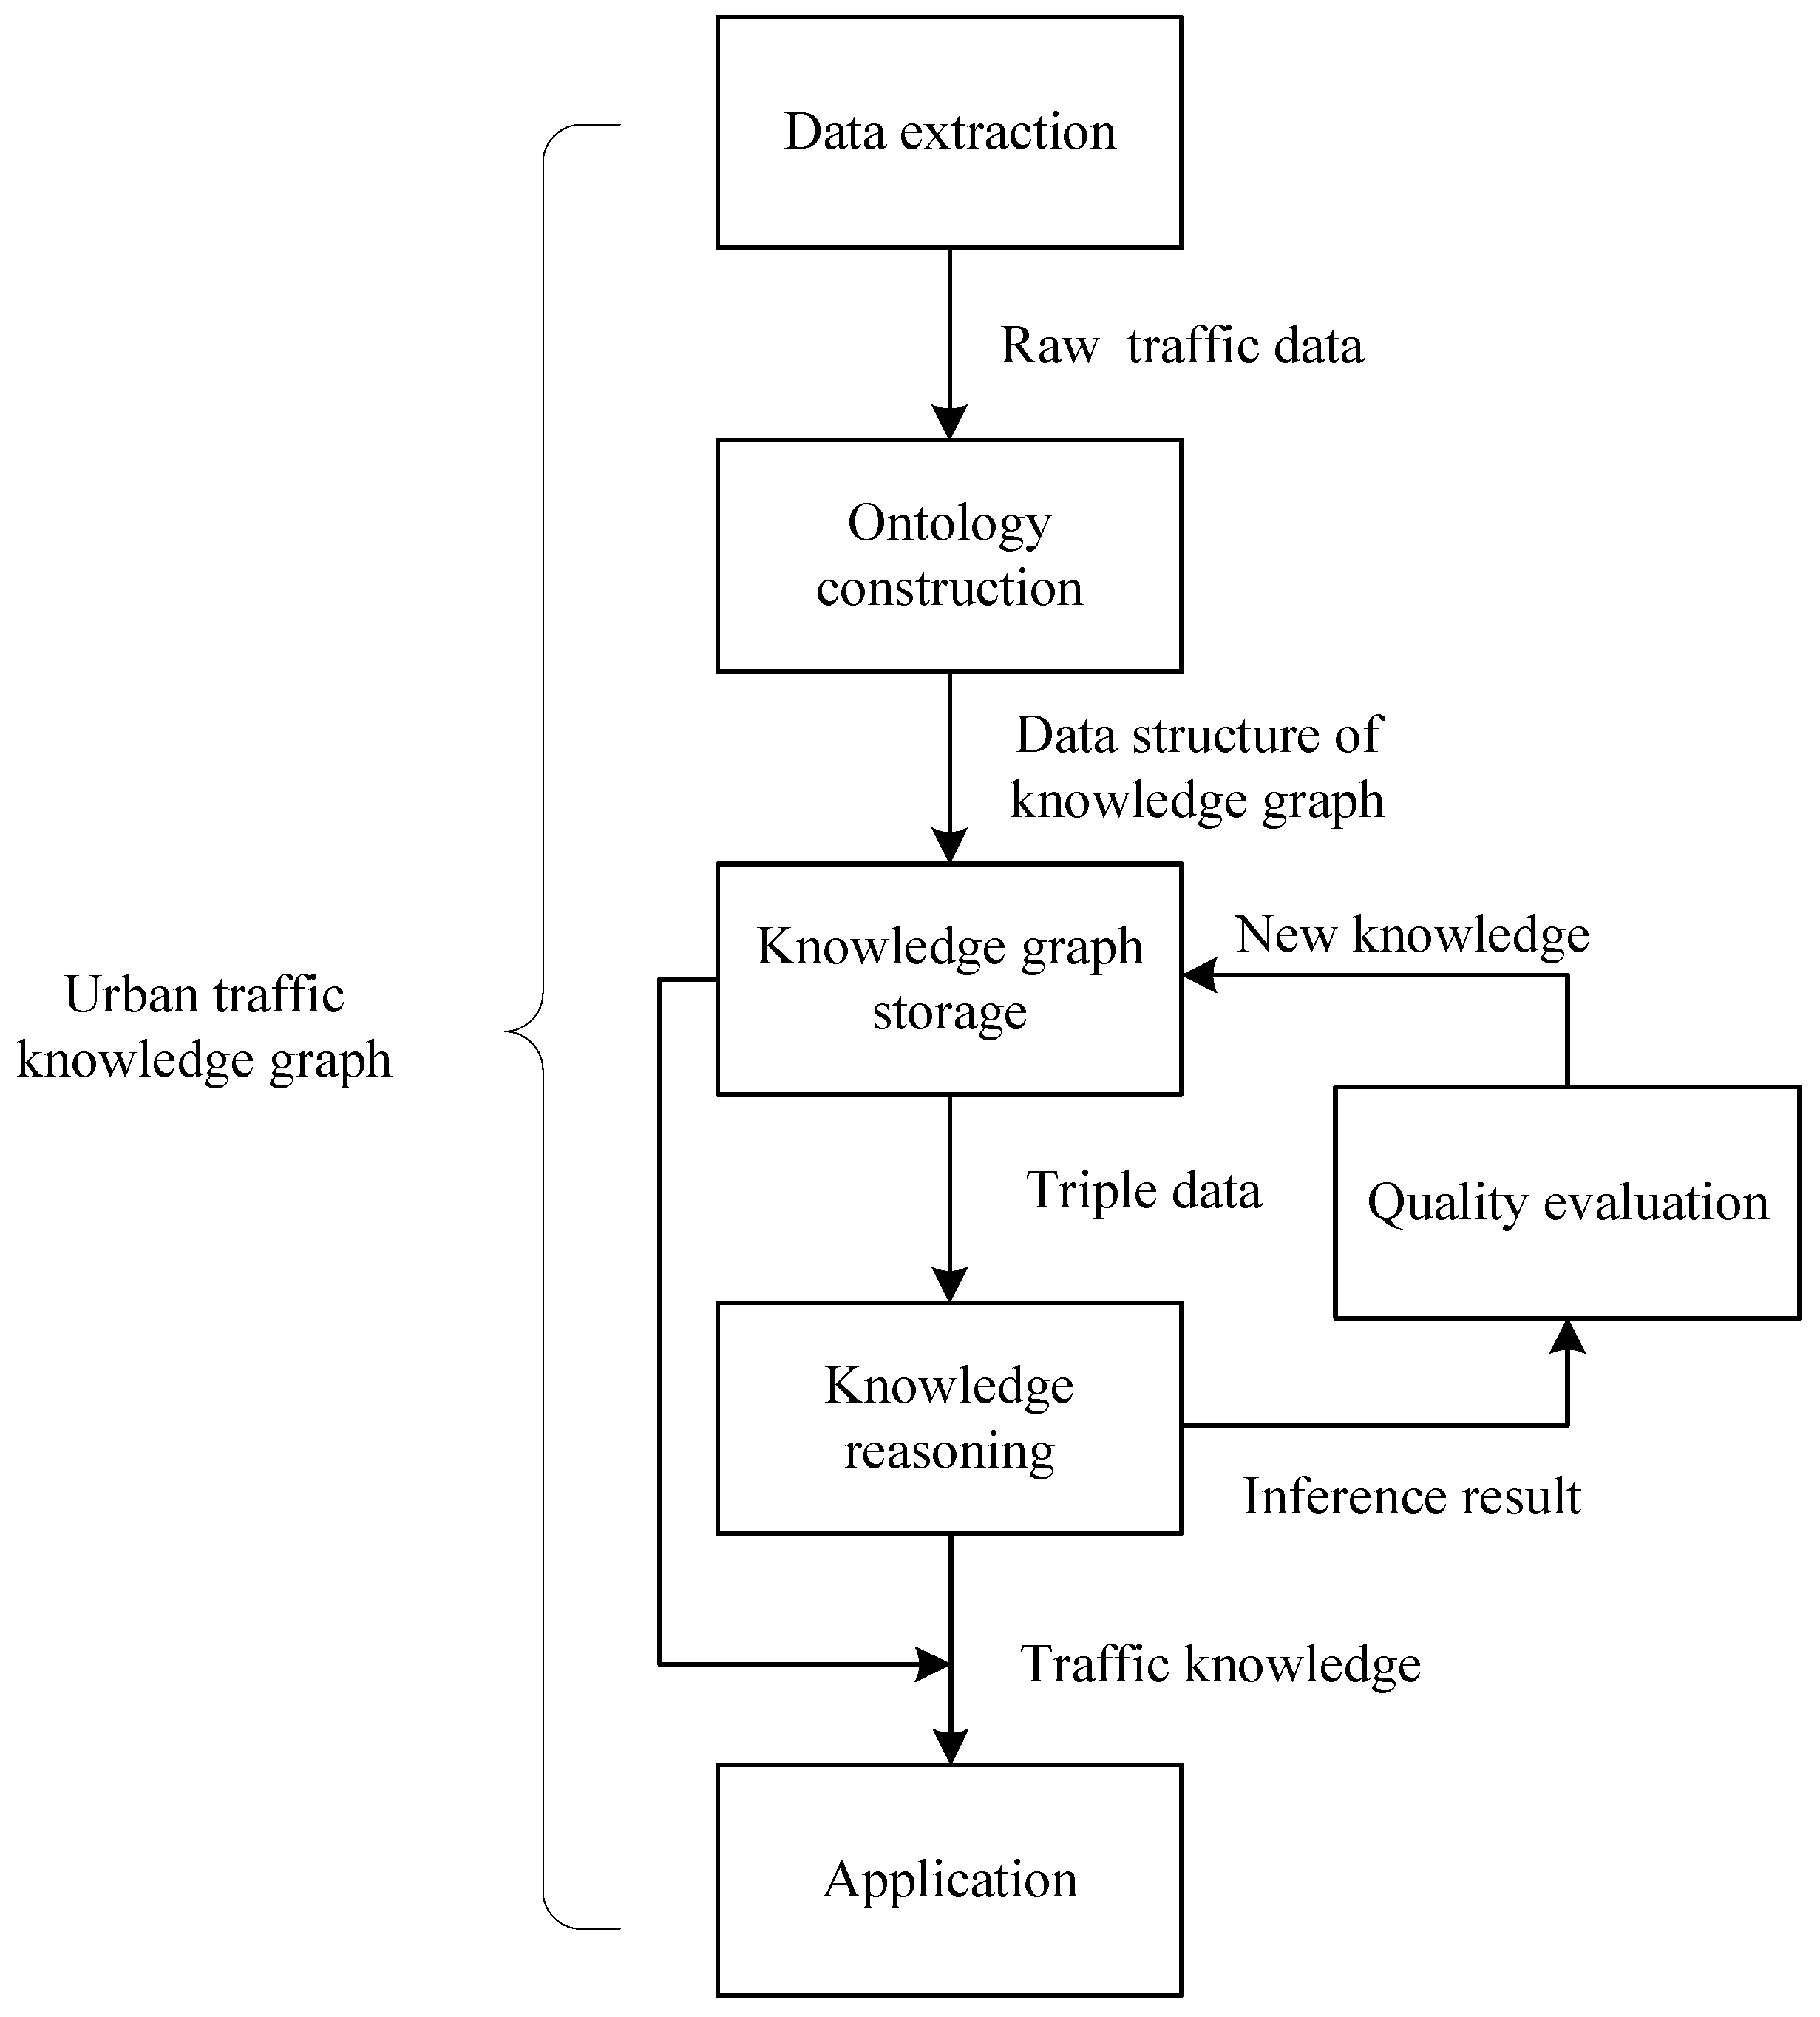
2.1. Overall Framework

The construction process of a knowledge graph is essentially a process of obtaining the required data and organizing said data into a whole in an appropriate form and method. The construction process of a knowledge graph is an iterative update process. First, it is necessary to rely on crawler technology to collect open traffic field data and to extract entities, attributes, and relationships from it. Second, the pattern layer of a knowledge graph is designed and completed, that is, the traffic field ontology is constructed. Then, the data layer of a knowledge graph is stored in the graph database. After that, knowledge reasoning is performed based on the existing data in a knowledge graph, carrying out quality evaluation of the inference results (such as contradiction and redundancy checks), thereby expanding and enriching a knowledge graph. The research framework of this paper is shown in Figure 1.

2.2. Data Collection and Preprocessing

The multi-source public traffic data obtained in this paper included the AFC card swiping data of the metro in Shenzhen and the static basic data of metro lines and stations. In addition, the urban road traffic data included road data, points of interest data, and road traffic situation data in the area within the Fifth Ring Road in Beijing.
(1)
Metro static basic data
This paper used Internet crawler technology to obtain Shenzhen’s metro station and line data from the AutoNavi Map API [34]. Web crawlers use uniform resource locator URLs to automatically grab and download target information from websites, which improves efficiency and saves time [35].
Step 1: First, the incoming parameters need to be constructed, which mainly include the key value, city code, and city name. After the parameters are URL-encoded, a request is initiated to the target HTTP interface, that is, a request is sent.
Step 2: The response returned by the HTTP request is received, and the returned json format data is parsed. Finally, the parsed data are stored in the relational database PostgreSQL, and the stored data are shown in Table 1.
(2)
Metro AFC swipe data
The Shenzhen metro adopts a one-ticket system, and passengers must swipe their cards to enter and exit the station. The time range of the Shenzhen pass card swiping data in this paper were from 25 January 2016 (Monday) to 29 January 2016 (Friday), a total of five working days of card records. The data format is shown in Table 2.
(3)
Urban road network data
Step 1: The road data in the area within the Fifth Ring Road of Beijing are downloaded from the OpenStreetMap database.
Step 2: OSM2GMNS is used to output the road network data conforming to the General Modeling Network Specification standard from the downloaded target road network. The output file includes road network nodes (node.csv) and a road network connection link (link.csv). The main field descriptions are shown in Table 3 and Table 4.
(4)
Points of interest data
A point of interest (POI) generally refers to a meaningful non-geographical point in the real world, such as the infrastructure closely related to people’s lives [36]. This paper used the search POI interface in the AutoNavi Map API to obtain information about primary and secondary schools in the area within the Fifth Ring Road of Beijing. The specific steps were as follows:
Step1: First, the query area is defined, using QGIS to draw the area boundary. Because each request returns up to 1000 POIs, it is necessary to divide the large area into multiple small grids to obtain the vertex coordinates of each small grid.
Step2: The POI information in each grid are obtained in turn through the web crawler, and then the returned json data are parsed and stored in the database. A description of the POI information fields is shown in Table 5:
(5)
Traffic situation data on urban roads
The time range for collecting the traffic situation in this paper was a week of online classes for students in 2020: 24 August (Monday) to 28 August (Friday); one week that students were in school: 21 September (Monday) to 25 September (Friday); a daily collection period from 6:30 a.m. to 10:30 a.m. and from 4:00 p.m. to 9:00 p.m. The method of collecting traffic situation data was the same as the method for searching for POI. Table 6 shows the fields of the road traffic situation:
The collected data were preprocessed, the target data were extracted, and invalid and wrong data were eliminated, thereby improving data quality. For metro card swiping data, the card swiping records during the morning peak (7:00 a.m. to 9:00 a.m.) were filtered out, the swipe records that did not appear in pairs when entering and exiting the station were eliminated, and the data with the same entry and exit positions were deleted, with the time difference between entry and exit being greater than 5 h of data.
Web crawler technology was used to obtain the real-time traffic situation data of roads. The data on the AutoNavi Map API are updated every 2 min. However, due to the instability of the network connection, the time interval for returning traffic situation data is different. In order to facilitate subsequent analysis, the data needed to be changed. The sampling intervals was uniform every 5 min. Because the road classes returned by the traffic situation were mostly expressways and trunk roads, the road network data with traffic situation data were filtered according to the matching of road names, and then the invalid and redundant data were eliminated, thereby improving data quality.

3. Methods

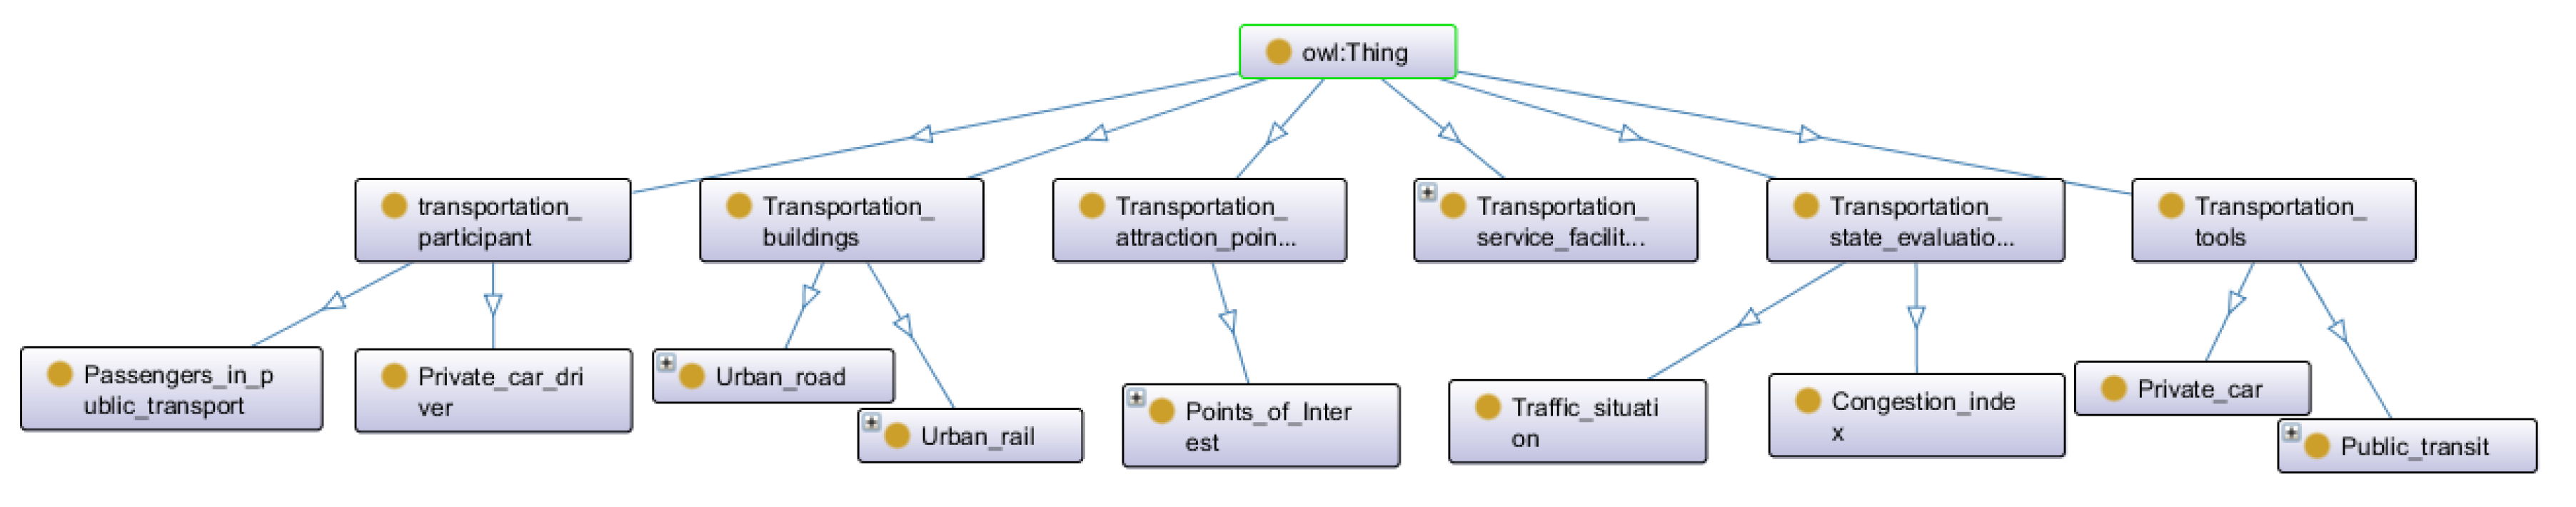
3.1. Ontology Construction of Urban Traffic

The construction of a knowledge graph in the field of urban traffic adopted a top-down approach. First, the pattern layer of the knowledge graph was defined through the construction of domain ontology. After that, the entities, attributes, and relationships between entities were extracted from various types of data sources, and finally, the graph database Neo4j was used to store the data of the knowledge graph.
The construction of the ontology of the urban traffic field was oriented to specific urban traffic business scenarios. Moreover, the standardization of field terms and the wide applicability of concept categories, as well as the hierarchical structure of the concepts in the abstract field, were considered, and the related attributes of each concept and the relationship between concepts were defined [37]. This paper used the seven-step method published by Stanford University to manually construct the domain ontology [38], the domain ontology with the four elements of "people–vehicle–road–environment" in traffic as the core, and related to traffic subjects, travel behavior, traffic facilities, traffic tools, and other entities.
(1)
Define the class and its hierarchical structure
The field of urban traffic was divided into six categories, including traffic tools, traffic buildings, traffic service facilities, traffic participants, traffic state evaluation, and traffic attraction points. Each category was divided into multiple subcategories and organized in a hierarchical structure. The hierarchy of the ontology classes in the urban traffic field is shown in Figure 2.
(2)
Define the attributes of the class
The attributes of each class were defined; the classes had inheritance, meaning the subclasses inherited the attributes of their parent class, so the attributes were placed in the broadest class, that is, the closer to the top level, the better. Table 7 shows a list the attributes of the six main categories in this paper.
(3)
Define the relationship between classes
There are some relationships in the urban traffic ontology, and two classes are connected through such a relationship. For example, the location of a certain point of interest is on a certain road, and the relationship between the point of interest and the city road is located. Figure 3 shows the relationships between all of the classes in the urban traffic ontology.
This paper used the ontology editing tool Protégé to complete the construction of the ontology in the urban traffic field, as shown in Figure 4. Protégé is an ontology editing and knowledge acquisition software developed by Stanford University based on the Java language. It provides good support in terms of visualization, query, and storage [39].
Ontology defines the mold of a knowledge graph and describes the top-level structure of said knowledge graph. Therefore, constructing ontology can analyze the system and level of domain knowledge and can realize the repeated use of domain knowledge.

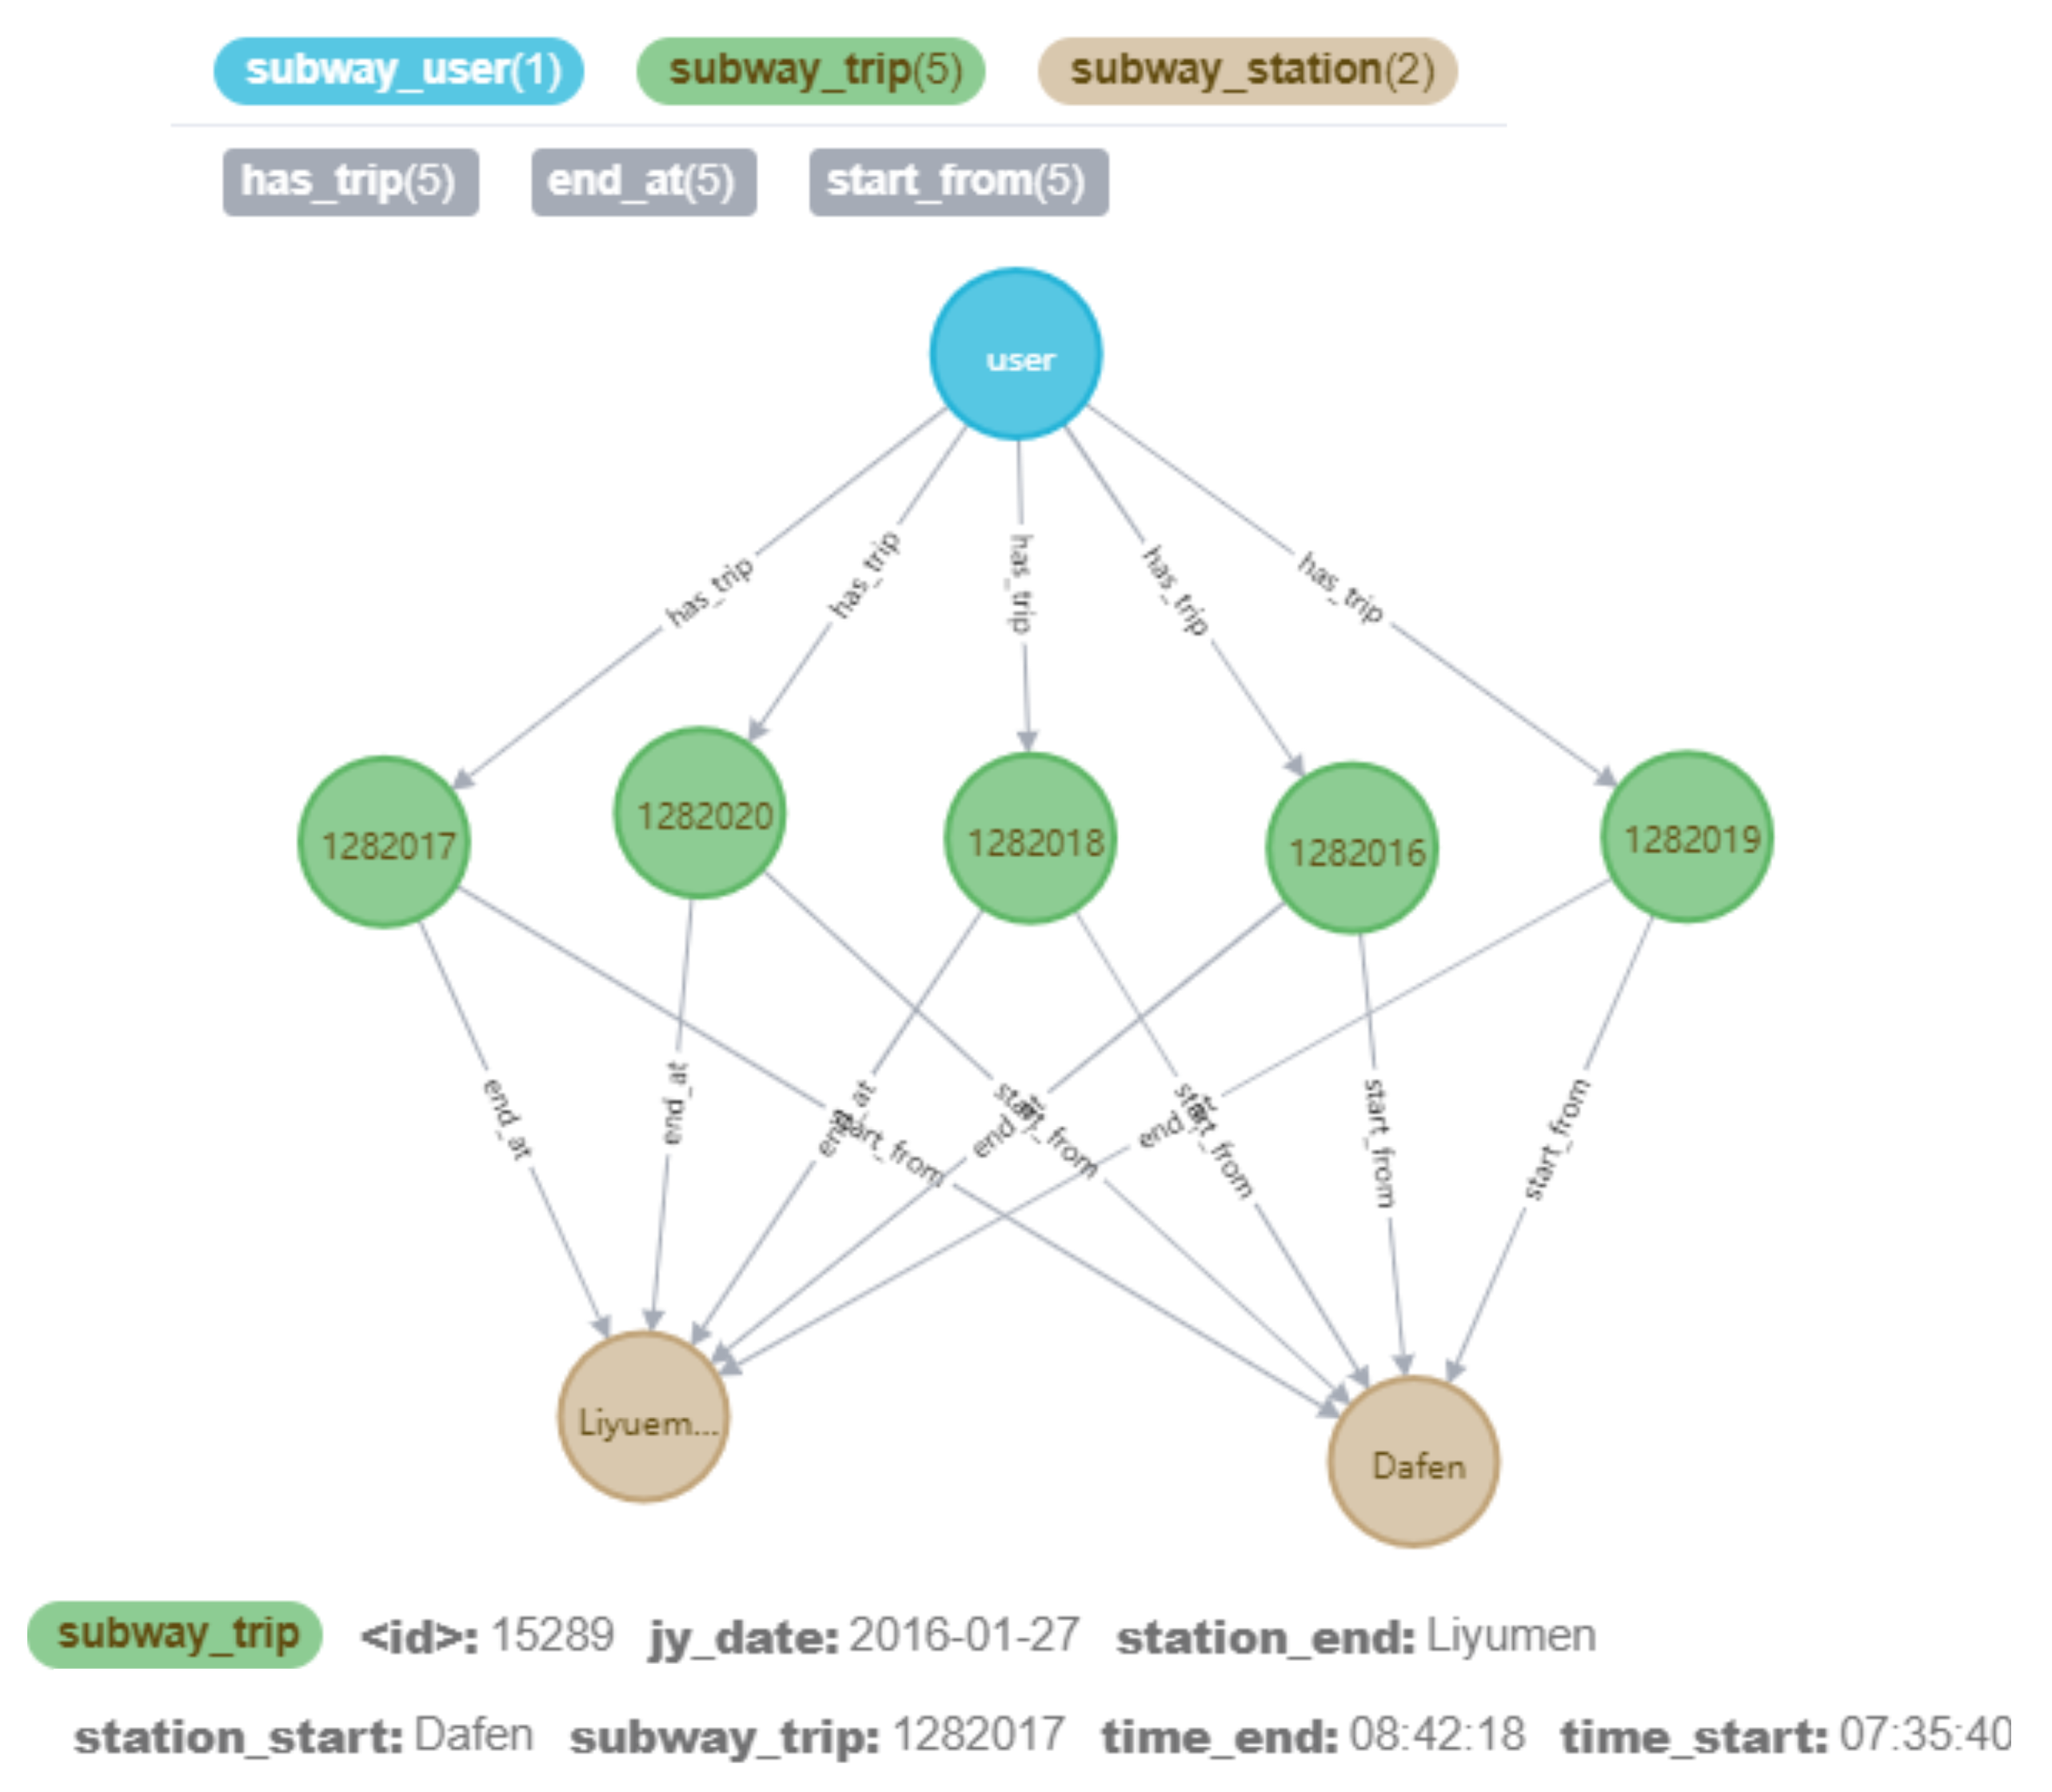
3.2. Storage of an Urban Traffic Knowledge Graph

The graph database Neo4j supports massive data storage, which can solve well the problems of low value density, large quantity, and fast update speed of data in the traffic field. Additionally, the Cypher graph query language supports associated query and graph algorithms, which is more conducive to data query and value mining. Therefore, this paper chose the Neo4j graph database for knowledge storage.
Because the time and space of metro swipe card data and traffic situation data are different, the classes in the field of urban traffic ontology were divided into two: One was a public traffic knowledge graph based on swipe card data, and the other was an urban road traffic knowledge graph based on road traffic situation data.
(1)
The public traffic knowledge graph
According to the subway metro swipe card data and the subway static basic data in the collected urban traffic data, the entities, attributes, and relationships between entities were extracted to construct the data layer of the public traffic knowledge graph, and the data were stored in the graph database. The attributes of the entities and relationships are described in Table 8.
Taking the relationship between the metro passengers and itinerary as an example, the same public traffic travel user has multiple itineraries in a week, so there is a one-to-many relationship between users and itineraries. There is a beginning or ending relationship between the itinerary and the metro station, as shown in Figure 5.
(2)
The urban road traffic knowledge graph
According to the acquired road data, points of interest information (primary and middle schools), and traffic situation data of the area within the Fifth Ring Road in Beijing, the entities, attributes, and relationships between entities were extracted to construct a knowledge graph of urban road traffic. The entities included urban roads, points of interest, and traffic situations in the domain ontology, and entities representing spatio-temporal relationship data, such as date, time, intersection, and road section, were added. Figure 6 shows the entities included in the urban road traffic knowledge graph and the relationships between the entities.
In Neo4j graph data, both nodes and relationships can set attributes and store them in the form of key-value pairs [40]. The attributes as shown in Table 9.
The road section was connected to the road intersection and was divided according to the driving direction of the vehicle on the road. The road section had starting and ending point intersections. The relationship between the road section and the intersection is shown in Figure 7. The intersection and road sections constitute the topological structure of the urban road network.

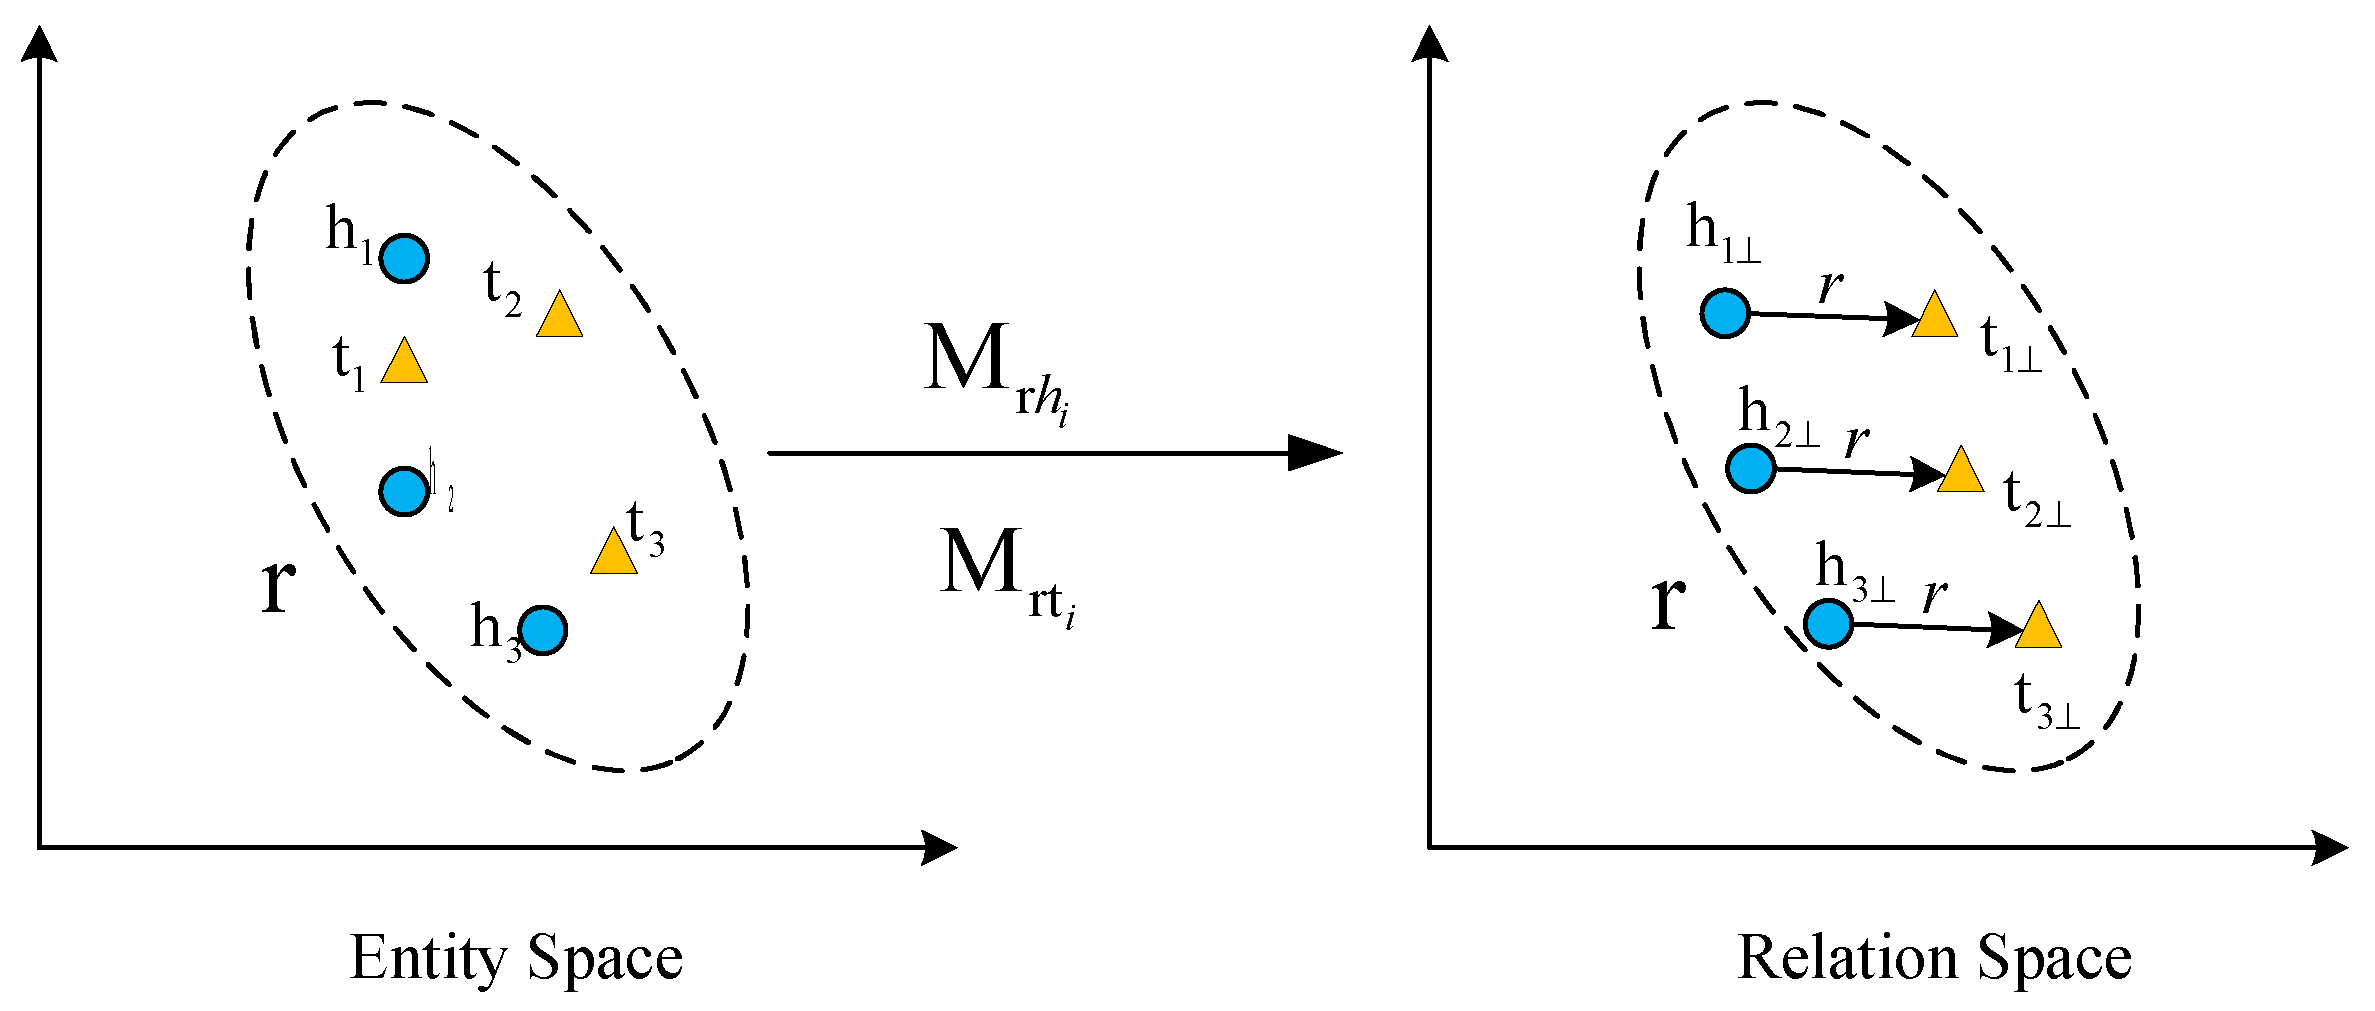
3.3. Knowledge Reasoning Model Based on Representation Learning

The main idea of knowledge reasoning based on representation learning is to transform the semantic information of entities and relationships in a knowledge graph into dense low-dimensional vectors, to map them into the vector space, and then to participate in calculations to complete tasks such as entity linking and relationship reasoning. Knowledge representation learning can effectively improve computing efficiency and can reduce the impact of data sparseness on the model inference results.

3.3.1. Model Definition

This paper used the TransD model. The main idea was to use the dynamic mapping matrix constructed by the projection vector to encode the entity as a low-dimensional embedding vector in the relational space. At the same time, it was considered that entities and relationships have different types and attributes, so different types of relationships define different semantic spaces, and different attributes focus on different entities under different relationships, as shown in Figure 8.
The TransD model uses two vectors to represent each entity and relationship. The first vector represents the actual meaning of the entity or relationship, and the second vector is called the projection vector and is used to construct the mapping matrix. The mapping matrix is jointly determined by the projection vector of the entity and the relationship. The entity can be mapped from the entity space to the vector space, and each mapping matrix is initialized with the identity matrix, and the vector operation is used to replace the matrix multiplication operation, which effectively reduces the amount of calculation.
M r h = r p h p T + I m × n
M r t = r p t p T + I m × n
The entity vector is projected into the relational space and embedded as:
h = M r h h
t = M r t t
Inspired by word2vec’s word vector translation invariance phenomenon, TransD regards the relationship vector r in the triple ( h , r , t ) as the translation vector of the head entity vector h and the tail entity vector t. That is, the sum of the embedding vector of the head entity h and the embedding vector of the relationship r in the embedding space are approximately equal to the embedding vector of the tail entity t . Therefore, a score function based on L2 Euclidean distance can be defined to measure the distance between these two vectors:
f r ( h , t ) = h + r t 2 2
The model adds the L2 norm constraint to the vector, which can make the related parameters of the model smaller, can avoid over-fitting of the model, and can improve the generalization ability of the model. We enforced constrains as:
  h   2 1 ,     t   2   1 ,     r   2 1 ,     h   2   1 ,     t   2   1
For a correct triplet, the higher the score expected, the better; meanwhile, for a wrong triple, the smaller the score, the better. Thus, a margin-based ranking loss function was defined, such as shown in Equation (7), to minimize the loss function value as the training target of the model.
L = ( h , r , t ) ( h , r , t ) γ + f r ( h , t ) f r ( h , t ) +
where γ is a hyperparameter, which represents the maximum interval between the correct triplet and the negative triplet, x + = m a x ( 0 , x ) , represents the set of correct triples, and represents the set of constructed negative triples.

3.3.2. Construction Method of Negative Sample

Since there are only correct triples in a knowledge graph, wrong triples need to be constructed as negative samples. The method used by the TransE model is to randomly select an entity from the set of all entities for a correct triple to replace the head or tail entity of the original triple and to obtain a new wrong triple, that is, a negative triple. However, due to the existence of the one-to-many, many-to-one, and many-to-many types of relationships, this random sampling method of constructing negative samples introduces many false-negative samples, that is, false negatives.
Taking into account the different types of relationships, when replacing the head or tail entity in the triple, the one with a smaller number is replaced with a greater probability. For example, when the relationship is one-to-many, that is, one head entity corresponds to multiple tail entities, the head entity is replaced with a greater probability. When the relationship is many-to-one, that is, multiple head entities correspond to one tail entity, the tail entity is replaced with a greater probability. For all relationship triples, the following numbers are counted:
  • The average number of tail entities associated with each head entity is recorded as t p h ;
  • the average number of head entities associated with each tail entity is recorded as h p t .
X = 1 , replace head entity 0 , replace tail entity
The random variable X only takes the two values of 0 and 1, and the corresponding probability is:
P r ( X = 1 ) = p = t p h t p h + h p t
P r ( X = 0 ) = 1 p = h p t t p h + h p t
The construction of the final negative sample obeys the Bernoulli distribution with parameter p, and the distribution law of the random variable X is:
P ( X = x ) = p x ( 1 p ) ( 1 x ) , x = 0 , 1
For a certain correct triple of a given relationship, the probability of generating a negative triple by replacing the head entity is p, and the probability of generating a negative triple by replacing the tail entity is 1 p .
In addition, the type of constraint of the relationship is expressed by defining the type of entity that the relationship should be associated with. Using prior knowledge of the relationship type, the relationship determines which entities to replace. For example, the definition of the relationship type marriage is only associated with a person [41]. The following variables are to be defined:
  • The ordered index of all entities within the domain constraint of the relationship type d o m a i n r ;
  • The ordered index of all entities within the range constraint of the relationship type r a n g e r .
For a triple of a given relationship r, when constructing a negative triple, the probability of replacing the head or tail entity is calculated according to the Bernoulli distribution. If the head entity is replaced, it is selected from the entity subset in the domain of the relationship type, and if the tail entity is replaced, it is selected from the entity subset in the range of the relationship type, as shown in Equation (12).
= ( h , r , t ) ( h , r , t ) , h E [ d o m a i n r ] E , t E [ r a n g e r ] E
Using prior knowledge of the relationship type, the probability of extracting the correct type of entity to replace the original triple when constructing a negative sample is improved.

3.3.3. Model Training Process

The model uses mini-batch gradient descent (MBGD) to update the parameters and to obtain the minimum value of the loss function. In the training process, small batches of positive samples are randomly selected, and their corresponding negative samples are constructed. After a batch, the gradient is calculated and the model parameters are updated. The model updates the parameters through continuous iterations until the loss value converges or reaches the maximum number of iterations. After the training has been completed, the embedding representation of entities and relationships is obtained. Algorithm 1 is the pseudocode for the algorithm training:
Algorithm 1. Reasoning algorithm training process based on representation learning.
Input: Training sample set S, total number of samples N, entity set E, relationship set R, learning rate α , embedding dimension k, boundary γ , The maximum number of iterations M, the number of small batch samples b a t c h _ s i z e
Output: Vector representation of entities and relationships
1: /* initialize */
2: for each r R do
3:        r u n i f o r m ( t e n s o r , k , k )
4: end for
5: for each e E do
6:        e u n i f o r m ( t e n s o r , k , k )
7: end for
8: while i < M do
9:     while j < N b a t c h _ s i z e do
10:          S b a t c h S a m p l e ( S , b a t c h _ s i z e )
11:          T b a t c h
12:         for each ( h , r , t ) S b a t c h do
13:               ( h , r , t ) S b a t c h
14:               T b a t c h T b a t c h ( h , r , t ) , ( h , r , t )
15:         end for
16:         Update embedding w.r.t
17:          ( h , r , t ) , ( h , r , t ) T b a t c h m i n [ γ + f ( h , t ) f ( h , t ) , 0 ]
18:          j + +
19:     end while
20:      i + +
21:      j 0
22: end while

3.3.4. Experiment and Results Analysis

The reasoning performance of the model was evaluated through the link prediction of the evaluation task of knowledge completion. Link prediction refers to the task of predicting another entity that has a specific relationship with a given entity, that is, for a triple ( h , r , t ) , a given relationship r and a tail entity t predict the head entity h, denoted as ( ? , r , t ) , or a given head entity h and relationship r predicts the tail entity t, denoted as ( h , r , ? ) .
The data used in this paper were the data of a public traffic knowledge graph stored in the graph database. The triplet data were divided into a training set, a test set, and a validation set according to the ratio of 85%:10%:5%. The data volume of the entities, relationships, and triples contained in the data set is shown in Table 10.
For each triplet in the test set, the prediction tail entity was taken as an example, and the tail entity was replaced with entities in the knowledge graph in turn. These replacement entities were determined by the relationship type, that is, the relationship type constraint was used to construct negative samples. Then, the score function was used to calculate the scores of these triples and to arrange them in descending order to count the ranking of the correct entities.
This paper used multiple evaluation indicators to measure the effect of link prediction tasks, including average rank (MR), average reciprocal rank (MRR), first hit rate (hits@1), top three hit rate (hits@3), and the top ten hit rate (hits@10). The average rank was the average rank of the correct triple in the test set. The top ten hit rate (hits@10) indicates the ratio of the number of triples in the top ten to the total number of triples in the test set. When the evaluation index average rank was smaller, the average reciprocal rank, hits@1, hits@3, and hits@10 were larger, indicating better reasoning performance.
Because the constructed negative triples may be the correct triples (false negatives) that exist in the training, validation, or test set, that is, knowledge that already exists in the knowledge graph but is misjudged as a wrong triple, it is necessary to delete such triples before sorting to improve the accuracy of model prediction; this operation is called filtering.
Comparing the TransD model to the classic reasoning models TransE and TransH, both filtering and relationship type constraints were used. The evaluation indicators defined in this paper were used to compare the results of the different models in the entity link prediction task. The optimal hyperparameter settings of the different models are shown in Table 11. Among them, the adadelta optimizer was used during TransD model training, which can adaptively adjust the learning rate [42].
Regarding the public traffic knowledge graph data set constructed in this paper, the results of the different models on the link prediction task were compared. Table 12 shows the results of predicting the head and tail entities. In order to facilitate a comparison, the optimal value of each evaluation index is marked in bold, and a bar chart was drawn with the MRR and hits@10 indicators as representatives, as shown in Figure 9, which can intuitively compare the performance of each model.
By comparing the prediction results of the different models, it can be found that the TransD model achieved the best effect, and it performed better than the other two reasoning models on all evaluation indicators. When predicting the head entity, the average reciprocal ranking (MRR) of the TransD model increased by 6.6% compared to the average ranking of the TransH model. When predicting the tail entity, the indicator increased by 22.4%.
For the urban road traffic travel knowledge graph, whether or not the reasoning model can complement the speed value of the road at a certain moment was verified. By comparing the average road speed before and after school starts, it was found that the average road speed decreased by approximately half an hour in the morning rush hours after school starts, as shown in Figure 10. Table 13 shows the top five entities in predicting the tail entity under the relationship between time and the traffic situation. Even if the correct triples were not always the top ones, these prediction results are consistent with common sense. At the same time, the speed value before the beginning of school was greater than the speed value after the beginning of school, which also shows that students going to school affects the traffic situation on the road.

3.4. Knowledge Discovery Based on the Knowledge Graph

(1)
Relationship path discovery
Based on the multi-depth relationship node query of the graph database Neo4J, all entities that have an association with the target entity within the specified path length range can be found, or hidden relationships between entities can be discovered. For example, there was an associated path between the point of interest and the traffic situation of the road, as shown in Figure 11.
(2)
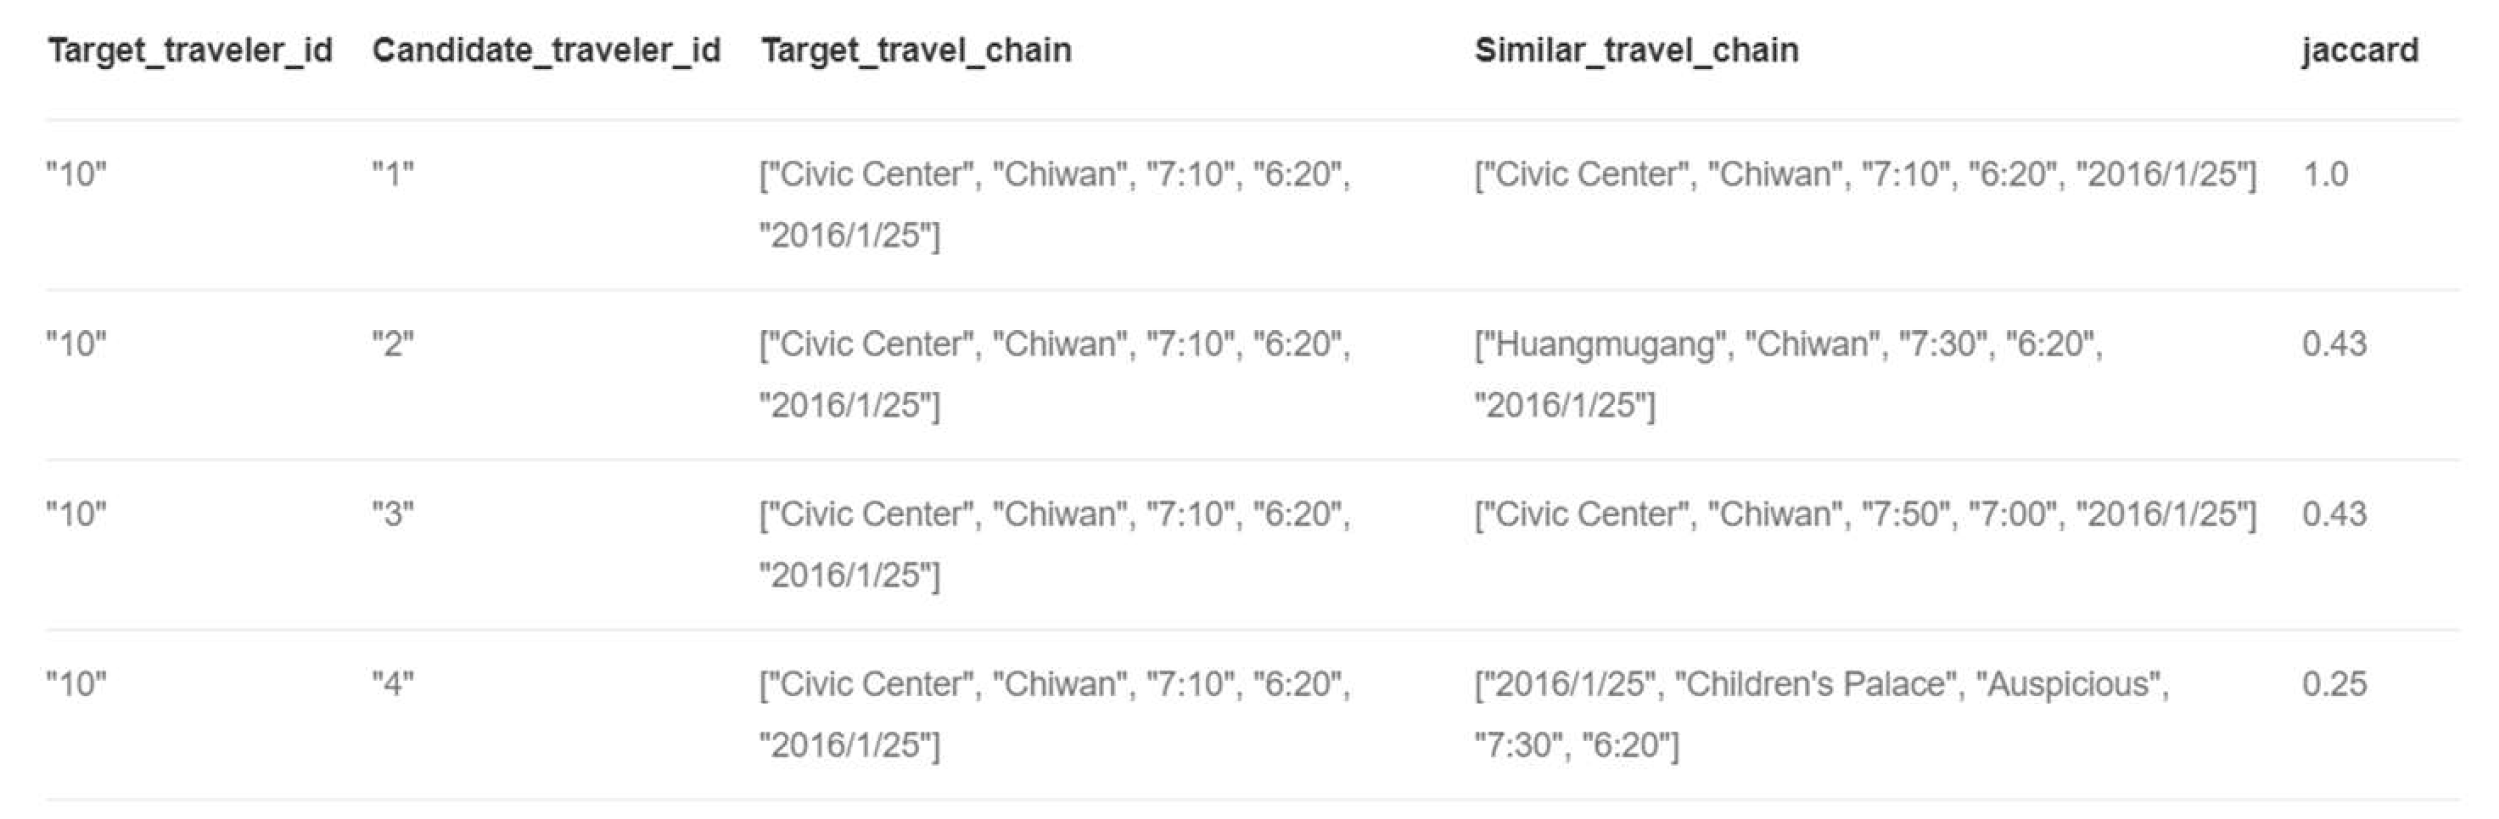
Similar travelers found
This paper used the Jaccard coefficient to compare the similarity of travelers, and measured the similarity of their trips by calculating the ratio of the same part of the entity to the different part of the commuter’s travel chain [43]. The similarity between the travel chains of commuters A and B was calculated as per Equation (13), and the calculation results are shown in Figure 12. From the results, it can be seen that the similarity between commuters who have the same start and end points and the same departure and arrival time is the highest.
s i m ( T A , T B ) = T A T B T A T B
(3)
Shortest path query
The urban road traffic knowledge graph constructed in this paper included the topological structure of the road network and the length information of the road sections. Thus, it can use the Dijkstra algorithm in the path search algorithm to find the shortest distance path between two nodes, and can provide a data basis for route planning services of traffic. As shown in Figure 13, where the intersection numbered 1 was taken as the starting point and the intersection numbered 9 as the end point, the path with the shortest distance between the start and end points was found and is marked with a red line in the figure.

4. Conclusions

This paper studied the construction method of a knowledge graph in the field of urban traffic. Using a top-down construction method, we first analyzed the knowledge system in the field of urban traffic, and then designed the model layer of the knowledge graph of traffic. Afterward, the extracted entities, attributes, and relationships between entities were stored in the graph database Neo4j, and finally, the construction of a public traffic knowledge graph and an urban road traffic travel knowledge graph was completed. Then, a link prediction task was performed on the traffic data set, and the effectiveness of the reasoning model used in this paper was verified by comparing the results to the evaluation indicators of other models. Finally, it was shown that knowledge discovery can be realized based on the constructed knowledge graph of the urban traffic field.
Our contributions can be summarized as following:
(1)
The urban traffic knowledge graph constructed in this paper aims to discover potential relationship between different traffic entities, such as discovering traffic entities related to road congestion. Compared to the congestion detection of other knowledge graphs, it can more effectively assist managers in formulating strategies to alleviate road congestion.
(2)
The problem that the conclusions of traditional transportation research cannot be widely promoted can be solved by the knowledge graph. The knowledge contained in the knowledge graph is universal; a set of traffic knowledge systems that can be shared and reused was formed in our paper. Moreover, with the accumulation of relevant data, the new knowledge obtained through reasoning can optimize and enrich the original knowledge graph.
(3)
Based on the constructed urban traffic knowledge graph, it is possible to realize traffic knowledge discovery and intelligent question answering of urban traffic services, such as similar traveler discovery and the shortest path query.
Because the construction method of a knowledge graph, such as the entities included and the relationships between the entities, affects the efficiency and accuracy of the reasoning model, in the future, we will study ways to improve the accuracy of the reasoning model by improving the construction of a knowledge graph. However, the knowledge graph we constructed herein and the research were only based on a small scene in urban traffic. In the future, we will add more traffic-related data, study the relationship between weather and traffic accidents, and explore the factors that influence the choice of the travel modes of traffic participants.

Author Contributions

Conceptualization, W.G. and T.L.; methodology, J.T.; software, Q.Q.; validation, J.T.; formal analysis, W.G.; investigation, T.L.; resources, J.T.; data curation, W.G.; writing—original draft preparation, Q.Q.; writing—review and editing, J.T.; visualization, W.G.; supervision, T.L.; project administration, J.T.; funding acquisition, W.G. All authors read and agreed to the published version of the manuscript.

Funding

This research was funded by the National Key R&D Program of China, grant number 2018YFB1601100.

Institutional Review Board Statement

Not applicable.

Informed Consent Statement

Informed consent was obtained from all of the subjects involved in this study.

Data Availability Statement

The data presented in this study are available on request from the corresponding author.

Conflicts of Interest

The authors declare no conflict of interest.

References

  1. Qi, B. Research on Urban Traffic Governance and Optimizing Strategy Based on Big Data. In Proceedings of the 2020 IEEE International Conference on Power, Intelligent Computing and Systems (ICPICS), Shenyang, China, 28–30 July 2020; pp. 188–192. [Google Scholar] [CrossRef]
  2. Zheng, Z.; Liu, Y.; Zhang, Y.; Wen, C. TCMKG: A Deep Learning Based Traditional Chinese Medicine Knowledge Graph Platform. In Proceedings of the 2020 IEEE International Conference on Knowledge Graph (ICKG), Nanjing, China, 9–11 August 2020; pp. 560–564. [Google Scholar] [CrossRef]
  3. Singhal, A. Introducing the Knowledge Graph Things, Not Strings. Available online: https://www.blog.google/products/search/introducing-knowledge-graph-things-not/ (accessed on 5 January 2021).
  4. Suchanek, F.M.; Kasneci, G.; Weikum, G. YAGO: A Core of Semantic Knowledge Unifying WordNet and Wikipedia. In Proceedings of the International Conference on World Wide Web, Banff, AB, Canada, 8–12 May 2007; pp. 697–706. [Google Scholar] [CrossRef] [Green Version]
  5. Bollacker, K.D.; Evans, C.; Paritosh, P.; Sturge, T.; Taylor, J. Freebase: A collaboratively created graph database for structuring human knowledge. In Proceedings of the Sigmod Conference, Vancouver, BC, Canada, 10–12 June 2008; pp. 1247–1250. [Google Scholar] [CrossRef]
  6. Lehmann, J. DBpedia: A large-scale, multilingual knowledge base extracted from wikipedia. Semant. Web 2021, 7, 154–165. [Google Scholar] [CrossRef] [Green Version]
  7. Niu, X.; Sun, X.; Wang, H.; Rong, S.; Qi, G.; Yu, Y. Zhishi.me—Weaving Chinese Linking Open Data. In Proceedings of the Semantic Web, ISWC 2011; Springer: Berlin/Heidelberg, Germany, 2011; pp. 205–220. [Google Scholar] [CrossRef] [Green Version]
  8. Xu, B.; Xu, Y.; Liang, J.; Xie, C.; Liang, B.; Cui, W.; Xiao, Y. CN-DBpedia: A Never-Ending Chinese Knowledge Extraction System; Springer: Cham, Switzerland, 2017; pp. 428–438. [Google Scholar] [CrossRef]
  9. Gong, F.; Wang, M.; Wang, H.; Wang, S.; Liu, M. SMR: Medical Knowledge Graph Embedding for Safe Medicine Recommendation. Big Data Res. 2021, 23. [Google Scholar] [CrossRef]
  10. KGBC: Knowledge Graph of Breast Cancer. Available online: http://wasp.cs.vu.nl/BreastCancerKG/ (accessed on 18 January 2021).
  11. Zhang, Q.; Wen, Y.; Zhou, C.; Long, H.; Dong, H.; Zhang, F.; Xiao, C. Construction of Knowledge Graphs for Maritime Dangerous Goods. Sustainability 2019, 11, 2849. [Google Scholar] [CrossRef] [Green Version]
  12. Li, L.; Jiang, R.; He, Z.; Chen, X.; Zhou, X.S. Trajectory Data-Based Traffic Flow Studies: A Revisit. Transp. Res. Part C Emerg. Technol. 2020, 114, 225–240. [Google Scholar] [CrossRef]
  13. Ma, D.; Song, X.B.; Li, P. Daily Traffic Flow Forecasting Through a Contextual Convolutional Recurrent Neural Network Modeling Inter-and Intra-Day Traffic Patterns. IEEE Trans. Intell. Transp. Syst. 2020, 1–10. [Google Scholar] [CrossRef]
  14. Mohammed, O.; Kianfar, J. A Machine Learning Approach to Short-Term Traffic Flow Prediction: A Case Study of Interstate 64 in Missouri. In Proceedings of the 2018 IEEE International Smart Cities Conference (ISC2), Kansas City, MI, USA, 16–19 September 2018. [Google Scholar]
  15. Shen, L.; Liu, R.; Yao, Z.; Wu, W.; Yang, H. Development of Dynamic Platoon Dispersion Models for Predictive Traffic Signal Control. IEEE Trans. Intell. Transp. Syst. 2019, 20, 431–440. [Google Scholar] [CrossRef]
  16. Xiao, J.; Song, X.B.; Ma, X.; Jin, S. A Back-Pressure-Based Model With Fixed Phase Sequences for Traffic Signal Optimization Under Oversaturated Networks. IEEE Trans. Intell. Transp. Syst. 2020, 1–12. [Google Scholar] [CrossRef]
  17. Zhang, N.; Chen, H.; Chen, X.; Chen, J. Semantic Framework of Internet of Things for Smart Cities: Case Studies. Sensors 2016, 16, 1501. [Google Scholar] [CrossRef] [PubMed]
  18. Zhang, N.; Deng, S.; Chen, H.; Chen, X.; Chen, J.; Li, X.; Zhang, Y. Structured Knowledge Base as Prior Knowledge to Improve Urban Data Analysis. ISPRS Int. J. Geo-Inf. 2018, 7, 264. [Google Scholar] [CrossRef] [Green Version]
  19. Muppalla, R.; Lalithsena, S.; Banerjee, T.; Sheth, A. A Knowledge Graph Framework for Detecting Traffic Events Using Stationary Cameras. Ind. Knowl. Graphs 2017, 2017, 431–436. [Google Scholar] [CrossRef]
  20. Zhou, G.; Chen, F. Urban Congestion Areas Prediction By Combining Knowledge Graph And Deep Spatio-Temporal Convolutional Neural Network. In Proceedings of the 2019 4th International Conference on Electromechanical Control Technology and Transportation (ICECTT), Guilin, China, 26–28 April 2019; pp. 105–108. [Google Scholar] [CrossRef]
  21. Kusmawan, P.; Hong, B.; Jeon, S.; Lee, J.; Kwon, J. Computing Traffic Congestion Degree Using SNS-based Graph Structure. In Proceedings of the 2014 IEEE/ACS 11th International Conference on Computer Systems and Applications (AICCSA), Doha, Qatar, 10–13 November 2014; pp. 397–404. [Google Scholar] [CrossRef]
  22. Lu, S.Y.; Hsu, K.; Kuo, L. A Semantic Service Match Approach Based on WordNet and SWRL Rules. In Proceedings of the 2013 IEEE 10th International Conference on e-Business Engineering, Coventry, UK, 11–13 September 2013; pp. 419–422. [Google Scholar] [CrossRef]
  23. Lehmann, J. DL-Learner: Learning Concepts in Description Logics. J. Mach. Learn. Res. 2009, 10, 2639–2642. [Google Scholar] [CrossRef]
  24. Gangemi, A.; Nuzzolese, A.; Presutti, V.; Draicchio, F.; Musetti, A.; Ciancarini, P. Automatic Typing of DBpedia Entities; Springer: Berlin/Heidelberg, Germany, 2012; pp. 65–81. [Google Scholar] [CrossRef] [Green Version]
  25. Liu, Z.; Sun, M.; Lin, Y.; Xie, R. Knowledge Representation Learning: A Review. Comput. Res. Dev. 2016, 53, 247–261. [Google Scholar] [CrossRef]
  26. Bordes, A.; Weston, J.; Collobert, R.; Bengio, Y. Learning Structured Embeddings of Knowledge Bases. In Proceedings of the Aaai Conference on Artificial Intelligence, San Francisco, CA, USA, 7–11 August 2011; Volume 1, pp. 301–306. [Google Scholar]
  27. Socher, R.; Chen, D.; Manning, C.; Ng, A. Reasoning with neural tensor networks for knowledge base completion. Lake Tahoe 2013, 2013, 926–934. [Google Scholar]
  28. Nickel, M.; Tresp, V.; Kriegel, H.P. A Three-Way Model for Collective Learning on Multi-Relational Data. In Proceedings of the 28th International Conference on Machine Learning, Bellevue, WA, USA, 28 June–2 July 2011; pp. 809–816. [Google Scholar]
  29. Mikolov, T.; Chen, K.; Corrado, G.; Dean, J. Efficient Estimation of Word Representations in Vector Space. In Proceedings of the Workshop at ICLR, Scottsdale, AZ, USA, 2–4 May 2013. [Google Scholar]
  30. Bordes, A.; Usunier, N.; Garcia-Duran, A.; Weston, J.; Yakhnenko, O. Translating Embeddings for Modeling Multi-relational Data. In Proceedings of the Neural Information Processing Systems, Lake Tahoe, NV, USA, 5–10 December 2013; pp. 2787–2795. [Google Scholar]
  31. Wang, Z.; Zhang, J.; Feng, J.; Chen, Z. Knowledge Graph Embedding by Translating on Hyperplanes. In Proceedings of the Twenty-Eighth AAAI Conference on Artificial Intelligence, Quebec City, QC, Canada, 27–31 July 2014; pp. 1112–1119. [Google Scholar]
  32. Lin, Y.; Liu, Z.; Sun, M.; Liu, Y.; Zhu, X. Learning entity and relation embeddings for knowledge graph completion. In Proceedings of the AAAI, Austin, TX, USA, 25–30 January 2015; pp. 2181–2187. [Google Scholar]
  33. Ji, G.; He, S.; Xu, L.; Liu, K.; Zhao, J. Knowledge Graph Embedding via Dynamic Mapping Matrix. In Proceedings of the 53rd Annual Meeting of the Association for Computational Linguistics, Beijing, China, 26–31 July 2015; pp. 687–696. [Google Scholar]
  34. AMapl. AutoNavi Web Service API. Available online: https://developer.amap.com/api/webservice/summary/ (accessed on 1 May 2020).
  35. Hu, L.W.; Yang, J.Q.; He, Y.R.; Meng, L.; Luo, Z.W.; Hu, C.Y. Urban Traffic Congestion Radiation Model and Damage Caused to Service Capacity of Road Network. China J. Highw. Transp. 2019, 32, 149–158. [Google Scholar]
  36. Peng, S.; Chen, S.; Xu, Q.; Niu, J. Spatial characteristics of land use based on POI and urban rail transit passenger flow. Acta Geogr. Sin. 2021, 76, 459–470. [Google Scholar]
  37. JIA, M.; ZHANG, Y.; PAN, T.; WU, W.; SU, F. Ontology Modeling of Marine Environmental Disaster Chain for Internet Information Extraction: A Case Study on Typhoon Disaster. J. Geo-Inf. Sci. 2020, 22, 2289–2303. [Google Scholar]
  38. Noy, N.; Mcguinness, D. Ontology Development 101: A Guide to Creating Your First Ontology; Stanford University: Stanford, CA, USA, 2001. [Google Scholar]
  39. Stanford Universityl. Protégé 5 Documentation. Available online: https://protege.stanford.edu/support.php#documentationSupport (accessed on 3 December 2020).
  40. Jouili, S.; Vansteenberghe, V. An Empirical Comparison of Graph Databases. In Proceedings of the 2013 International Conference on Social Computing, Washington, DC, USA, 8–14 September 2013; pp. 708–715. [Google Scholar] [CrossRef]
  41. Krompass, D.; Baier, S.; Tresp, V. Type-Constrained Representation Learning in Knowledge Graphs. In Proceedings of the 14th International Semantic Web Conference (ISWC), Bethlehem, PA, USA, 11–15 October 2015. [Google Scholar] [CrossRef] [Green Version]
  42. Han, X.; Cao, S.; Lv, X.; Lin, Y.; Liu, Z.; Sun, M.; Li, J. OpenKE: An Open Toolkit for Knowledge Embedding. In Proceedings of the 2018 Conference on Empirical Methods in Natural Language Processing: System Demonstrations, Brussels, Belgium, 31 October–4 November 2018; pp. 139–144. [Google Scholar] [CrossRef] [Green Version]
  43. Neo4j Graph Algorithms. Available online: https://neo4j.com/docs/graph-algorithms/current/labs-algorithms/jaccard/ (accessed on 4 January 2021).
Figure 1. Research framework for the construction and complement of knowledge graphs in the field of urban traffic.
Sustainability 13 03191 g001
Figure 2. The class hierarchy of the ontology in the urban traffic domain.
Sustainability 13 03191 g002
Figure 3. The relationship between the classes of the urban traffic ontology.
Sustainability 13 03191 g003
Figure 4. Part of the ontology visualization in the field of urban traffic.
Sustainability 13 03191 g004
Figure 5. The relationship between public transport users and itineraries and itineraries and stations.
Sustainability 13 03191 g005
Figure 6. The entities and relationships of the urban road traffic knowledge graph.
Sustainability 13 03191 g006
Figure 7. The relationship between road intersections and road sections.
Sustainability 13 03191 g007
Figure 8. Illustration of the TransD model.
Sustainability 13 03191 g008
Figure 9. Comparison chart of the reasoning model results.
Sustainability 13 03191 g009
Figure 10. Comparison of the average speed during the morning peak hour on Ping’an Lixi Street before and after the beginning of school.
Sustainability 13 03191 g010
Figure 11. Correlation path between points of interest and the traffic situation.
Sustainability 13 03191 g011
Figure 12. The similarity calculation results between the commuter travel chains.
Sustainability 13 03191 g012
Figure 13. Schematic diagram of finding the shortest distance path between two intersections.
Sustainability 13 03191 g013
Table 1. Static basic data of metro.
Serial NumberField NameData TypesDescription
1LINE_NAMEBIGINTMetro line name
2LINE_IDBIGINTLine number
3STATION_NAMEVARCHARMetro station name
4STATION_INDEXINTStation serial number
5STATION_IDBIGINTStation number
6STATION_POSITIONVARCHARCoordinates
7CROSS_LINEVARCHARLine through this station
Table 2. Metro AFC swipe data format.
Serial NumberField NameData TypesDescription
1CARD_IDFLOATIC card unique code
2COST_TYPEINTTransaction type
3COST_TIMETIMESTAMPTransaction time
4LINE_NAMEVARCHARLine name
5STATION_NAMEVARCHARStation name
6VEHICLE_NUMVARCHARLicense plate number
Table 3. Field descriptions of the road network nodes.
Serial NumberField NameData TypesDescription
1NODE_IDNUMERICNode unique ID
2OSM_HIGHWAYVARCHARNode type
3Control_TYPEINTTraffic control type
4POSITIONVARCHARCoordinate
Table 4. Field description of the road network connection link.
Serial NumberField NameData TypesDescription
1ROAD_NAMEVARCHARRoad name
2LINK_IDNUMERICLink ID
3FROM_NODE_IDNUMERICStart node ID
4TO_NODE_IDNUMERICEnd node ID
5LENGTHDOUBLELength, unit: meters
6GEOMETRYGEOMETRYLocation,WKT
TheWell-Known Text (WKT) representation of Geometry is designed to exchange geometry data in ASCII form.
Table 5. Point of interest (POI) information field description.
Serial NumberField NameData TypesDescription
1POI_IDVARCHARPOI ID
2POI_NAMEVARCHARPOI name
3TYPE_CODENUMERICType code
4ADDRESSVARCHARAddress
5POI_LOCATIONVARCHARCoordinates
Table 6. Field description of the traffic situation information.
Serial NumberField NameData TypesDescription
1ROAD_NAMEVARCHARRoad name
2STATUSINTRoad situation
3DIRECTIONVARCHARSection direction
4ANGLEINTVehicle driving angle
5SPEEDINTAverage speed of road
6ROAD_POLYGONVARCHARLocation, WKT
7DATE_TIMETIMESTAMPRecord time
Table 7. The attributes of the classes in the ontology.
ClassesAttributes
Public transitLine name, starting station, terminal station, and first and last vehicle time
Transport junctionStation name, coordinate, and line ID of the station
Urban roadRoad name, road class, road location, driving direction, and road length
Traffic participantsUnique ID of person
Traffic situationRoad name, average speed, recording date, and recording time
Points of interestID, name, category, address, and coordinates
Table 8. The attributes of the entities and relationships in the public traffic knowledge graph.
TypeNameAttributes
EntityPassenger in metroID of the person’s IC card
ItineraryDeparture time and station and arrival time and station
Metro lineLine name, direction, start/terminal station and time, and line ID
Metro stationStation name, Line id, and coordinates
RelationshipPassenger-have-ItinerarySequence number
Itinerary-start/end-StationDeparture time/end time
Station-belong-LineSequence number of the station in the line
Station-near_by-StationLine ID and drive direction
Table 9. Attributes of the entities and relationships in the urban road traffic knowledge graph.
TypeNameAttributes
EntityIntersectionIntersection number, control type, and coordinates
Road SectionSection number, section length, road name, and section location
RoadRoad number, road name, road grade, and driving direction
Points of InterestPOI ID, POI name, address, and coordinates
DateDate number and date name
TimeTime code, time name, and before/after school type
Traffic situationTraffic situation number and speed value
RelationshipIntersection-link-SectionLink_form/to_node (type) and road name
Section-belong-RoadSection_belong_street(type) and road name
POI-located-RoadPOI name and road name
Road-date_attribute-DateRoad_date(type)
Date-time_attribute-TimeDate_time(type)
Time-attribute-SituationTime_speed(type), date, time, and direction
Table 10. Number of data sets.
EntitiesRelationshipsTraining SetTest SetValidation Set
597,21641,269,031149,29974,647
Table 11. Hyperparameter values of the different models.
ModelLearning RateDimensionMarginBatch_SIZEIterations
TransE0.011001128500
TransH0.011000.25256500
TransD1501256500
Table 12. Results of predicting the head and tail entities.
ModelHead Entity PredictionTail Entity Prediction
MRRMRhits@10hits@3hits@1MRRMRhits@10hits@3hits@1
TransE0.1613670330.2%20.3%10.0%0.093424.2%7.2%2.1%
TransH0.329329250.0%32.5%27.5%0.194235.0%22.5%10.0%
TransD0.357816250.0%35.0%30.0%0.233337.5%27.5%17.5%
The bold number represents the optimal value, MRR:average reciprocal rank, MR:average rank, hits@10:the top ten hit rate, hits@3:the top three hit rate, hits@1:the first hit rate.
Table 13. Names of the top five entities in predicting the tail entity under the relationship between time and the traffic situation.
Input (Head and Relationship)Predicted Tails
Before_7:15, time_speedBefore_7:15, Beijing no. 3 middle school, 45, 40, 30
After_7:15, time_speed35, 30, 7:15, 40, 45
The bold value represents the correct entitye.
Publisher’s Note: MDPI stays neutral with regard to jurisdictional claims in published maps and institutional affiliations.

