Article

Effects of Heat Stress on Growth, Physiology of Plants, Yield and Grain Quality of Different Spring Wheat (Triticum aestivum L.) Genotypes

1
School of Agronomy, Anhui Agricultural University, Hefei 230036, China
2
Key Laboratory of Wheat Biology and Genetic Improvement on South Yellow & Huai River Valley, Ministry of Agriculture, Hefei 230036, China
3
National United Engineering Laboratory for Crop Stress Resistance Breeding, Hefei 230036, China
4
Maize and Millets Research Institute, Yusafwala-Sahiwal 57001, Pakistan
5
Department of Botany, Mir Chakar Khan Rind University, Sibi 82000, Pakistan
6
The National Engineering Laboratory of Crop Stress Breeding, School of Life Sciences, Anhui Agricultural University, Hefei 230036, China
7
Anhui Key Laboratory of Crop Biology, Hefei 230036, China
*
Authors to whom correspondence should be addressed.
Sustainability 2021, 13(5), 2972; https://doi.org/10.3390/su13052972
Submission received: 30 January 2021 / Revised: 3 March 2021 / Accepted: 4 March 2021 / Published: 9 March 2021

Abstract

:
Heat stress is one of the major threats to wheat production in many wheat-growing areas of the world as it causes severe yield loss at the reproductive stage. In the current study, 28 crosses were developed using 11 parental lines, including 7 female lines and 4 male testers following line × tester matting design in 2018–2019. Twenty-eight crosses along with their 11 parental lines were sown in a randomized complete block design in triplicate under optimal and heat stress conditions. Fifteen different morpho-physiological and grain quality parameters were recorded at different growth stages. Analysis of variance illustrated the presence of highly significant differences among wheat genotypes for all traits under both optimal and heat stress conditions. The results of combining ability unveiled the predominant role of non-additive gene action in the inheritance of almost all the studied traits under both conditions. Among parents, 3 parental lines WL-27, WT-39, and WL-57 showed good combining ability under both normal and heat stress conditions. Among crosses, WL-8 × WT-17, WL-37 × WT-17, WL-7 × WT-39, and WL-37 × WT-39 portrayed the highest specific combining ability effects for grain yield and its related traits under optimal as well as heat stress conditions. Biplot and cluster analysis confirmed the results of general and specific combining ability by showing that these wheat crosses belonged to a highly productive and heat tolerant cluster. Correlation analysis revealed a significantly positive correlation of grain yield with net photosynthetic rate, thousand-grain rate, and the number of grains per spike. The designated parental lines and their crosses were selected for future breeding programs in the development of heat resilient, climate-smart wheat genotypes.

1. Introduction

Global climate change is drastically affecting sustainable crop production. Extreme weather events, especially temperature and rainfall inconsistencies, are putting a great danger on the successful cultivation of field crops to feed the immensely growing human population. Among the other environmental factors, high temperature is one of the most recurrent forms of abiotic stress. Extreme temperature events like severe heatwaves and floods are expected to become more frequent and severer in many wheat-growing regions of the world. Under such conditions, the temperature may increase over 5 °C above normal temperature [1].
Wheat, being the second most important staple food of the human population, is adapted to a wide range of eco-climatic conditions in six continents of the world. About 36% of the world population depends directly on wheat to fulfill its calorie requirements. It provides 21% caloric and 20% protein requirements to about 4.5 billion peoples of the world, and most of them belong to developing countries [2]. In 2019, wheat was cultivated on an area of 215.9 million hectares in the world, and 765.8 million tonnes production was obtained with an average yield of 3547 kg/ha, respectively [3]. However, this amount would not be enough to feed the immensely increasing world’s population, and 198 million tonnes of additional wheat would be required by 2050. To achieve this milestone, wheat grain yield in developing countries must be increased by 77% [4]. This could only be achieved by developing high yielding, climate-smart, and abiotic stress tolerant wheat genotypes through intensive selection under actual field conditions.
Abiotic stresses, especially heat and drought stresses, are the major threats to sustainable wheat production. High-temperature stress or heat stress not only affect the grain yield but also had a severe impact on grain quality through the reduced accumulation of carbohydrates, gluten, and proteins [5]. Heat stress is considered more fatal than drought due to its extensive damages in almost all plant organs and developmental phases. Different phenophases have their genetics to tolerate heat-imposed effects depending upon the duration and intensity of heat. However, the early flowering or anthesis stage is thought to be the most sensitive developmental phase to heat stress, and pollen grains are considered as the most sensitive plant organ [6]. The complexity of interactions between different phenophases and their sensitivity to the surrounding environment ultimately decide the final grain yield [7]. The flowering period, which lasts for about 20 days before flowering and 10 days after anthesis, is reported to endure a temperature of a maximum of 31 °C without any decline in the number of grains [8]. Higher temperatures shorten the days required for anthesis, developing fewer grains per spike. Besides, high temperature also reduces pollen fertility and pollen tube development, slows pollen growth, and reduces ovary growth, leading to peer fertilization which ultimately reduces seed setting [9]. It is reported that high temperature (33–40 °C) for three consecutive days at anthesis and grain filling period could drastically reduce grain seize, numbers and weight, resulting in the development of a large number of deformed grains [10]. Even a single, hot day might cause serious, irreversible damage to several plant organs, resulting in a significant reduction in grain yield. Heat stress also reduces several plant development phases including flowering, anthesis, grain filling, and ripening [11]. The grain filling period is reported to shorten by 45–60% under high-temperature stress in wheat [12]. However, substantial genetic variability was observed among wheat genotypes for their ability to cop heat stress [13].
Asseng et al. (2014) [14] tested 30 wheat genotypes at 15 °C to 32 °C through wheat crop models and found that wheat yield could decrease up to 28% for an increase in 2 °C and 55% for 4 °C increase in temperature at 30 different locations in the world. It was also reported that grain yield could reduce by 6% for every 1 °C increase in temperature. Lobell et al. (2008) [15] reported a 3 to 17% reduction in wheat grain yield in India and Pakistan for a 1 °C increase in temperature due to global warming. High temperature could drastically impair different physiological processes including photosynthetic rate, transpiration activity, and rate of grain development in wheat. As photosynthesis is one of the major physiological process that affects grain yield in wheat [16], so net photosynthetic rate acts as an indicator of heat stress tolerance in wheat. Moreover, heat stress is also reported to decrease the number of grains per spike, grain size, grain weight, plant biomass, plant height, and shortening of the life cycle, which eventually resulted in reduced grain yield in wheat.
To develop or improve wheat genotypes for heat stress tolerance, the first step is to evaluate the cultivated germplasm’s genetic diversity for heat stress tolerance and to select genotypes with a higher level of heat tolerance. For this, estimation of combing ability effects provides valuable information for the selection of suitable parents to run an effective breeding program. Estimation of combining abilities (general and specific) provides a framework for the assessment of the genetic potential of grain yield and quality-related plant traits under optimal and heat stress conditions. Furthermore, it also defines the breeding value of parental lines to produce wheat hybrids [
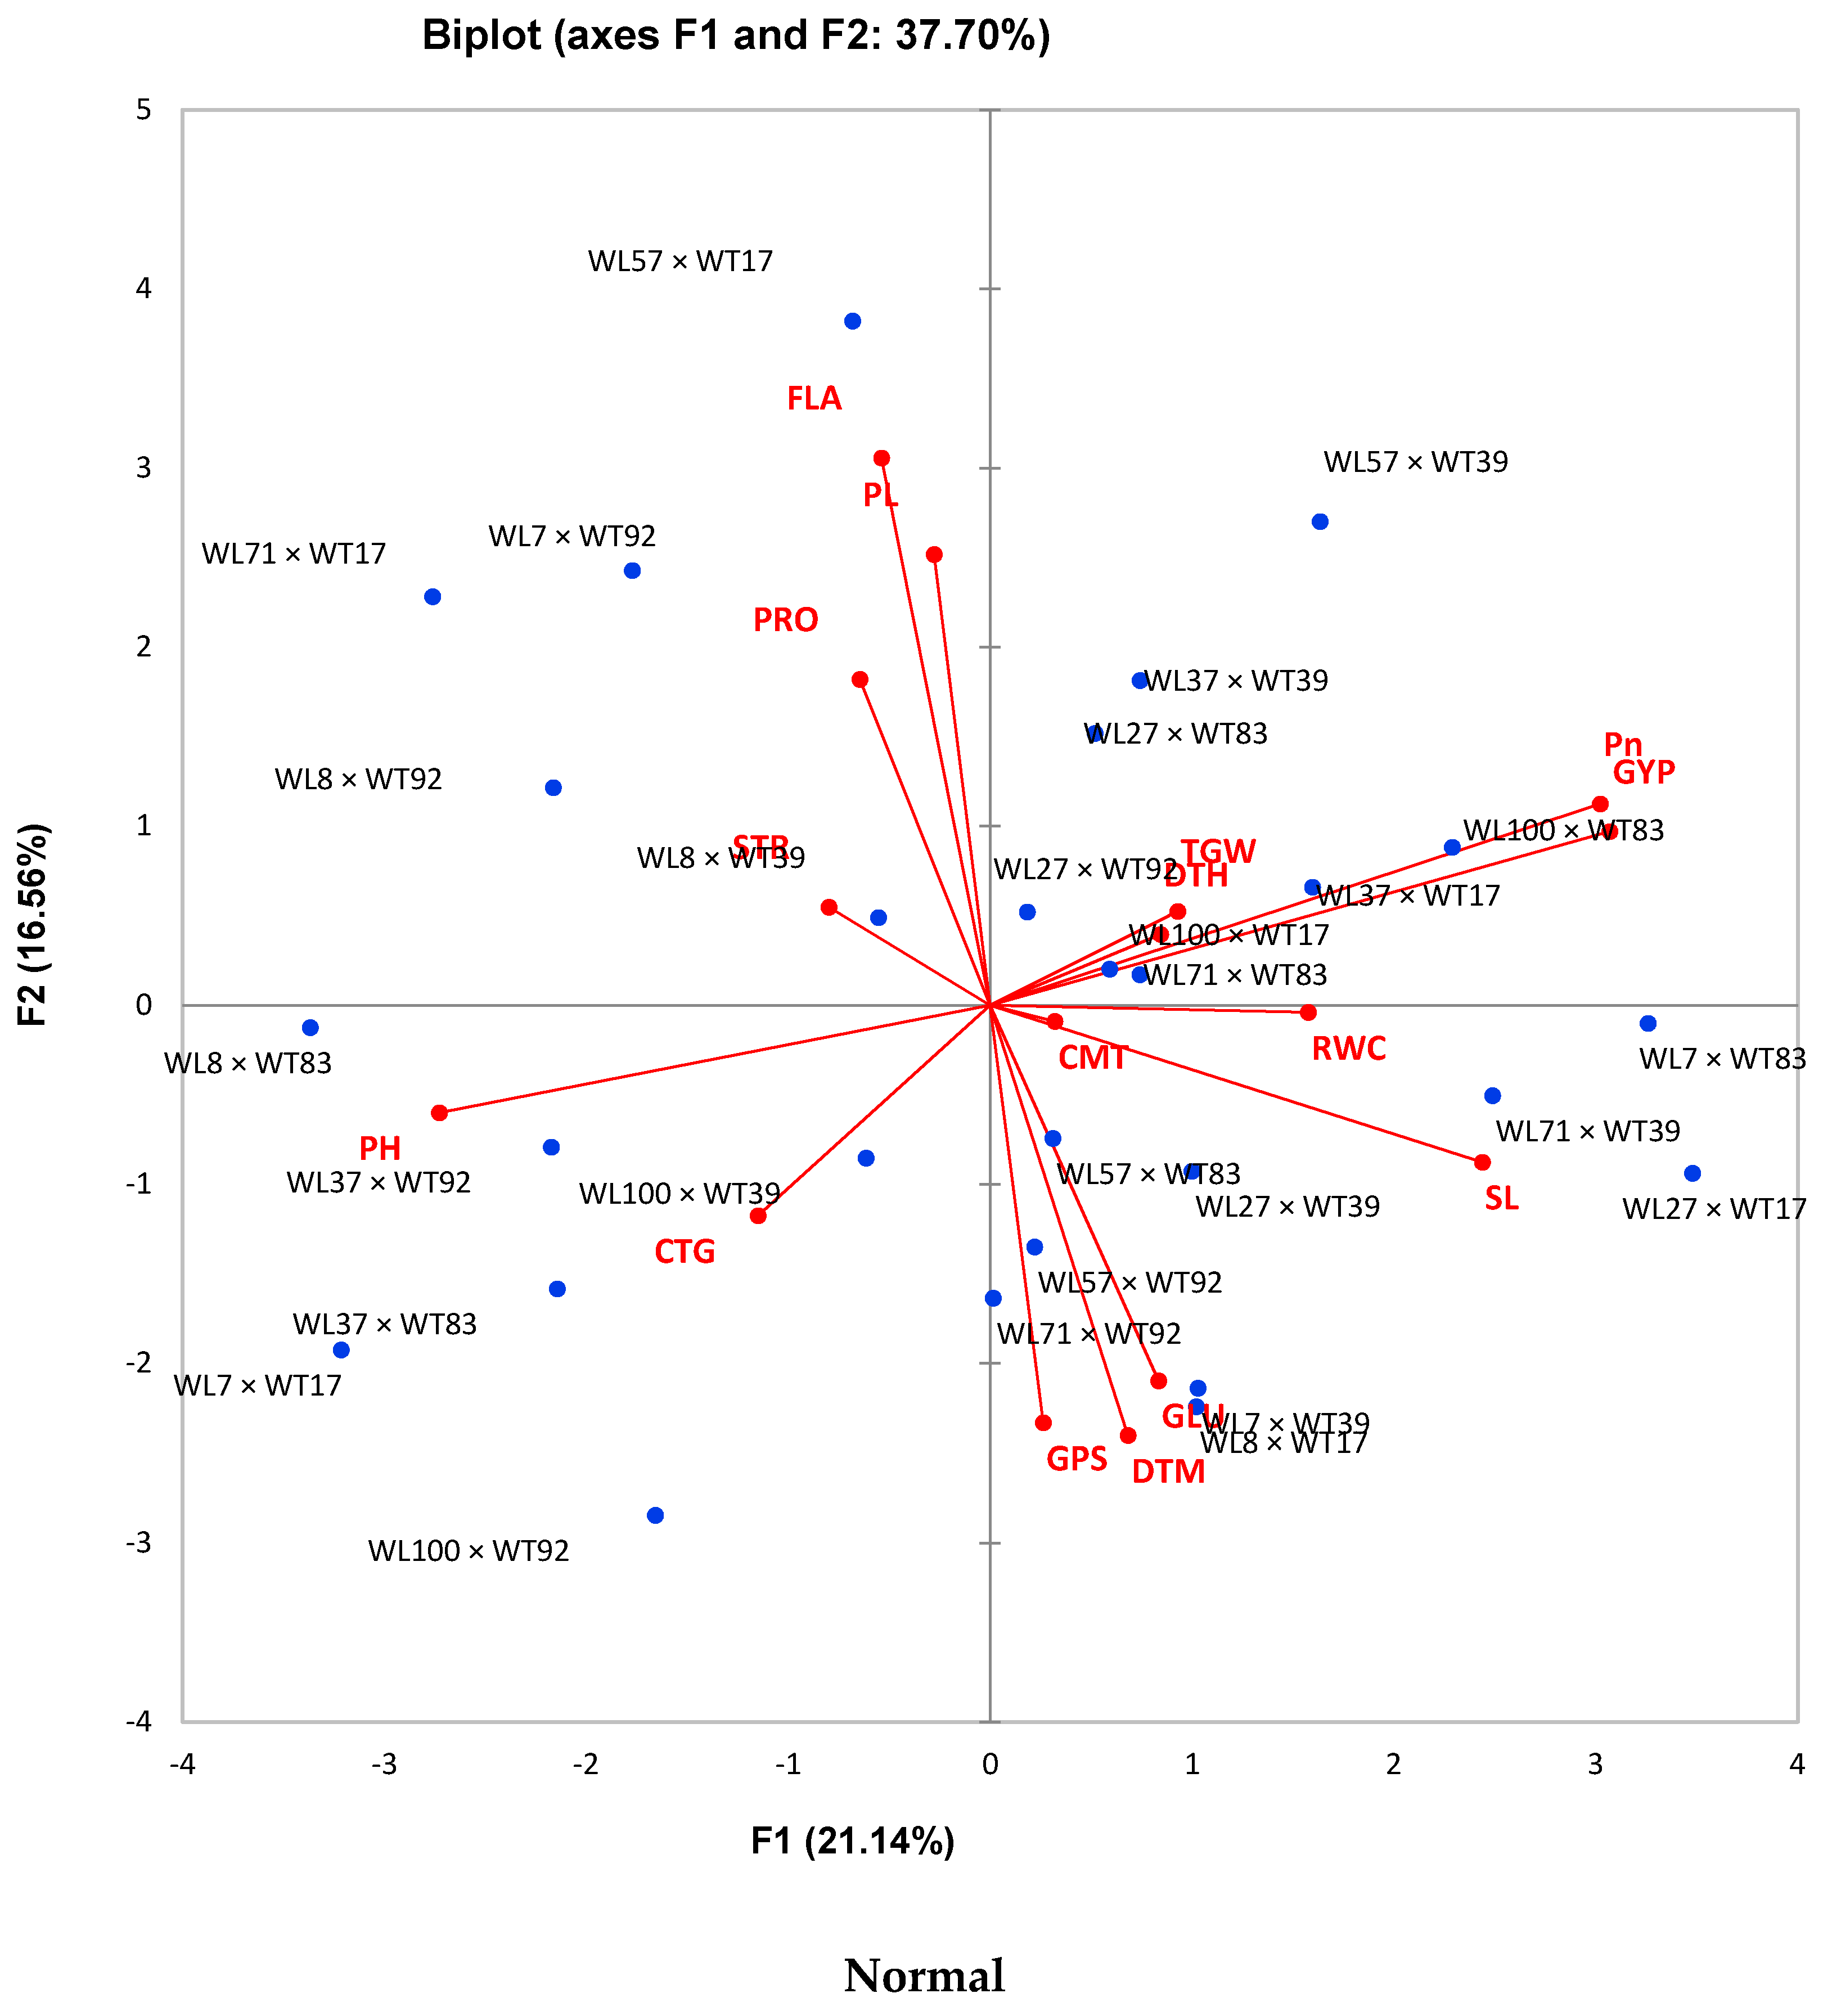
17]. Biplot analysis, profile plots, and correlation analysis were also used to categorize wheat crosses/hybrids and compute their relationship with different yield-associated traits based on their mean performance under normal and heat stress conditions. Therefore, keeping the above facts in mind, the current investigation was executed to predict the performance of wheat lines/varieties in their hybrid combinations for grain yield and quality-related parameters under optimal and heat stress conditions through a line into tester mating design.

2. Materials and Methods

2.1. Experimental Material, Design, and Site

The current study was carried out in the research area of Wheat Research Institute, Ayub Agricultural Research Institute, Faisalabad during the crop season 2016–2017. The Climate of Faisalabad region is subtropical, having an average precipitation of about 200 mm. Analysis showed that soil was sandy clay loam (sand 28%, silt 36% and clay 45%) with pH 7.6, 0.85% organic matter, 9.1 cmolc kg−1 cation exchange capacity (CEC), 1.79 dS m−1 electrical conductivity (EC), 0.062% totals nitrogen, 13.1 ppm phosphorus, and 179 ppm potassium.
During the first year, 100 wheat lines/genotypes were evaluated under normal (field) and tunnel conditions (heat stress) for their heat tolerance based on morpho-physiological traits. A comparison between the field and tunnel conditions was described in Table 1. After a comprehensive evaluation, seven best-performing, heat-tolerant lines were selected as female parents (lines) while four poor-performing, heat-susceptible lines were selected as male parents (testers). Furthermore, crossing between parents (lines and testers) was carried out according to line into tester mating design in 2017–2018. Selected lines and testers were sown under randomized complete block design in triplicates along with their crosses in the field conditions during the crop season 2018–2019 under two treatments: (i) optimal sowing (in the 2nd week of November) and (ii) late sowing (heat stress conditions) (late sowing in the 1st week of January) (Table 2). Late sowing was used as proxy to heat stress because historical data revealed that sowing at this stage will coincide the reproductive phase of crop with high temperature during April–May. The net plot size of the experimental unit was kept at 3 m2 (2 × 5 m × 0.30 m) for the measurement of grain yield and related traits. Standard agronomic and cultural practices were applied to the experiment as sowing was done with the help of dibbler at the rate of 2 seeds per hill. After the establishment of seedlings, thinning was done to 1 seedling per hill to ensure plant population. Fertilizers were applied as Nitrogen 80 kg ha−1, Phosphorus 58 kg ha−1, Potash 63 kg ha−1, Zinc (33%) 15 kg ha−1, and Boron (17%) 7.5 kg ha−1, respectively. All the fertilizers were applied at the time of sowing except nitrogen, which was applied in 4 splitting. Zinc and Boron were applied with first irrigation.

2.2. Data Acquisition

Data was collected for different morphological, phonological, physiological, and grain quality traits as given in Table 3.

2.3. Morpho-Phonological Traits

Days to heading (DTH) and days to maturity (DTM) were calculated by counting the days from sowing to 5% heading and physiological maturity, respectively. At maturity, data related to morphological traits, i.e., plant height (PH), peduncle length (PL), spike length (SL), number of grains per spike, thousand-grain weight, and grain yield per plant were recorded. Leaf area (LA) was measured from flag leaf with the help of a hand-held leaf area meter (CI-203; CID Bio-Science, Camas, WA, USA).

2.4. Physiological and Biochemical Traits of Plants

Canopy temperature at the grain filling stage (CTG) was measured with the help of an infrared thermometer (IRT). Relative water contents (RWC) of leaves were measured according to [18] in percentage according to the following formula:
R W C   ( % )   =   F r e s h   l e a f   w e i g h t     T u r g i d   l e a f   w e i g h t T u r g i d   l e a f   w e i g h t     D r y   l e a f   w e i g h t   ×   100
Net photosynthetic rate (Pn; µmole m−2 s−1) was measured with the help of an infrared gas analyzer (IRGA, CI-340 CID Bio-Science, Inc., USA) between 9:00 a.m. and 11:00 a.m.
Cell membrane thermostability (CMT) was measured in terms of relative cell injury percentage (RCI%) according to [19] through the following formula:
R C I   ( % )   =   [ 1 { 1     ( T 1 / T 2 ) } { 1     ( C 1 / C 2 ) }   ]   ×   100
where
T1/T2 = 1st and 2nd Electrical conductivity (EC) readings of a heat-treated set of test tubes containing leaf disks;
C1/C2 = 1st and 2nd Electrical conductivity (EC) readings of a controlled set of test tubes containing leaf disks.
Grain quality traits i.e., grain protein contents percentage (Protein%), grain starch contents percentage (Starch%), and gluten contents percentage (Gluten%) were estimated by using Infrared spectroscopy through NIR, Informatic 9200 (Parten Instruments, Sweden). Cleaned samples (750 g) were poured into the feeder and the estimated percentage value of these parameters was displayed digitally on its LED screen and got noted.

2.5. Statistical Analysis

The mean value of the recorded data was subjected to analysis of variance (ANOVA) [20]. Combining ability analysis was done by using Kempthorne model of line into tester analysis [21]. Biplots, correlation analysis and profile plots were also used to compute relationships among traits and with wheat crosses by using Microsoft Excel (v.2019). The Statistix 8.1 (Analytical Software, Tallahassee, FL 32312, USA) and XLSTAT (Addinsoft Inc., New York, NY, USA 19th ed.) software packages were used in the general statistical analyses.

3. Results

3.1. Analysis of Variance (ANOVA)

Analysis of variance unveiled the existence of highly significant differences among wheat genotypes for grain yield and quality-related traits under both optimal and heat stress conditions (Table 4). However, the protein and starch percentage of testers and CTG of lines showed no significant differences among wheat lines and testers under optimal sowing conditions, respectively. However, under heat stress conditions, only starch percentage showed non-significant differences among wheat lines and testers. In cross combinations (L × T), plant height, protein, and starch percentage also had non-statistical variations under heat stress conditions. The mean grain yield per plant of the wheat crosses under normal and heat stress conditions are shown in Figure 1.

3.2. General Combining Ability (GCA)

Genetic diversity and mean performance of parental lines along with their crosses are a vital source of genotypic evaluations; however, parents with the highest mean values could not necessarily transmit this trait to their offspring/hybrids. To assess the ability of parental lines to combine and give better performance, general combining ability (GCA) effects of parental lines and specific combining ability (SCA) effects of their crosses are estimated. In this experiment, the GCA effects of parental inbred lines showed that female lines WL27 and WL57 were the good general combiner for grain yield per plant under optimal (2.10 **, 0.58 *) and heat stress conditions (1.18 **, 2.06 **), respectively (Table 5). On the other hand, two testers, WT39 and WT17, were found to be the best general combiner under optimal (0.81 **, 0.48 *) and heat stress conditions (0.95 **, 0.59 *) for grain yield per plant, respectively. The best performing female lines, i.e., WL27 and WL57, were also found good general combiners for some other yield-associated traits like relative water contents (RWC), spike length (SL), thousand-grain weight (TGW), and net photosynthetic rate (Pn) (Table 5). Similarly, the best performing tester, WT17 was also a good general combiner for canopy temperature at grain filling period (CTG), days to heading (DTH), number of grains per spike (GPS), and net photosynthetic rate (Pn). Concerning grain quality, WL8 and WT92 were found to be the best general combiners under both conditions.

3.3. Specific Combining Ability (SCA)

Specific combining ability is the measure of performance of parental lines in a specific cross combination. The specific combining ability effects of 28 cross combinations for grain yield and quality-related traits under optimal and heat stress conditions are presented in Table 6. Not all cross combinations showed significantly positive SCA effects for traits under study under both optimal and heat stress conditions. Among 28 crosses, only 10 crosses (WL8 × WT17, WL27 × WT17, WL37 × WT17, WL8 × WT39, WL37 × WT39, WL71 × WT39, WL7 × WT83, WL27 × WT83, WL100 × WT83, and WL57 × WT92) showed desirably significant SCA effects for grain yield per plant (GYP) under optimal conditions. However, under heat stress conditions at the reproductive stage, only four of these crosses (WL8 × WT17, WL37 × WT17, WL8 × WT39, and WL37 × WT39) demonstrated significantly positive SCA effects for GYP. Besides these four crosses, three other crosses (WL71 × WT83, WL7 × WT92, and WL71 × WT92) also showed desirably significant performance in terms of SCA effects for GYP under heat stress. However, the SCA effects of these three crosses were not significantly positive under optimal conditions.
The highest SCA effects for GYP under heat stress conditions were observed in cross WL37 × WT39 (2.85 **) followed by WL71 × WT83 (2.27**) and WL7 × WT92 (2.14 **), respectively. In the case of physiological traits, WL100 × WT17 and WL57 × WT39 were the best specific combiners under both conditions. Similarly, WL71 × WT17 and WL7 × WT92 were found best combiners for protein%, WL7 × WT17 and WL100 × WT83 for starch, and WL27 × WT39 and WL71 × WT39 for gluten, respectively. The lowest gluten was observed in WT71 × WL83 (−3.17 ** and −3.11 **) under optimal and heat stress conditions, respectively. Higher dominance variance than additive variance showed the presence of non-additive gene action for all the studied traits under both optimal and heat stress conditions except PH and TGM, for which additive variance was higher than dominance variance under heat stress conditions.

3.4. Correlation, Profile Plot, and Biplot Analysis

Information on associations between grain yield and other related traits under optimal and heat stress conditions will help in the identification of desirable secondary traits to improve grain yield under both conditions. The estimates of the phenotypic correlations between grain yield and associated traits under optimal and heat stress conditions are presented in Figure 2. Grain yield was found to have a significantly positive.
Correlation with Pn (r = 0.977 **), SL (r = 0.475 *), TGW (r = 0.478 *) and RWC (r = 0.485 *) under optimal conditions. However, under heat stress conditions, only Pn (r = 0.951 **) and TGW (r = 0.455 *) were found to have a significant positive correlation with GY. A negative correlation was found between GY and PH under both optimal (r = 0.707 **) and Heat stress conditions (r = 0.472 *). Starch percentage showed a positive correlation with GY under optimal conditions while negative correlation under heat stress conditions.
Similar results were depicted by biplots as shown in Figure 3. The trait biplot for optimal treatment showed a strong correlation between GY and Pn under both conditions as there was a very low angle between their corresponding lines. Although a lower angle was also found between GY and TGW under both conditions, the variations were lower for TGW due to smaller corresponding lines. Plant height, on the other hand, had a strong negative association with GY as the angle between their corresponding lines was greater than 180°. Considering the performance of wheat crosses, biplot analysis showed that four wheat crosses, i.e., WL27 × WT17, WL71 × WT39, WL7 × WT83, and WL100 × WT83 were the most productive crosses under optimal conditions. However, under heat stress conditions, WL27 × WT17, WL57 × WT39, WL57 × WT17, and WL37 × WT39 outyielded other wheat crosses. Cluster analysis was used to classify wheat crosses based on their performance under normal and heat stress conditions. Cluster analysis categorizes wheat crosses into three classes under both conditions (Table 7 and Figure 4). In optimal condition, Class-2 consisted of seventeen wheat crosses, was the biggest and most productive group having an average yield of 20.55 g per plant (Table 7 and Table 8). Similarly, under heat stress conditions, Class-2 was again the most productive and heat tolerant group of wheat crosses having a yield of as much as 13.79 g per plant. Profile plot was used to illustrate the dominance of different classes for each studied trait (Figure 5). Profile plot showed that GY under normal conditions was highest in Class-2, having significant differences with other 2 classes while in heat stress conditions, although class-2 had the highest GY but its difference with Class-3 wheat crosses was negligible.

4. Discussion

Usually, for a self-pollinated crop like wheat, a study of segregating population for specific combining ability (SCA) serves as a vital factor for their grain yield improvement [22]. Analysis of variance (ANOVA) showed the presence of significant differences among parents and their crosses in wheat under optimal and heat stress conditions for all studied traits except starch, which showed no significant differences among parents and their crosses under heat stress conditions. The presence of sufficient genetic variability among male and female parents and their cross combinations allows further assessment of these parental lines for combining ability analysis. Many researchers showed that the presence of significant diversity among cultivated germplasm from the warmer regions could be used for the development of heat resilient, climate-smart verities for heat prone areas [23,24,25,26].
In the current study, the combining ability analysis revealed that both GCA and SCA effects played an imperative role in the control of grain yield and its associated traits under optimal and heat stress conditions of studied genotypes, with the specific combining ability effects being greater than the general combining ability effects. The GCA estimates unveiled that none of the parental lines was consistently superior for all the grain yield and its associated traits. However, the GCA effects of three parental lines, i.e., WL27, WL57, and WT39, were higher than the remaining parents concerning grain yield under both optimal and heat stress conditions. These lines also showed superiority over other lines for yield-related morpho-phonological and physiological traits like plant height, relative water contents, peduncle length, days to heading, days to maturity, thousand-grain weight, and net photosynthetic rate. These observations indicated that these parents could be used in generating a segregating population or pool having a higher mean grain yield as suggested by [27]. However, GCA alone is not an efficient approach in self-pollinated crops like wheat because the similarity in parents will provide a restricted diversity for grain yield. Therefore, in such conditions, SCA estimates, which represent the degree of allelic complementation, will provide an opportunity for the selection of superior crosses as there will be some crosses with higher genetic variability than others.
Although SCA effects do not contribute substantially towards yield improvements in self-pollinated crops, productive crosses are expected to generate transgressive segregants to be used as potent homozygous lines [28]. The significant SCA effects of any cross depict the presence of intra or inter allelic interaction and can be easily exploited in cross-pollinated crops and in those self-pollinating crops where hybrid seed production at a commercial level is possible. However, higher SCA effects may also be due to the accumulation of dominant alleles from either parent because of their higher general combining ability; in such conditions, SCA could easily be exploited in self-pollinated crops like wheat by selecting transgressive segregates from a segregating population. In the current investigation, grain quality-related traits like protein content percentage, starch content percentage, and gluten content percentage had a higher magnitude of SCA effects displaying the predominant role of non-additive gene action under both conditions. Moreover, four crosses, i.e., WL8 × WT17, WL37 × WT17, WL8 × WT39, and WL37 × WT39, which displayed significantly positive SCA effects under both optimal and heat stress conditions for grain yield per plant, were derived from the parents with the same types of general combining ability effects (high x high) under these conditions. The prevalence of such crosses indicates the presence of non-additive genetic control of grain yield in wheat under optimal and heat stress conditions as suggested [29]. The presence of higher dominance variance than additive also confirms non-additive gene action for this trait under both optimal and stress conditions. Furthermore, cell membrane thermostability, relative water contents of leaves, spike length, number of grains per spike, thousand-grain weight, and net photosynthetic rate appeared to be the most prominent plant traits when selecting for grain yield in wheat under heat stress conditions. Similar results were also reported by many researchers who found the presence of non-additive gene action for grain yield in wheat under normal and stress conditions [25,30,31,32,33,34,35,36]. Sareen et al. (2018) [36] investigated six generations of five crosses of wheat under optimal and heat stress conditions to explicate the inheritance pattern of yield and its contributing traits under heat stress using different cross combinations. They reported the presence of additive as well as non-additive genetic control of grain yield and some of its associated traits in wheat under heat stress conditions. Similarly, Ataei et al. (2017) [37] also reported that both additive and dominance gene effects were associated with grain yield and its associated traits in wheat under abiotic stress conditions.
Selection of desirable traits from existing germplasm may lead to simultaneous improvement of associated characters. As grain yield is a complex, polygenic trait that is greatly influenced by the surrounding environment, the direct selection of genotypes based on grain yield is not an appropriate option. Section based on associated traits could prove more fruitful for the development of superior genotypes [23]. In current studies, newly developed wheat crosses were evaluated under optimal and heat stress conditions, and significantly positive associations were found between GY and associated traits. Grain yield was found to have a very strong positive correlation with a net photosynthetic rate under both optimal and heat stress conditions, indicating that positive selection for Pn could indirectly help us in choosing the best performing genotype under stress and non-stressed conditions [6,7]. Furthermore, the presence of a significantly negative correlation between GY and PH under both conditions depicts that reduction in plant height could increase grain yield in wheat [38]. Under heat stress, by reducing the biomass, increasing assimilate portioning to the spike increased harvest index and lodging resistance [39]. A moderately significant but positive correlation of GY was also found with GPS and TGW under heat stress conditions. Similar findings were also reported by Yousaf et al. (2017) [40], who found a significantly positive correlation of GY with GPS and TGW. The correlation analysis showed that early maturing wheat genotypes may prove suitable for heat affected areas as they employ escape mechanisms to avoid the prolonged terminal heat stress that normally occurs particularly in the tropics and subtropics [41]. Similar findings were obtained from biplot analysis, which showed a strong association of GY with Pn, TGW, and RWC under both normal and heat stress conditions. Furthermore, the biplot also revealed that WL27 × WT17 and WL8 × WL39 were the most heat tolerant and productive hybrids under stress conditions.
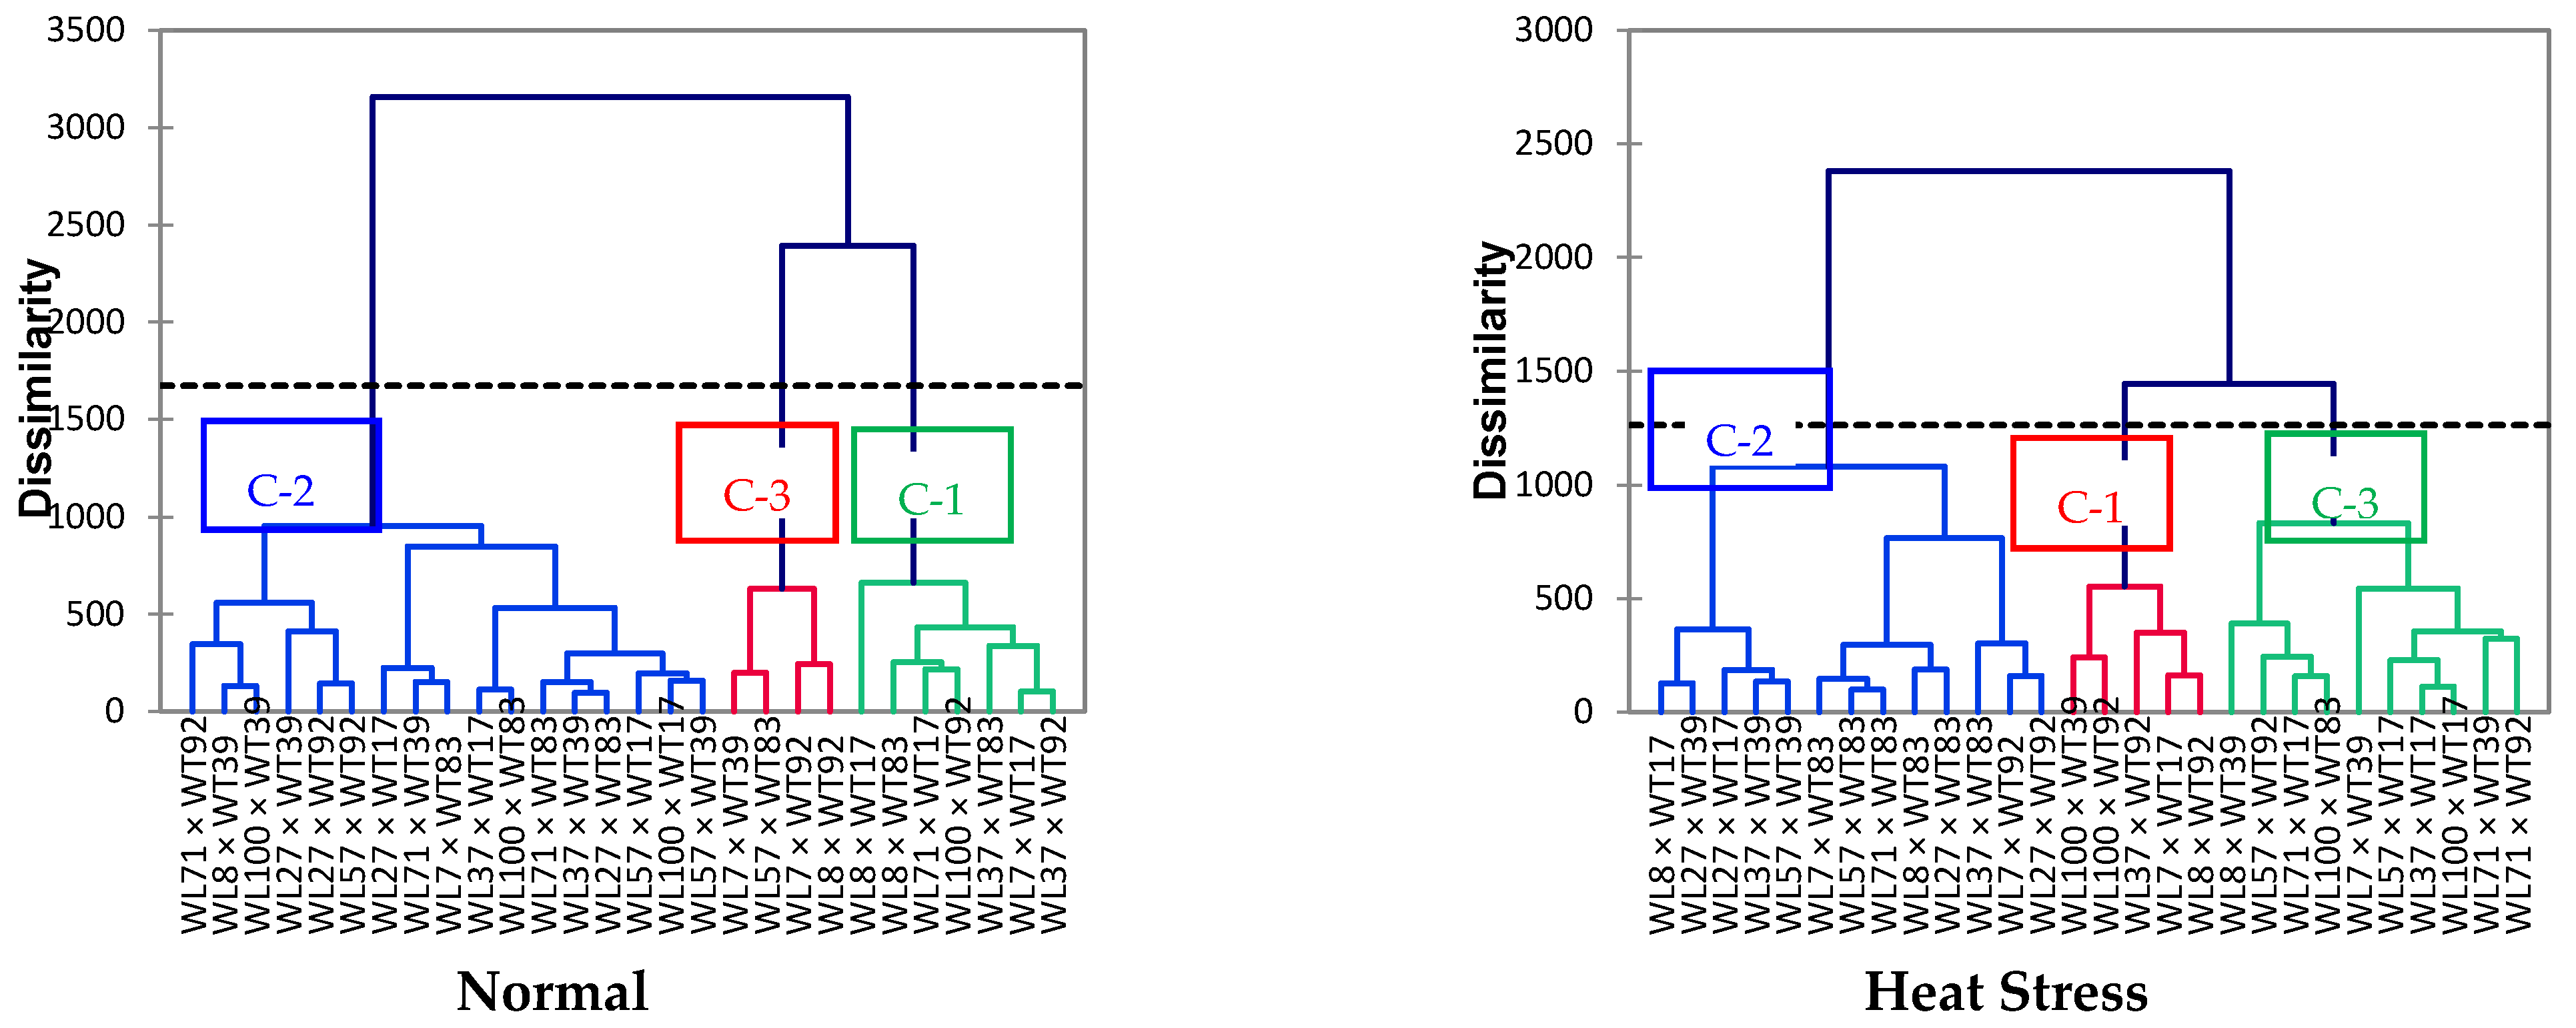
Cluster analysis was used to categorize wheat crosses based on their performance under optimal and heat stress conditions. In this study, cluster analysis classified wheat crosses into three groups under both conditions. Under heat stress conditions, highly productive and heat tolerant wheat crosses were placed in cluster-2 while heat susceptible and least productive wheat crosses were placed in cluster-1. Therefore, these two clusters could be used in hybridization programs to broaden the genetic basis of germplasm, and top entries from cluster-2 could be directly resealed for general cultivation if their performance in multilocation trials remains as good as in this experiment. Several researchers used cluster and biplot analysis to characterize genotypes under the different environmental conditions and found these tools quite useful [42,43].

5. Conclusions

The current study confirmed the importance of non-additive gene effects in governing grain yield and associated morpho-physiological and quality traits in spring wheat under optimal and heat stress conditions. Among parental lines, WL 27, WT 39, and WL 57 were found to be the best general combiners for grain yield and its related traits under both conditions and thus could be used in wheat hybridization programs for the development of heat resilient wheat genotypes. Among crosses, WL8 × WT17, WL37 × WT17, WL7 × WT39, and WL37 × WT39 were the most promising wheat crosses and could be released for cultivation in heat prone areas after satisfactory results from multilocation trails. Several plant traits including relative water contents, spike length, thousand-grain weight, and net photosynthetic rate were identified as the best selection criteria in wheat breeding for developing heat resilient, climate-smart genotypes due to their positive correlation with grain yield per plant. Cluster and biplot analysis revealed that wheat crosses included in cluster-2 under heat stress conditions are the most productive and heat tolerant crosses and could be used for cultivation in heat prone areas after multilocation trails.

Author Contributions

M.W.R. conceived and designed the experiments; L.Y., M.I.Y., X.D.M., A.S., L.X., S.R., and L.S. contributed reagents/materials/analysis tools; H.S. and C.M. guided the whole manuscript. M.W.R. wrote the article. The authors read and approved the final manuscript. All authors have read and agreed to the published version of the manuscript.

Funding

This work was supported by grants from the National Key Research and Development Program of China (2017YFD0100804 and 2016YFD0101802), The Agriculture Research System (CARS-03), The University Synergy Innovation Program of Anhui Province (GXXT-2019-033), and Jiangsu Collaborative Innovation Center for Modern Crop Production (JCIC-MCP).

Institutional Review Board Statement

Not applicable.

Informed Consent Statement

Not applicable.

Data Availability Statement

Not applicable.

Conflicts of Interest

The authors declare no conflict of interest.

References

  1. Hatfield, J.L.; Prueger, J.H. Temperature extremes: Effect on plant growth and development. Weather Clim. Extrem. 2015, 10, 4–10. [Google Scholar] [CrossRef] [Green Version]
  2. Braun, H.J.; Atlin, G.; Payne, T.; Reynolds, M.P. Climate Change and Crop Production; CABI: Wallingford, UK, 2010; pp. 115–138. [Google Scholar]
  3. FAO Food and Agriculture Organization of United Nations 2020. Available online: http://www.fao.org/faostat/en/#data/QC (accessed on 10 January 2021).
  4. Sharma, I.; Tyagi, B.S.; Singh, G.; Venkatesh, K.; Gupta, O.P. Enhancing wheat production—A global perspective. Indian J. Agric. Sci. 2015, 85, 3–13. [Google Scholar]
  5. Poudel, P.B.; Poudel, M.R. Heat stress effects and Tolerance in wheat: A review. J. Biol. Today’s World 2020, 379, 217. [Google Scholar] [CrossRef]
  6. Djanaguiraman, M.; Narayanan, S.; Erdayani, E.; Prasad, P.V.V. Effects of high temperature stress during anthesis and grain filling periods on photosynthesis, lipids and grain yield in wheat. BMC Plant Biol. 2020, 20, 268. [Google Scholar] [CrossRef] [PubMed]
  7. Akter, N.; Rafiqul Islam, M. Heat stress effects and management in wheat. A review. Agron. Sustain. Dev. 2017, 37, 1–7. [Google Scholar] [CrossRef]
  8. Talukder, A.S.M.H.M.; McDonald, G.K.; Gill, G.S. Effect of short-term heat stress prior to flowering and early grain set on the grain yield of wheat. Field Crop. Res. 2014, 160, 54–63. [Google Scholar] [CrossRef]
  9. Kaushal, N.; Bhandari, K.; Siddique, K.H.M.; Nayyar, H. Food crops face rising temperatures: An overview of responses, adaptive mechanisms, and approaches to improve heat tolerance. Cogent Food Agric. 2016, 2. [Google Scholar] [CrossRef]
  10. Balla, K.; Karsai, I.; Bónis, P.; Kiss, T.; Berki, Z.; Horváth, Á.; Mayer, M.; Bencze, S.; Veisz, O. Heat stress responses in a large set of winter wheat cultivars (Triticum aestivum L.) depend on the timing and duration of stress. PLoS ONE 2019, 14, e0222639. [Google Scholar] [CrossRef]
  11. Rahman, M.A.; Chikushi, J.; Yoshida, S.; Karim, A.J.M.S. Growth and Yield components of Wheat genotypes exposed to High temperature stress under control environmrnt. Bangladesh J. Agric. Res. 2009, 34, 361–372. [Google Scholar]
  12. Vignjevic, M.; Wang, X.; Olesen, J.E.; Wollenweber, B. Traits in Spring Wheat Cultivars Associated with Yield Loss Caused by a Heat Stress Episode after Anthesis. J. Agron. Crop Sci. 2014. [Google Scholar] [CrossRef]
  13. Shah, N.H.; Paulsen, G.M. Interaction of drought and high temperature on photosynthesis and grain-filling of wheat. Plant Soil 2003, 257, 219–226. [Google Scholar] [CrossRef]
  14. Asseng, S.; Ewert, F.; Martre, P.; Rötter, R.P.; Lobell, D.B.; Cammarano, D.; Kimball, B.A.; Ottman, M.J.; Wall, G.W.; White, J.W.; et al. Rising temperatures reduce global wheat production. Nat. Clim. Chang. 2015, 5, 143–147. [Google Scholar] [CrossRef]
  15. Lobell, D.B.; Burke, M.B.; Tebaldi, C.; Mastrandrea, M.D.; Falcon, W.P.; Naylor, R.L. Prioritizing climate change adaptation needs for food security in 2030. Science 2008, 319, 607–610. [Google Scholar] [CrossRef] [PubMed]
  16. Ristic, Z.; Bukovnik, U.; Prasad, P.V.V. Correlation between Heat Stability of Thylakoid Membranes and Loss of Chlorophyll in Winter Wheat under Heat Stress. Crop Sci. 2007, 47, 12. [Google Scholar] [CrossRef]
  17. Romanus, K.G.; Hussein, S.; Mashela, W.P. Combining ability analysis and association of yield and yield components among selected cowpea lines. Euphytica 2008, 162, 205–210. [Google Scholar] [CrossRef]
  18. Arndt, S.; Irawan, A.; Sanders, G.J. Apoplastic water fraction and rehydration techniques introduce significant errors in measurements of relative water content and osmotic potential in plant leaves. Physiol. Plant 2015. [Google Scholar] [CrossRef]
  19. Naveed, M.; Ahsan, M.; Akram, H.M.; Aslam, M.; Ahmed, N. Measurement of cell membrane thermo-stability and leaf temperature for heat tolerance in maize (Zea mays L.): Genotypic variability and inheritance pattern. Maydica 2016, 61, 7. [Google Scholar]
  20. Steel, R.G.D.; Torrie, J.H.; Dicky, D.A. Principles and Procedures of Statistics: A Biometrical Approach, 3rd ed.; McGraw Hill, Inc.: New York, NY, USA, 1997; pp. 352–358. [Google Scholar]
  21. Kempthorne, O. An Introduction to Genetic Statistics; John Wiley Sons, Inc.: New York, NY, USA, 1957. [Google Scholar]
  22. Shaukat, S.; Khan, A.S.; Hussain, M.; Kashif, M.; Ahmed, N. Selection of Superior parents and cross combination for quality traits in Bread Wheat (Triticum aestivum L.) under Normal and Heat stressed conditions. Pak. J. Agric. Sci 2018, 55, 801–807. [Google Scholar] [CrossRef]
  23. Yousaf, M.I.; Hussain, K.; Hussain, S.; Ghani, A.; Arshad, M.; Mumtaz, A.; Hameed, R.A. Characterization of indigenous and exotic maize hybrids for grain yield and quality traits under heat stress. Int. J. Agric. Biol. 2018, 20, 333–337. [Google Scholar] [CrossRef]
  24. Hossain, K.M.W.; Raffi, S.A. Evaluation of exotic wheat (Triticum aestivum L.) genotypes for heat tolerance on the basis of physiological phenotyping. J. Bangladesh Agric. Univ. 2018, 16, 457–463. [Google Scholar] [CrossRef]
  25. Qaseem, M.F.; Qureshi, R.; Shaheen, H. Effects of Pre-Anthesis Drought, Heat and Their Combination on the Growth, Yield and Physiology of diverse Wheat (Triticum aestivum L.) Genotypes Varying in Sensitivity to Heat and drought stress. Sci. Rep. 2019, 9, 6955. [Google Scholar] [CrossRef] [PubMed] [Green Version]
  26. Ghani, A.; Yousaf, M.I.; Arshad, M.; Hussain, K.; Hussain, D.; Hussain, A.; Shehzad, A. YH-5427: A Highly Productive, Heat tolerant, Stalk Rot and Lodging resistace, Yellow Maize Hybrid of Punjab, Pakistan. Int. J. Biol. Biotechnol. 2020, 17, 561–570. [Google Scholar]
  27. Fasahat, P. Principles and Utilization of Combining Ability in Plant Breeding. Biom. Biostat. Int. J. 2016, 4. [Google Scholar] [CrossRef]
  28. Fellahi, Z.E.A.; Hannachi, A.; Bouzerzour, H.; Boutekrabt, A. Line × Tester Mating Design Analysis for Grain Yield and Yield Related Traits in Bread Wheat (Triticum aestivum L.). Int. J. Agron. 2013, 2013, 9. [Google Scholar] [CrossRef] [Green Version]
  29. Al-Ashkar, I.; Alotaibi, M.; Refay, Y.; Ghazy, A.; Zakri, A.; Al-Doss, A. Selection criteria for high-yielding and early-flowering bread wheat hybrids under heat stress. PLoS ONE 2020, 15, e0236351. [Google Scholar] [CrossRef]
  30. Bnejdi, F.; Gazzah, M.E. Epistasis and genotype-by-environment interaction of grain protein content in durum wheat. Genet. Mol. Biol. 2010, 130, 125–130. [Google Scholar] [CrossRef] [Green Version]
  31. Farooq, J.; Khaliq, I.; Ali, M.A.; Kashif, M.; Rehman, A.; Naveed, M.; Ali, Q.; Nazeer, W.; Farooq, A. Inheritance pattern of yield attributes in spring wheat at grain filling stage under different temperature regimes. Aust. J. Crop Sci. 2011, 5, 1745–1753. [Google Scholar]
  32. Abbasi, S.; Baghizadeh, A.; Mohammadi-nejad, G. Genetic analysis of traits related to grain yield in wheat under drought stress condition by generation mean analysis. Iran. J. Genet. Plant Breed. 2013, 2, 42–46. [Google Scholar]
  33. Singh, M.K.; Sharma, P.K.; Tyagi, B.S.; Singh, G. Combining ability analysis for yield and protein content in bread wheat (Triticum aestivum). Indian J. Agric. Sci. 2014, 84, 328–336. [Google Scholar]
  34. Okechukwu, E.C.; Agbo, C.U.; Uguru, M.I.; Ogbonnaya, F.C. Germplasm evaluation of heat tolerance in bread wheat in Tel Hadya, Syria. Chil. J. Agric. Res. 2016, 76, 9–17. [Google Scholar] [CrossRef] [Green Version]
  35. Sharma, V.I.; Dodiya, N.S.; Dubey, R.B.; Khan, R.U. Combining ability analysis in bread wheat (Triticum aestivum (L.) Em. Thell) under Different Environmental Conditions. Bangladesh J. Bot. 2019, 48, 85–93. [Google Scholar] [CrossRef]
  36. Sareen, S.; Bhusal, N.; Singh, G.; Tyagi, B.S.; Tiwari, V.; Singh, G.P.; Sarial, A.K. Genetics of Grain Yield and its Components in Wheat under Heat Stress. Cereal Res. Commun. 2018, 46, 448–459. [Google Scholar] [CrossRef]
  37. Ataei, R.; Gholamhoseini, M.; Kamalizadeh, M. Genetic analysis for quantitative traits in bread wheat exposed to irrigated and drought stress conditions. Int. J. Exp. Bot. 2017, 86, 228–235. [Google Scholar]
  38. Grover, G.; Sharma, A.; Gill, H.S.; Srivastava, P.; Bains, N.S. Rht8 gene as an alternate dwarfing gene in elite Indian spring wheat cultivars. PLoS ONE 2018, 13, e0199330. [Google Scholar] [CrossRef]
  39. Divashuk, M.G.; Bespalova, L.A.; Vasilyev, A.V.; Fesenko, I.A.; Puzyrnaya, O.Y.; Karlov, G.I. Reduced height genes and their importance in winter wheat cultivars grown in southern Russia. Euphytica 2013, 190, 137–144. [Google Scholar] [CrossRef]
  40. Yousaf, M.I.; Maize, A.M.; Maize, W.A. Contribution of Spike-Related Traits for Grain Yield in Spring Wheat. J. Agric. Basic Sci. 2017, 2, 2710–2714. [Google Scholar]
  41. Menshawy, A.M. Evaluation of some early bread wheat genotypes under different sowing dates. 1. Earliness characters. Egypt. J. Plant Breed. 2007, 11, 25–40. [Google Scholar]
  42. Khalid, M.U.; Akhtar, N.; Arshad, M.; Yousaf, M.I. Characterization of Maize inbred lines for Grain Yield and related traits under Heat Stress conditions. Int. J. Biol. Biotechnol. 2020, 17, 367–375. [Google Scholar]
  43. Mumtaz, A.; Hussain, D.; Saeed, M.; Arshad, M.; Yousaf, M.I. Stability and adaptability of sorghum hybrids elucidated with genotype-environment interaction biplots. Turkish J. Field Crop. 2019, 24, 155–163. [Google Scholar] [CrossRef] [Green Version]
Figure 1. Mean grain yield per plant in wheat crosses under normal and heat stress conditions.
Sustainability 13 02972 g001
Figure 2. Correlation matrix of grain yield and related traits of wheat crosses under optimal and heat stress conditions.
Sustainability 13 02972 g002
Figure 3. Biplots of grain yield and related traits of wheat crosses under optimal and heat stress conditions.
Sustainability 13 02972 g003aSustainability 13 02972 g003b
Figure 4. Dendrogram of different classes of wheat crosses under optimal and heat stress conditions.
Sustainability 13 02972 g004
Figure 5. Profile plots of grain yield and related traits under optimal and heat stress conditions.
Sustainability 13 02972 g005
Table 1. Field and tunnel conditions comparison.
Normal/Field ConditionsTunnel Conditions
MonthTemperature (Min./Max.)Relative HumidityPrecipitation
(mm)
Temperature
(Min./Max.)
Relative Humidity
November10/28 °C6213
December9/21 °C63513/26 °C75
January6/20 °C43249/23 °C54
February9/20 °C302912/24 °C41
March14/28 °C39517/32 °C50
April21/36 °C403125/40 °C48
May 3227/44 °C43
Table 2. Names of wheat lines, testers, and their crosses used in the study.
Sr. #ParentageLine/TesterSr. #ParentageLine/Tester
1WL7L11WT17T1
2WL8L22WT39T2
3WL27L33WT83T3
4WL37L44WT92T4
5WL57L5
6WL71L6
7WL100L7
Sr. #Cross NameParentageSr. #Cross NameParentage
1WL7 × WT17L1 × T115WL7 × WT83L1 × T3
2WL8 × WT17L2 × T116WL8 × WT83L2 × T3
3WL27 × WT17L3 × T117WL27 × WT83L3 × T3
4WL37 × WT17L4 × T118WL37 × WT83L4 × T3
5WL57 × WT17L5 × T119WL57 × WT83L5 × T3
6WL71 × WT17L6 × T120WL71 × WT83L6 × T3
7WL100 × WT17L7 × T121WL100 × WT83L7 × T3
8WL7 × WT39L1 × T222WL7 × WT92L1 × T4
9WL8 × WT39L2 × T223WL8 × WT92L2 × T4
10WL27 × WT39L3 × T224WL27 × WT92L3 × T4
11WL37 × WT39L4 × T225WL37 × WT92L4 × T4
12WL57 × WT39L5 × T226WL57 × WT92L5 × T4
13WL71 × WT39L6 × T227WL71 × WT92L6 × T4
14WL100 × WT39L7 × T228WL100 × WT92L7 × T4
Table 3. Morpho-phonological, physiological, and grain quality related plant traits under study.
Sr.#Trait NameSr. #Trait Name
1Cell membrane thermostability (CMT)9Days to maturity (DTM)
2Canopy temperature at grain filling stage (CTG)10Grains per spike (GPS)
3Relative water Content (RWC)111000-grain weight (TGW, g)
4Plant height (PH, cm)12Protein (%)
5Flag leaf area (FLA, cm2)13Starch (%)
6Peduncle length (PL, cm)14Gluten (%)
7Spike length (SL, cm)15Net photosynthetic rate (Pn)
8Days to heading (DTH)16Grain yield per plant (GY, g)
Table 4. Analysis of variance (ANOVA) for grain yield and related traits under optimal and heat stress conditions.
Mean Squares under Optimal Sowing Conditions
Source of VariationdfCMTCTGRWCPHFLAPLSLDTHDTMGPSTGWPnProtein%Starch%Gluten%GYP
Replications (R)221.9 **19.5 **11.8 **29.7 **1.4 NS2.8 NS25.9 **0.3 NS7.8 **15.9**15.9**0.12**4.8**0.29 NS2.1 NS0.31 NS
Testers (T)3152 **5.9 **74.3 **245 **5.2 **28.4 **2.6 **33.8 **49.2 **74.6 **111 **208 **1.6 NS1.75 NS10.5 **48.1 **
Lines (L)6140 **1.6 NS9.1 **224 **14.6 **20.7 **6.1 **12.2 **53.4 **33.7 **19.6 **61.1 **4.5 **2.72 *8.2 **26.0 **
L × T18211 **2.4 **46.8 **76.2 **26.2 **18.5 **9.8 **36.1 **69.9 **55.1 **28.3 **134 **5.4 **2.84 **18.9 **34.2 **
Error570.3510.730.7270.050.951.110.0740.510.880.360.280.0031.0161.131.10.99
Mean Squares under Heat Stress Conditions
Replications220.1 **17.5 **20.9 **13.4 NS22.9 **21.6 **22.4 **19.3 **0.3 NS0.5 NS1.5 NS11.6 NS0.2 NS2.8 NS13.1 **0.8 NS
Testers (T)392.3 **9.6 **24.3 **617 **5.7 **23.1 **6.6 **59.1 **125 **20.8 **417 **117 **2.2 NS4.8 **16.1 **17.4 **
Lines (L)640.1 **4.3 **23.6 **72.0 **4.8 **8.2 **3.5 **42.9 **21.5 **15.1 **188 **66.8 **6.2 **1.2 NS7.6 **17.8 **
L × T18109 **5.3 **25.7 **84.5 **13.8 **16.7 **9.4 **40.5 **66.5 **40.9 **73.6 **50.9 **5.8 **1.4 NS23.9 **10.7 **
Error570.290.400.3716.60.160.270.270.331.001.041.106.521.241.200.811.11
* Significant at 5% probability level, ** significant at 1% probability level, NS = Non-significant. (CMT = Cell membrane thermostability, CTG = Canopy temperature at grain filling stage, RWC = Relative water content, PH = Plant height, FLA = Flag leaf area, PL = Peduncle length, SL = Spike length, DTH = Days to heading, DTM = Days to maturity, GPS = Number of grains per spike, TGW = Thousand grain weight, Pn = Net photosynthetic rate, Protein% = Grain protein content percentage, Starch% = Starch protein content percentage, Gluten% = Gluten protein content percentage, GYP = Grain yield per plant).
Table 5. General combining ability (GCA) estimates of lines and testers for grain yield and related traits under optimal and heat stress. Conditions.
Lines/TestersCMTCTGRWCPHFLAPLSLDTH
NTHTNTHTNTHTNTHTNTHTNTHTNTHTNTHT
WL75.60 **0.180.350.29−0.170.91 **−1.60 **0.53−1.15**−0.78 **0.78 *0.47 **−0.01−0.160.60 **0.47 **
WL8−1.75 **−1.20 **−0.58 *−0.17−0.240.40 *7.93 **−0.14−0.290.17−0.20−1.17 **−0.42**−0.05−1.02 **−2.51 **
WL27−0.09−1.86 **0.200.47 *1.16 **1.52 **−5.73**−1.59−0.37−0.48 **−0.66 *−0.231.48 **0.38 *−0.132.57 **
WL37−3.91 **−0.16−0.160.73 **0.101.36 **3.01 **4.90 **−0.60*0.130.090.69 **0.20 *0.31 *−0.181.06 **
WL573.39 **−1.44 **0.02−0.81**0.55 *−1.67 **−0.78**−1.892.22 **1.22 **1.78 **1.10 **−0.56**−0.271.90 **1.53 **
WL71−0.231.01 **0.45−0.74 **0.25−0.67 **−1.12**−2.310.57*−0.26 *0.60−0.87 **−0.56**−0.93 **−1.00 **−1.64 **
WL100−3.00 **3.46 **−0.290.22−1.65 **−1.84 **−1.70**0.50−0.380.00−2.40 **0.01−0.130.73 **−0.16−1.47 **
Std. Error0.1710.1580.2470.1830.2460.1750.0611.1750.3040.1140.0760.1500.2070.1490.2710.166
WT17−3.88 **−0.88 **0.62 **0.99 **1.68 **−0.011.75 **−1.530.110.68 **−0.09−0.220.20 **−0.52 **1.54 **0.76 **
WT391.64 **−0.46 **−0.66 **−0.131.27 **1.47 **−5.03**−6.73**0.250.13−1.61 **−1.32 **0.070.41 **0.44 **−0.39 **
WT830.25−1.71 **−0.10−0.42 **−0.52 **−0.36 **0.83 **2.34 *−0.73**−0.45**0.78 **0.37 **−0.51**−0.44 **−1.37 **1.77 **
WT921.98 **3.05 **0.14−0.44 **−2.43 **−1.10 **2.46 **5.92 **0.36−0.36**0.92 **1.17 **0.25 **0.55 **−0.61 **−2.14 **
Std. Error0.1290.1190.1860.1380.1860.1320.0460.8880.2120.0860.2300.1130.0580.1130.1570.126
Lines/TestersDTMGPSTGWProtein%Starch%Gluten%PnGYP
NTHTNTHTNTHTNTHTNTHTNTHTNTHTNTHT
WL71.63 **2.35 **2.10 **0.70 *−0.37 *−0.200.500.75 *0.65 *−0.320.520.59 *−1.93**−1.83 *−0.37−1.00 **
WL8−1.68 **0.67 *2.28 **−0.13−0.27−0.440.180.09−0.25−0.11−1.02 **−0.94 **−3.06**−2.37 **−2.30 **−0.99 **
WL272.24 **−1.97 **−2.09 **0.98 **0.72 **5.17 **0.010.290.440.60−0.32−1.01 **3.22 **2.60 **2.10 **1.18 **
WL372.03 **−0.54−0.45 *−1.35 **0.93 **0.87 **0.560.520.100.16−0.320.01−1.45**−0.95−1.28 **−1.03 **
WL570.200.17−1.14 **0.69 *1.35 **3.85 **0.380.300.040.10−0.79 *−0.101.79 **3.83 **0.58*2.06 **
WL71−1.14 **0.070.41 *0.85 **0.16−2.55 **−0.55−0.67 *−0.19−0.160.72 *0.241.32 **−1.431.08 **−0.39
WL100−3.27 **−0.75 *−1.11 **−1.75 **−2.52 **−6.71 **−1.09**−1.27**−0.79 *−0.271.22 **1.22 **0.10 **0.150.190.18
Std. Error0.2710.2380.1730.2950.1530.3030.2910.3210.3070.3160.3010.2590.0150.7370.2880.304
WT17−2.14 **−2.93**2.34 **1.48 **1.37 **−1.97 **0.270.380.11−0.17−0.98 **−1.25 **1.04 **1.64 **0.48*0.59*
WT390.12−0.90**−1.97 **−0.36−2.96 **−2.47 **0.200.16−0.090.05−0.040.231.46 **2.42 **0.81 **0.95 **
WT831.47 **2.66 **−0.97 **−0.66 **2.21 **6.68 **−0.19−0.30−0.35−0.51 *0.380.232.17 **−2.07 **0.97 **−0.64 **
WT920.55 **1.17 **0.60 **−0.46 *−0.62 **−2.24 **−0.28−0.240.330.63 *0.63 **0.79 **−4.67**−1.98 **−2.25 **−0.91 **
Std. Error0.2050.2190.1310.2230.1150.2290.2200.2430.2320.2390.2280.1960.0110.5570.2180.229
NT = Optimal condition, HT = Heat stress conditions. (CMT = Cell membrane thermostability, CTG = Canopy temperature at grain filling stage, RWC = Relative water content, PH = Plant height, FLA = Flag leaf area, PL = Peduncle length, SL = Spike length, DTH = Days to heading, DTM = Days to maturity, GPS = Number of grains per spike, TGW = Thousand grain weight, Pn = Net photosynthetic rate, Protein% = Grain protein content percentage, Starch% = Starch protein content percentage, Gluten% = Gluten protein content percentage, GYP = Grain yield per plant). * Significant at 5% probability level, ** significant at 1% probability level.
Table 6. Specific combining ability (SCA) of cross combinations for grain yield and related traits under optimal and heat stress conditions.
CrossesCMTCTGRWCPHFLAPLSLDTH
NTHTNTHTNTHTNTHTNTHTNTHTNTHTNTHT
WL7 × WT17−11.47**−2.61**1.92 **1.28 **−1.08*2.53 **8.42 **7.61 **1.12−1.89**−2.06 **−2.28 **−1.57 **−0.23−0.83 *−2.57 **
WL8 × WT171.47 **−5.44 **0.290.655.09 **0.042.21 **0.18−3.64 **1.75 **−0.31−0.541.30 **2.08 **−0.792.56 **
WL27 × WT175.47 **−2.08**−0.90−2.10 **1.79 **−0.26−4.79 **1.67−0.56−0.45−2.55 **2.71 **2.94 **0.35−2.02 **−5.15 **
WL37 × WT17−5.34 **2.31 **−0.01−0.25−1.16*1.22 **−6.47 **−3.62−3.47**−2.97**0.741.29 **1.01 **0.85 **2.45 **1.35 **
WL57 × WT17−3.04 **8.99 **−0.290.91*0.360.45−0.58 **−5.90*3.79 **1.90 **0.90−2.61 **−2.00 **−1.73 **0.40−0.11
WL71 × WT172.73 **−6.19**−0.71−0.84*−7.62 **−5.19 **4.92 **1.502.51 **1.48 **4.06 **4.20 **−1.05 **−0.46−0.66−0.34
WL100 × WT1710.17 **5.03 **−0.300.342.62 **1.19 **−3.70 **−1.440.260.18−0.79−2.76 **−0.62 **−0.86 **1.46 **4.26 **
WL7 × WT3915.04 **6.84 **−1.47 **−1.90 **0.952.51 **−6.62 **−16.85**−3.87**−0.84−3.17 **0.66 *0.94 **1.14 **3.84 **4.59 **
WL8 × WT39−2.52 **−2.30**−1.46 **−0.53−5.97**−3.98 **−9.87 **−7.51 **1.47*−1.86**−0.90−1.49 **0.67 **0.00−4.16 **−4.44 **
WL27 × WT396.41 **−3.82**−0.950.132.04 **2.85 **−6.42 **−6.09*−1.62**−0.33−2.77 **−3.38 **−0.93 **1.43 **0.630.85 *
WL37 × WT394.34 **0.37−0.93−0.41−1.24*0.08−8.75 **−5.67*2.67 **0.13−0.490.63 *0.64 **2.72 **−1.52 **−5.02 **
WL57 × WT391.34 **−4.21**−2.90 **−1.65 **2.21**3.77 **−5.67 **0.16−0.211.24 **−0.231.13 **−1.90 **−0.83 **−2.63 **−2.53 **
WL71 × WT399.01 **2.38 **−0.520.24−1.26*1.85 **−8.77 **−2.251.50 **−0.43−1.10−4.55 **1.21 **2.87 **2.31 **3.06 **
WL100 × WT395.03 **3.67 **−0.72−3.77 **0.413.25 **−1.37 **1.861.06−1.69**−1.99 **−0.66 *−1.53 **−0.77 *−6.19 **−4.60 **
WL7 × WT83−1.56 **−4.00**−2.01 **−0.200.51−0.08−7.56 **0.89−0.154.09 **0.790.182.03 **1.98 **−1.68 **−0.66
WL8 × WT83−8.74 **3.03 **1.10*−1.10 **−2.74 **1.32 **3.56 **3.40−0.90−1.60**−2.17 **0.82 **−2.15 **−2.16 **2.77 **−1.68 **
WL27 × WT83−6.02 **8.01 **0.510.61−0.06−1.17 **3.68 **−3.032.18 **0.87 **0.390.64 *−2.33 **−1.49 **−4.31 **0.84 *
WL37 × WT837.59 **5.23 **0.700.11−2.88**−2.60 **3.83 **0.38−2.42**−1.78**−1.43*−3.16 **0.02−0.31−2.19 **3.35**
WL57 × WT8313.52 **−1.91**0.42−1.49 **0.580.340.31*1.14−0.63−1.87**−0.97−1.42 **1.43 **1.90 **−1.15 **−1.83 **
WL71 × WT832.06 **−5.21**0.14−0.363.79 **2.55 **2.61 **3.37−0.16−0.81**−0.810.49−0.28−1.30 **0.19−3.42 **
WL100 × WT83−6.86 **−5.14 **−0.852.43 **0.80−0.35−6.43 **−6.15*2.08 **1.10**4.19**2.47 **1.29 **1.38 **6.38 **3.40 **
WL7 × WT923.51 **0.190.28−0.31−0.79−3.48 **−1.03 **3.163.05 **−1.90**2.92 **0.36−1.52 **−1.95 **−2.43 **−2.53**
WL8 × WT9215.31**5.12 **−1.21*−0.153.21 **4.09 **−2.68 **−1.263.21 **1.18 **1.86 **0.110.061.01 **1.08 *2.41 **
WL27 × WT92−0.35−1.69**0.070.24−4.19 **0.050.75 **2.260.15−0.63**3.41**−1.06 **0.190.65 *4.60 **2.31 **
WL37 × WT92−1.07 **−7.49**−1.04*−0.58 **4.87 **2.78 **4.62 **3.723.37 **4.08 **−0.350.15−1.80 **−2.33 **0.16−0.83 *
WL57 × WT92−6.30 **−2.45**1.50 **1.10 **−3.55 **−3.08 **−0.84 **−0.59−2.81**−1.80**−1.23*1.81 **2.34 **1.61 **2.28 **3.31 **
WL71 × WT92−8.28 **9.45 **−0.19−0.174.68 **2.27 **−5.54 **−7.82 **−3.70**−0.79**−3.67 **−1.24 **−0.01−0.17−2.94 **−0.45
WL100 × WT92−2.82 **−3.13**0.59−0.13−4.24 **−2.61 **4.72 **0.53−3.26**−0.13−2.94 **−0.140.73 **1.19 **−2.75 **−4.21 **
S. E0.3420.3160.4930.3650.4920.3490.1222.3500.5610.2270.6070.3000.1520.2990.4140.332
Wheat CrossesDTMGPSTGWProtein%Starch%Gluten%PnGYP
NTHTNTHTNTHTNTHTNTHTNTHTNTHTNTHT
WL7 × WT172.85 **0.760.091.41 *−2.6 **−3.22**−1.90**−2.03**1.67 **−0.760.59−0.70−10.2**−6.38**−5.41**−3.3 **
WL8 × WT176.36 **−0.021.97 **1.90 **4.06 **5.68 **−1.63**−1.30*−1.46 *0.082.82 **3.69 **5.67 **−0.052.68 **1.59 *
WL27 × WT17−0.71−2.0**7.43 **3.82 **1.41 **−2.73**−0.61−0.66−0.04−0.040.38−1.36 *4.12 **3.82 *2.07 **1.15
WL37 × WT17−1.24 *−0.23−1.16**0.27−1.76**−1.65**−0.40−0.07−0.55−0.200.240.738.47 **3.96 **4.84 **1.46 *
WL57 × WT17−5.1 **−4.9**−4.52**−3.80**1.61 **−0.691.031.46 **−0.65−0.31−2.15**−0.34−0.61**−0.50−0.44−0.19
WL71 × WT17−3.27**2.6 *−4.18**−4.97**−4.21**−2.21**2.15 **1.45 **0.660.96−0.62−1.54 **−8.65**−0.97−3.73**−0.99
WL100 × WT171.14 *3.7 **0.371.37 **1.48 **4.82 **1.35 *1.150.360.26−1.26 *−0.481.22 **0.12−0.010.32
WL7 × WT395.17 **6.6 **2.20 **1.21 **−4.58**−5.25**−0.11−0.03−0.171.230.401.12 *−1.77**0.90−1.120.51
WL8 × WT394.57 **3.6 **−4.04 **−3.79**−6.66**−7.26**0.13−0.310.670.860.090.623.40 **5.25 **1.85 **1.65 **
WL27 × WT394.32 **3.1 **−6.76**1.72 **−2.53**4.13 **0.720.45−0.43−0.784.14 **6.07 **−8.82**−3.83 *−3.75**−1.5 *
WL37 × WT39−1.34 *3.8 **−5.42**−1.83**1.10 **5.43 **0.741.31 *0.230.37−0.80−0.334.77 **5.19 **1.82 **2.85 **
WL57 × WT39−5.38**−2.0**−8.56**−2.81**−4.41**7.44 **−0.15−0.410.410.610.840.852.26 **1.890.850.65
WL71 × WT396.93 **−1.9 *−3.03**−4.92**−6.91**−5.05**−1.12−1.52 *−0.180.054.23 **4.66 **6.73 **−5.45**4.04 **−2.3 **
WL100 × WT391.48 **1.02 *−4.54 **−2.43**−6.36**−2.97**−0.66−1.09−1.9 **−0.78−2.35**−2.65**−3.59**1.51−1.39**0.69
WL7 × WT831.16 *−0.991.44 **1.40 **1.47 **3.02 **0.550.41−1.49 *−0.582.23 **2.91 **9.40 **1.745.32 **1.04
WL8 × WT83−5.30**1.8 **−2.76**−0.93−0.041.96 **0.640.430.270.19−0.38−0.76−7.53**−2.59−3.65**−1.03
WL27 × WT83−4.17**4.8 **−1.21**−2.12**−1.44 **−4.58**0.841.000.510.37−1.14−0.783.29 **−2.551.95 **−0.24
WL37 × WT831.77 **−9.9**−1.20**−3.58**−1.81**−0.121.41 *0.90−0.030.151.80 **1.45 **−9.35**−4.38**−4.67**−2.1 **
WL57 × WT835.98 **4.5 **5.73 **0.57−2.97**−4.10**−1.76**−2.18**0.100.08−1.69**−2.82**−3.76**0.30−1.65**−0.36
WL71 × WT831.34 *1.3 **−0.81*5.10 **1.95 **5.47 **−0.690.04−0.98−0.79−3.17**−3.11**2.88 **5.58 **−0.052.27 **
WL100 × WT83−0.78−1.6 **−1.19**−0.422.84 **−1.64 **−1.00−0.591.62 *0.582.35 **3.10 **5.07 **1.902.76 **0.42
WL7 × WT92−6.93**−4.4 **−8.03**−5.85**1.37 **4.95 **1.39 *1.42 *−0.220.33−2.29**−1.85**3.01 **4.52 **1.542.14 **
WL8 × WT92−3.38**−3.4 **0.530.99−1.69**−0.880.800.960.32−0.91−1.60 *−2.08**−1.10**−1.83−0.55−1.8 **
WL27 × WT922.81 **−3.9**−3.77**−5.26**−1.78**2.68 **−1.02−1.02−0.230.67−2.44 **−2.45**1.84 **3.34 *0.061.03
WL37 × WT923.06 **8.4 **3.48 **3.31**−1.86**−4.17**−1.82**−2.36**0.15−0.10−0.31−0.37−3.46**−3.99**−1.66**−1.8 **
WL57 × WT926.79 **4.5**3.04 **4.20 **1.43 **−3.15**0.820.90−0.06−0.163.94 **3.79 **2.53 **−0.911.57 **0.25
WL71 × WT92−2.75 **−0.1**3.71 **2.96 **4.83 **1.29 *−0.41−0.200.300.000.501.46**−0.54 **1.620.071.34 *
WL100 × WT920.40−1.2**1.05 **−0.35−2.29 **−0.720.240.30−0.260.172.19 **1.50 **−2.27**−2.75−1.03−1.07
S. E0.540.580.3460.5890.3050.6060.5820.6430.6140.6310.6020.5190.0301.4740.5760.607
NT = Optimal condition, HT = Heat stress condition. (CMT = Cell membrane thermostability, CTG = Canopy temperature at grain filling stage, RWC = Relative water content, PH = Plant height, FLA = Flag leaf area, PL = Peduncle length, SL = Spike length, DTH = Days to heading, DTM = Days to maturity, GPS = Number of grains per spike, TGW = Thousand grain weight, Pn = Net photosynthetic rate, Protein% = Grain protein content percentage, Starch% = Starch protein content percentage, Gluten% = Gluten protein content percentage, GYP = Grain yield per plant). * Significant at 5% probability level, ** significant at 1% probability level.
Table 7. Mean values of different classes of wheat crosses under optimal and heat stress conditions.
Mean Values of Four Classes of Wheat Hybrid Crosses under Optimal Conditions
ClassCMTCTGRWCPHFLAPLSLDTHDTMGPSTGWPROSTRGLUPnGYP
143.725.760.3111.627.541.412.998.2130.157.439.813.755.035.123.415.10
245.825.062.599.128.941.714.399.4130.054.940.613.854.834.533.820.55
362.924.961.9103.228.843.513.799.7130.758.138.914.255.333.126.516.83
Mean Values of Four Classes of Wheat Hybrid Crosses under Heat Stress Conditions
157.924.763.3101.528.931.613.184.1113.148.036.912.353.534.415.39.06
253.724.862.796.228.531.612.988.4112.147.950.313.753.834.320.411.93
358.425.561.089.728.731.412.989.0112.148.039.513.553.835.720.511.83
Table 8. Name of wheat crosses classified into different classes under optimal and heat stress conditions.
TreatmentsClass No.Name of Wheat Crosses/Genotypes
OptimalClass 1WL7 × WT17, WL8 × WT17, WL71 × WT17, WL8 × WT83, WL37 × WT83, WL37 × WT92, WL100 × WT92
Class 2WL27 × WT17, WL37 × WT17, WL57 × WT17, WL100 × WT17, WL8 × WT39, WL27 × WT39, WL37 × WT39, WL57 × WT39, WL71 × WT39, WL100 × WT39, WL7 × WT83, WL27 × WT83, WL71 × WT83, WL100 × WT83, WL27 × WT92, WL57 × WT92, WL71 × WT92
Class 3WL7 × WT39, WL57 × WT83, WL7 × WT92, WL8 × WT92
Heat StressClass 1WL7 × WT17, WL100 × WT39, WL8 × WT92, WL37 × WT92, WL100 × WT92
Class 2WL8 × WT17, WL27 × WT17, WL27 × WT39, WL37 × WT39, WL57 × WT39, WL7 × WT83, WL8 × WT83, WL27 × WT83, WL37 × WT83, WL57 × WT83, WL71 × WT83, WL7 × WT92, WL27 × WT92
Class 3WL37 × WT17, WL57 × WT17, WL71 × WT17, WL100 × WT17, WL7 × WT39, WL8 × WT39, WL71 × WT39, WL100 × WT83, WL57 × WT92, WL71 × WT92
Publisher’s Note: MDPI stays neutral with regard to jurisdictional claims in published maps and institutional affiliations.

