1. Introduction
Transport plays a crucial role in the social and economic development of a single country and wider areas such as the European Union. Currently, the transport system is considered a key factor for sustainable development, competitiveness, well-being, and for countries’ cohesion. These goals have been also addressed in the United Nation 2030 Agenda [
1].
Many EU projects and local government policies are focusing on the development of electric mobility as a way to reduce the impact of transport on the environment. The advent of electric vehicles (EVs) promises to be a game-changer for the world’s shift to sustainable energy and particularly to renewable power generation. The need to power the ever-increasing number of EVs can represent the opportunity to identify alternative and sustainable electricity sources for their power supply [
2,
3].
Then, mixing electric mobility and renewable energies is a key issue for supporting the sustainability goals of the EU policies according to the objective of the 2030 Agenda of UN [
1] and other international agreement against the climate change.
In a sustainable mode of transport, it is reasonable to hope that urban transport can be entrusted not only to EVs but also to Electric Bicycles (e-bikes) and Pedal Electric Cycles (pedelecs).
In terms of urban mobility, the future challenge could be to focus on a modal shift from car to bicycle. This target would lead to a double benefit: one environmental and one in terms of reducing traffic congestion and urban space use for roads. A simple shift from conventional vehicles to EVs could lead to a reduction of emission gas only, whereas shifting from cars (electric or not) to bikes will return traffic congestion and health diseases reduction too as well as more livable cities.
Nowadays, E-bikes and Micro-Mobility (scooter, onewheel, segway) represent individual transport options that reduce traffic with zero emissions and make it easier for people to get to their trip destinations. Moreover, unlike normal bicycles, they can be even used for longer urban transfers in terms of distance, reducing the transfer times and the physical effort that the user must spend to use it. Thus, a wider range of users can be attracted from these e-vehicles. In addition, they could be a valid option within the intermodal passenger transport for the first/last mile trips supporting public transport [
4,
5] and urban city logistics, too [
6].
In order to cope with the lack of a single regulation, the European Union has recently established the new Bike Europe White Paper [
7] that contains all details on the type approval Regulation 168/2013, including full details on the categorization of different types of electric bicycles. Furthermore, the White Paper reports full updated details on rules and legislation governing electric bicycles with 250 W and assistance up to 25 km/h per vehicle.
Nowadays, renewable sources of energy are a viable option in terms of environment protection and sustainability. Research is making important efforts to identify new ways to exploit renewable energy sources. Among the others, water energy is still considered a focal renewable energy source, even if it has been long exploited in terms of large hydroelectric potential. On the contrary, the adoption of micro hydro technology into a water distribution network (WDN) can represent an interesting opportunity with relevant expectations. In particular, Pumps as Turbine (PATs) can be used to convert the excess of water potential energy existing in WDNs into electrical energy. Such energy can be used for charging electric vehicles according to the available water potential energy.
WDNs are characterized with old pipes in a large part of European countries, and in numerous cases, pressure is very high not only during the night, when drinking water demand is minimum, but also during the day due to the topography and topology of a WDN and, finally, due to reservoir location.
Pressure control is one of the most important issues in optimizing the operation of hydraulic networks with the aim of reducing leakage volume and avoiding pipeline disruption [
8].
A pressure control strategy through pressure-reducing valves (PRVs) has been deeply investigated as a WDN management strategy, avoiding very expensive pipes replacement programs [
9].
A significant reduction of background leakages and pipe bursts is the necessary condition for improving the efficiency and performance of water distribution systems (WDS). In this direction, a consolidated approach is the pipe system sectorization thanks to District Metered Areas (DMAs) to control both pressure and flow. In addition, DMAs are often supplied through a pressure-reducing valve (PRV) to control the inlet pressure [
9]. Criteria for the optimal design of DMAs and PRVs location are widely available in the technical literature [
10,
11]
The use of PATs contrasts with the wide use of the PRVs technique because the last dissipates pressure energy, adding a localized head loss to the system. This energy loss opposes modern principles of rational use of resources and global clean energy policies projected to increase the contribution of renewable energy resources [
12].
In our new paradigm, energy pressure could be used to actuate a turbine coupled to a generator, producing electricity and maintaining the pressure reduction commitment in the sector [
8].
Energy produced converting water pressure in excess into electricity is a current topic. A large part of these studies considers an optimal location of a PAT on the hydraulic node following two different objective functions with the purpose of optimizing either pressure reduction or power output potential [
13]
A similar approach does not consider aspects related to the final use of the recovered electricity. However, the current scenario highlights an ever-increasing number of EVs. This fast growth has a significant impact on both the distribution and transmission grid and the consequent additional electricity demand. In particular, the distribution grid would be under considerable stress due to EVs’ simultaneously charging request [
14].
Thus, the interest of the authors is to focus on the chance of producing electric energy locally and to use it to charge EVs on site. It is the same philosophy on which on-site electrical power generation is based, which today is considered beneficial to the environment in several ways. Overall, any power that is generated on-site, regardless of the source, that replaces power supplied from elsewhere will avoid the waste of energy that is lost in transmission and can be used to reduce peak demand on the utility.
In this context, this paper proposes a chain-of-command methodology represented by a bi-level problem formulation to design and optimize the e-charging stations system for (individual or shared) e-bikes and/or e-scooters. The first level concerns stations and fleet sizing (number of docks/stalls for each station and total number of EVs). The results of the first level represent input data for the lower level where a hydraulic model identifies WDN points characterized with the best power output potential and greater proximity to the charging stations already identified, which is useful to convert water pressure in excess into electric energy. The potential of the methodology will be shown by an application to a real Italian case study.
2. Energy Recovery in WDNs
Global environmental policies and the transition to an electricity-based system require a strong contribution deriving from renewable energy sources. Nevertheless, solar and wind energy, due to their intermittent production due to seasonal or even daily changes in the weather, cannot represent the only alternative. As a consequence, there is often a mismatch between renewable energy production and its use [
15]. Hydropower energy could be an interesting solution in terms of electric energy production. However, especially in Europe, it is rare to have the opportunity to build new hydro plants, as the major water resources are currently already exploited. PATs could provide a solution for energy production in small hydropower stations such as small streams and WDNs in which conventional turbines might not be affordable, while PATs are easily applicable for their low cost and wide application.
Some water management authorities are struggling with the management of rather old pipes affected by copious water losses. In recent years, the same authorities have started to install pressure-reducing valves to contain and limit these losses. The substitution of pressure-reducing valves (PRVs) by PATs is sustainable if the energy recovery balances the installation and maintenance costs with a comparable and efficient reduction of the volume lost by leakage [
15].
The PAT position is a focal aspect in terms of energy produced and economic convenience. The technical literature summarized several studies about this aspect. For instance, Giugni et al. [
13] selected two different objective functions with the purpose of optimizing either pressure reduction or power output potential; Fecarotta et al. [
16] considered the net present value (NPV) to analyze the profitability of the PAT investment such as a unique objective function to define the optimal location of the same within a water network.
Moreover, in the Mediterranean countries, the water scarcity and possible low pressure during the day represent a hard limit for users, and for this reason, they try to go beyond these limits by means of private tanks. Private tanks deeply modify the WDN behavior, and starting from this aspect, De Marchis et al. [
17] carried out an economic analysis comparing several scenarios by varying PAT position and taking into considerations private tanks.
Nowadays, there is still no standard design criteria available for a pattern of variable flow rate and pressure head conditions produced by the variability of users’ demand [
18], but many studies demonstrated how it is possible to define a more appropriate strategy in every case [
19,
20].
The feasibility of the system and the economic return are highlighted by numerous studies applied to real hydraulic networks [
17,
21,
22,
23,
24,
25,
26].
Although the benefit deriving from the replacement of a PRV with a PAT is unquestionable, the water management authorities remain skeptical and fearful; then, the practical applications mentioned in the literature still appear to be rather modest [
27]. The doubts are linked to the inclusion in the distribution network and to the absence of detailed information from the manufacturers of centrifugal pumps.
An open question is not only the possibility of exploiting available energy converting water pressure in excess that is otherwise lost but also identifying how this energy can be used. For example, one possibility could be not to feed the energy produced directly into the electricity grid but to use it on site, for example to charge electric cars [
28], scooters, or bikes to improve the balance in the WtW (Well-To-Wheels) cycle.
Starting from this consideration, in the next sections, a real-sized case study is presented to show the potential of the proposed methodology that allows determining the optimal number and location of the charging stations on the study area while considering at the same time the WDN structure and hydraulic properties as well as the feature of the road network and demand of e-bikes. The results and discussion end the paper.
4. Case Study
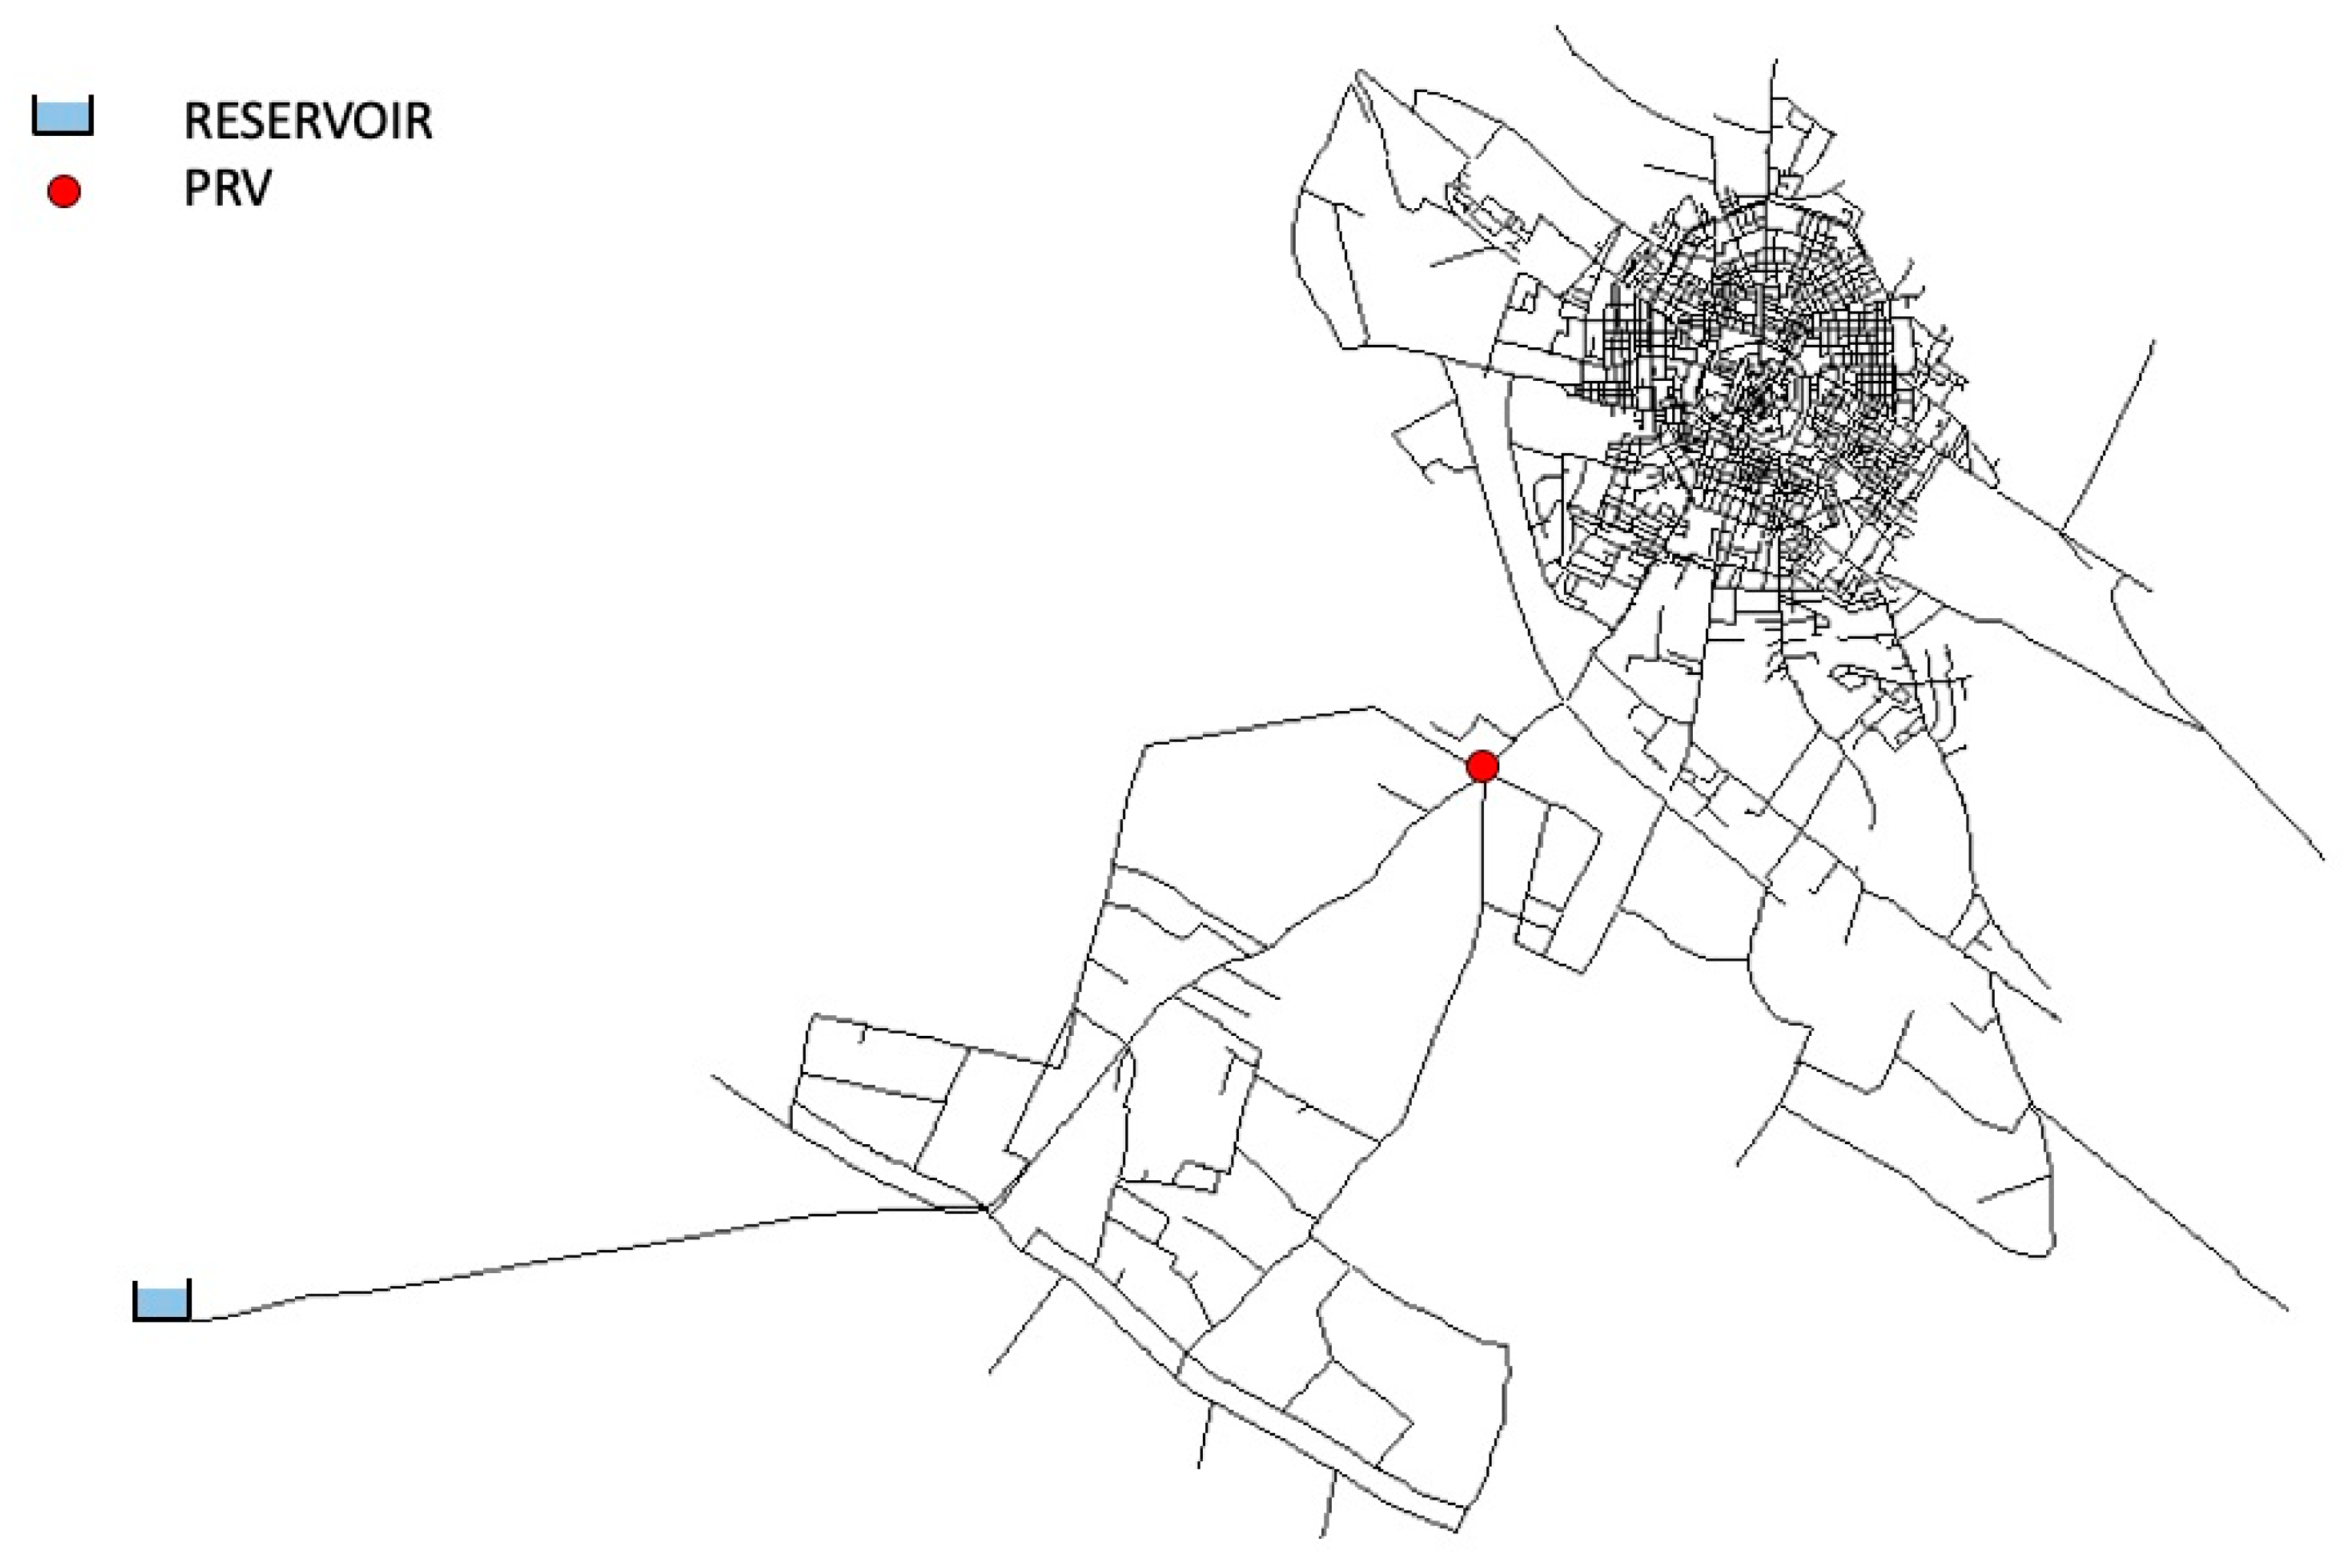
The case study concerns a real Italian WDN, here indicated as
Murgia network for the sake of data privacy given by the water management authority. The considered WDN serves a town with approximately 50,000 inhabitants, and it is supplied by a unique water tank. Currently, a pressure-reducing valve (PRV) is installed on the main pipe at the origin of the WDN (
Figure 1) because water losses increased, and non-revenue water exceeded 50% of the total input volume. The WDN, thanks to its altitude and the tank position, works by gravity, and the pressure is higher than 100 m without the PRV.
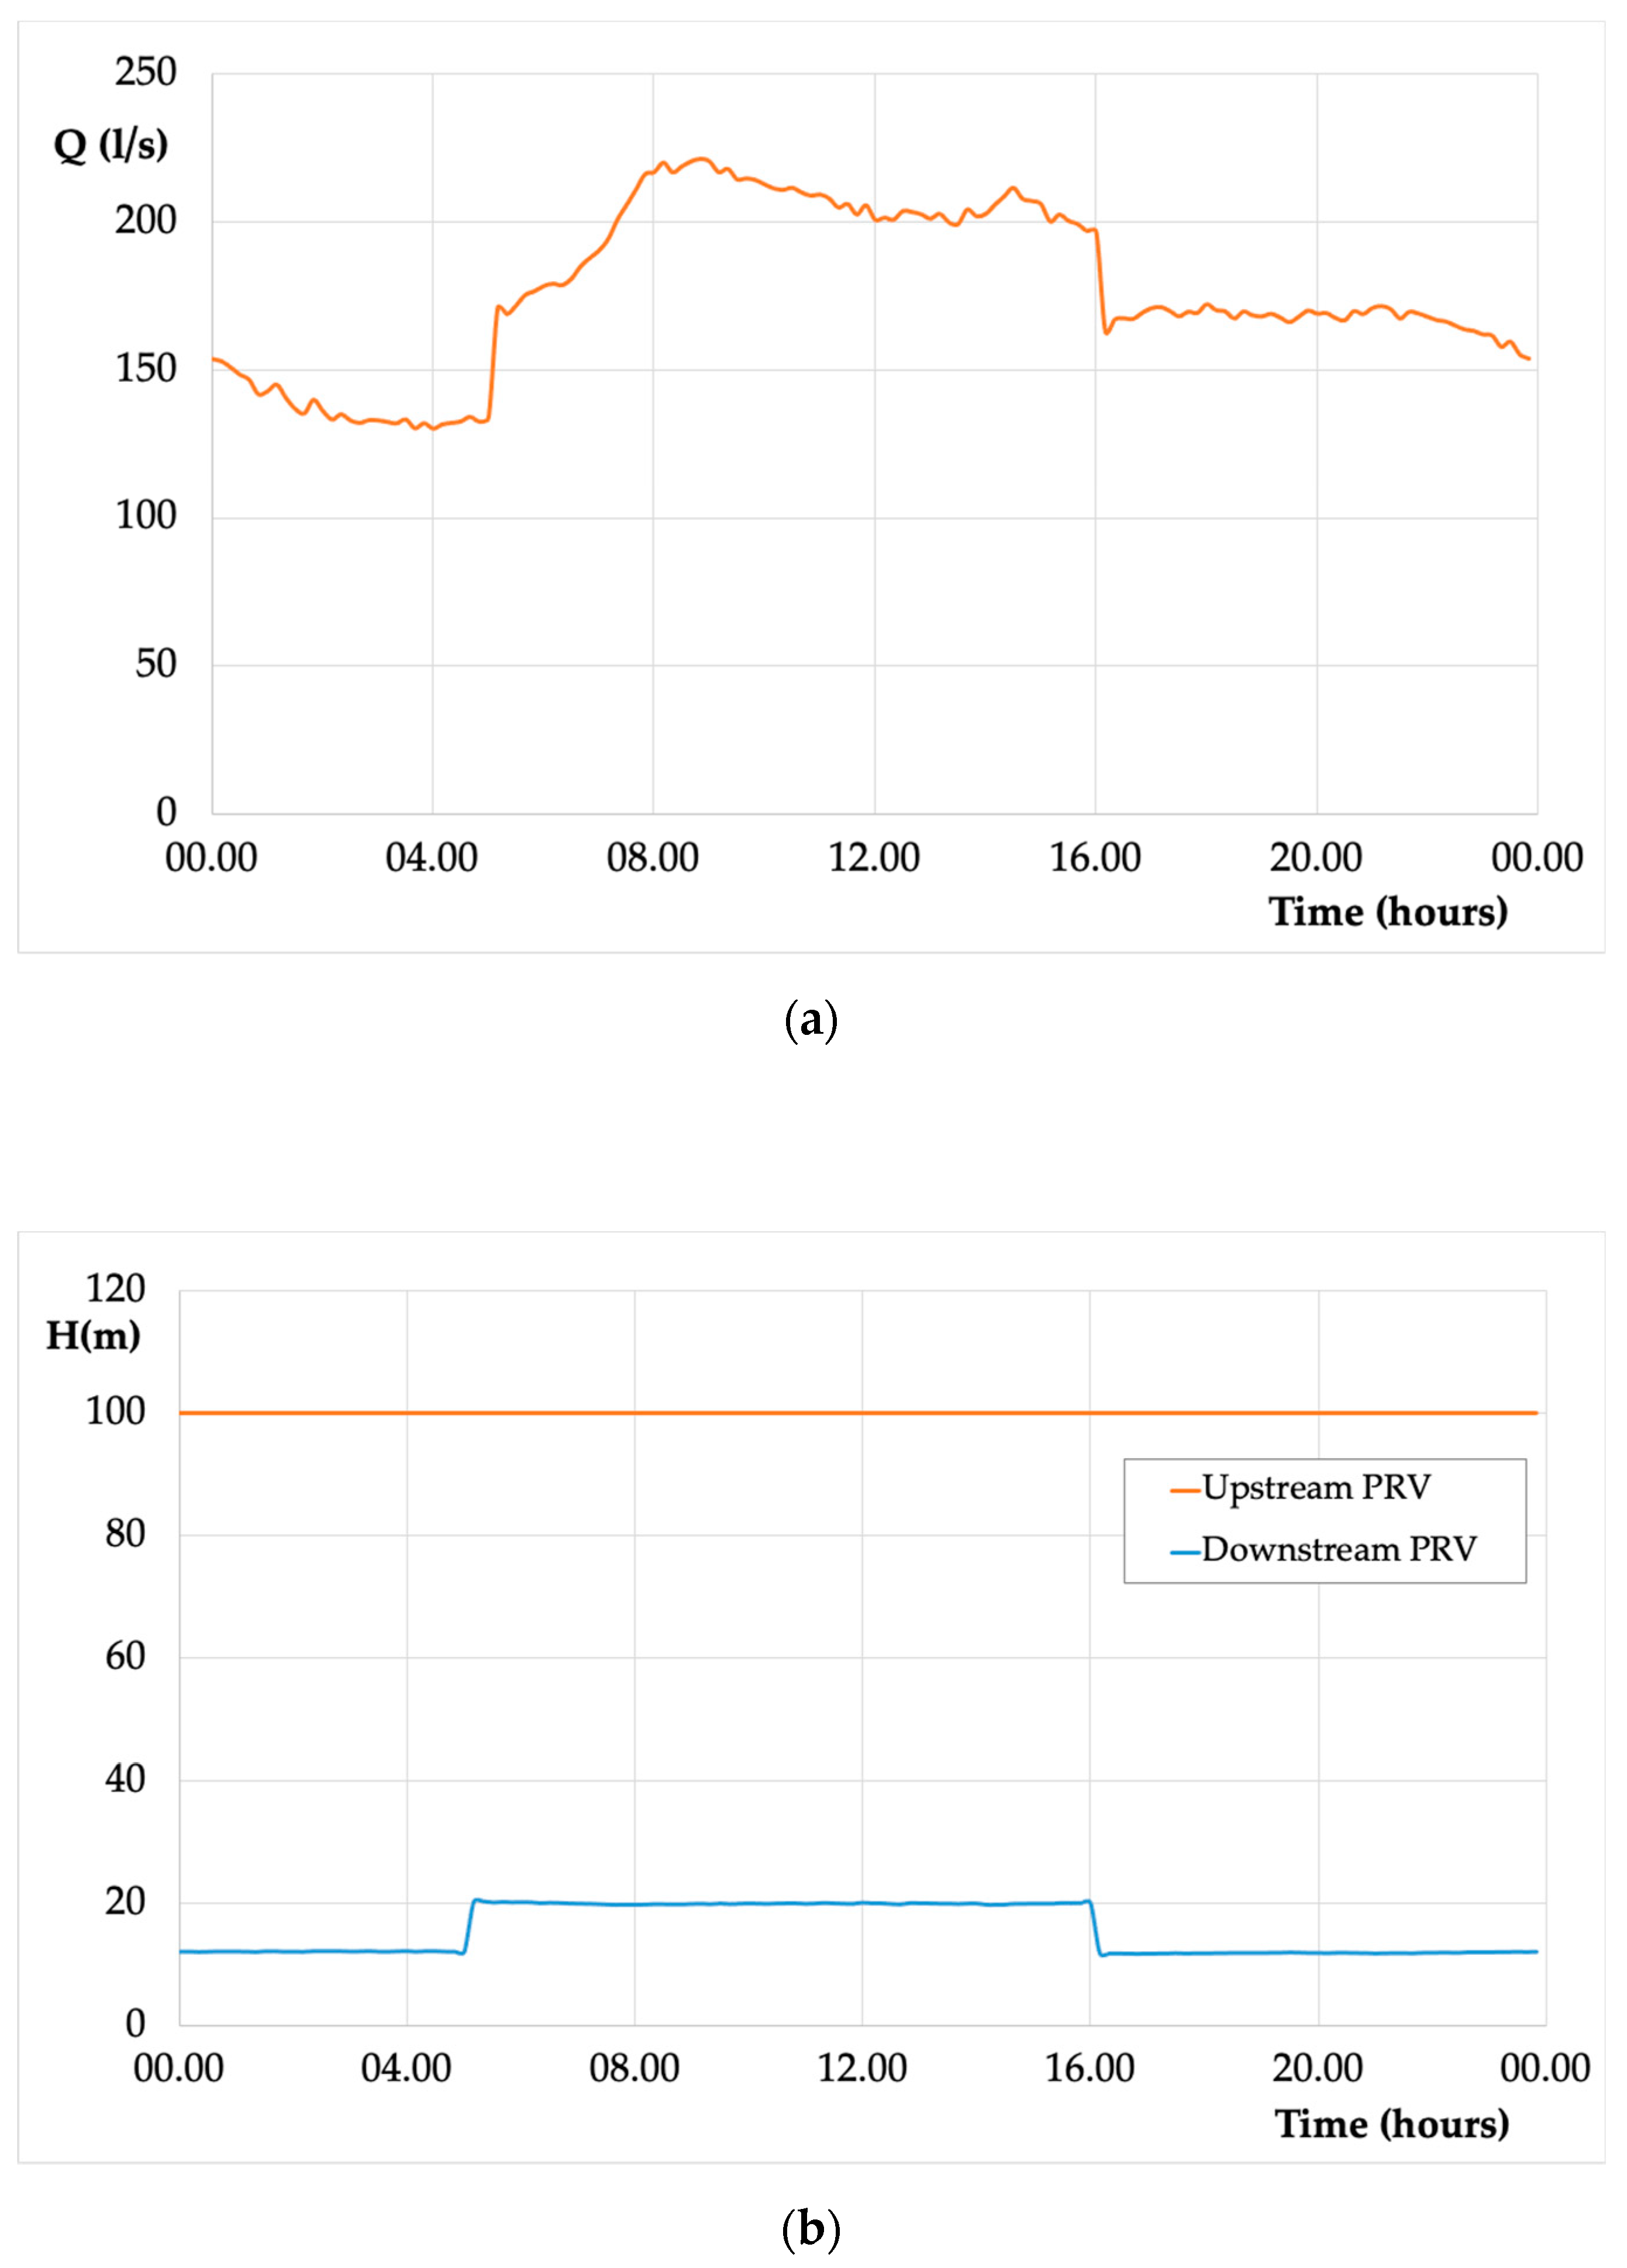
Currently, the water management authority sets a double regulation in order to guarantee the necessary daily water demand and to reduce nightly leakages.
Figure 2 reports the flow rate values and pressure pattern measured downstream the tank and downstream the PRV in a typical day with a 10-min data-recording step. During the night, the site is characterized with an available pressure drop of about 90 m, whereas during the daytime, the available pressure drop is lower, approximately 80 m.
Figure 2b shows that about 80–85% of the water head is lost because of the PRV that creates local head loss and fixes the water head downstream the valve itself.
With reference to the Murgia network case study, a first attempt of using Pump-as-Turbine (PAT) in place of the PRV has been proposed in Stefanizzi et al. [
21]. In their study, the daily available energy that could be exploited was 2241.2 kWh/day.
The proposed study aims at designing a distributed PATs system determining the optimal points where PATs could be placed in a WDN according to the E-bikes (or E-scooters) stations’ location. The proposed design methodology, on the basis of an interdisciplinary approach, determines the optimal layout and characteristics from both hydraulic and transportation engineering standpoints at the same time.
Such a distributed PATs system represents an alternative and innovative use of PRV that allows converting an excess of water pressure in electric power providing electricity for the purposes of charging E-bikes.
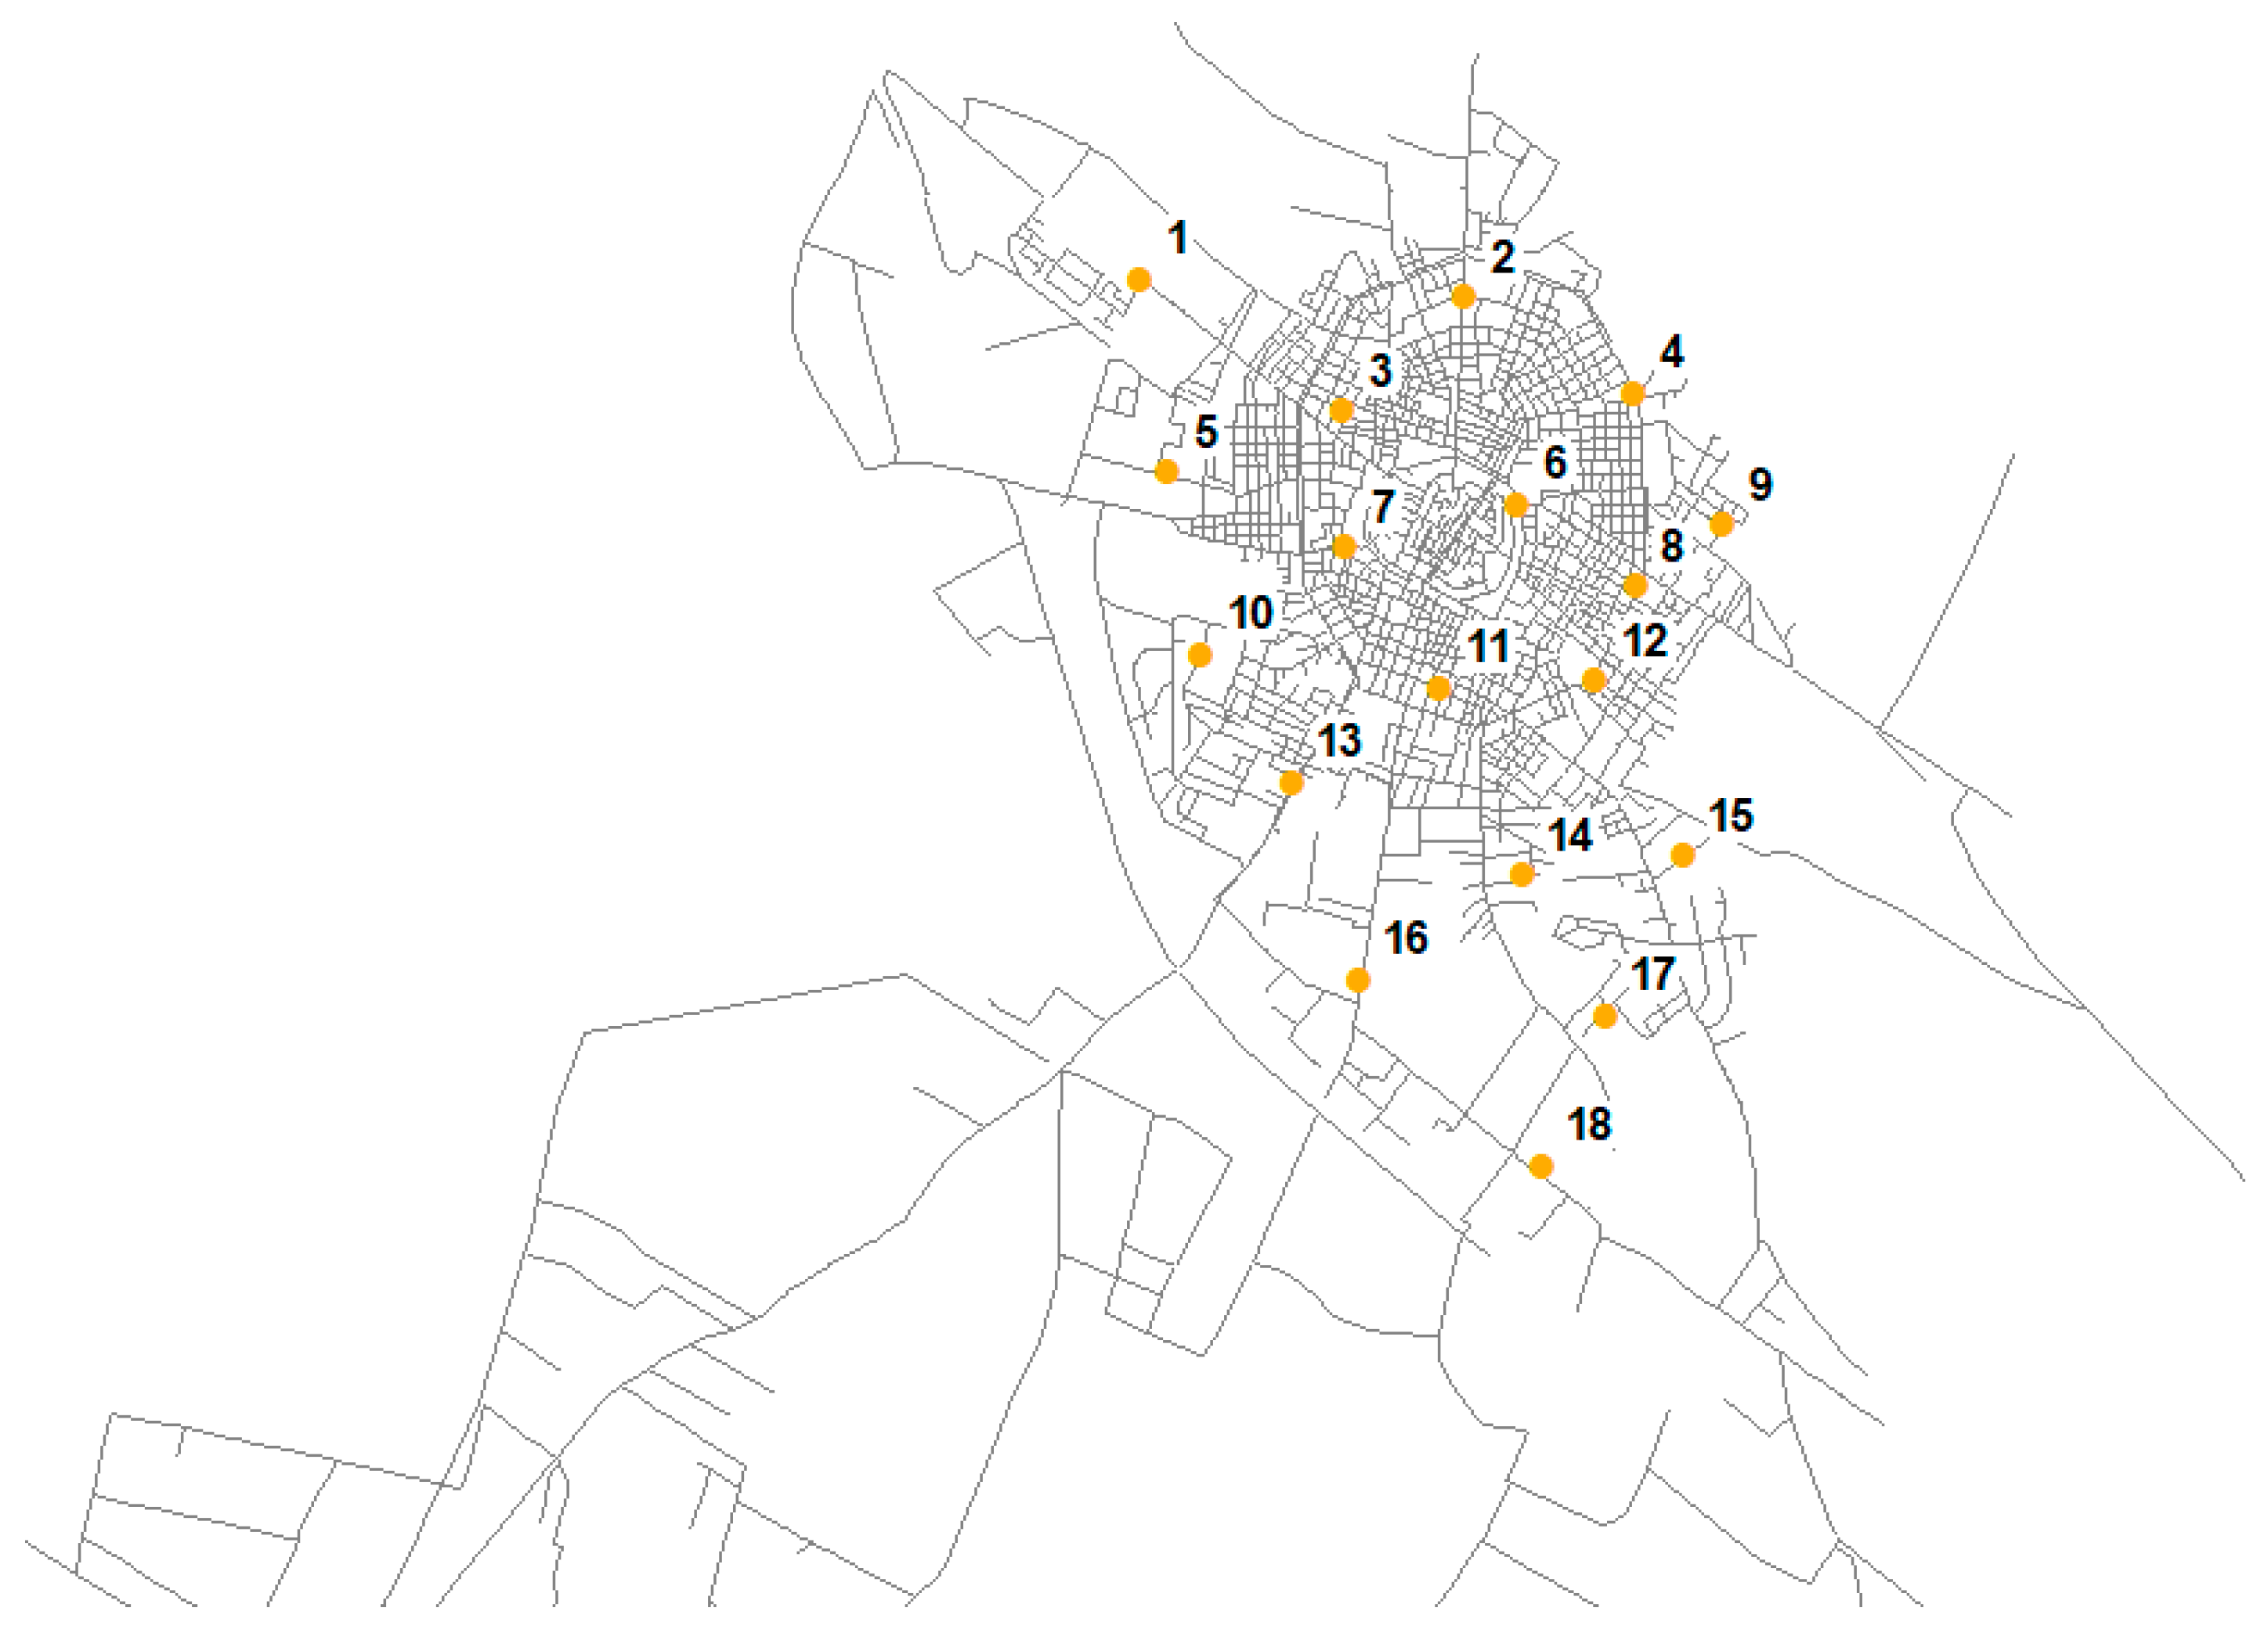
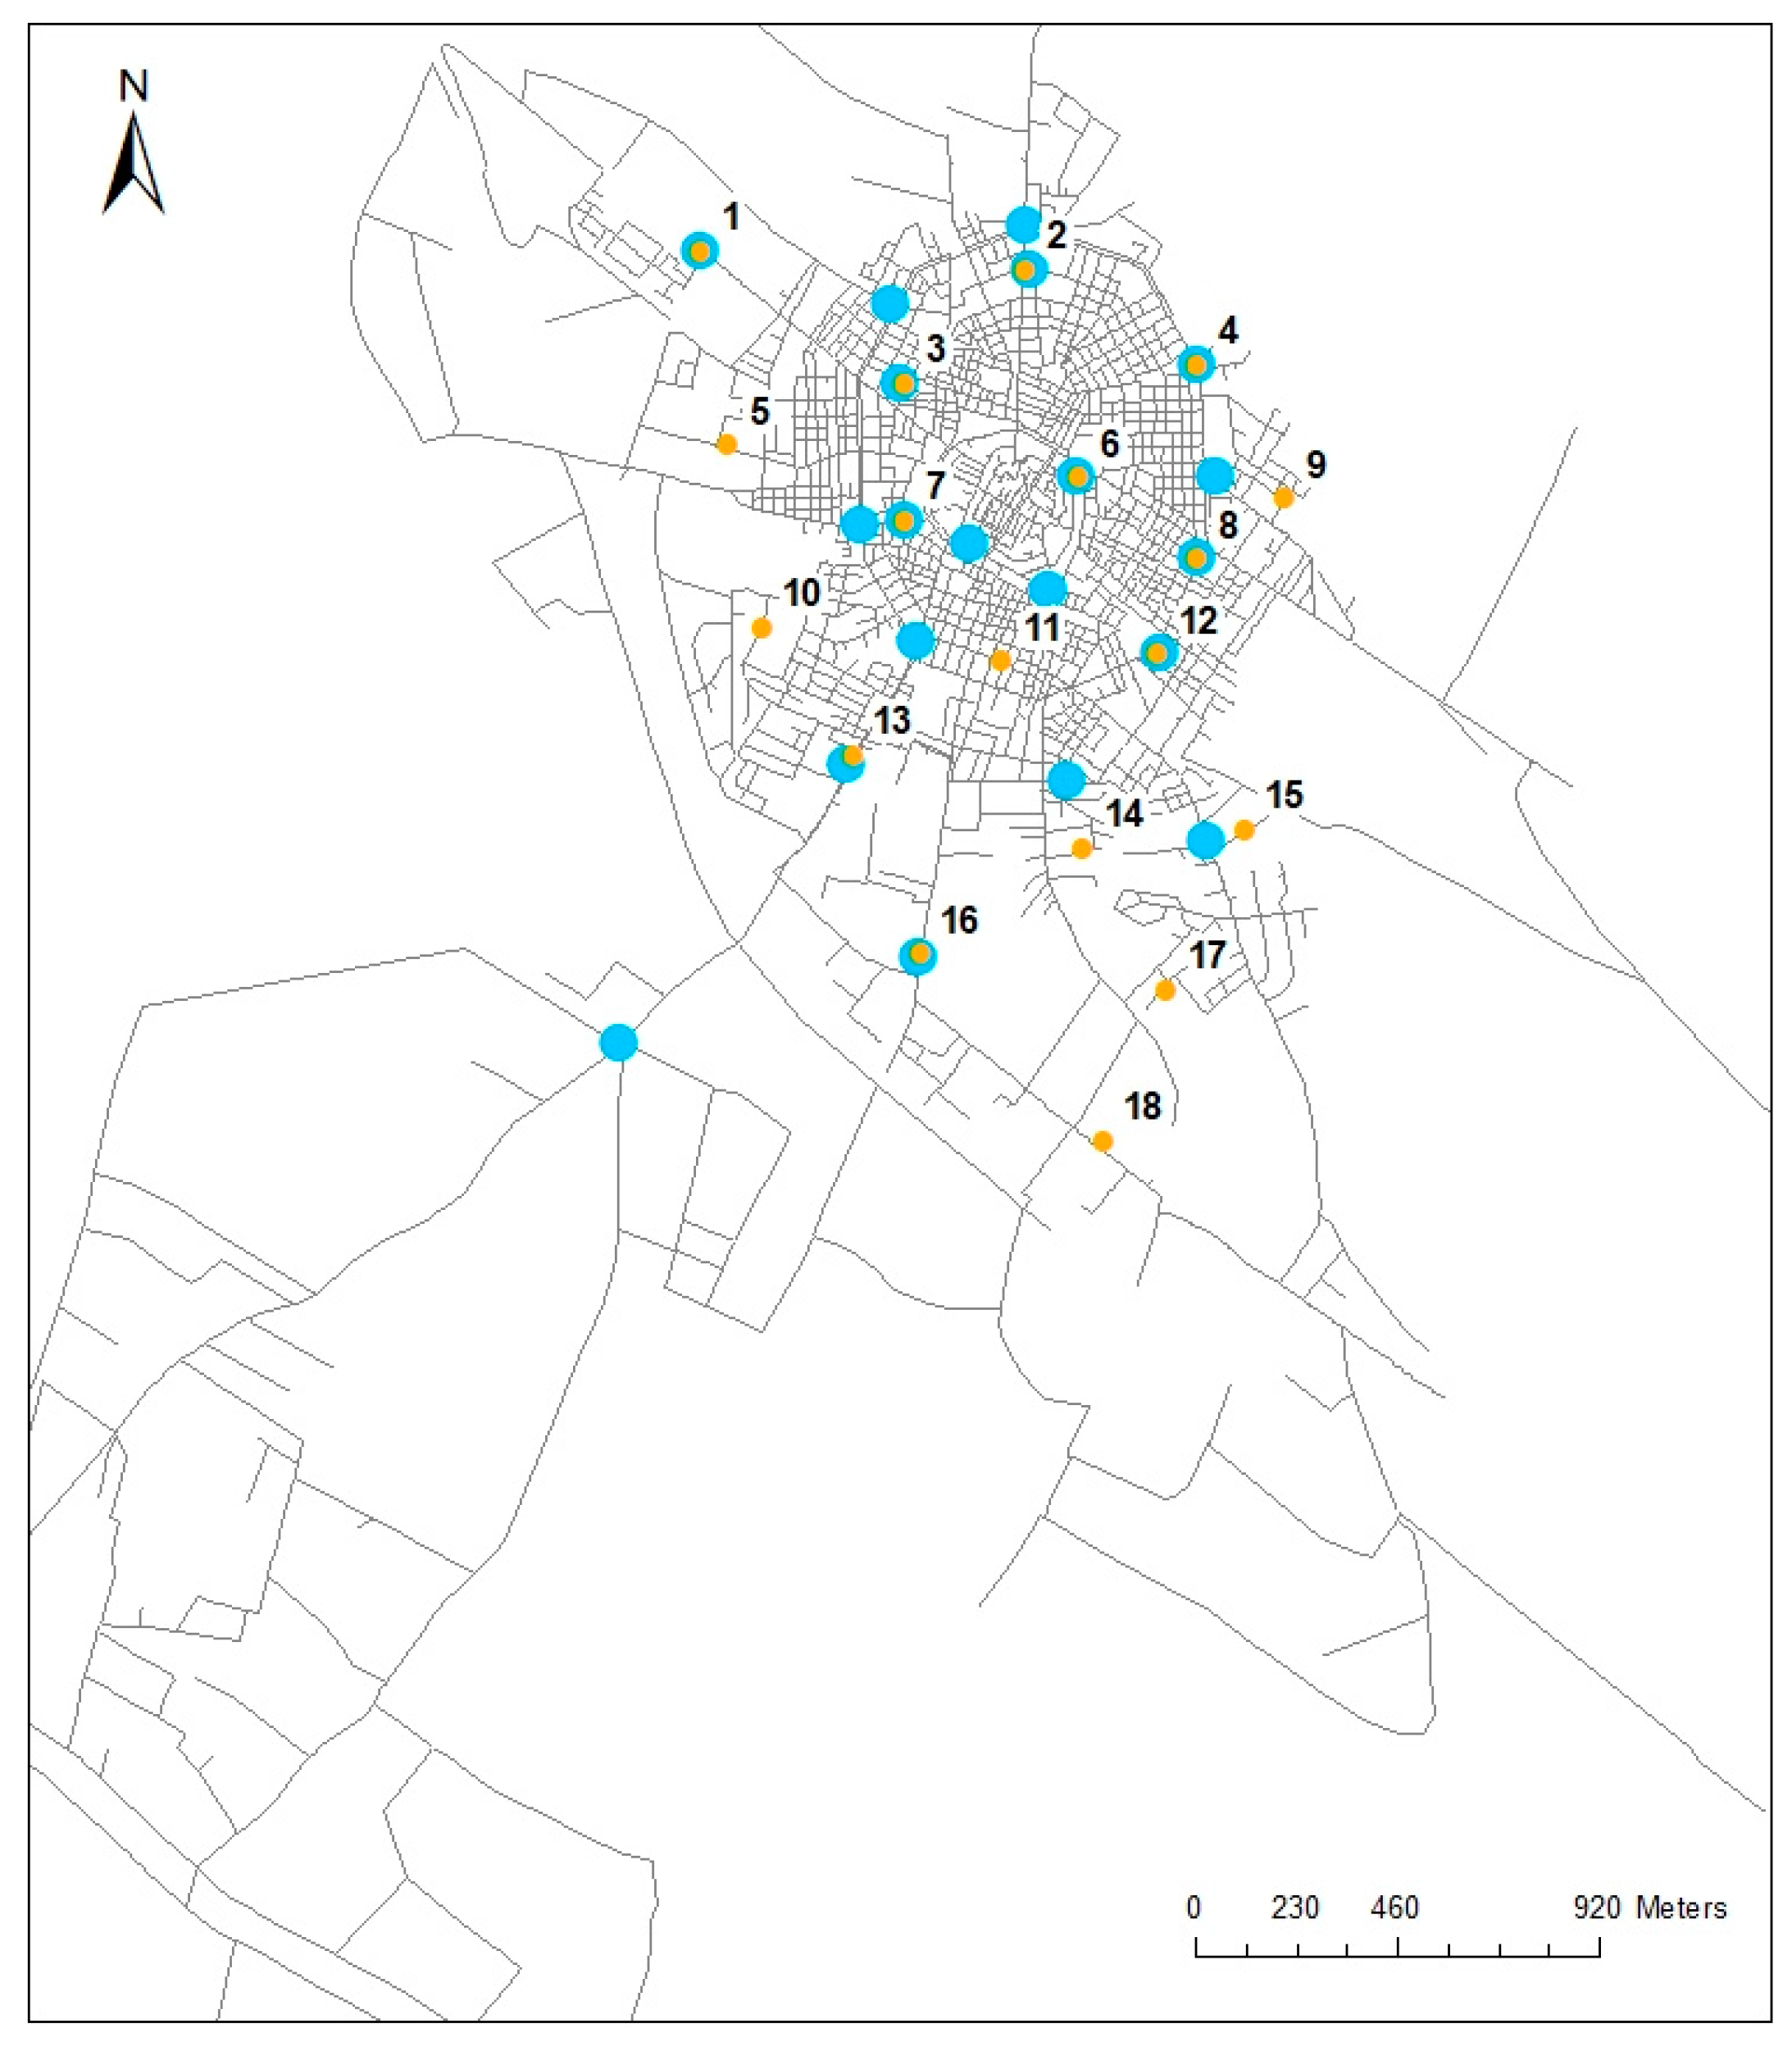
Given that most of the bike-share usage comes from an area within 300 m of a station [
37], the study area was divided into 18 zones.
Figure 3 shows e-bike charging stations for the case study of the Murgia network. Each zone has a bike station at its centroid and it is enclosed within a radius of 300 m from its station. Depending on the available space in each station location, the maximum number of installable docks has been set (
Table 1).
Considering that the docks are sold in modules of four each, the minimum number of docks for a station () has been set equal to four. Each dock has a battery charger with a maximum requested input power of 460 W. Furthermore, the maximum number of docks that can be purchased with the relative allocated budget () is equal to 400.
The e-bike chosen in this study has a 300 Wh battery. Assuming to use a city bike with an average speed of 15 km/h and an average total weight of 95 kg (bike and user), with roads of poor quality, according to the Bosch e-bike range calculator [
40], the distance that can be covered is equal to 60 km. The battery’s State of Charge (SoC) was split into four equal intervals. For each interval, expecting that the SoC goes from 0% to 50% in 2 h and from 50% to 100% in 3 h [
41], we assumed that a different power input was required by the battery charger: 368 W (SoC = 0%–25%), 460 W (SoC = 26%–50%), 276 W (SoC = 51%–75%), and 138 W (SoC = 76%–100%). The battery discharge rate was considered to be linear according to the distance traveled. The maximum number of e-bikes (fleet) that can be purchased with the relative allocated budget (
) is equal to 200.
The standard operating day of the system was divided into Z = 288 intervals of 5 min each. An expected average daily demand of 411 trips was assumed. This value is equal to about 2.5% of home–work and home–school trips within the studied area. Thus, the simulator has generated the demand between the 18 zones in each interval of the day. A user who finds an empty/full station of departure/arrival has the possibility to change stations, choosing another one within a 10-min radius on foot/by bike. This choice can be made on the basis of real-time station data that are available through the smartphone application of the bike-sharing system. In the simulator, it was also imposed that all bikes at the stations are being charged if their SoC is less than 100%. The SoC at the beginning of the day of all the bike batteries was set at 100%.
The problem (1)–(6) relevant to the first stage of the model has been solved by using a genetic algorithm, repeating the optimization 30 times. The best solution found is shown in
Table 2. In this case, the objective function is equal to zero (i.e., all the requested trips are satisfied). The total number of docks and e-bikes is equal to 224 and to 128, respectively. These values are somewhat lower than the budget available for their purchase.
Table 2 shows, for each station, the number of docks (first row), the number of e-bikes at the beginning of the day (second row), and the maximum power required by the chargers during the day (
Pm). In particular, station 4 is the one that requests the greatest overall power, while stations 10 and 15 request the lowest. In any case, for the design of the PATs (next stage), the entire sequence, during the day, of the required power by each station will be considered.
Once the transport design problem is solved (first stage), it is necessary to solve the hydraulic problem (second stage). To apply the hydraulic algorithm introduced in the previous section and to define the optimal PATs position, it was first necessary to build the
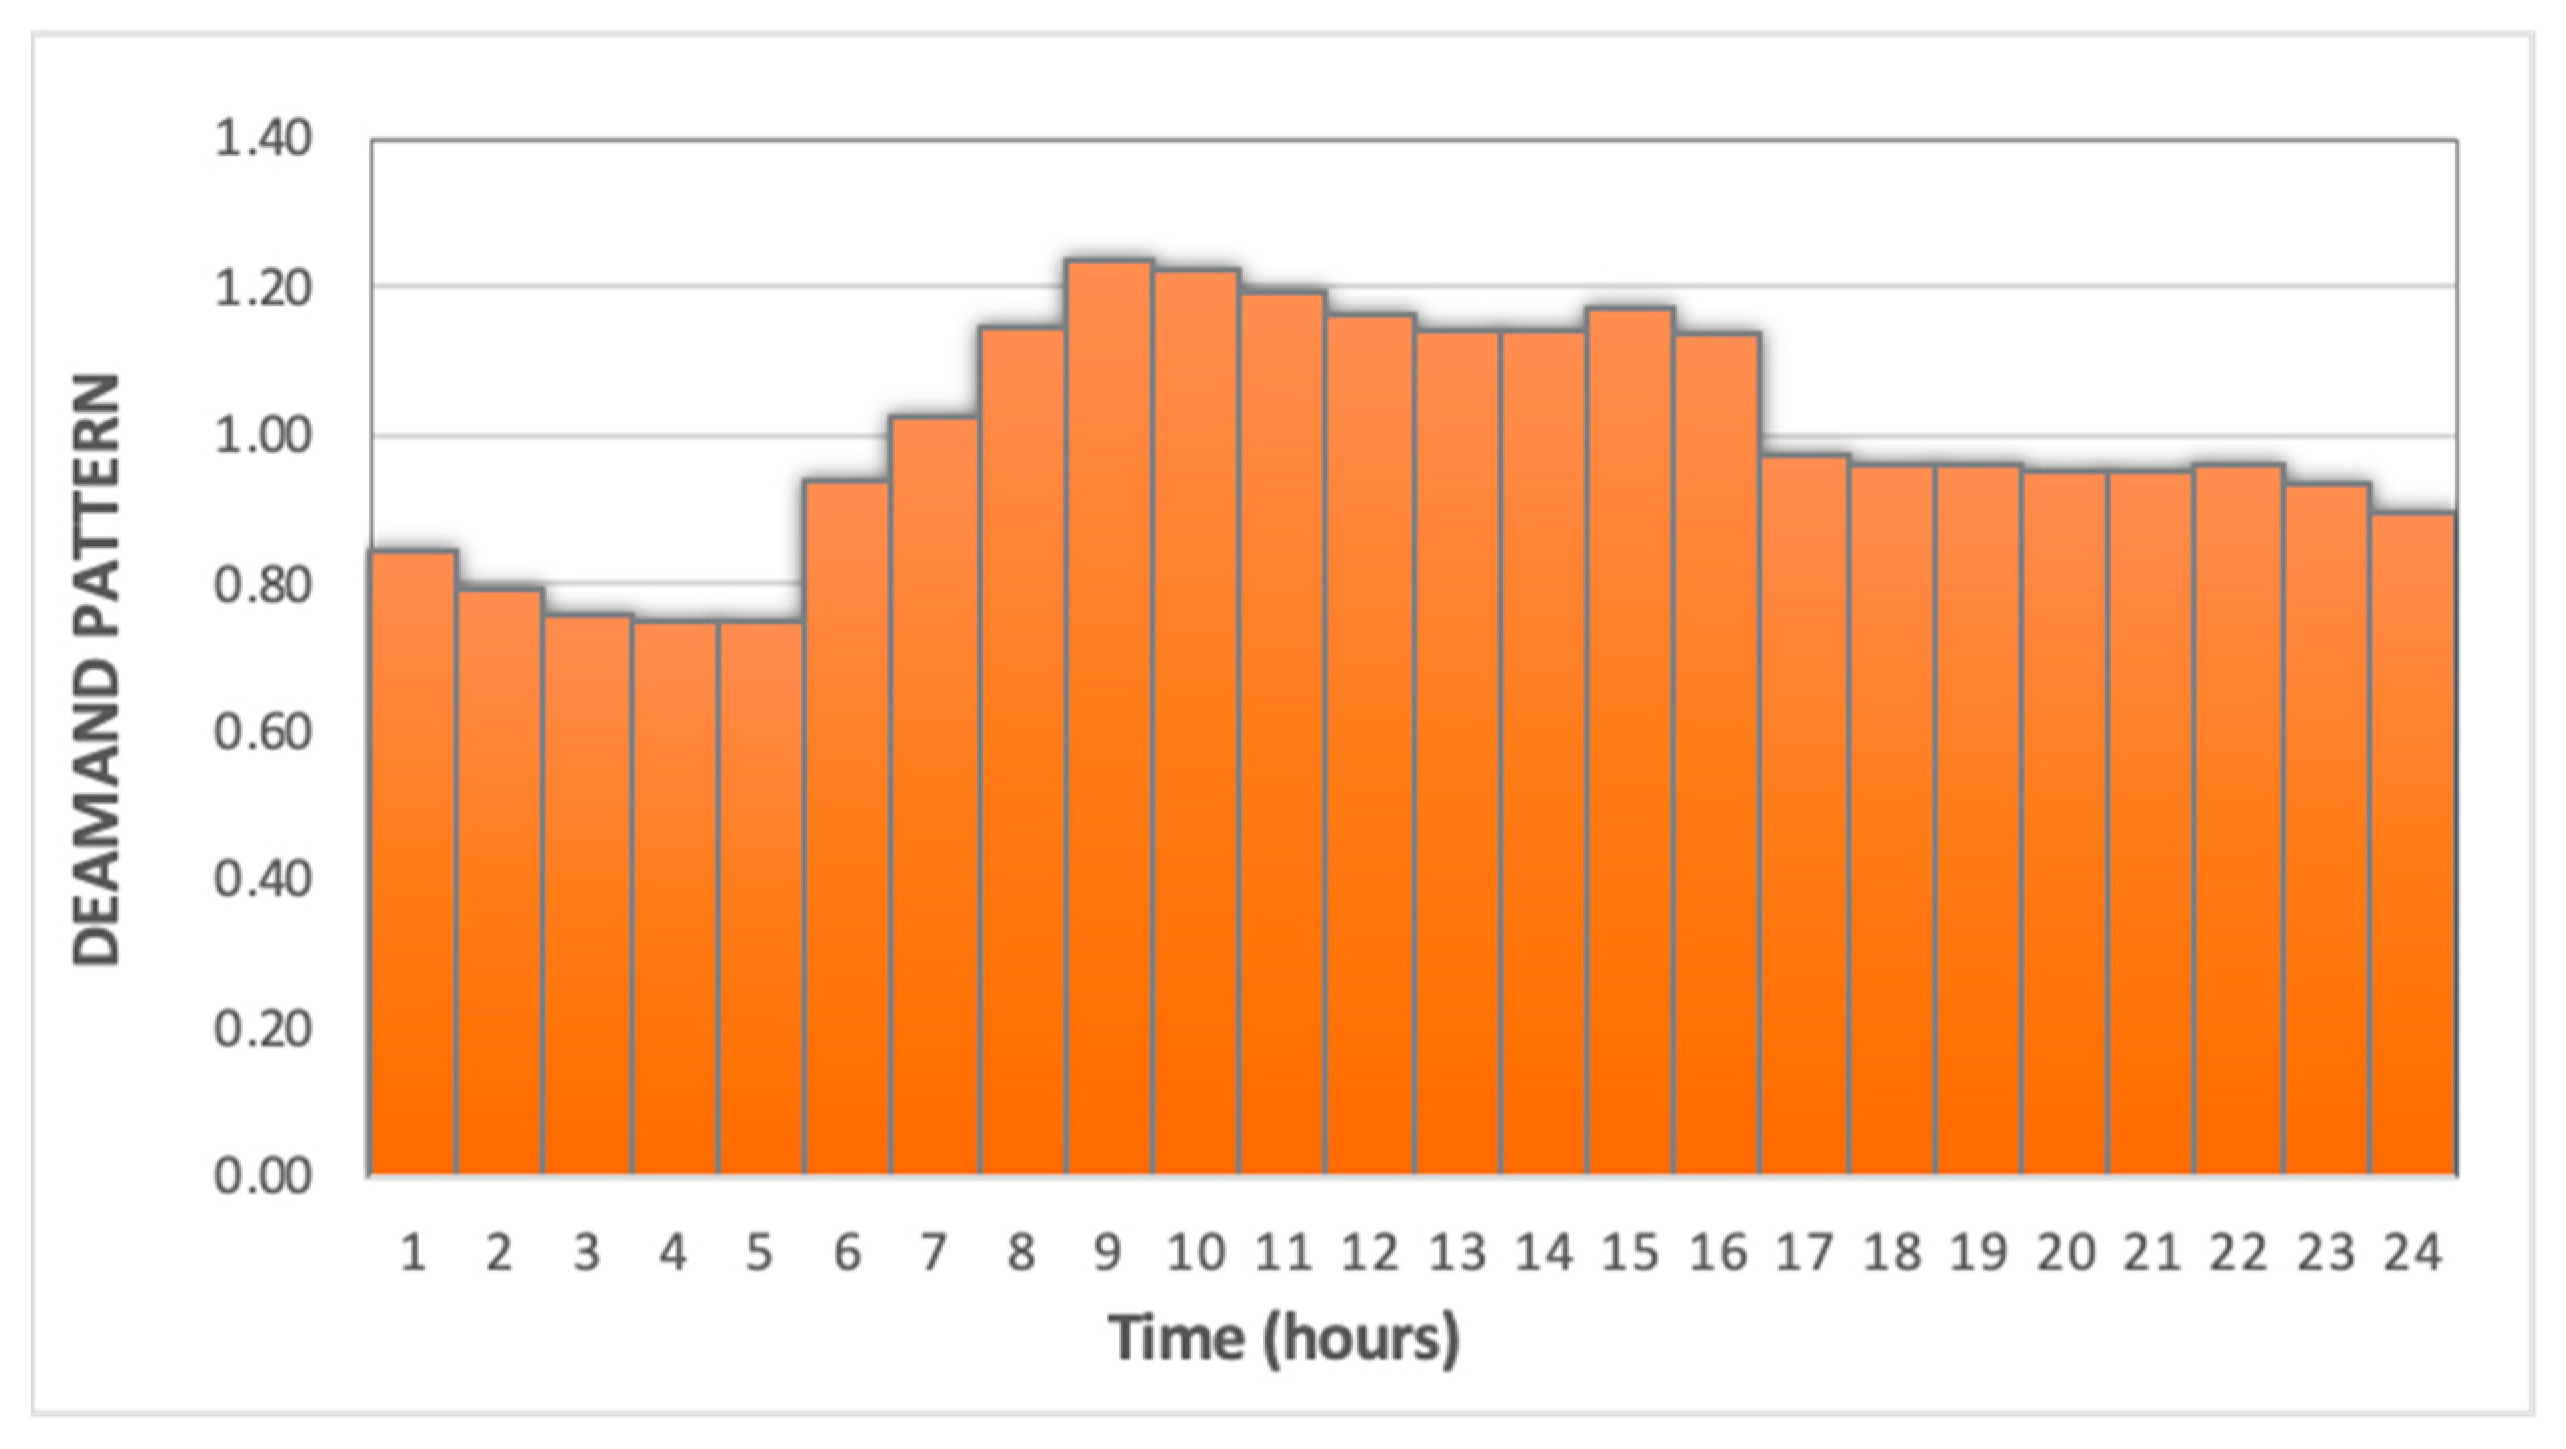
Murgia Network WDN’s topological model. The WDN is made up of a 145 km long pipeline of several materials with diameters between 60 and 600 mm. Once the construction phase of the topological model was completed, the characterization phase of the nodes and links began. The Darcy–Weisbach equation was employed for estimating head loss along pipes, adopting a roughness coefficient ranging from 0.03 for new pipes to 2.5 for the oldest one. Each node included the input elevation, base demand, and users’ consumption demand pattern (
Figure 4), where the last one is a multiplier factor to describe the users’ daily water demand. For the last two, a hypothesis was made starting from the instantaneous flow rate measured downstream the tank (
Figure 2a) and the coordinates of every user’s water meter and the individual daily water consumption for each one defined by users’ habits.
The Murgia Network WDN’s hydraulic performances were computed using EPANET code, simulating pressures and flow rates over a period of 24 h with a time step of 1 h, considering both with and without PRV valve solutions. The last layout represented the starting point for the conceptual idea of this study.
Results relevant to the without PRV scenario highlighted how the pressure pattern during the day is almost unvaried, with a minimum value for nodes nearest to the reservoir (30–50 m), whereas the remaining are characterized with a pressure between 80 and 130 m. PATs’ positions were defined solving two objective functions with the purpose of optimizing both power output potential and greater proximity with E-bikes charging stations, which were identified by the first stage and are summarized in
Table 1. The results of this second stage of analysis identified 19 optimal points for the PATs’ positioning.
Figure 5 shows a comparison between the charging stations and the PATs position. Clearly, it was not possible in all the cases to identify a PAT whose position coincides with the charging station, and this is due to the process of optimization that was carried out to maximize the production of electrical energy.
Normally, the technical literature suggests dividing the WDN into District Metered Areas (DMAs) in order to assure the necessary flow rate and pressure to every PAT. However, in this case, considering the wide spatial distribution of PATs, it was sufficient to divide some pipes immediately downstream the node where a PAT had been placed to guarantee the best hydraulic behavior. Nevertheless, it is necessary to guarantee the adequate pressure to satisfy the users’ drinking water demand.
Selected pumps are centrifugal ones operating in a range between 1.5 and 8.5 L/s of discharge and between 75.00 and 105.00 m of pressure. The overall PATs system could generate 985 kWh per day, and the energy generated by each PAT ranges from 12.8 to 115.4 kWh/day, despite having assumed a rather conservative efficiency of 0.7.
For every charging station
i,
Table 3 resumes the maximum power (
Pm) and the energy required (
Er) every day by each charging station, the total daily energy recovered by the corresponding PAT (
Ed), and the energy deficit or surplus for every plant (
Eeg). Considering that every charging station is characterized, day by day, with a variable power and a maximum power, then battery packs such as
Tesla Powerwall or a such one can be used to accumulate energy in excess during periods of lower energy demand.
The energy balance resumed in
Table 3 highlighted how the E-bike sharing of the
Murgia network can obtain 43% of its energy through using energy produced on-site or 56% by connecting several charging stations with an autonomous electricity network. The deficit required by the whole system can be recovered through the electric grid or in a
totally green way through fitting the roofs of the charging stations with photovoltaic panels.
In addition, a further charging station (TP) can be located on the outskirts of the town as a point of exchange, which would be useful for tourism purposes to allow those arriving in the city to leave the car and move with the e-bike, given the availability of water pressure and flow rate.
5. Conclusions
This study presented an innovative way to use PATs when an excess of pressure in WDN is available. It is different in that the available excess in water pressure would be destroyed by locally reducing the pressure using, for example, pressure-reducing valves. In this study, we proposed using PATs to generate energy to feed electric vehicles such as bike and/or scooters. As a contribution to the state of the art, with respect to other studies that proposed producing electric energy using a single PAT in place of a single PRV, we define a distributed system of PATs according to a bike-sharing transport system operating in urban areas. To this purpose, the paper presented a methodology that combines transport systems and hydraulic optimization approaches to define a sustainable way to design e-bike sharing systems based on the optimal use of PATs to convert excess in water pressure to electric power.
At first sight, the basic idea may appear futuristic and utopic, but the goal of this study is to highlight that a bike-sharing system for a medium-sized city can be fed, even if only partially, thanks to the water pressure in excess of a WDN, with the double benefit of using energy from renewable sources and then reducing the carbon footprint of the well-to-wheel cycle. This approach could be also used to supply energy to other kinds of vehicles than bikes (for example, e-scooters), depending on the feature of the WDN and hydraulic properties.
The results achieved in this study showed that for some stations, the balance between requested and produced energy is positive. In these cases, during periods of lower energy demand, the energy surplus can be used for charging battery packs that could be used for battery swapping or to feed the power network. However, in some stations, the energy supplied by the WDN is not sufficient to fully power them. This happens because the space–time distribution of the EVs demand does not always overlap with the availability of energy that can be drawn from the WDN.
Future developments will concern the joint design of charging stations’ locations and their sizing, according to the characteristics of the WDN, with the aim of maximizing both the EVs demand and the percentage of energy produced on-site and used to charge EVs.
Today, such an approach raises a number of questions and perplexities, which are justified by poor information about this technology costs, economic costs, and above all environmental benefits. However, the latter represent the real reason to conduct studies and research about this topic. The modest installation costs of PAT for low hydraulic flows make this proposal viable in the near future. Some problems related to the management of the plants remain to be solved when the hydraulic operating conditions vary, but above all, it must be hoped that the interest of the water management authorities to think green will increase, avoiding energy waste of this type.


