1. Introduction
FinTech is changing the world at an unprecedented speed, providing a great impetus for social progress, but it also implies unique risks. Demertzis and Merler pointed out that FinTech risks are formed by the superposition of technical risks and financial risks [
1]. Once a risk occurs, its propagation speed and destruction are unprecedented. Therefore, how to effectively prevent the risks of FinTech is undoubtedly an important research field for its sustainable development.
In addition to its own sustainable development issues, FinTech also provides strong support for environmentally sustainable development by enhancing green finance. Green finance refers to that the financial sector should regard environmental protection as an important task, take into consideration the influence on the environment in investment decision-making, emphasize ecological protection, promote socially sustainable development. For example, as the largest FinTech company in China, Ant Financial, a subsidiary of Alibaba Group, has actively participated in the United Nations’ FinTech Action Plan for Green Finance.
Kobayashi points out that FinTech includes services such as smart analytics, smart investment, payment clearing, and online credit (peer-to-peer, P2P) [
2]. Of these four branches of FinTech, the risks of online credit (P2P) are most exposed, especially in China, from more than 6000 P2P platforms to less than a hundred, resulting in heavy losses for the entrepreneurs and customers. On the other hand, it has provided costly but valuable experiments on how to prevent FinTech risks. Therefore, it is an important task for us to analyze it carefully and draw lessons from it. The most important question is, why did P2P platforms, as an emerging group of FinTech companies, encounter such risks? What are the chains and mechanism of its explosive propagation of the risks?
Based on the data of P2P platforms, this paper empirically analyzes the propagation process in their risk outbreaks. The analysis method used is the ARIMAX model, which is suitable for the time-series data. By adding enough lags of the variables and that of residuals, the sequence-independent of the regression residuals with white noise can be achieved [
3]. Therefore, for time-series data, the ARIMAX model is more effective than the general OLS one [
4].
There are three findings by the regression of ARIMAX models: First, by comparing P2P platforms with traditional commercial banks that also carry out “credit enhancement services”, we find that “credit enhancement services” is not the real cause of the large-scale risk outbreak of P2P platforms. The real cause of the risk outbreak is the fearfully uneven qualification of P2P platforms in the marketplaces. This conclusion is different from the dominant opinion that the risk outbreak of platforms is attributed to their “credit enhancement services”.
Second, it is found and confirmed that the risk outbreak of P2P is a process of spreading from the weak to strong along the “qualification chain” of platforms. This risk outbreak process along the qualification chain has been dubbed the “fuze effect” in this paper because the process is very similar to that of the fuze detonating explosives.
Third, our further study suggests that the fuze effect comes from deadweight cost caused by market competition.
According to the result of literature retrieving, there have been no studies on the fuze effect of risk outbreak and no studies on the risk mechanism of P2P platform from the perspective of the fuze effect. Hence, the findings of this paper have been confirmed.
The following analysis will prove that a large number of low-qualified enterprises entering the market will induce the fuze effect. Therefore, in FinTech or other fast-growing emerging industries, studying the mechanism and process of the fuze effect so as to effectively prevent the spreading of risks will be of great significance for their sustainable developments.
The remainder of this paper is organized as follows: In
Section 2, first the literature review, then we put forward a new risk theory-fuze effect theory. In
Section 3, we give variable definitions and their stationary analysis. In
Section 4, the regression of ARIMAX (Auto regressive integrated moving average models with external input) models, including the comparison of models with different independent variables. In
Section 5, a robustness analysis is performed. In
Section 6, the conclusions and suggestions are given, including some preliminary suggestions for both the government and the entrepreneurs.
2. Literature Review and Fuze Effect
The failures of a large number of P2P platforms have attracted the attention and studies of many scholars.
These studies can be broadly divided into three aspects. One is to study the risk assessment and factor identification in P2P marketplaces [
5,
6,
7]. For example, Yeujun Yoon et al. have found significant evidence that severe competition among platforms will increase the risky behaviors of P2P platforms by allowing riskier borrowers into the system [
8]. The second is to study how to reduce P2P risks, such as P2P lending credit risk mitigation mechanism [
9].
The third aspect mainly studies the direct cause of the risk outbreak in P2P marketplaces, that is, what factors lead to the large-scale risk outbreak? In this regard, a dominant viewpoint is to blame P2P platforms for their “credit intermediary services”, such as to promise the lender capital and interest. This view holds that the intermediary credit services are a kind of alienation [
10,
11,
12,
13]. They argue that the risks would diminish as long as P2P platforms return from “credit intermediary” to “information intermediary” [
14].
However, what this argument fails to explain is that traditional banks are exactly credit intermediaries, absorbing depositors’ money in the form of deposits based on credit guarantees. When a bank takes deposits from depositors, it will promise to repay the principal and interest on time. It is the bank’s credit intermediary that makes depositors feel safe to deposit their money in the bank. Therefore, it is often said that the credit intermediary function of commercial banks is the most basic function that can best reflect the characteristics of their activities. Then, why cannot P2P platforms, which are also loan platforms as banks, do what traditional commercial banks have been doing?
In fact, contrary to the view that P2P platform “credit intermediation” causes risk outbreaks, many scholars have the opinion that “trust is a metaphor of peer-to-peer (P2P) platforms in the sharing economy and has become an intangible cue for detecting successful P2P platform business” [
15,
16,
17,
18]. This is because only when the lender fully believes in the security of his fund will the lending behavior occur [
19,
20,
21,
22,
23]. Zhang Weiying and Ke Rongju even believe that trust is of great significance in all economic activities [
24].
Along this line of thinking, many scholars pay attention to and study the factors that affect the customer trust level in P2P platforms. Yuwei Yan et al. have found that the financial and credit status of P2P platforms is a key element for building the trust of investors and impacting their decisions [
25]. Eduard Gabriel Ceptureanu et al. argued that reputation represents public opinion assessment regarding the honesty ensured during service delivery in online transactions [
26]. Karl Taeuscher also believes that under high uncertainty, demand will be much more concentrated as consumers disproportionally choose the most reputable producers and products [
27].
Other scholars study the role of virtual collateral, and soft information in improving the trust level in P2P platforms [
28,
29,
30,
31], such as Yang X. claimed that the photos in the webpages of P2P platforms have a great impact on the trust of the fund lender [
32], and some scholars have found that the friendship network of the fund user has an important impact on the judgment of the fund lender [
33]. Recognizing credit is very important to P2P platforms; some scholars have further studied the credit evaluation methods for P2P platforms [
34,
35].
Therefore, trust is so important in economic activities, traditional commercial banks and P2P online lending platforms both have credit enhancement intermediary behaviors. However, why can commercial banks be safe and sound while P2P platforms fail? Obviously, this huge difference is not simply caused by “carrying out credit enhancement intermediary services”. In fact, one of the biggest differences between traditional commercial banks and P2P platforms is that traditional banks are highly regulated and have a high threshold for entry. China has adopted regulations such as the “financial license” and the commercial banking law, which set a high threshold for banks: the minimum registered capital of national commercial banks is 1 billion yuan. The registered capital of private banks is between 2 billion yuan and 4 billion yuan, and the minimum requirement for urban commercial banks is at least 100 million yuan.
On the other hand, the entry threshold for P2P platforms is very low. According to Wangdaizhijia, the registered capital of some P2P platforms is only ¥30,000! It is the real source of risk and the biggest difference between P2P platforms and traditional commercial banks that there are a large number of poorly qualified platforms in the P2P industry!
In fact, the statistical result of this paper will show that the massive risk outbreak of P2P platforms did not start from the credit enhancement service, but along the sequence of platform’s qualification from low to high, namely the “qualification chain”. Generally speaking, the platforms with lower qualification come failure first, which damage the image of market stability, leading to the customer’s herd behavior of excessive self-protection (reducing investment, withdrawals). In this situation, the deadweight cost of P2P platforms will rise (such as a significant rise in interest rates to attract investors, P2P platforms undertake the risk of borrower default by promising lenders principal and interest, etc.) significantly, which worsens the business environment of the P2P platforms further, causing another round of risk outbreak of the better-qualified platforms. In this way, the initial risk outbreak of the worst qualified platforms gradually spread to that of the better-qualified enterprise, forming a chain of risk outbreak process along with the qualification level from low to high, thus endangering the whole P2P marketplace.
This process of risk outbreak along the enterprise qualification chain is named as “fuze effect” in this paper because the process is very similar to a fuze detonating an explosive: the fuze is easy to explode but only does little damage, and an explosive does much but does not explode easily. It is only when the fuze is detonated first and then causes the explosive to explode that the combination becomes very destructive. Low-qualification enterprise is like fuze, prone to crisis, but less destructive. A highly qualified enterprise is like an explosive, it is not easy to suffer a crisis, but if it does, it will cause devastating damage to the industry. Therefore, the process that most easily causes the crisis of the whole industry is: the low-qualified enterprises suffer crisis first, and then transfer the risk to the high-qualified enterprises, thus forming the crisis of the whole industry.
The theory of deadweight cost in a competitive market [
36] is the theoretical economic basis of the fuze effect put forward in this paper. This theory suggests that when competition occurs among many similar individuals, it often only results in the cost of the competition being paid for in vain, making things that should not cost anything become available only at a huge cost. It’s just like watching a movie in the open air in a square at night (In the 1960s, open-air movies were often shown on threshing floors in rural China on weekend nights, the main entertainment for Chinese farmers at the time): at first, everyone sits and watches the movie easily, but in the absence of staff to maintain order, someone may stand up “to get a better view”, having the sight blocked by the man, others must stand up also to watch the movie. The result of this “competition in watching the movie” turns a movie that everyone could have watched easily from a sitting position into one that everyone must stand up to painfully getting the same thing, i.e., everyone must pay the price of competition in vain! The cost is the deadweight cost of competition.
With severe competition, the deadweight cost in the P2P marketplace will rise rapidly, which is an important factor to cause the fuze effect in the process of risk outbreak.
3. Variable Definitions and the Stationary Processing of Data
3.1. The Preliminary Processing of Data
We collected more than 197,000 pieces of data from 5068 P2P platforms, as well as data of the Shanghai Composite Index, bank interest rates and inter-bank lending rates since June 2013. Then, all kinds of original data are processed to form monthly time-series data.
Due to the statistical analysis of the P2P platform risk outbreak situation, the effective time span of the data is from June 2013 to November 2019, a total of 78 months. This is because the dependent variable of the regression model is the ratio between the average size of the platforms in normal operation and that of the failed platforms, in which the average size of the failed platforms appears as the denominator, so it cannot be 0. On the other hand, it was only since May 2013 that P2P platforms in China began to fail continuously; that is, a certain number of failed platforms went offline every month. Therefore, in order to ensure the continuity of the dependent variable in the time-series, the starting point of the time-series data are June 2013 (a month is lost due to difference).
The data of explanatory variables and dependent variable are collected from third party information platforms, Wangdaizhijia (
www.wdzj.com) and Wangdaitianyan (
https://www.p2peye.com/).they are the most widely known third party information platforms in China, almost every study on P2P platforms in China must download data from them.
The P2P platforms are divided into three types according to their status in the current month. The first type is the normal platforms that are in service. The second type is the failed platforms that have failed due to various problems, such as under investigation by the police, their website closed, etc. The third type is new platforms that are online to deliver service for the first time in the current month.
In order to avoid endogeneity in regression, the boundaries between the normal platforms and the failed platforms and the new platforms are clear and do not intersect in the calculation of data. In other words, for the current month, a platform either belongs to the normal platform, or belongs to the failed platform, or belongs to the new platform.
The control variables are collected from the official website of the People’s Bank of China and the Tongdaxin Stock Trading System connected with the Shanghai Stock Exchange.
3.2. Definition and Meaning of Variables
3.2.1. Ratio as the Dependent Variable
The dependent variable in the model is a ratio, which is the ratio of the average size of the normal platforms in each month to the average size of the failed platforms in the same month. The size of a platform is represented by its registered capital, and the more registered capital, the larger the size. To some extent, size is an indicator of platform qualification. Generally speaking, large-size platforms will have higher qualifications. Therefore, the ratio actually represents the “multiple” of the average qualification of normal P2P platforms compared with that of failed platforms in the same month.
The value of the ratio is about 6 when the risk outbreak of P2P platforms just occurred (June 2013), which means that the average size of the normal platforms is much larger than that of the failed platforms, indicating that the failed platforms are mostly small ones. With the continuous failure of the platforms, the ratio gradually approaches 1, indicating that the size of the subsequently failed platforms gradually becomes larger and closer to that of the normal platforms.
This is exactly the phenomenon that small P2P platforms fail first and then lead to the failure of large ones. In other words, low-qualified platforms fail first and then gradually lead to the failure of high-qualified ones, forming the order of failure from low to high along with the “qualification chain”. This is evidence of the fuze effect in the risk outbreak process of P2P platforms. In this paper, the ratio is designed to statistically prove the existence of the fuze effect.
3.2.2. Explanatory Variable Acprob
The explanatory variable acprob is defined as the number of failed platforms accumulated monthly. The accumulation and increase of the number of failed platforms may be the cause for the size expansion of the failed platforms, which is why we design the explanatory variable acprob. In order to prevent the endogenesis, acprob only includes the number of failed platforms accumulated from T = 0 (that is, May 2013) to the month preceding the current month, that is, not including the number of failed platforms in the current month. In this way, the ratio will be prevented from affecting the explanatory variable acprob and resulting in endogenesis.
3.2.3. Control Variable New
The control variable new is defined as the average size of the newly launched platforms during the current month. The setting of this control variable comes from the considering: what if the size expanding of the failed platforms is caused not by the increase in the number of failed platforms, but simply by the increasing size of the new platforms?
Therefore, as the average size of the newly launched platforms, new can be used to observe whether acprob, the variable for the accumulation of the failed platforms, becomes no longer significant after joining of the control variable new. If so, it means that the size expanding of the failed platforms is not caused by the accumulation of the failed platforms, which will negate the fuze effect put forward in this paper. Therefore, the new control variable is mainly used to ensure the rigor of the analysis.
3.2.4. Control Variable Bank
The control variable bank is defined as the one-year deposit interest rate stipulated by the People’s Bank of China. Its data come from the official website of the People’s Bank of China. As it is monthly data, if the interest rate is adjusted in a month, the adjusted interest rate will prevail in the next month. The reason for setting this variable is that the investment behavior may be affected by the interest rate of bank deposits. It is generally believed that the lower the interest rate of bank deposits, the higher the enthusiasm to invest in P2P platforms.
3.2.5. Control Variable Stock
The controlling variable
stock is the percentage of monthly rise and fall of The Shanghai Stock Index. Studies have suggested that there are two spillover linkage mechanisms between the P2P lending market and the stock market, namely, substitution effect mechanism and complementary effect mechanism [
37]. Many scholars believe that the risk outbreak of a large number of P2P platforms is greatly related to the huge fluctuations of the stock market. The risk outbreak of online lending is mainly caused by the transmission of stock market risks to the online lending industry. Investors often shift funds from online lending platforms to stock markets for adding positions, and the large-scale withdrawal of funds leads to the rupture of the platform’s capital chain [
38]. Therefore, the stock markets are likely to affect the P2P platforms.
3.2.6. Control Variable 7-Day Interbank Offered Rate Inbank7
The control variable inbank7 refers to the average 7-day interbank offered rate among banks on a monthly basis. The data are from the official website of the People’s Bank of China. The level of the interest rate reflects the liquidity in the market. If it is tight, the interest rate will be high, and vice versa. Obviously, the liquidity of the financial market has an important impact on the P2P platforms.
The above variable definitions are all for the original variable data. The reason why they are called original variable data is that these variable data are all time-series data, which are basically nonstationary data and do not meet the requirements of reliable regression. Therefore, they cannot be directly used for regression.
3.2.7. Control Variable Pol
The dummy control variable pol is used to reflect the impact of the policy changes made by the government on the risks of P2P platforms. On March 28, 2018, the Leading Group for the Special Remediation of Internet Financial Risks issued the Notice on Strengthening the Remediation of Asset Management Business through the Internet and Conducting the Acceptance Work. This policy will not only change the operating environment of P2P platform enterprises but also change the public’s perception of the risks of P2P network loans. For the time before March 2018, the value of pol is 0, and since April 2018, the value of pol is 1.
3.2.8. Control Variable Norm
The control variable norm, which is the number of normal platforms in each month, is used to examine the impact of the existing platforms on the ratio.
3.3. The Examination of the Stationarity of the Original Variable Data and Their Processing
Because the original time-series data are usually nonstationary, the randomness assumption of samples required by regression analysis is destroyed, and the central limit theorem (CLT) and law of large numbers (LLN) become invalid, so they cannot be directly used for statistical regression. Therefore, the original data of variables need to be examined for stationarity; they need processing if not stationary.
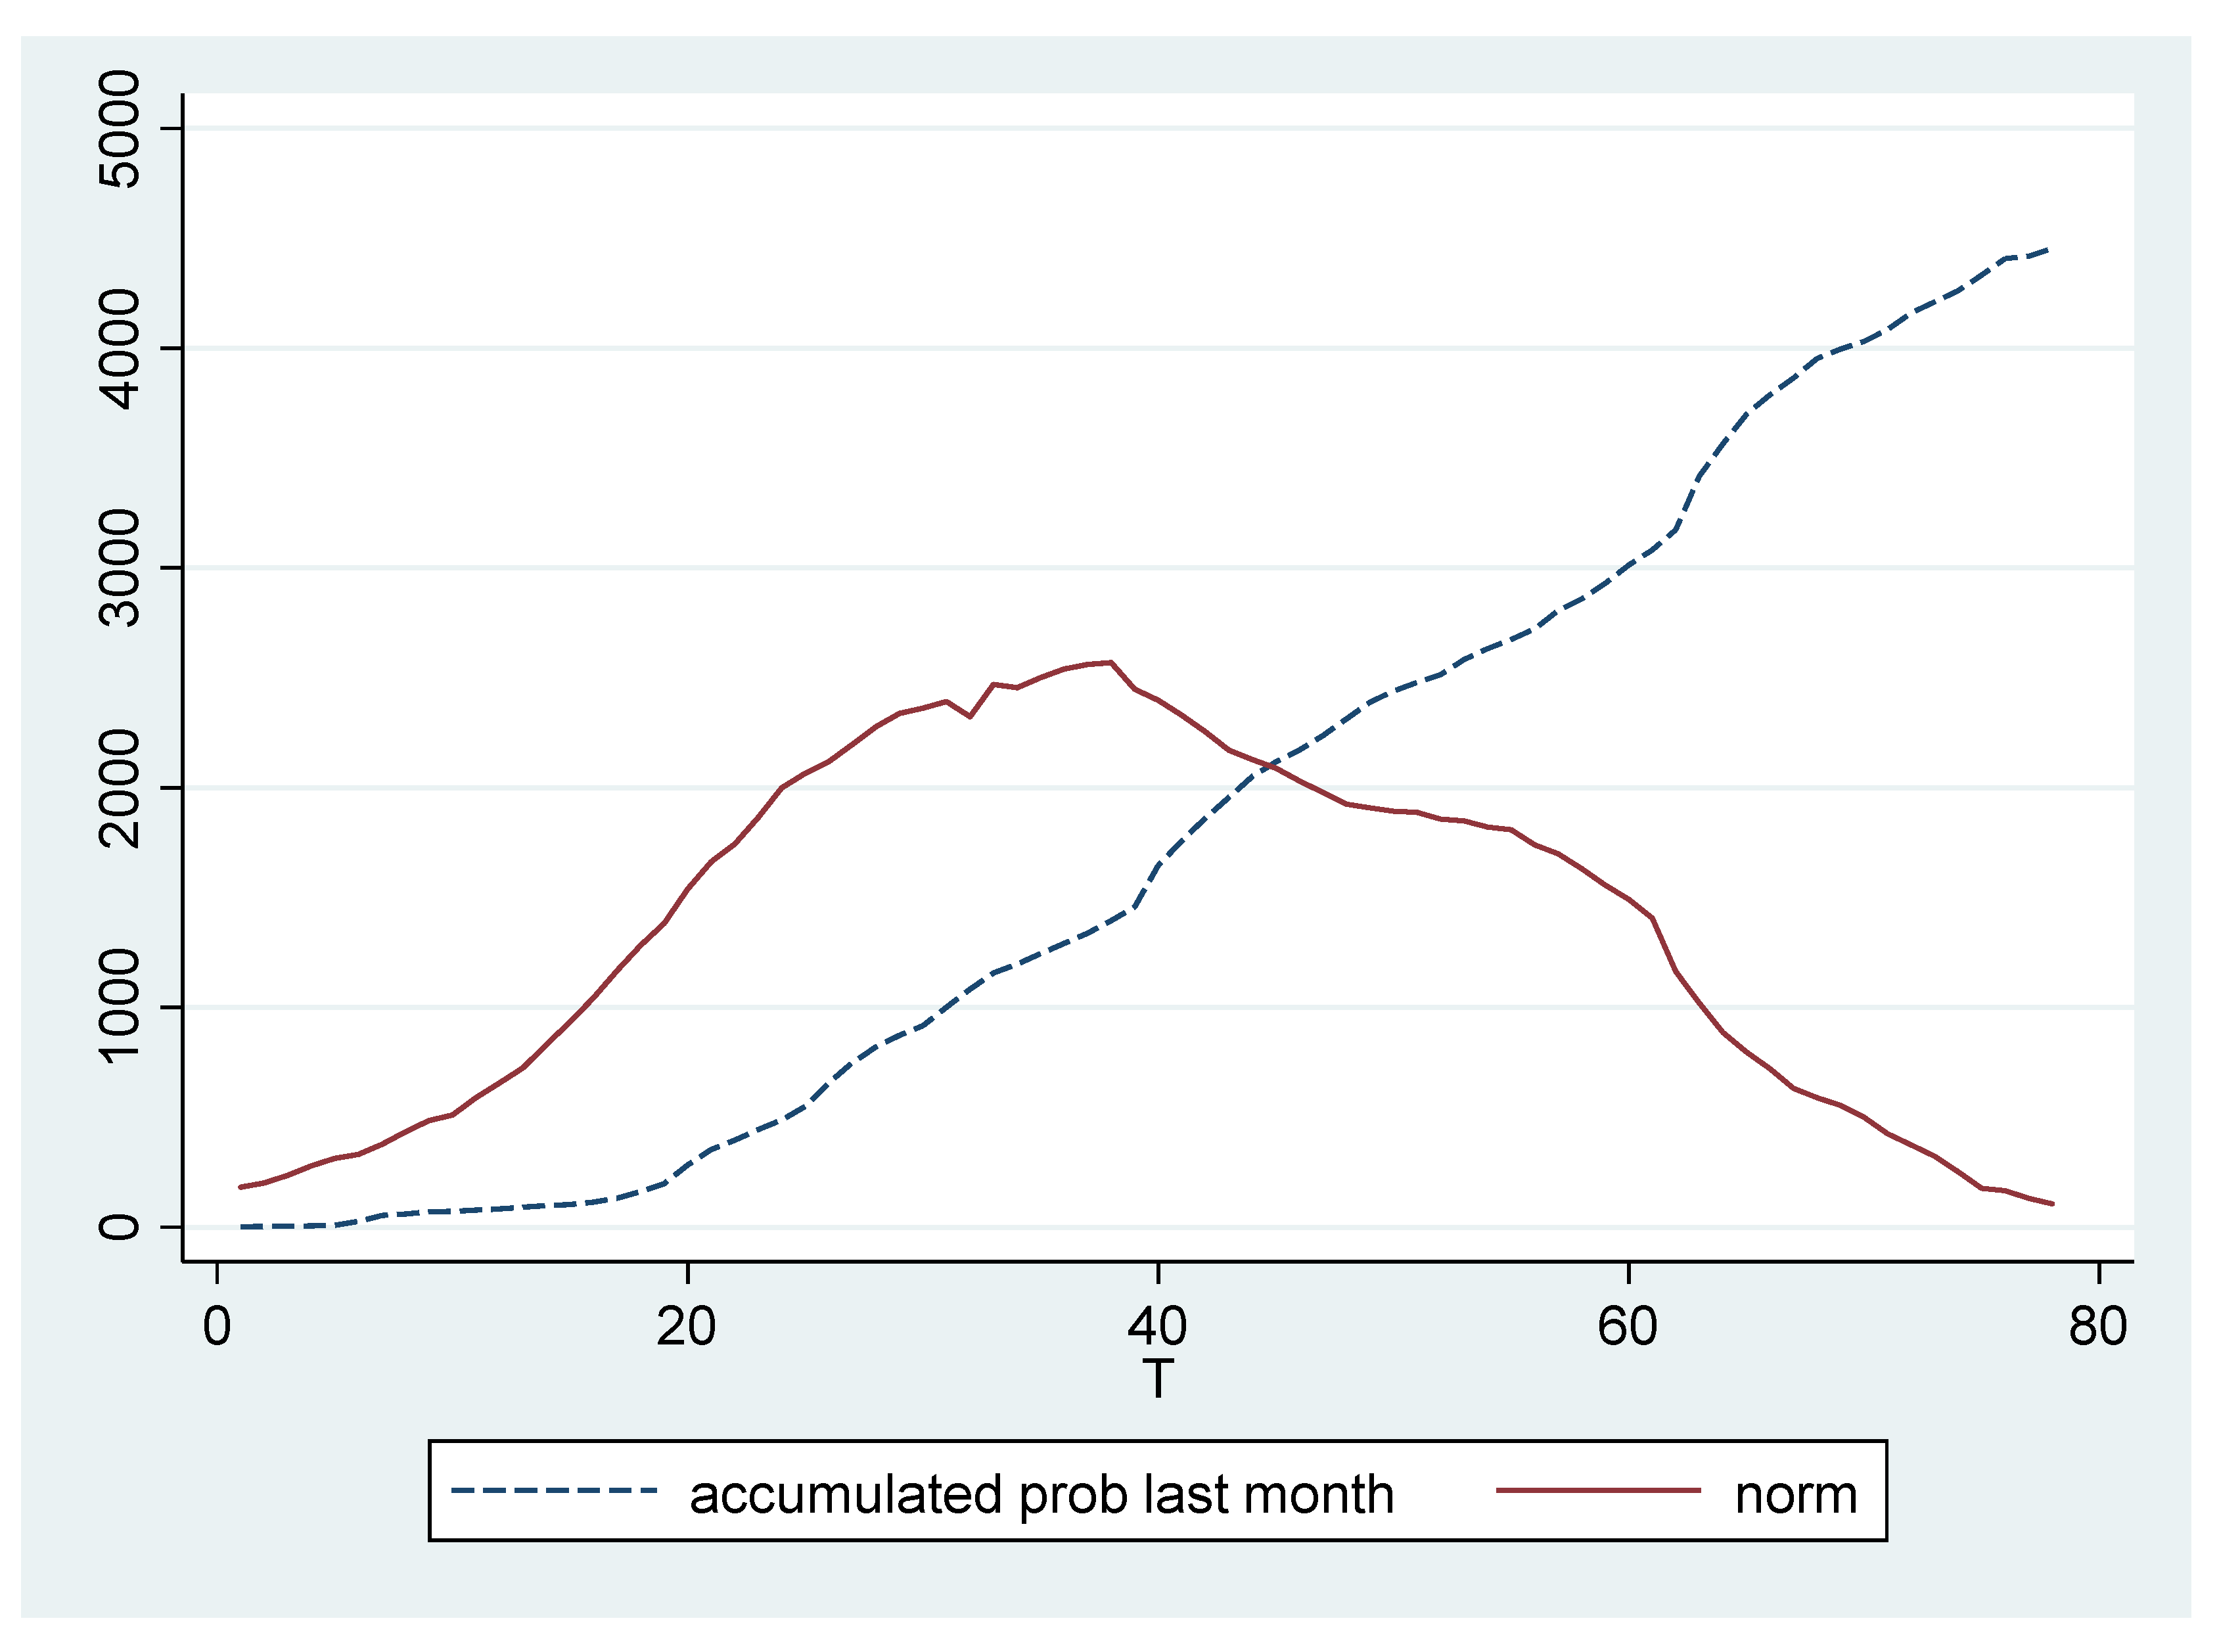
In
Figure 1, the dotted line is
acprob, while the solid line is the norm, which is the number of platforms still in normal operation every month. It is important to note that the monthly number of normal platform
norm is affected by the new platforms and the failed platforms in the same month: in the early days, more new platform increase and fewer failed platforms disappear, resulting in the
norm gradually become bigger in later days, less new platforms increase, and more failed platforms disappear, leading to
norm gradually become smaller.
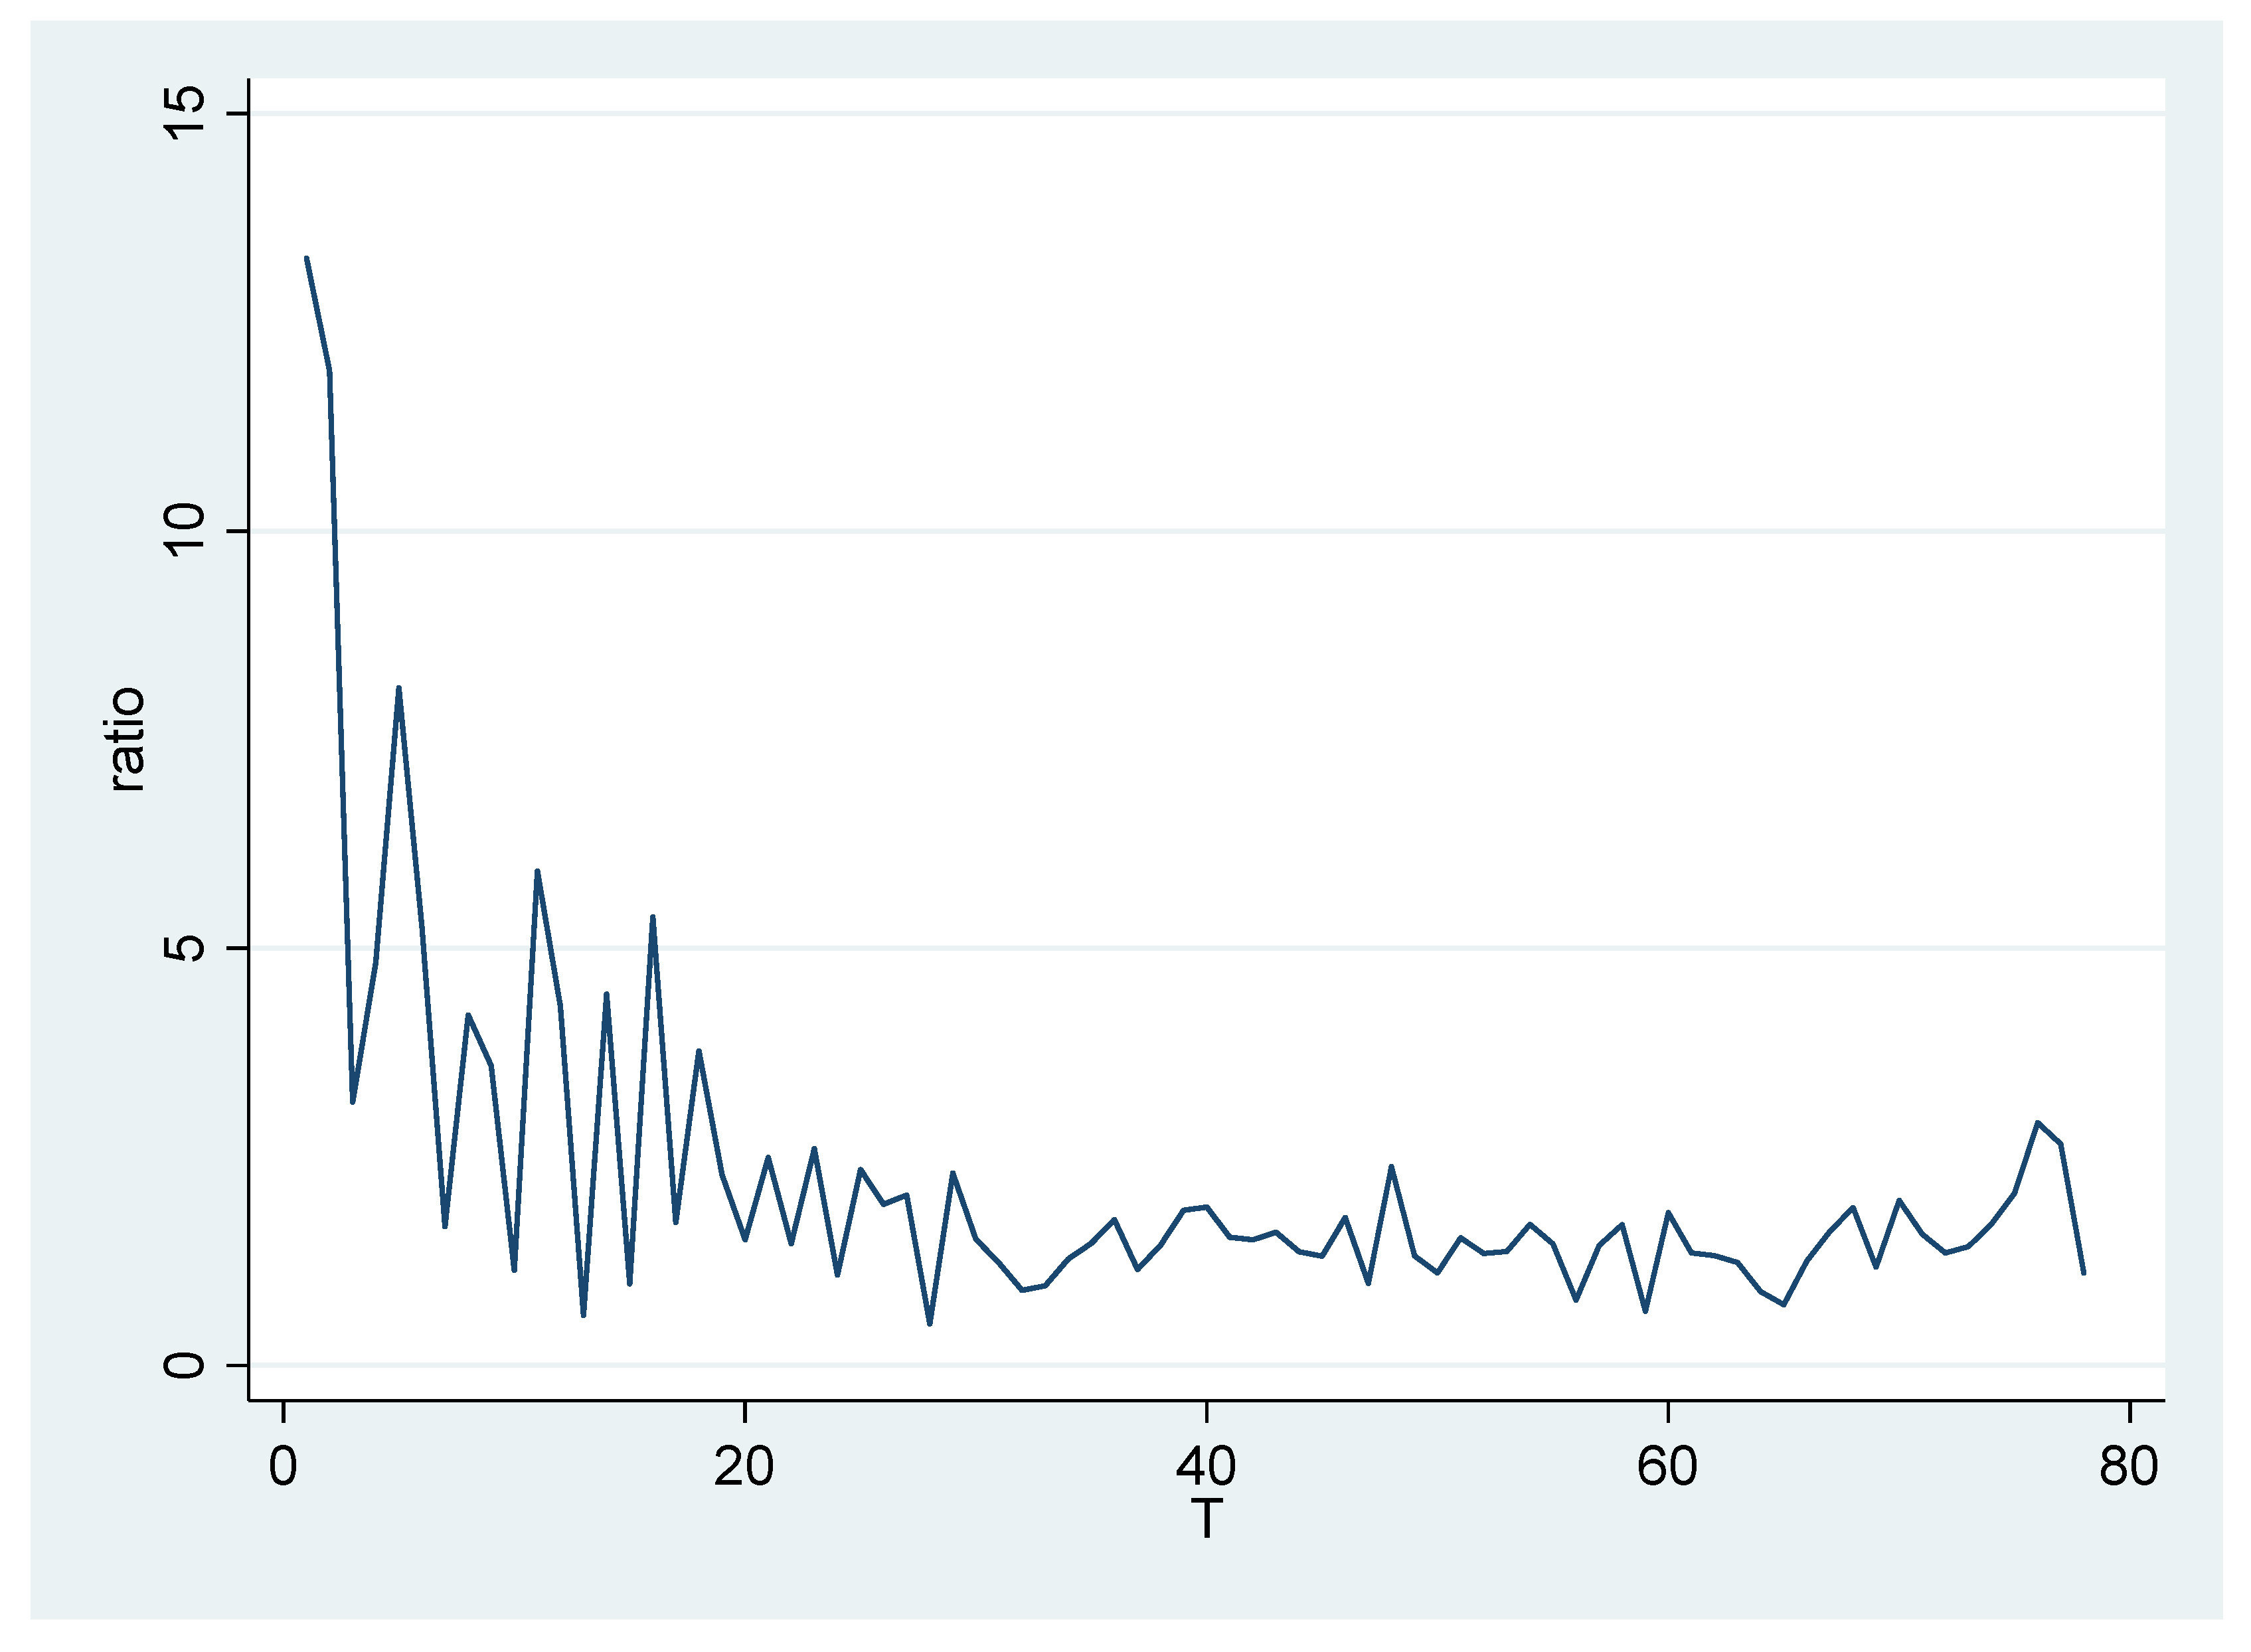
3.3.1. Ratio and Dlnratio
First, we examine the stationarity of the original data of the ratio. If it is not, it will be stabilized by the difference method.
Figure 2 shows that
the ratio has a certain time trend.
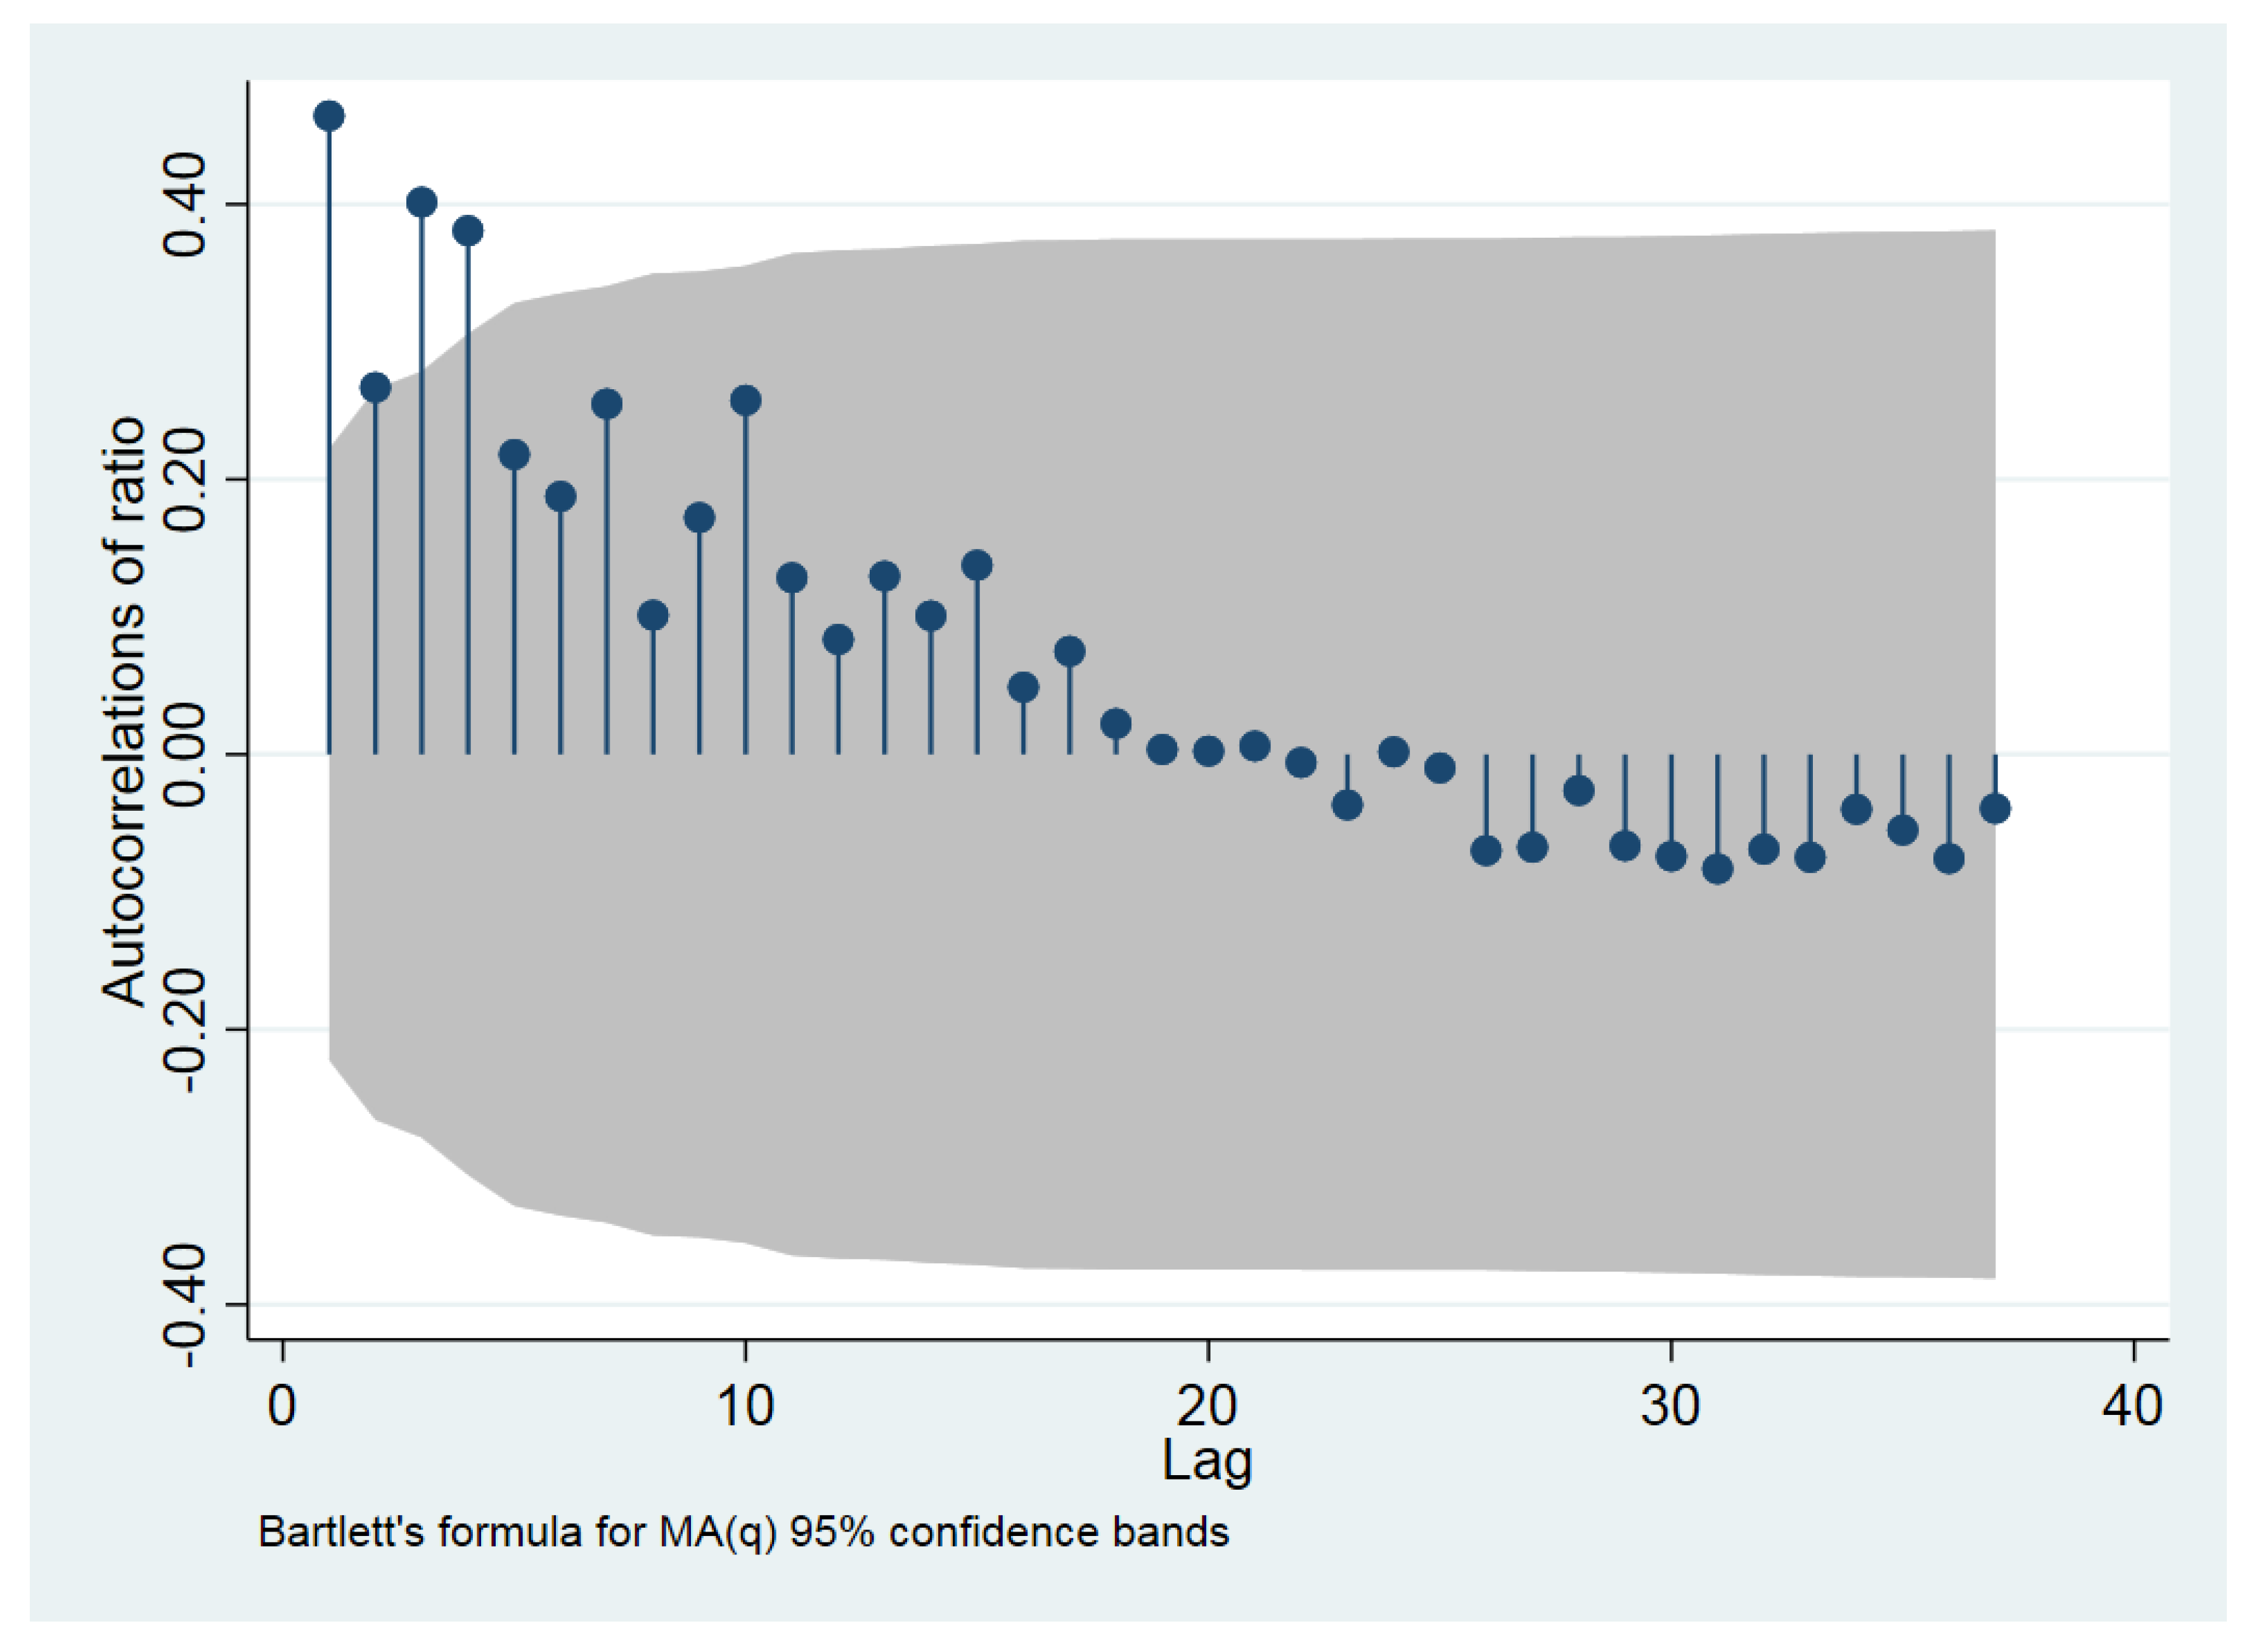
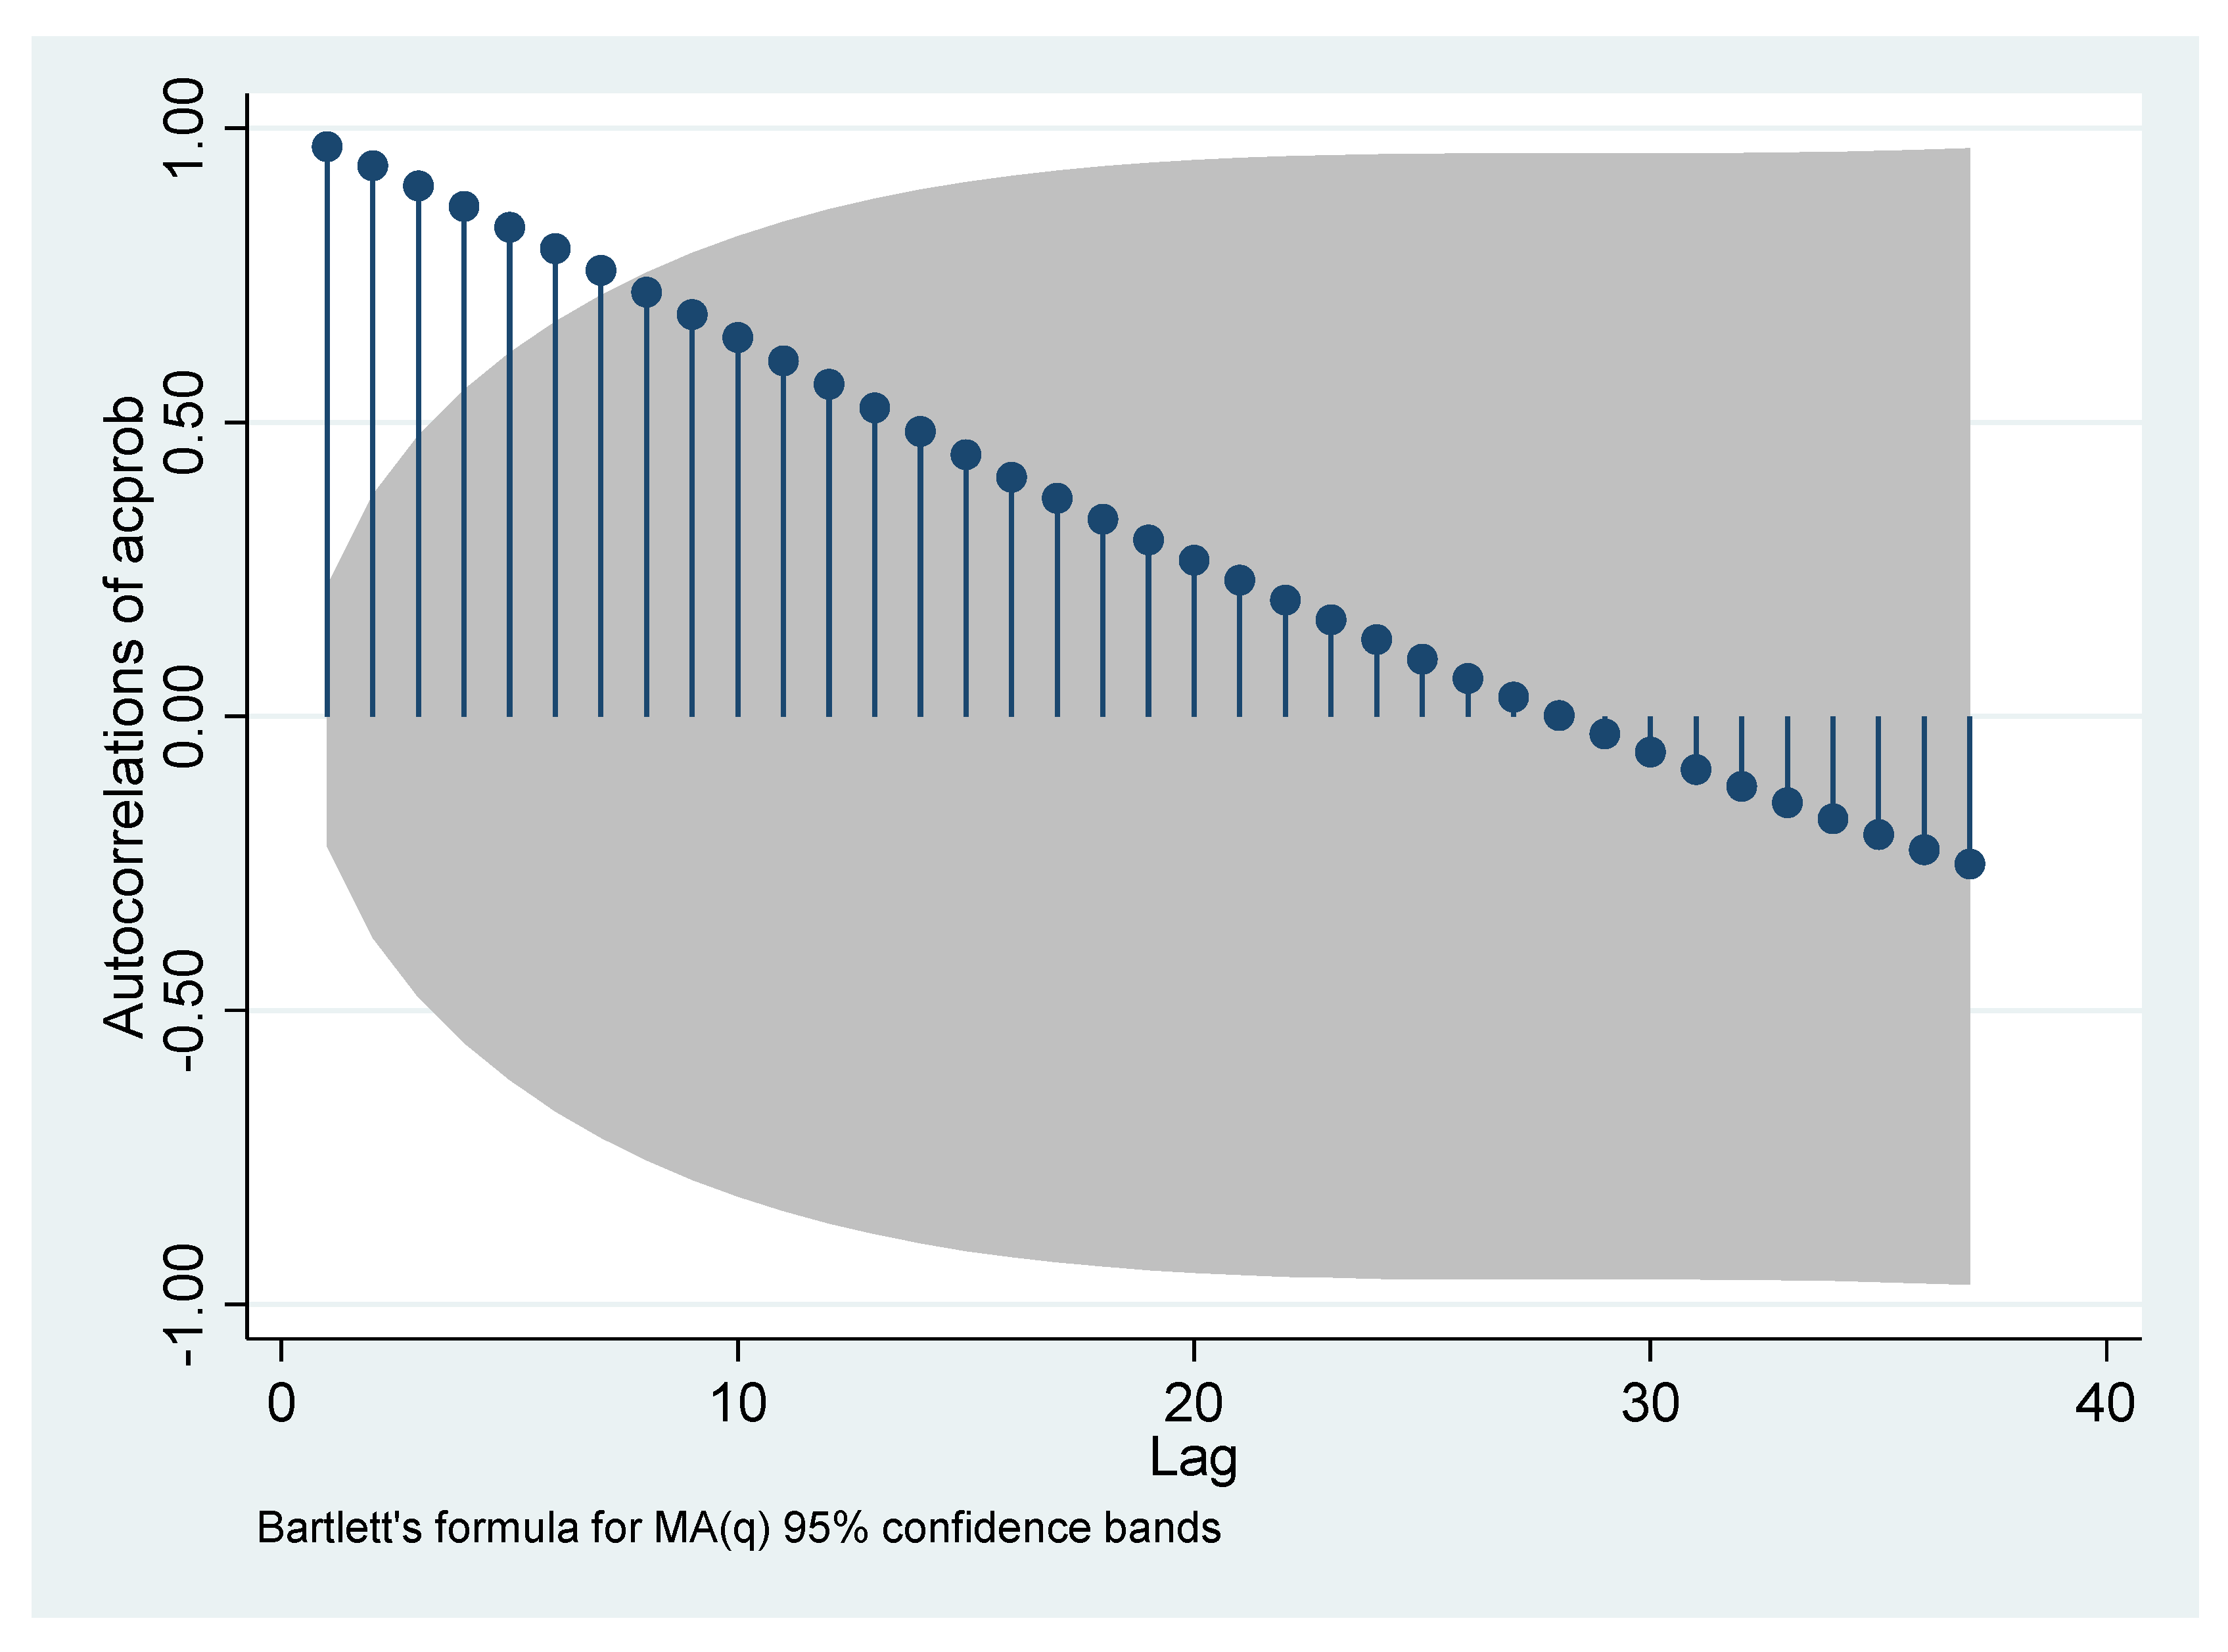
The autocorrelation graph (
Figure 3.) of the ratio has a 4-order truncation, and the autocorrelation of order 1, order 3 and order 4 is stronger. The length of the vertical lines in the autocorrelation graph represents the level of the autocorrelation of the corresponding MA lag order. If the top of the vertical line extends beyond the shaded area of the figure, the autocorrelation of the lag order represented by the vertical line is obvious. For example, in
Figure 2, the first vertical line on the left indicates that the first-order lag of MA is highly autocorrelated, and therefore, the MA(1) must be included in the ARIMAX model.
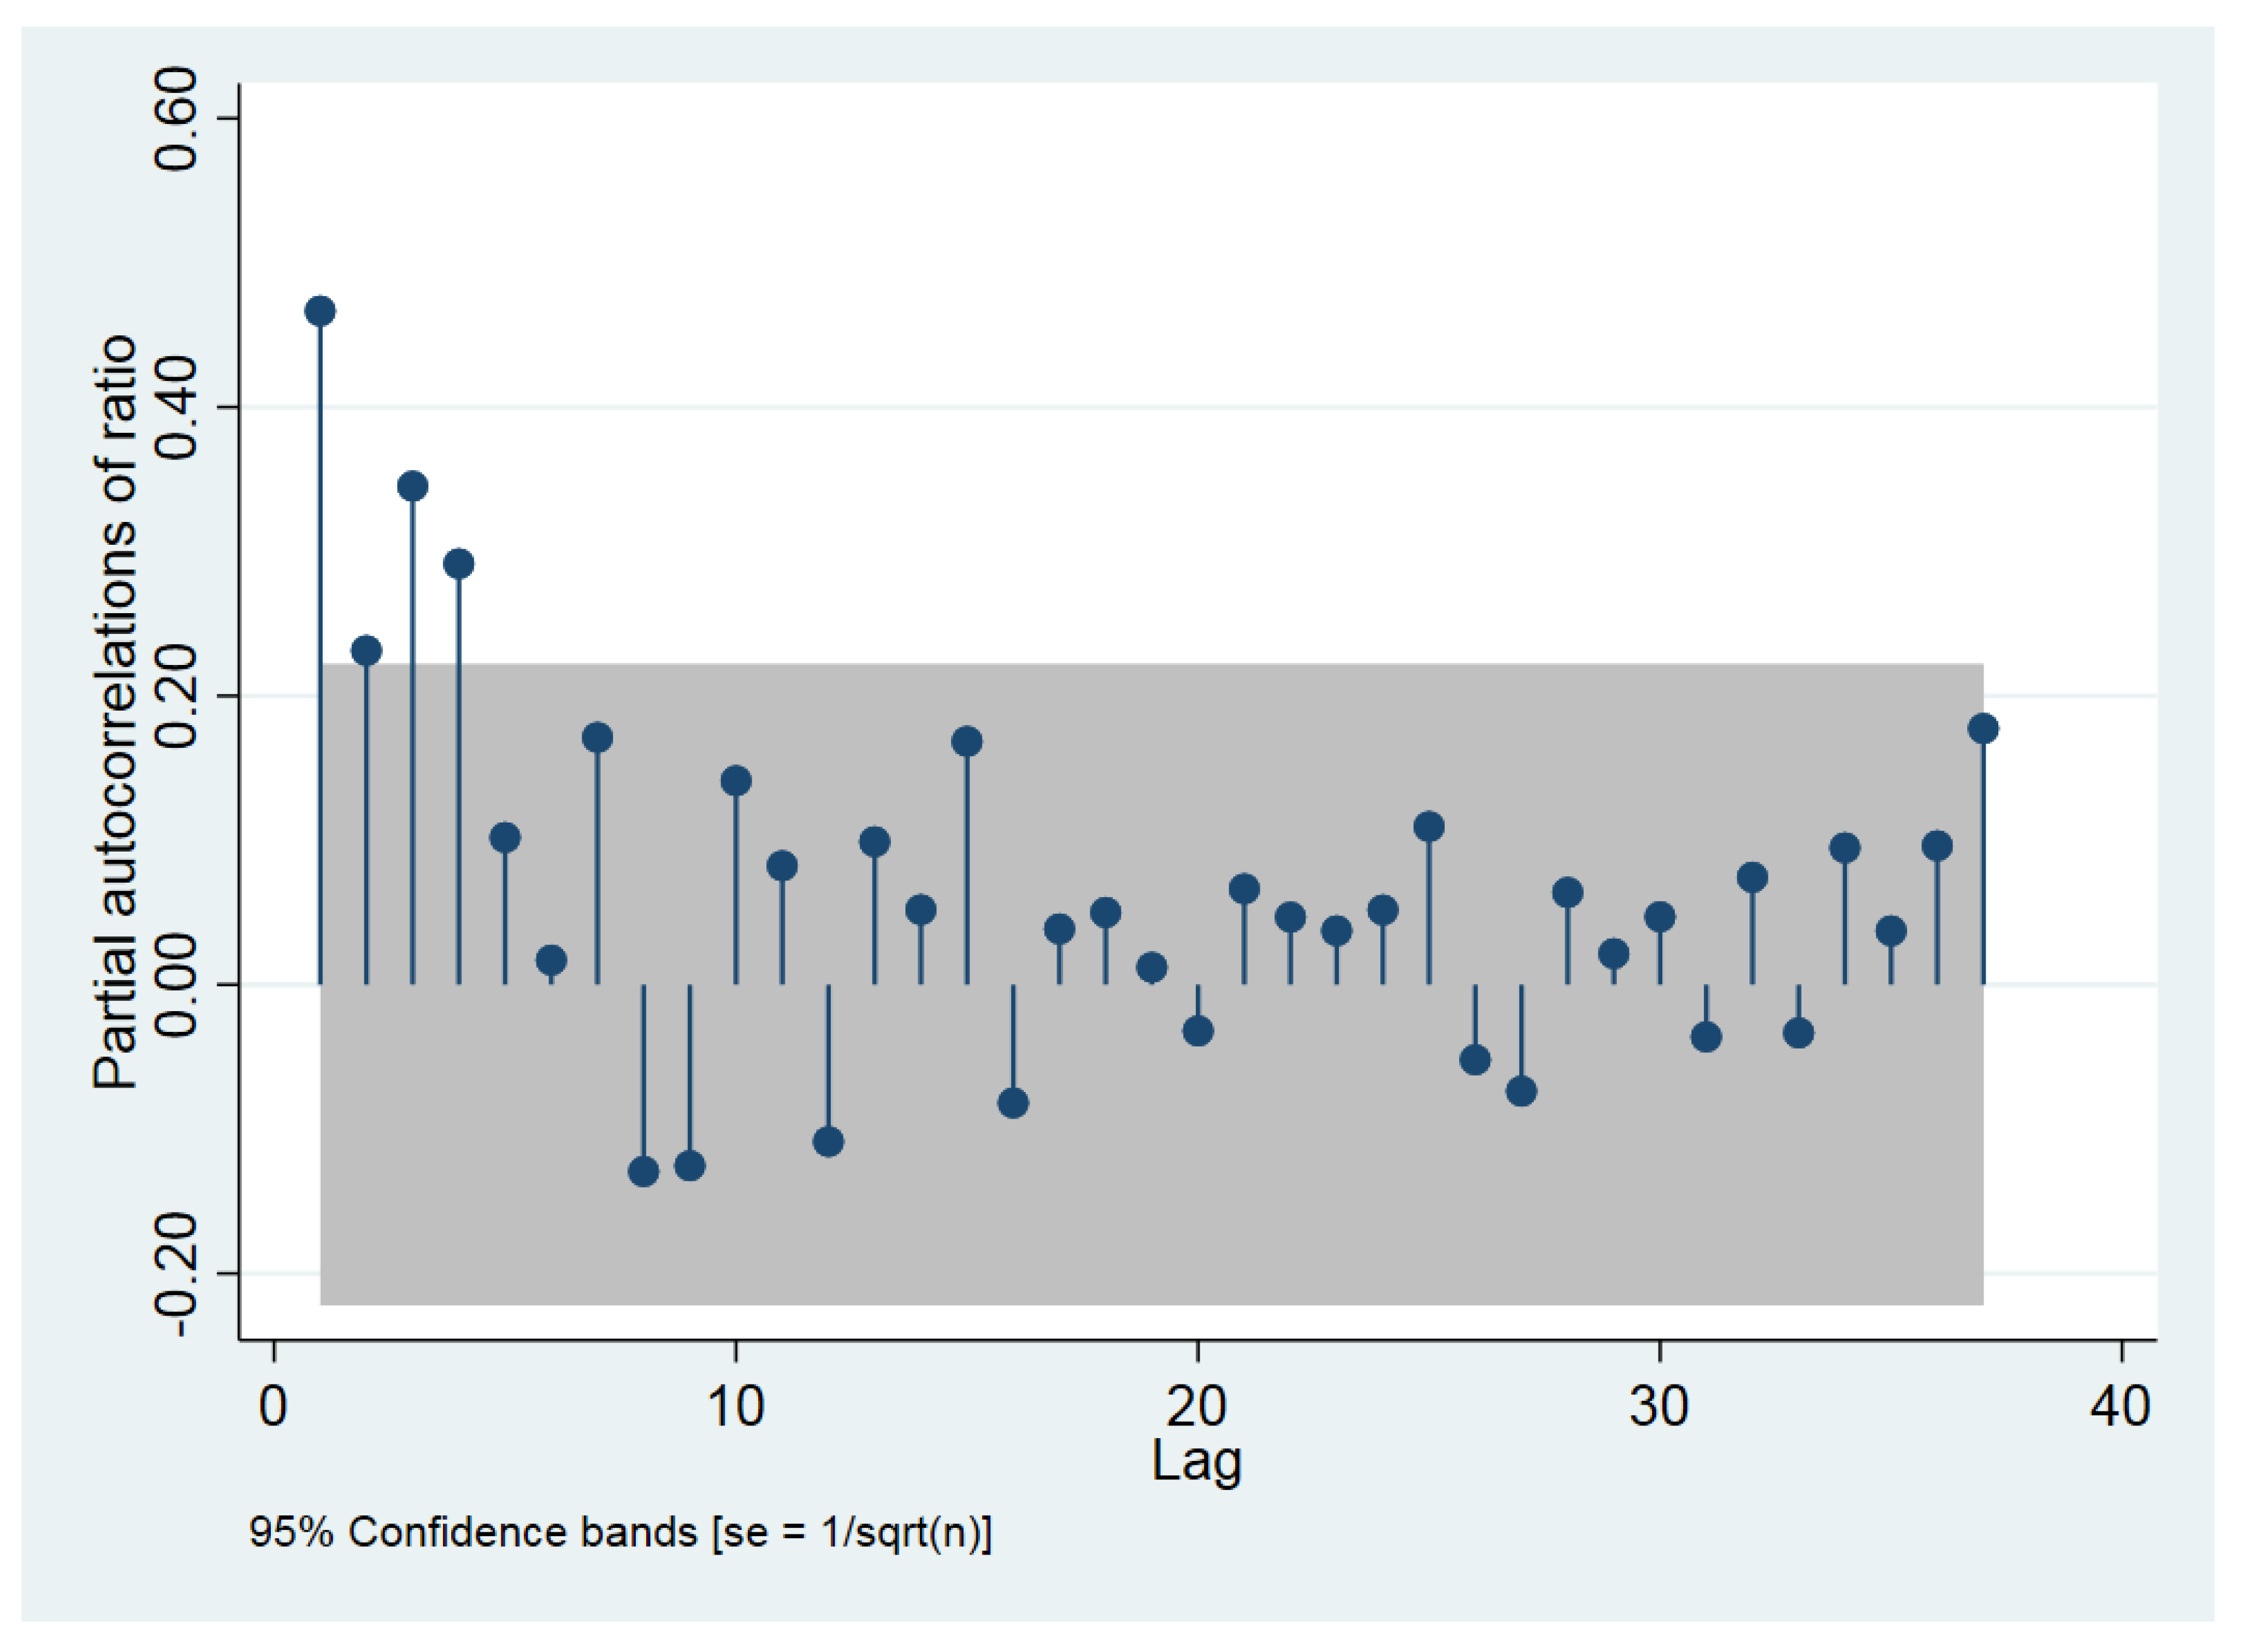
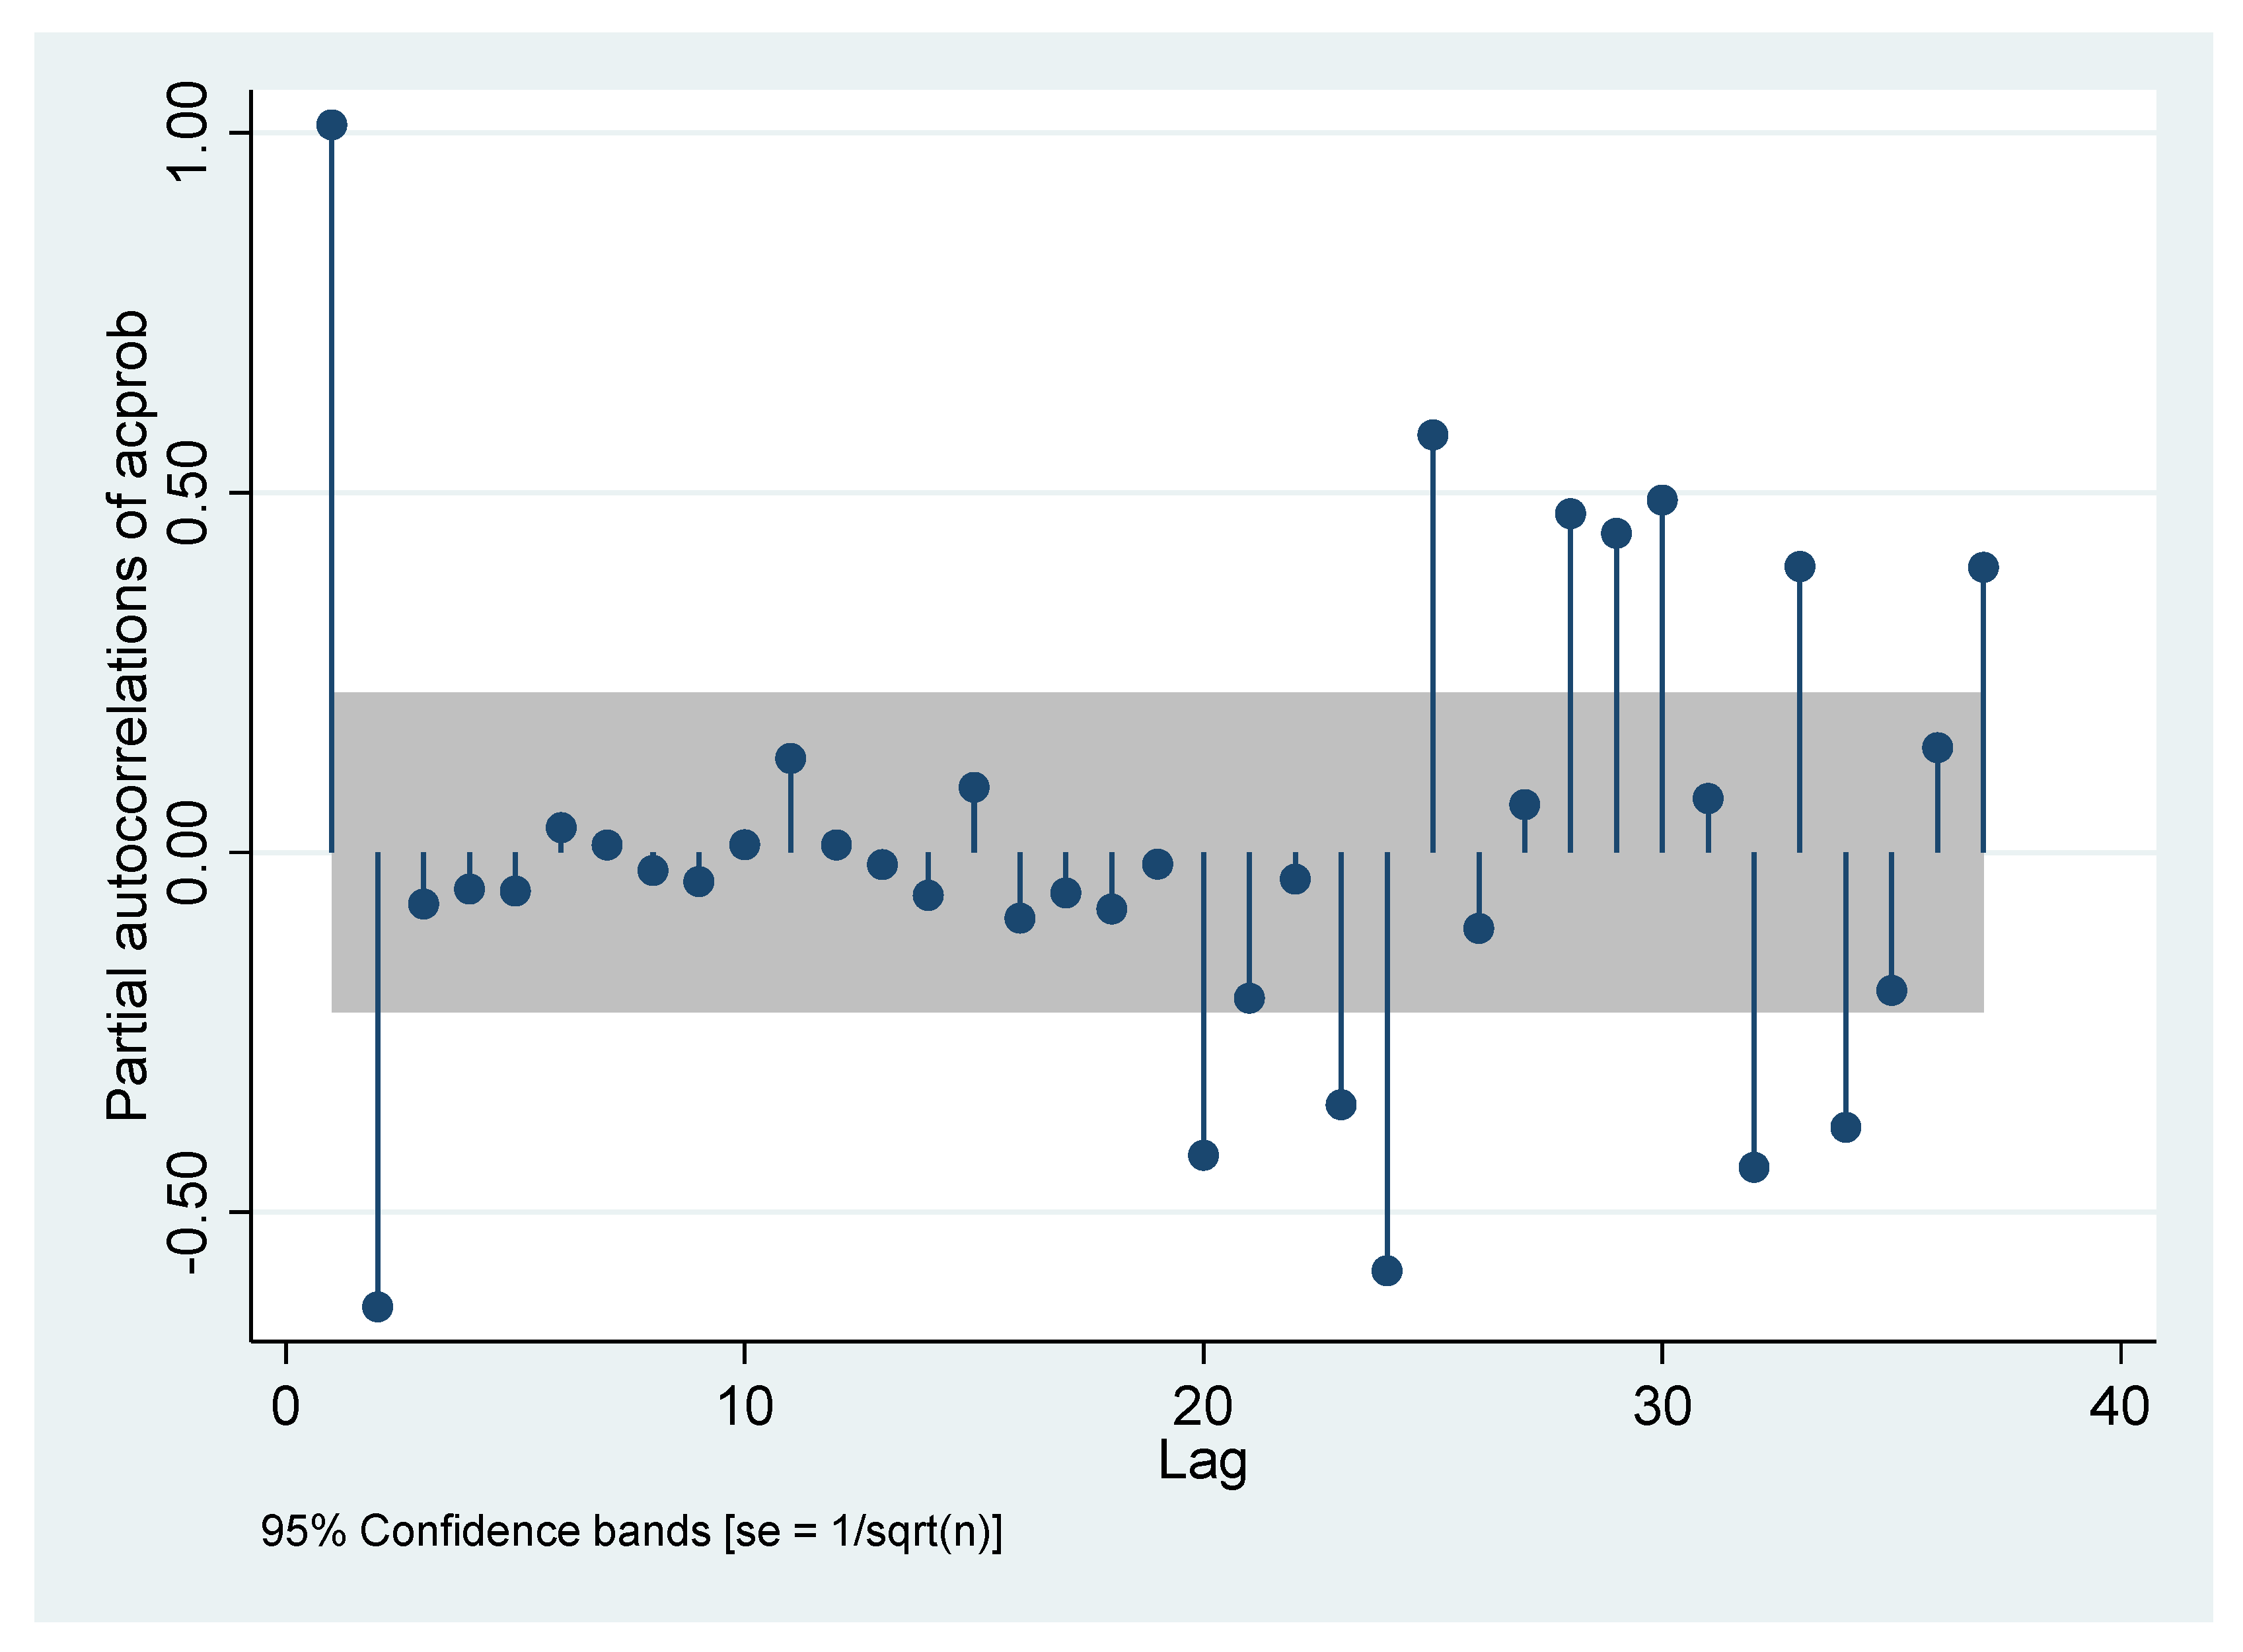
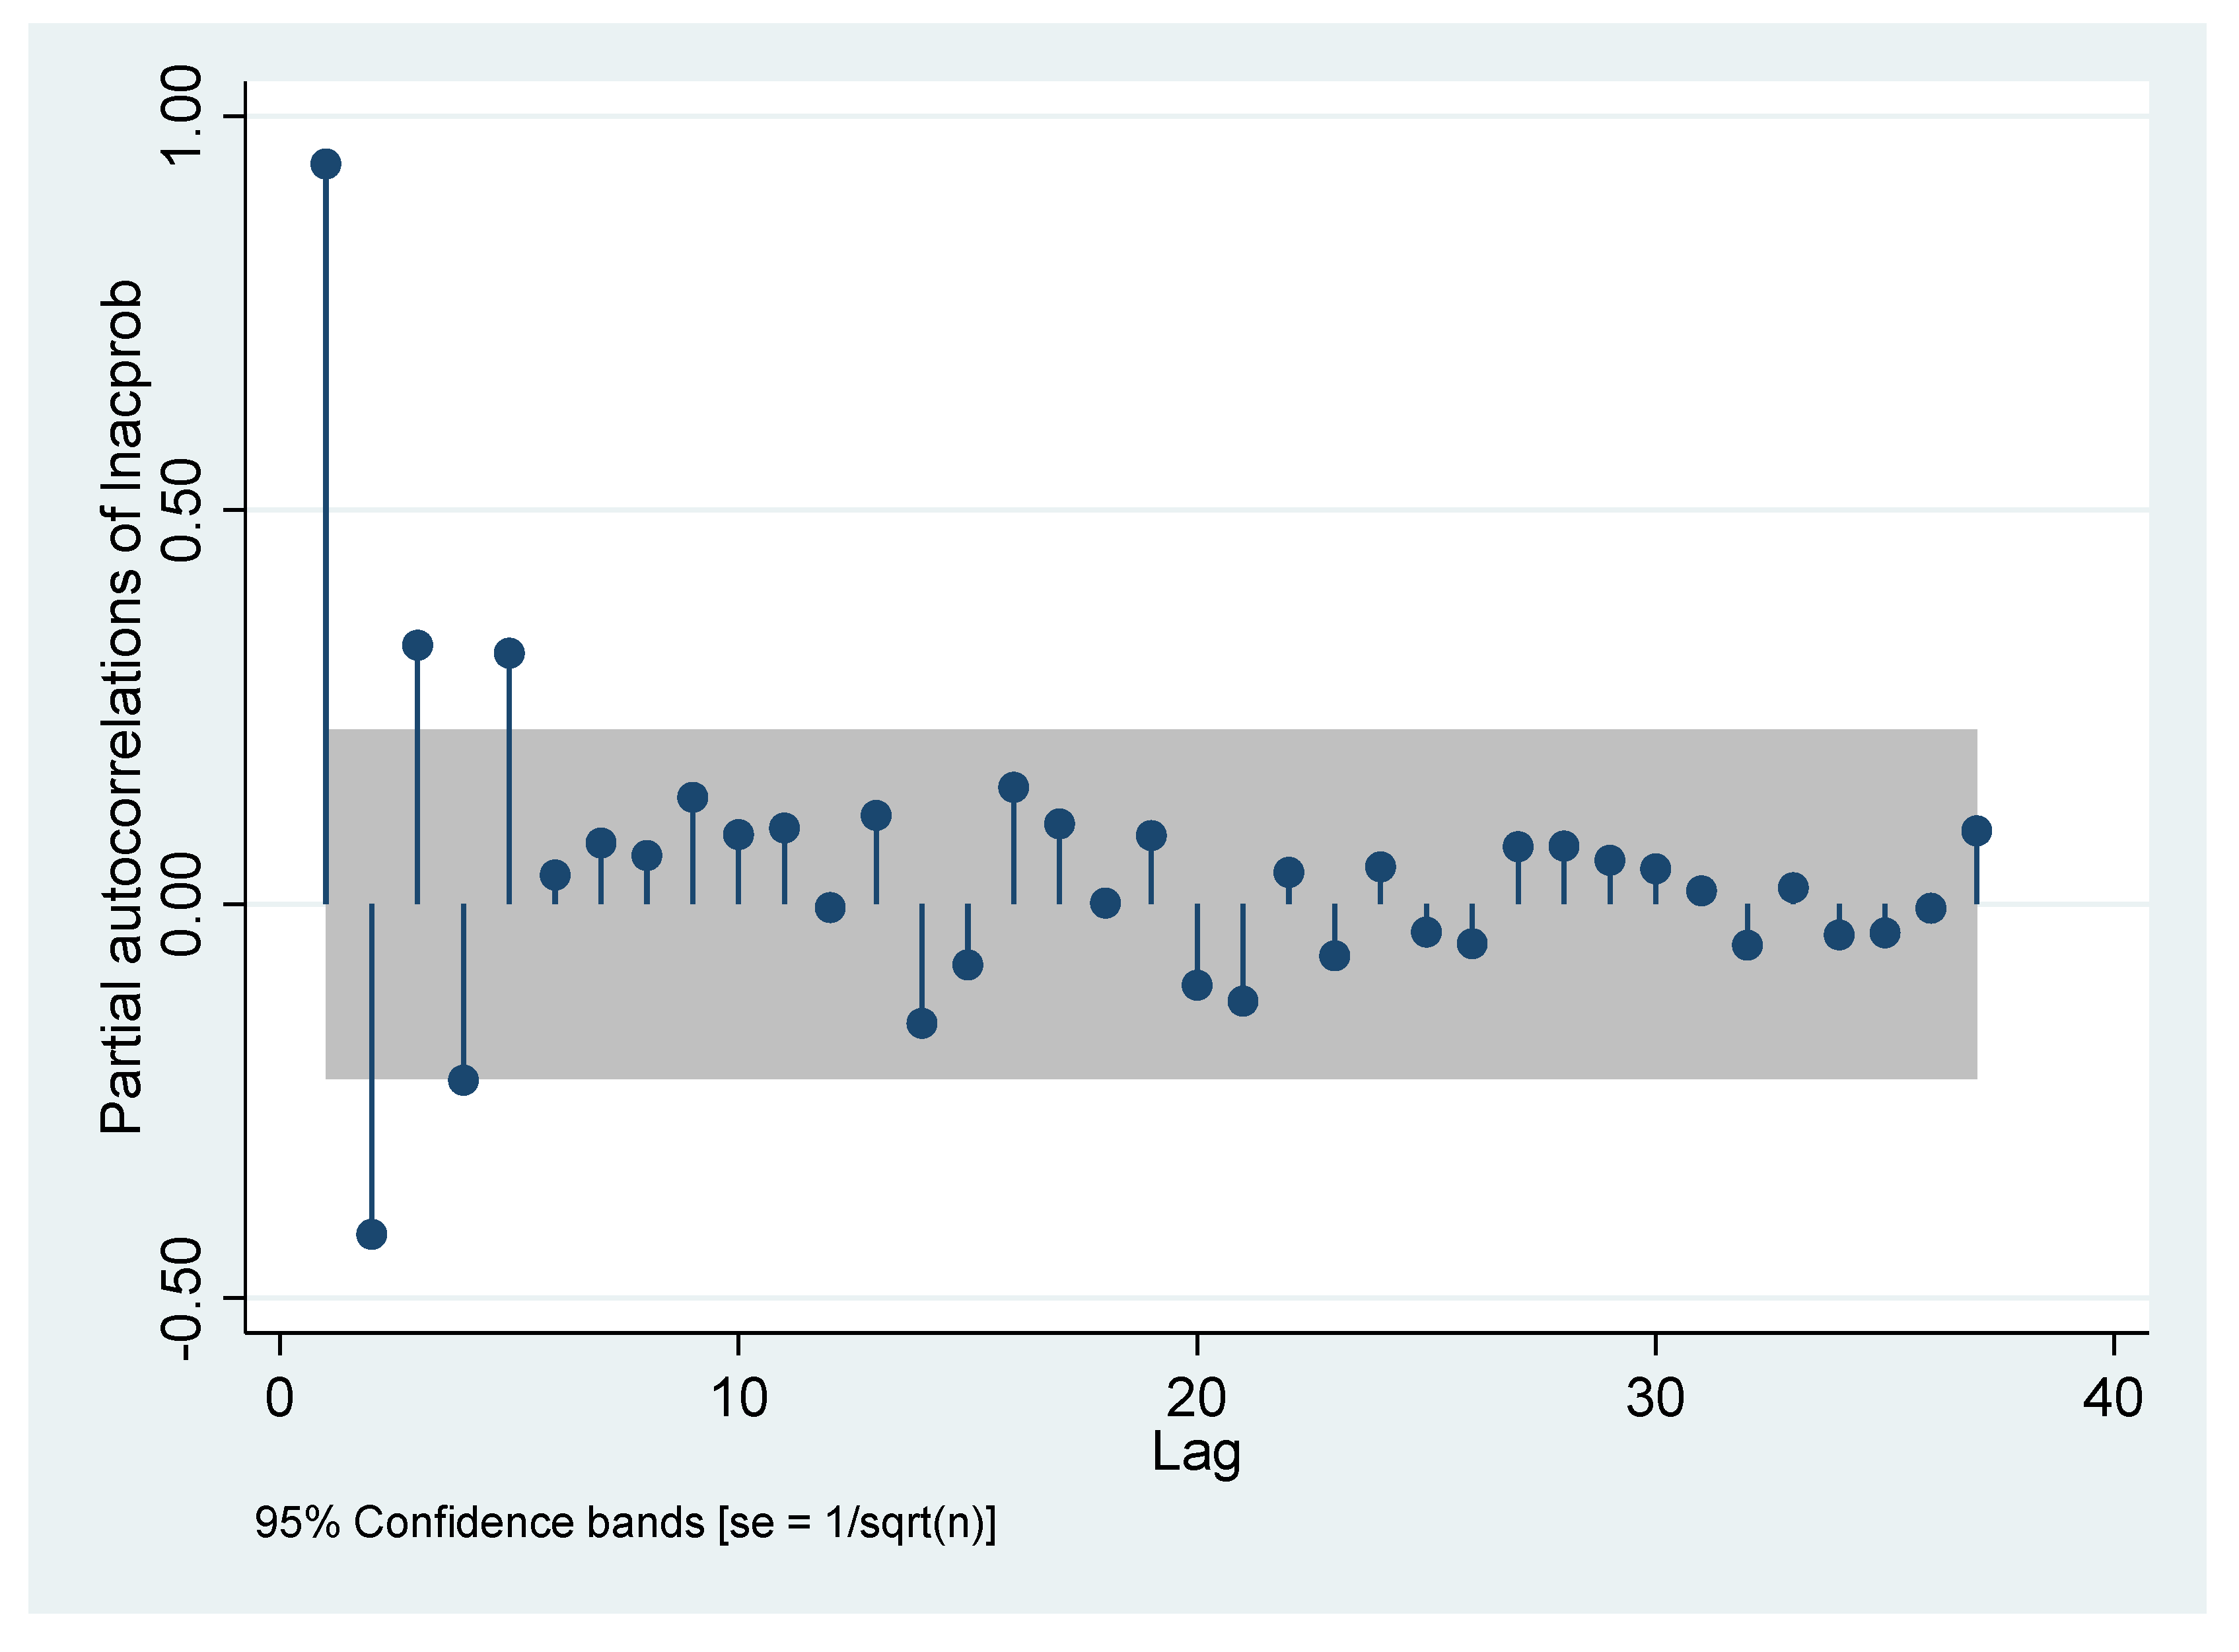
The partial autocorrelation graph (
Figure 4.) of the ratio has a 4-order truncation, and the autocorrelation of order 1, order 3 and order 4 is stronger. The length of the vertical lines in the partial autocorrelation graph represents the level of the autocorrelation of the corresponding AR lag order. If the top of the vertical line extends beyond the shaded area of the figure, the autocorrelation of the lag order represented by the vertical line is obvious. For example, in
Figure 3, the first vertical line on the left indicates that the first-order lag of AR is highly autocorrelated, and therefore, the AR(1) must be included in the ARIMAX model.
The
p value of the ADF(Augmented Dickey-Fuller test) unit root test (
Table 1) of the ratio is 0.0076, which rejects the null hypothesis of unit root at the significance level of 5%; that is, the ratio is trend-stationary series.
Generally speaking, such a trend-stationary series can be regressed as long as the time variable
T is used in the regression equation to eliminate the trend. However, due to the nonstationary character of the main explanatory variable
acprob, the good stationariness of
acprob can be obtained only after its logarithm is calculated and then its difference is made, which turns the
acprob into
dlnacprob. Therefore, if the ratio is directly regressed with the treated explanatory variable
dlnacprob, which has no trend at all, a severe problem will arise: variables with a temporal trend will be used to explain variables without a temporal trend. This would violate the first of the Ten Commandments Of Applied Econometrics proposed by Kennedy: Avoid using a variable with a temporal trend to explain a variable without a temporal trend [
39]. Therefore, in order to avoid such mistakes,
dlnratio will be created from the ratio by removing its trend to keep consistent with the strictly stationary explanatory variable
dlnacprob.
In order to be synchronously stationary with the explanatory variable dlnacprob, the dependent variable dlnratio from the ratio is examined.
For the sake of concision, the time change curve, autocorrelation graph, partial autocorrelation graph and ADF unit root test table of dlnratio are omitted, and the results are reported directly.
The time change curve of dlnratio shows that there is no temporal trend in dlnratio, and the autocorrelation graph of dlnratio has a first-order truncation; the partial autocorrelation graph of dlnratio is trailing. Its ADF test rejects the null hypothesis with the unit root at the 1% level. All these indicate that dlnratio has good stationarity.
3.3.2. Acprob and Dlnacprob
Now we examine the stationarity of the explanatory variable acprob.
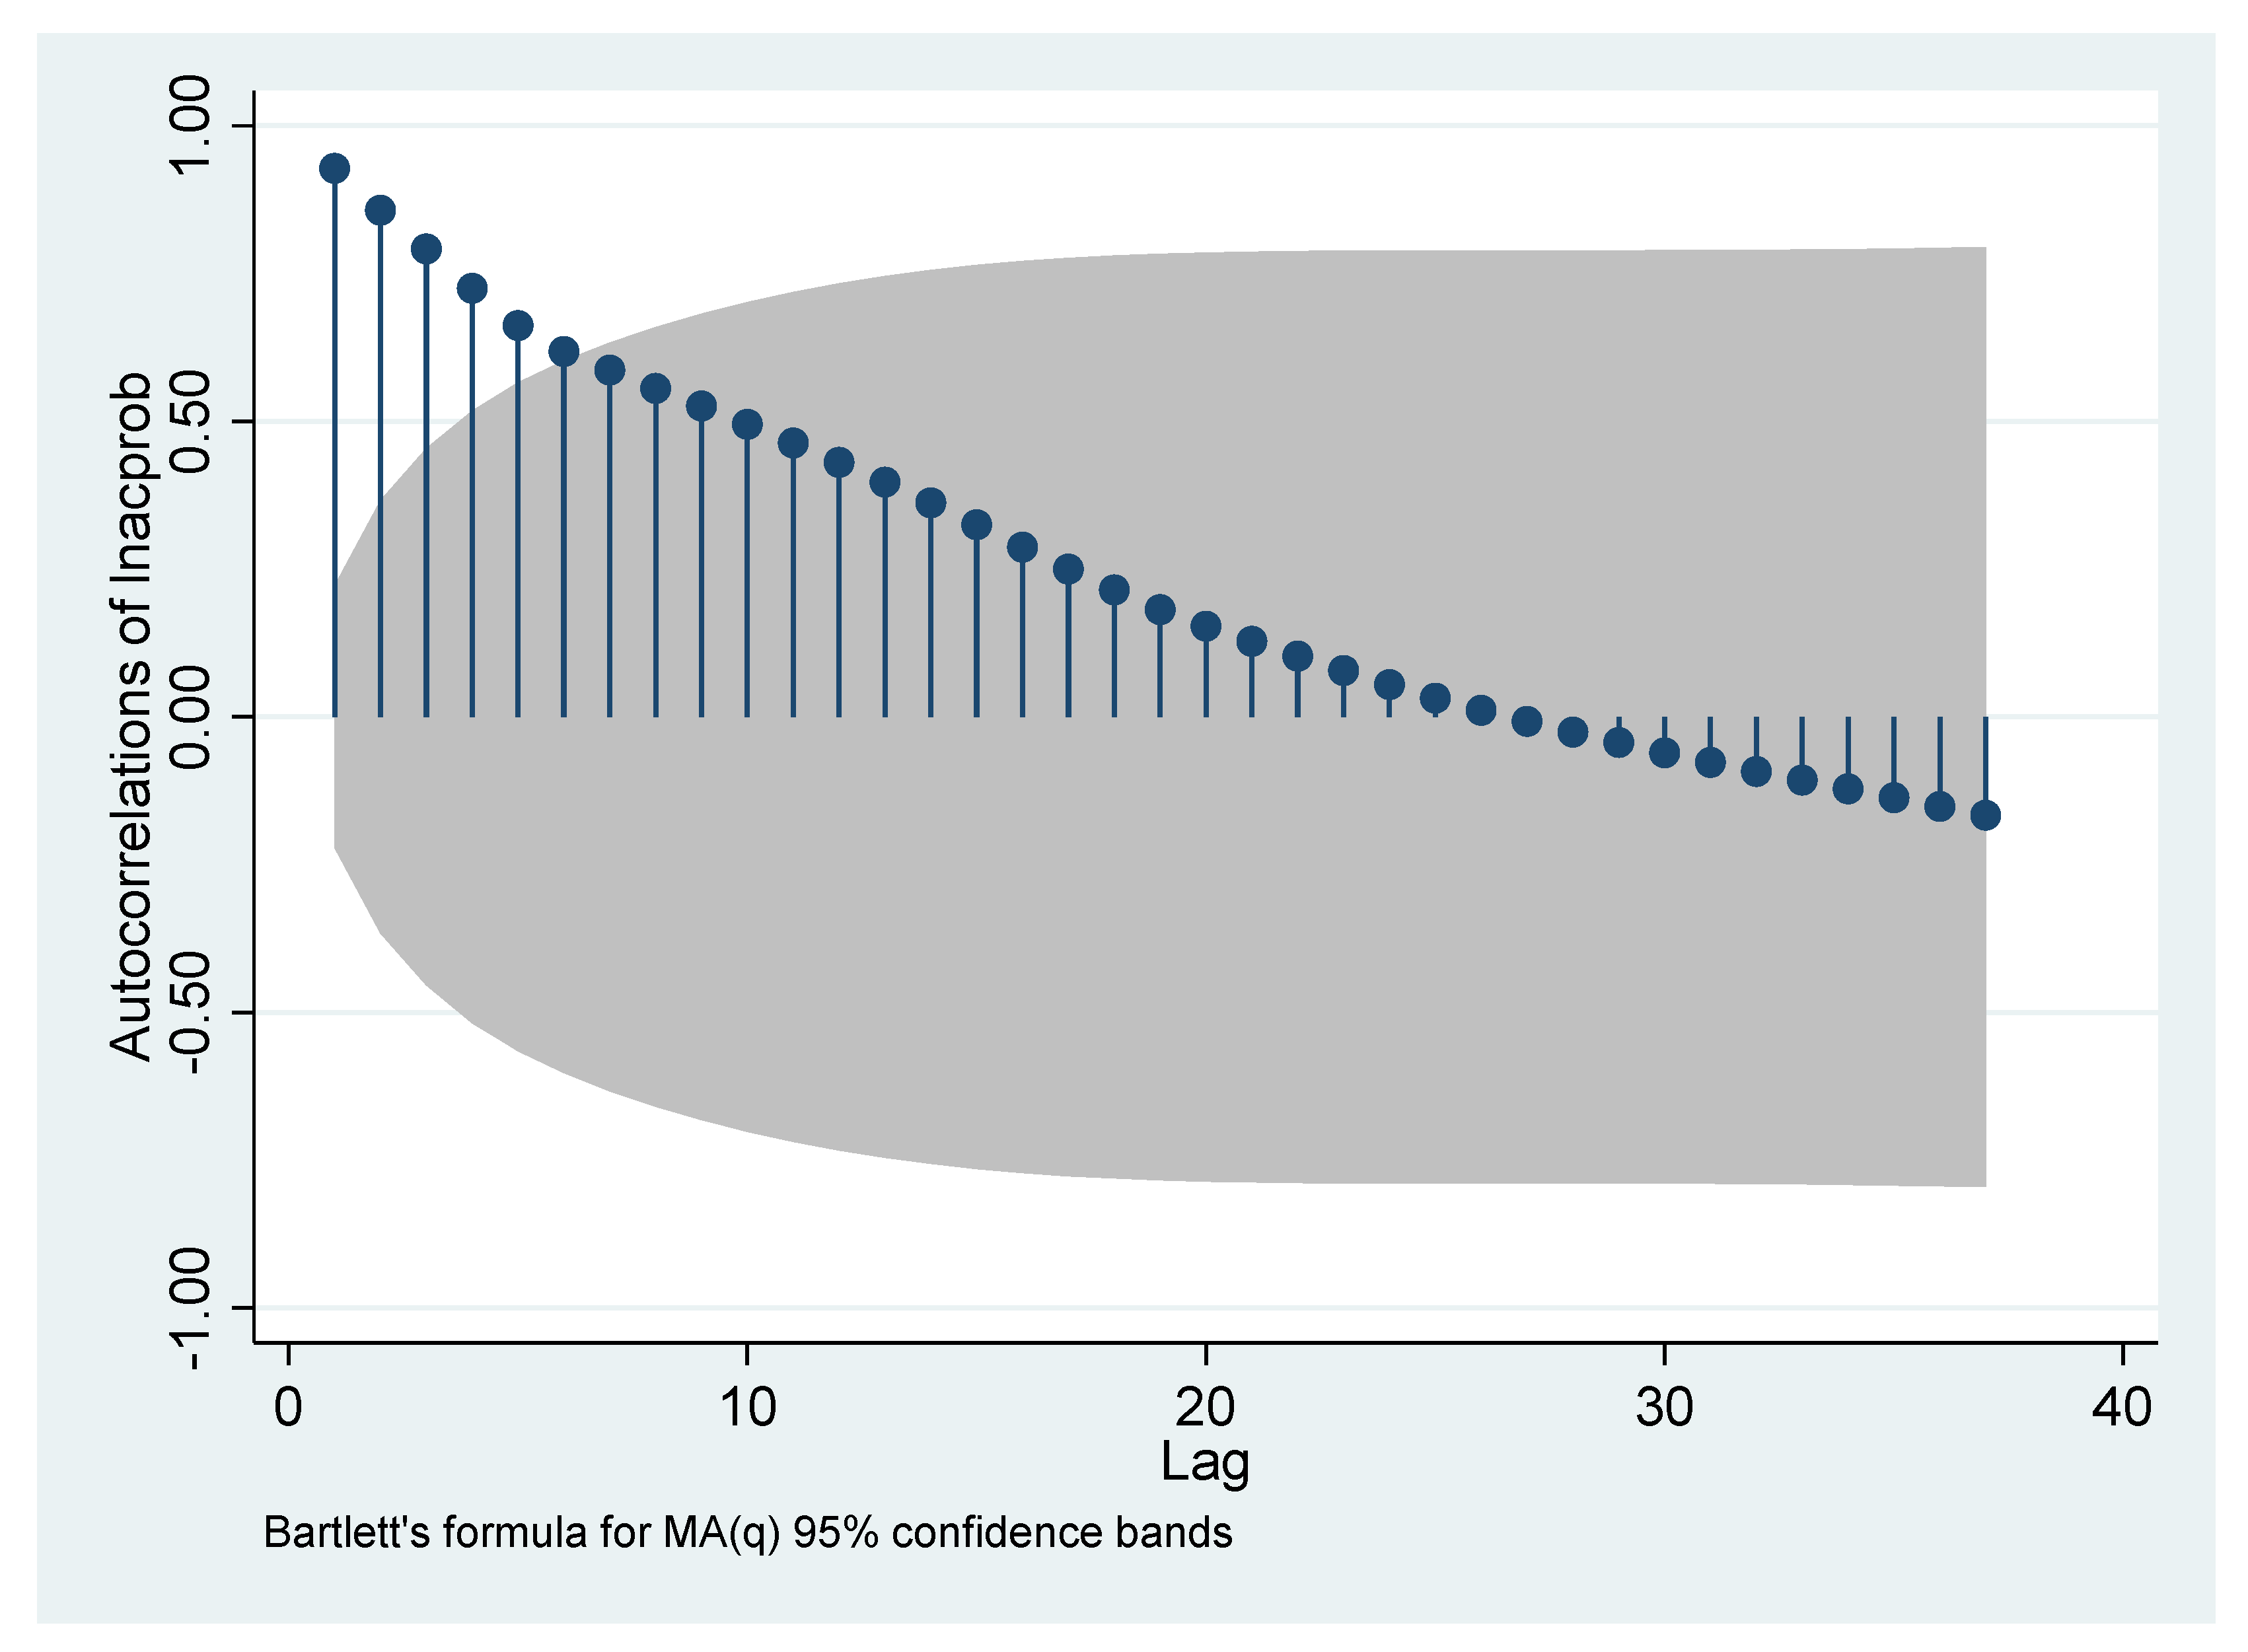
From
Figure 5, the
acprob autocorrelation coefficient does not converge, so the data are nonstationary.
Figure 6 shows that the partial autocorrelation coefficient of
acprob is trailing.
ADF unit root test (
Table 2) with 7-order lag is performed on
acprob, showing that the sequence has a unit root, and the data are nonstationary. The main reason is that, for the cumulative number of the failed platforms
acprob, although the correlation between
acprobt and
acprobt-h is weakening with the increase of time interval h, the weakening speed is not fast enough, so that the stationarity of
acprob is not good.
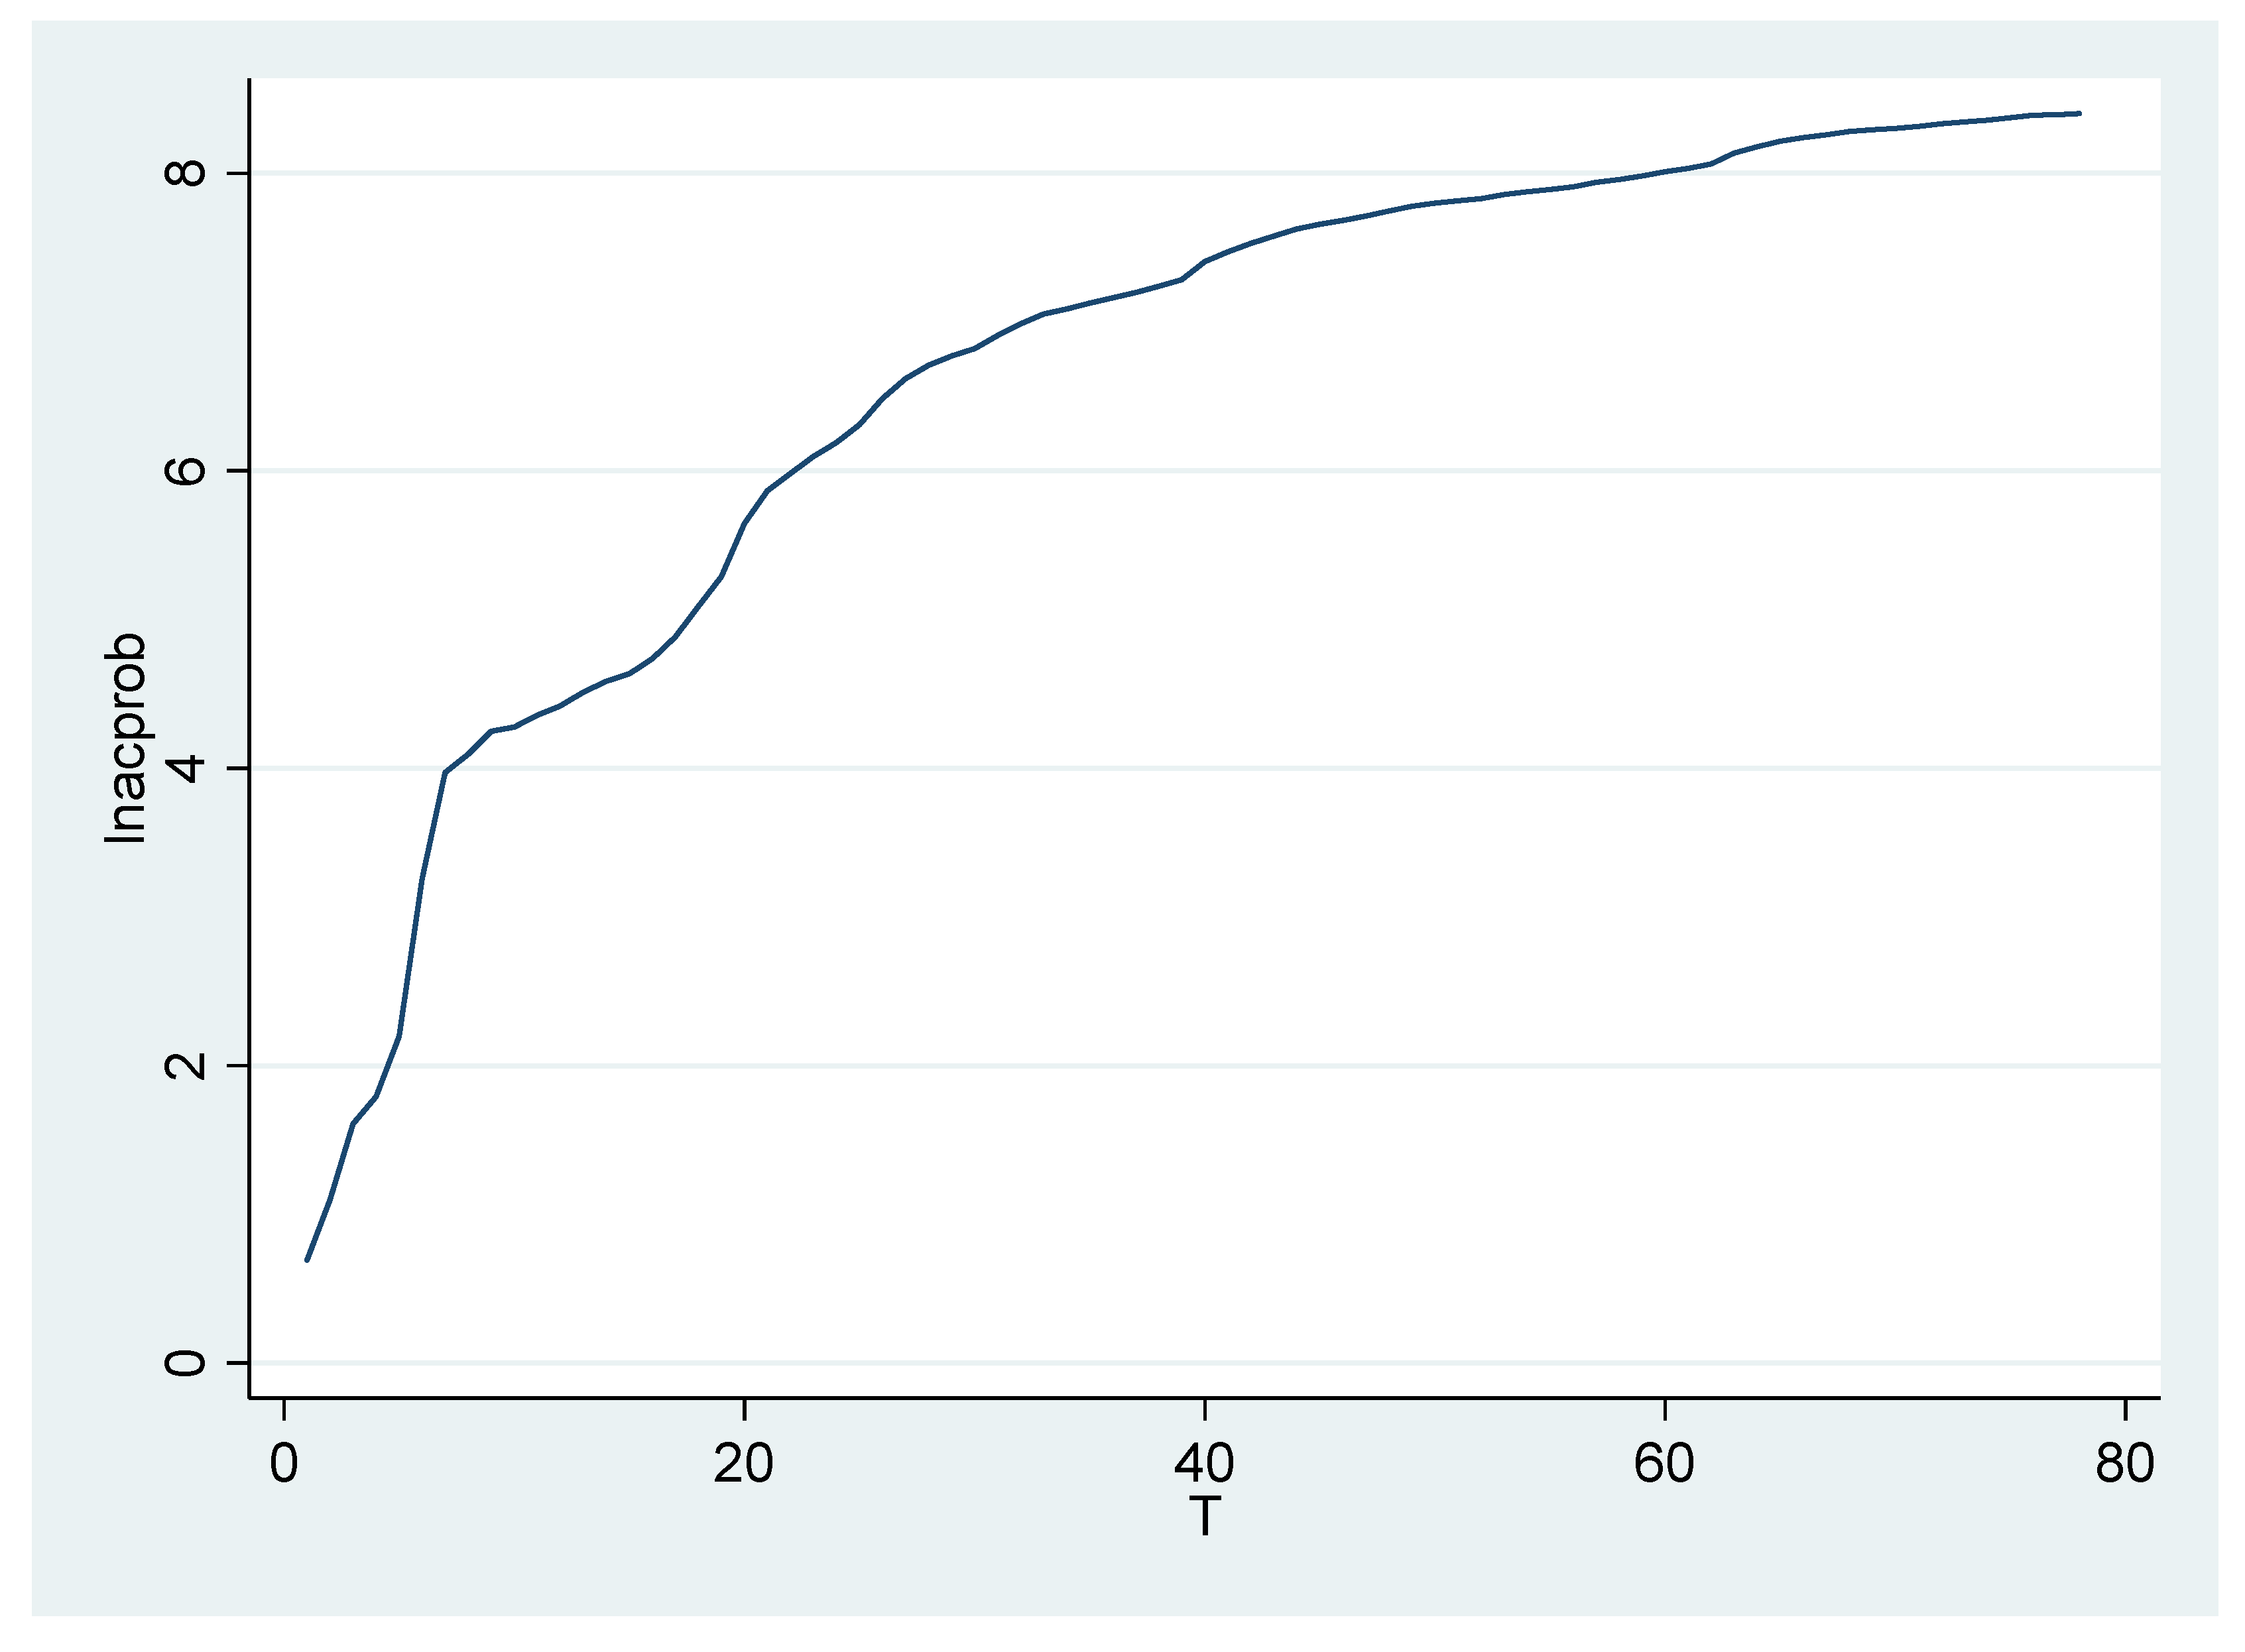
Now we take the logarithm of
acprob to reduce its volatility (
Figure 7).
From
Figure 8 and
Figure 9, the autocorrelation graph of
lnacprob has a 6-order truncation, and the partial autocorrelation graph of
lnacprob has a 5-order truncation.
The ADF unit root test (
Table 3) of
lnacprob shows that it still has a unit root, and the data are nonstationary series.
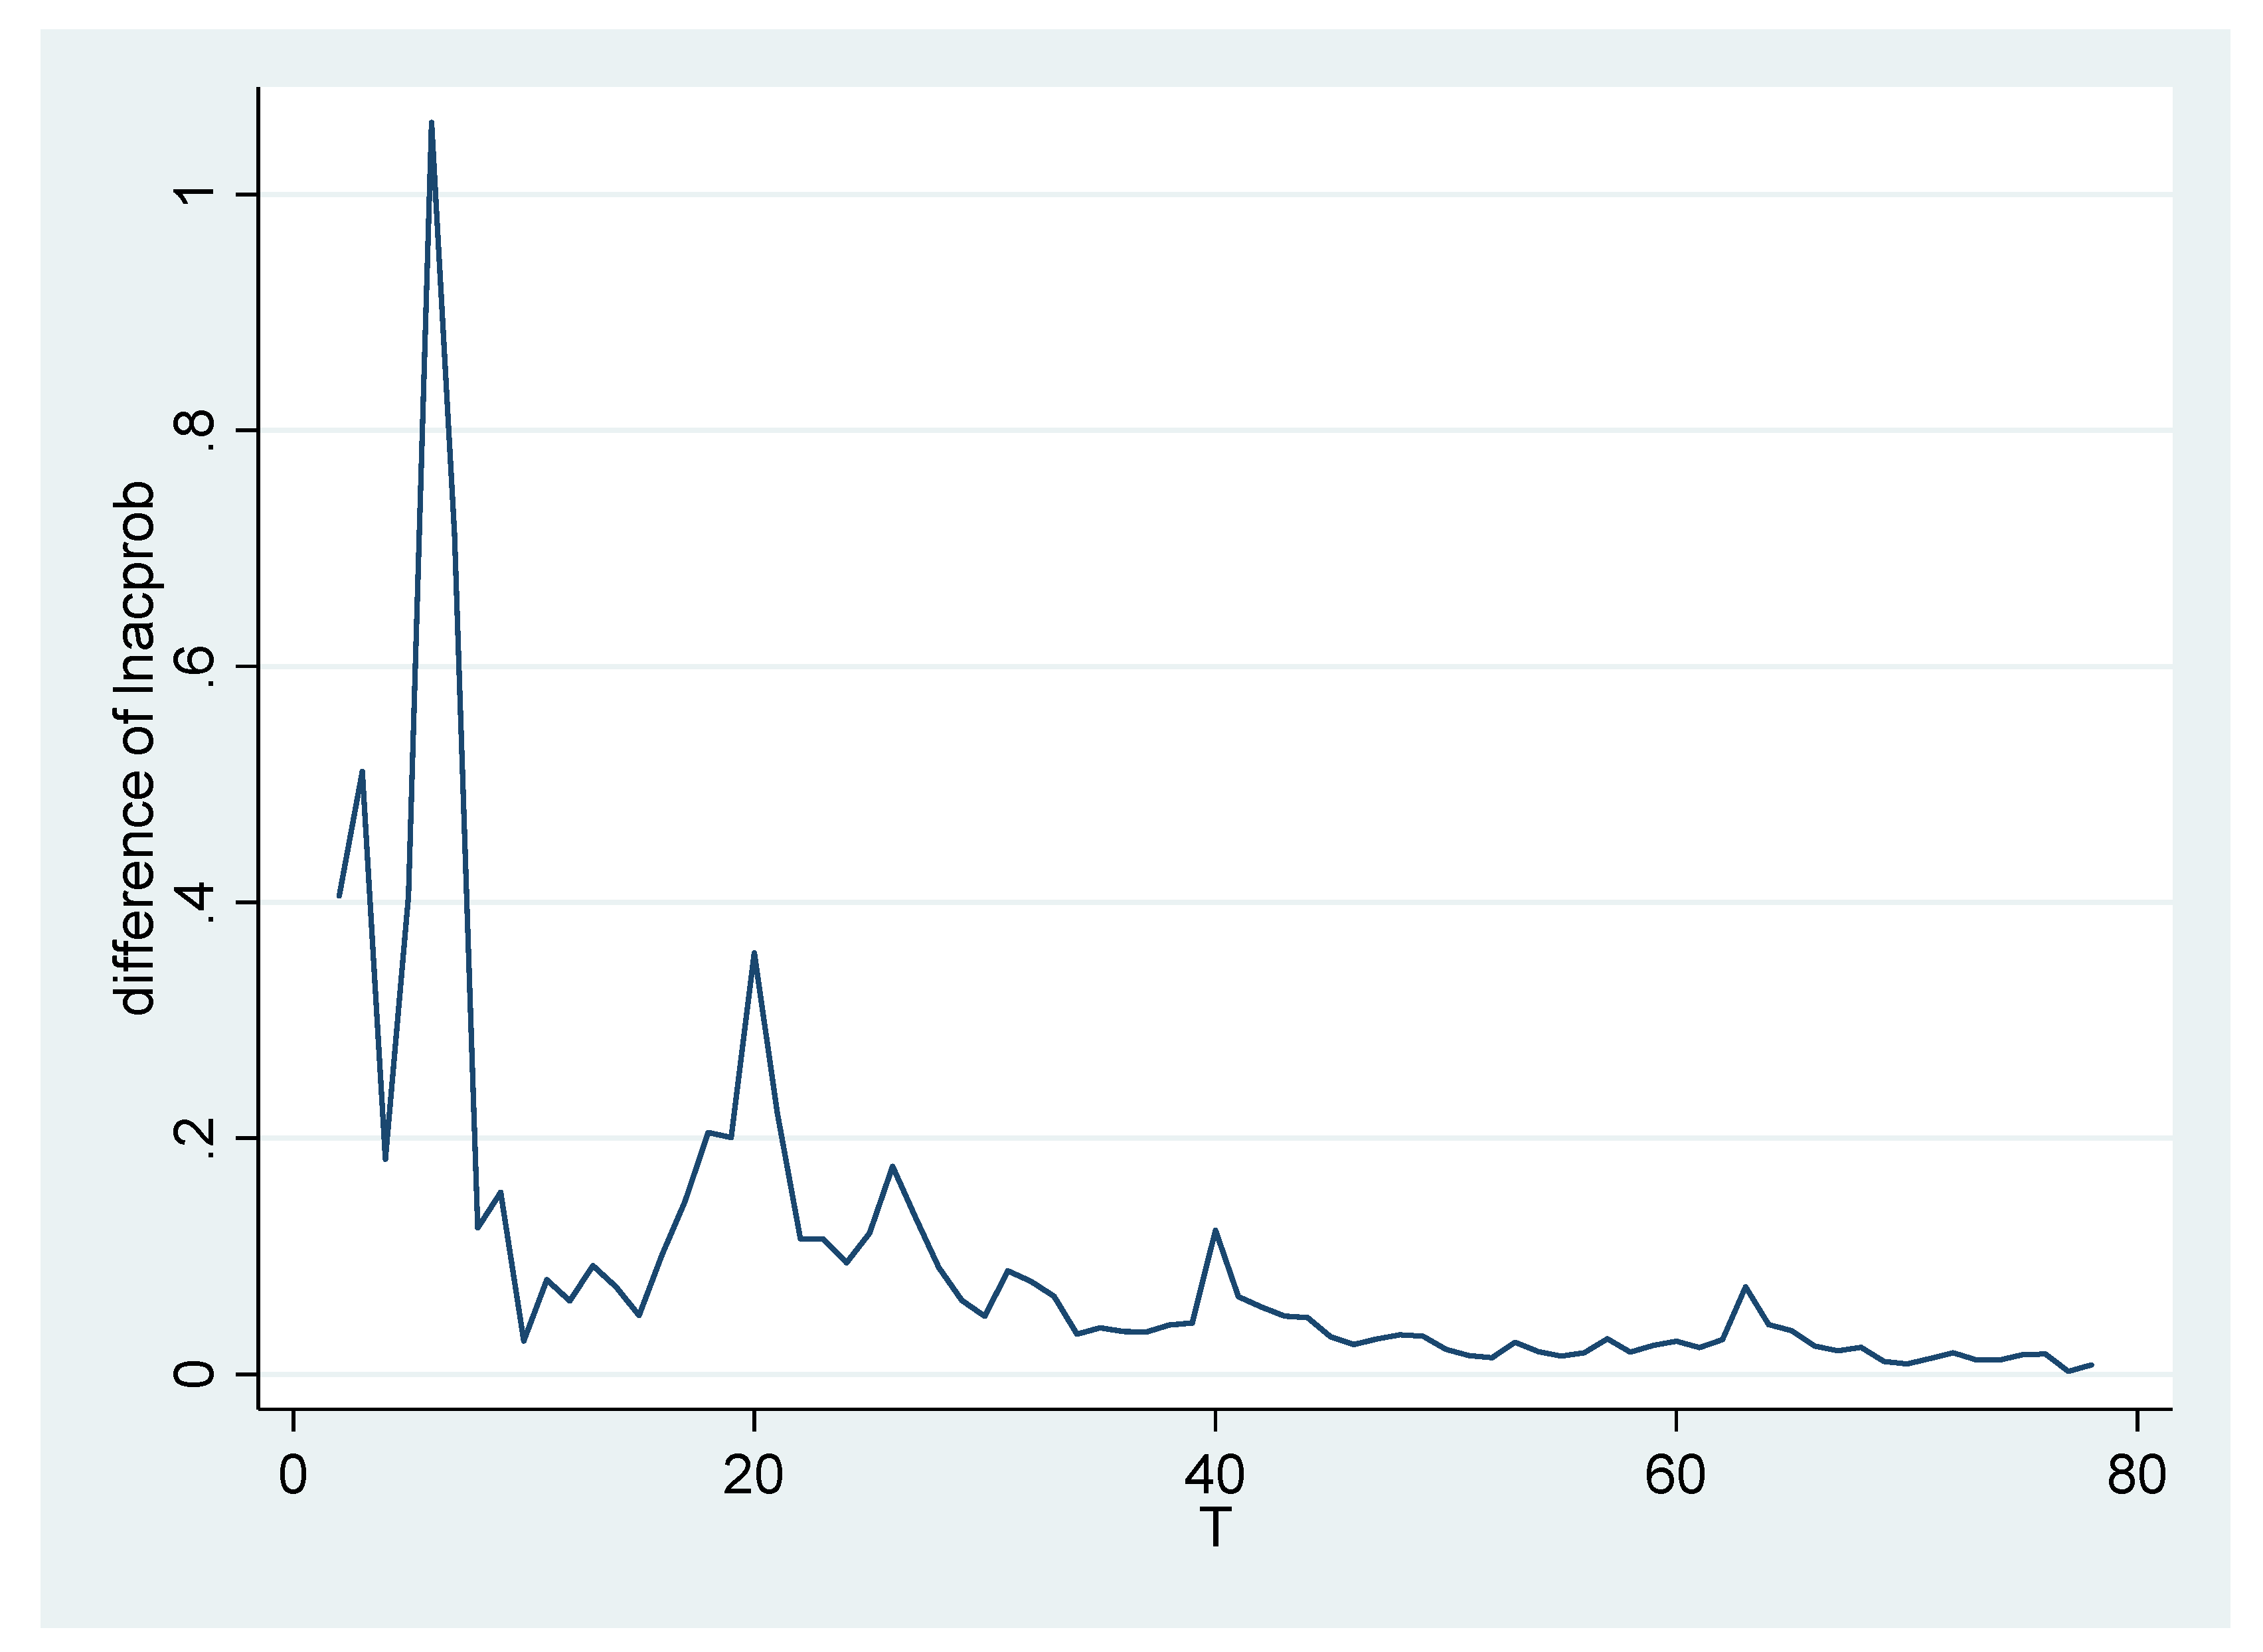
To improve its stationarity, the difference of lnacprob is taken to form the variable dlnacprob.
From
Figure 8 and
Figure 9, the autocorrelation graph of
lnacprob has a 6-order truncation, and the partial autocorrelation graph of
lnacprob has a 5-order truncation.
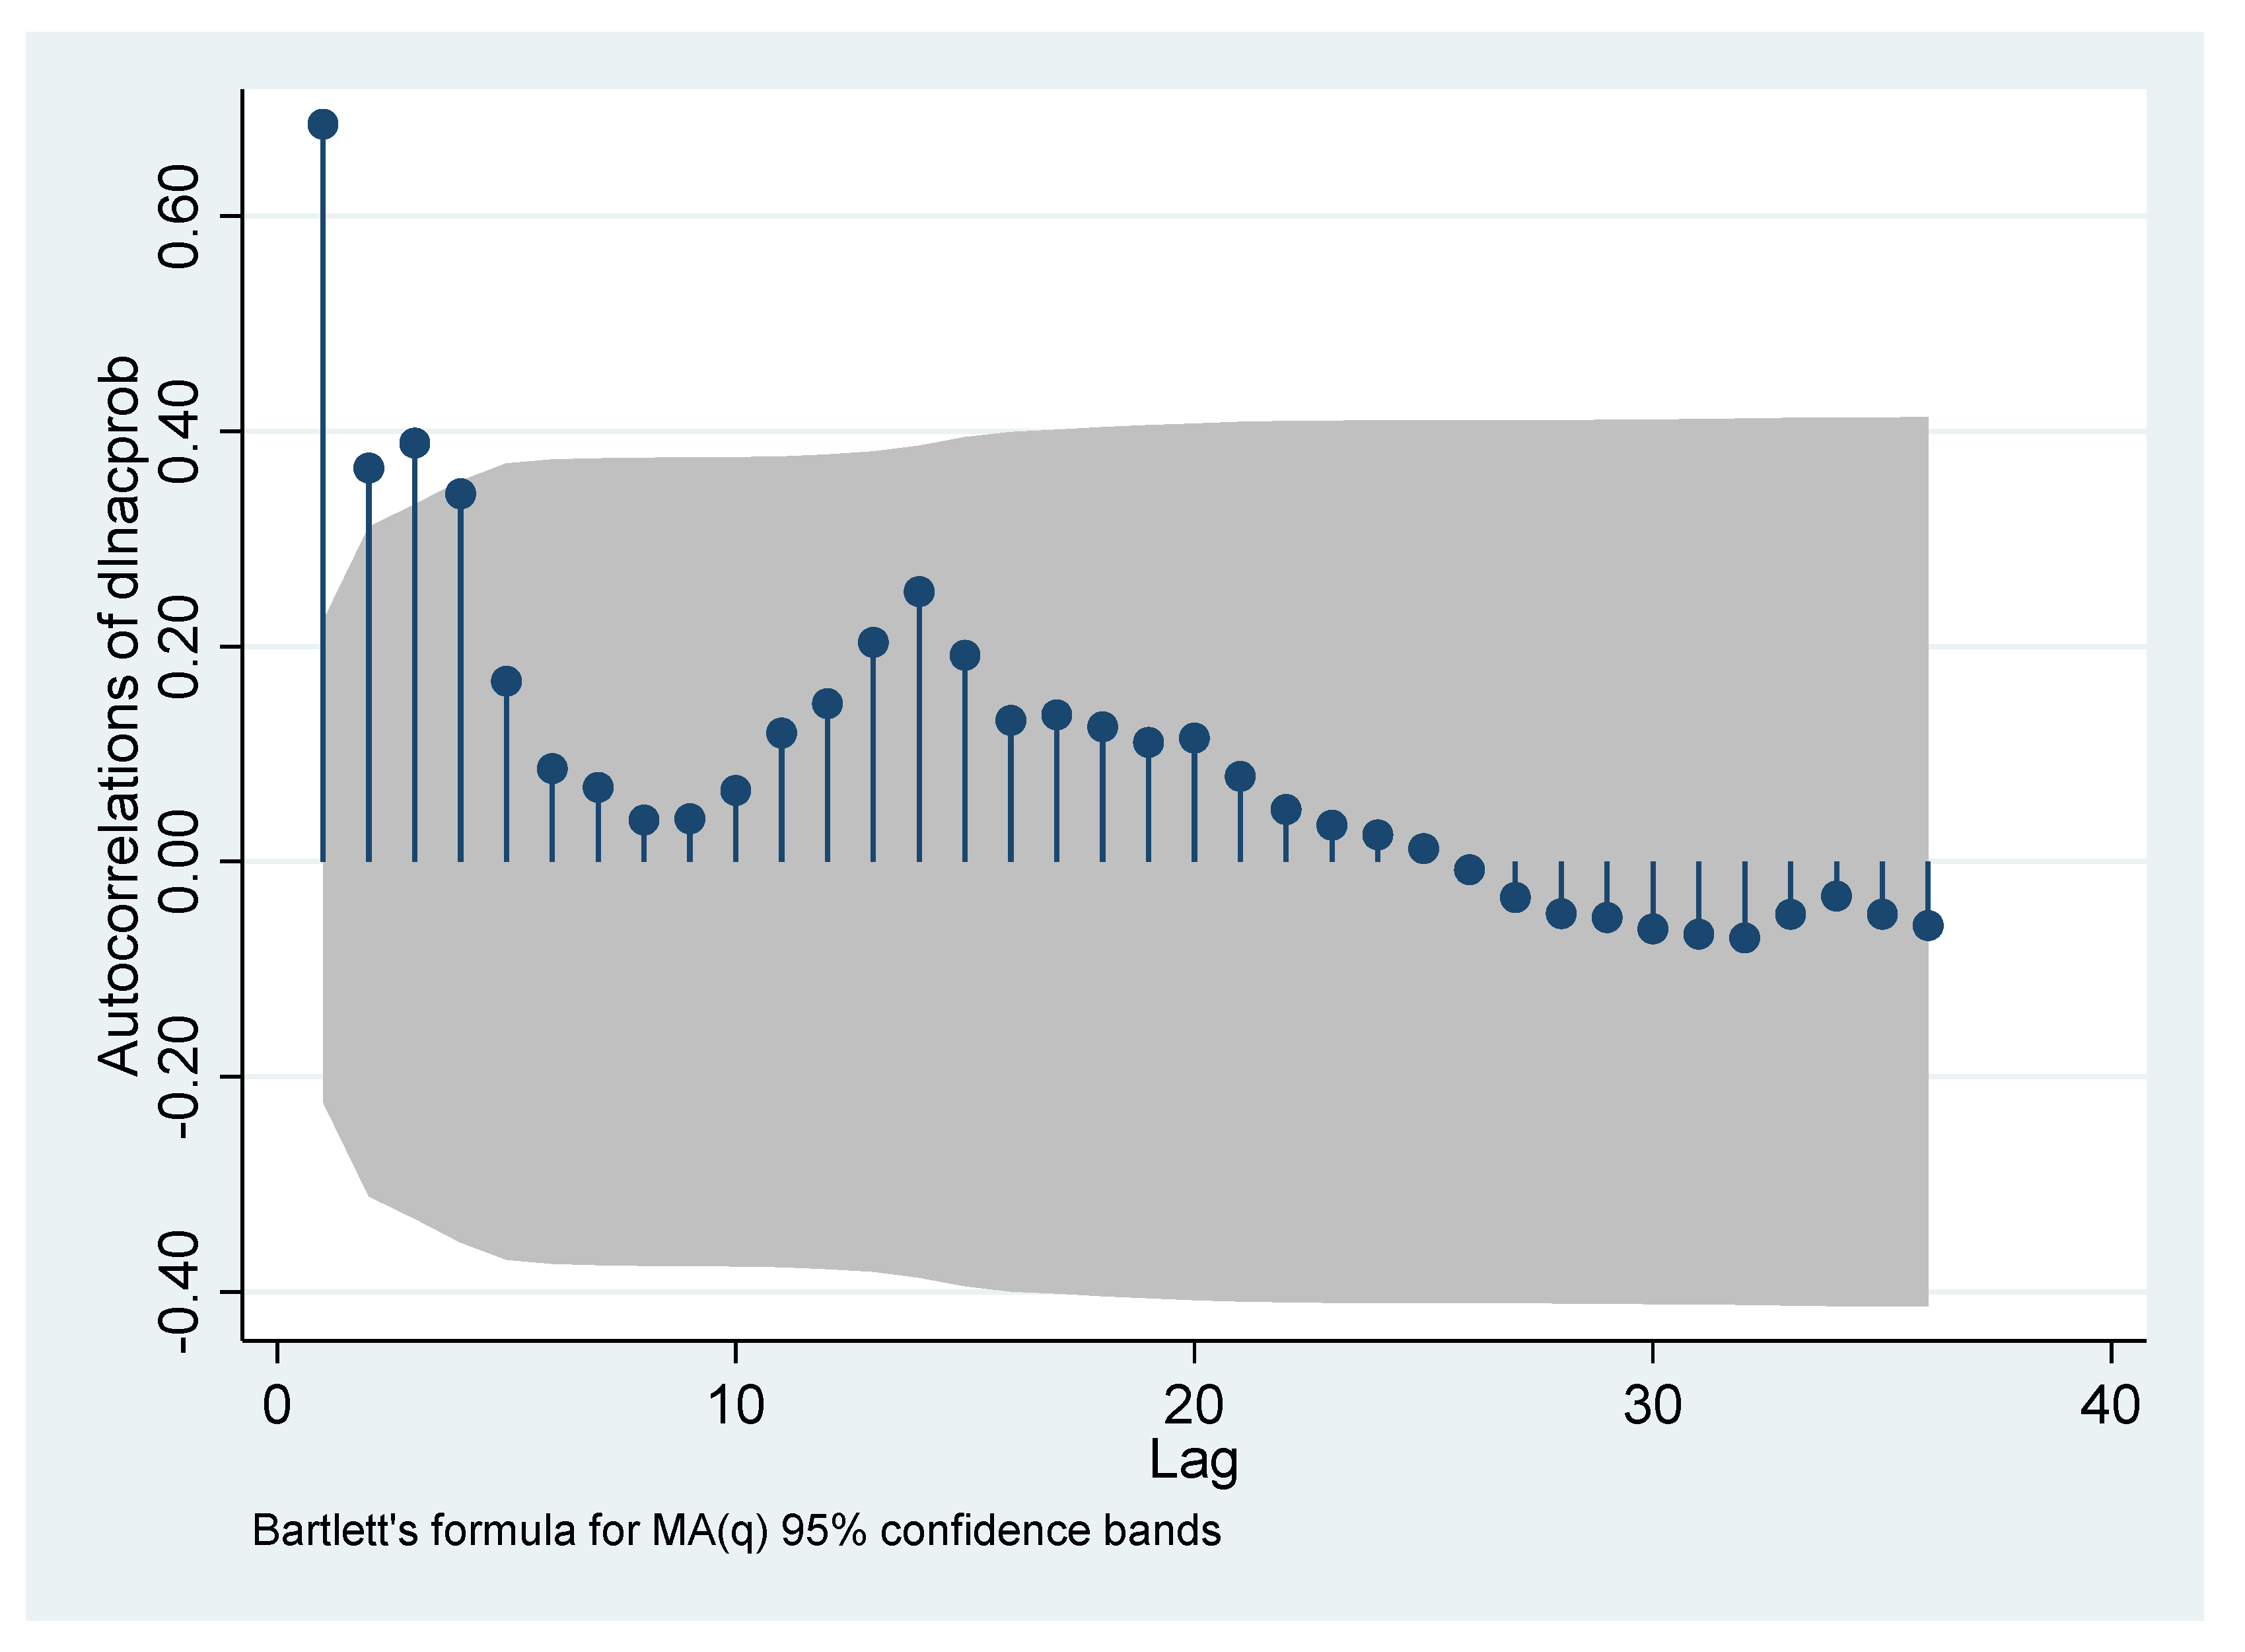
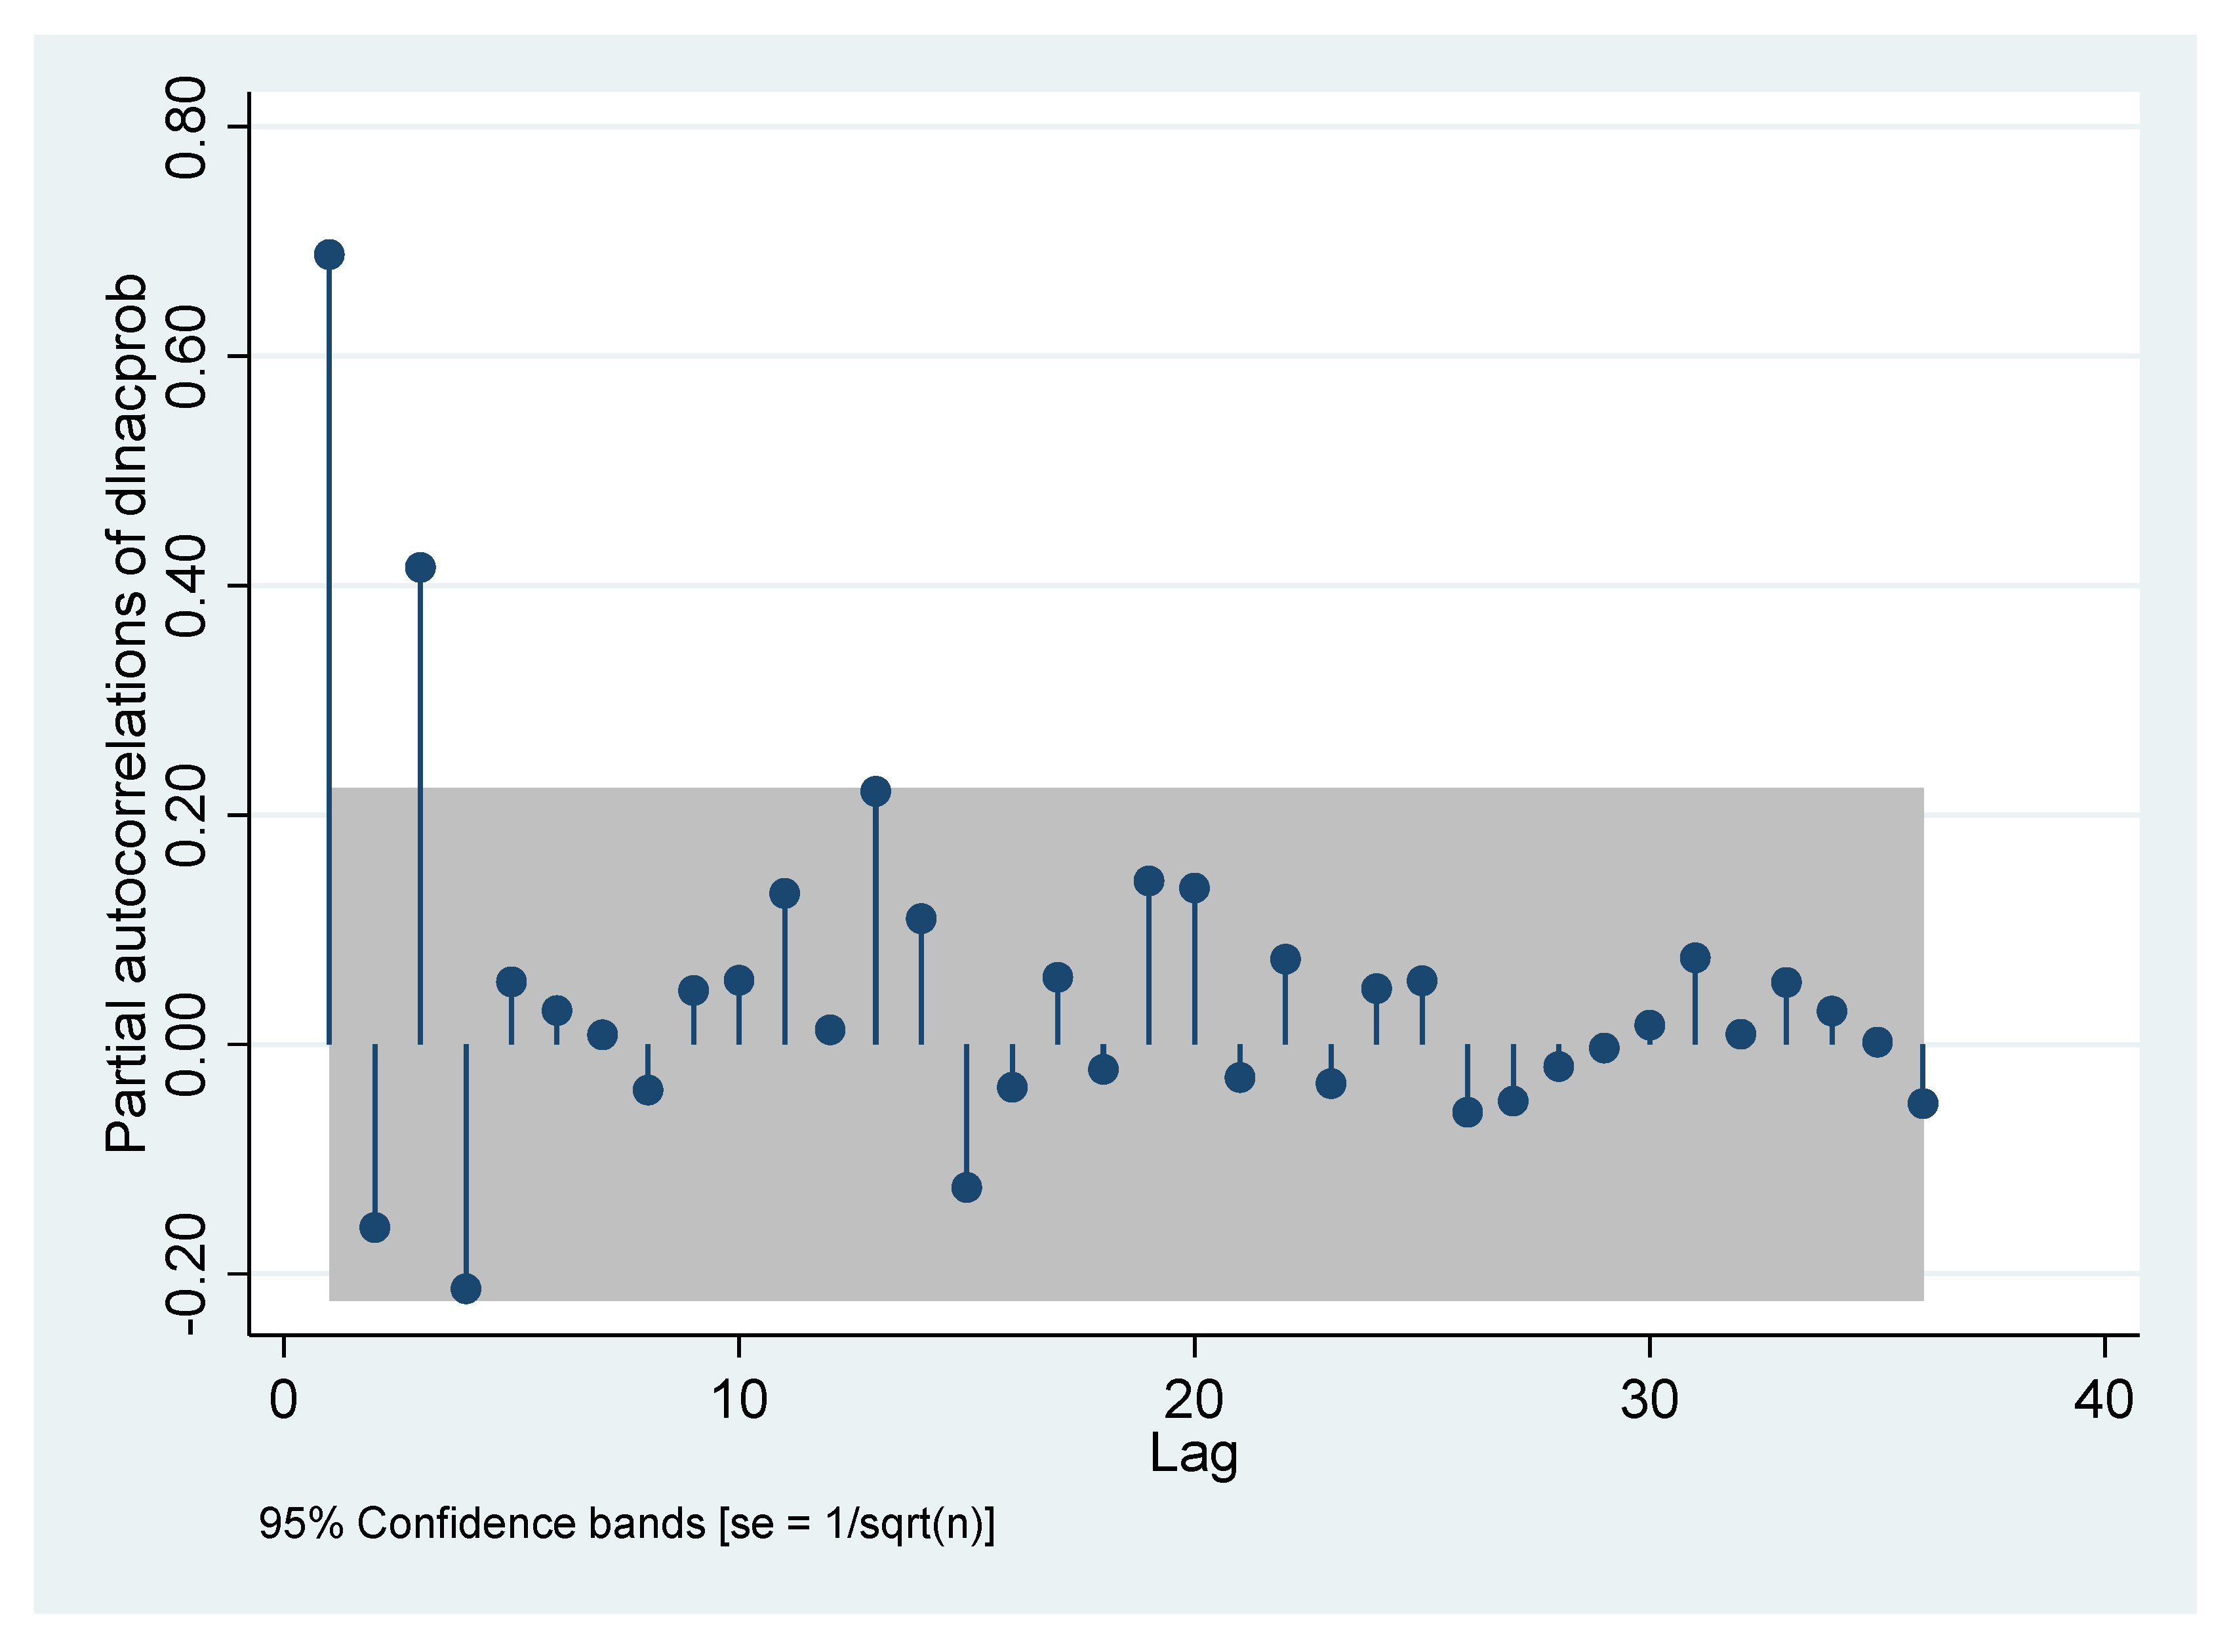
Figure 10 is the time change curve of
dlnacprob,
Figure 11 and
Figure 12 are autocorrelation and partial autocorrelationof
dlnacprob respectively.
From
Table 4, after taking the difference of
lnacprob, the ADF test rejects unit root at 1% level, showing good stationarity of
dlnacprob.
3.3.3. The Results of Stationary Processing of Each Control Variable
The stationarity analyses of each control variable are the same as that of the dependent variable ratio and the explanatory variable acprob. For the sake of concision, their stationarity analysis is not listed anymore.
In this paper, the naming rules of corresponding new variables from stationary processing of each original variable data are consistent: “ln” means the logarithm of the original variable, “d” means the difference of order 1, and “dd” means the difference of order 2.
For each original variable, only the percentage of monthly rise and fall of The Shanghai Stock Index is “inherently stationary” and does not need to be processed. Therefore, its original variable,
stock, is directly used in the regression, and no corresponding new variable appears. This is because the ADF test of
stock rejects the unit root at the significance level of 1%, meaning good stationarity. The reason is, as the noted econometrician Jeffrey M. Wololdridge has pointed out: if log(
yt) is integrated of order one, then the variable Δlog(
yt) ≈ (
yt −
yt−1)/
yt−1 formed by proportion or percentage is integrated of order zero [
40]. The percentage of monthly rise and fall of The Shanghai Stock Index is exactly(
yt −
yt−1)/
yt−1, so it is integrated of order zero, which can be directly used in the regression.
All the 6 original variables have good stationarity by taking the difference. The comparisons between these original variables and the corresponding new variables are shown in
Table 5.
The descriptive statistics of the new variables formed from the stationary processing of the original variables are shown in
Table 6.
4. Models
4.1. The Lag Orders of the Models
According to the autocorrelation and partial correlation graphs of each variable after stationary processing, the lag orders of each new variable are shown in
Table 7.
According to
Table 7, the ARIMAX (3,0,3) model can be used for regression (since all variables are stationary, so there is no need to make a difference in the model, that is, the order of difference in the model is 0).
4.2. Comparison of Models with Different Independent Variables
Model 1 is the regression of the dependent variable
dlnratio to the explanatory variable
dlnacprob. This is a simple model without any control variables. The regression result shows that the coefficient of
dlnacprob is −0.271, which is significant at the 1% level, indicating that the ratio of the average monthly size of normal operating platforms to that of the failed platforms changes downward with the increase of the accumulated number of the failed platforms. Since the ratio is greater than 1, such a change means that the ratio approaches 1. In other words, with the continuous emergence of the failed platforms, the size of the failed platforms gradually becomes larger and larger. However, it can be seen from
Table 8 that, compared with other models adding control variables, model 1’s information criterion AIC is the highest, indicating that the model seriously lacks variables, so it is not a complete model.
Model 2 is formed by adding variable dlnnew to model 1, which is the average size of the platforms newly launched that month. The adding of dlnnew is to make the model free of the suspicion: what if the growing size of the failed platforms is caused not by an increase in the number of failed platforms but simply by the increase in the average size of new platforms?
Therefore, as a control variable, the average size of new platforms dlnnew is added in model 2, so as to observe whether the coefficient of explanatory variable dlnacprob, which means the accumulation of the failed platforms, no longer significant. If so, it means that the increasing size of the failed platforms is not caused by the increasing number of failed platforms, which will negate the fuze effect put forward in this paper. However, the situation is that the coefficient of dlnacprob is still significant after the adding of the variable dlnnew, but the coefficient of dlnnew is not significant. Thus, the authenticity of the fuze effect is well proved.
In model 3, some control factors that may affect the dependent variable dlnratio are added: bank deposit interest rate ddbank, the monthly rise and fall of the Shanghai Stock Exchange Composite Index stock, average 7-day inter-bank borrowing rate dinbank7. These factors may affect the customer behaviors, including their investment and cash withdrawal. These customer behaviors will affect the operation of P2P platforms. In model 3, the explanatory variable dlnacprob is significant at 1% level, and some control variables, such as the average size of the newly launched platform dlnnew, the deposit interest rate of bank ddbank, and the monthly rise and fall of the Composite Index of Shanghai Stock Exchange stock, are also significant to a certain extent, but not as high as that of the explanatory variable dlnacprob. The average seven-day inter-bank lending rate, dinbank7, is not significant, so it has no influence on dlnratio.
In model 4, on the base of model 3, we add the dummy control variable pol to reflect the impact of the policy changes made by the government on the risks of P2P platforms. In model 4, the explanatory variable dlnacprob is still significant at 1% level, but the dummy control variable pol is not as significant as the explanatory variable dlnacprob, so it is clearly showed that the fuze effect is the main factor to generate the risks of P2P platforms.
In
Table 8, heteroscedasticity robust standard errors are used to prevent heteroscedasticity interference to the regression.
From
Table 8, the information criterion AIC of model 4 is the smallest (73.62), but the residual white noise of model 4 is not very good (Prob > chi2(28) = 0.7978), the AIC of model 3 is relatively small, and its white noise is also good. Therefore, model 3 is selected as the final regression model; that is, the ARIMAX model in this paper is:
where ε
t is white noise.
4.3. Regression Result and Significance of Model 3
According to Formula (1), there are:
Furthermore, according to Formula (1), there are:
By substituting the above expression into (2), we can get:
where ε
t is white noise.
In Formula (3), the regression result is substituted in, and we can get:
where ε
t is white noise.
According to
Table 8, the explanatory variable
dlnacprob which means the cumulative number of failed platforms is significant at 1% level, among the control variables, the rise and fall of bank interest rate
ddbank and stock market index
stock are significant at 5% level; the average size of new platform
dlnnew is significant at 10% level. So the accumulation of the failed platforms is the most important factor affecting the dependent variable
dlnacprob.
At the same time, the coefficient β1 is negative, showing that the ratio of the average monthly size of normal platforms to that of the failed platforms will decline with the increase of the accumulated number of the failed platforms; that is, the ratio will approach 1 from greater than 1 as the number of failed platforms accumulates, meaning that the average size of the newly failed platforms gradually changes from being much smaller than the average size of the normal platforms to being close to the size of the normal platforms, which proves that the fuze effect exists in the process of risk outbreak of P2P platforms.
5. Robustness Analysis of Model 3
Generally speaking, if the model is not robust, especially when the explanatory variable is set incorrectly, increasing the control variables will cause a lower significance level of the explanatory variable, or even not significant at all. If such a situation occurs, it means that the model is sensitive to the change of control variables, so it is not robust, and there is something wrong with the model setting.
In this paper, the independent variable in model 1 is only the explanatory variable
dlnacprob, in model 2, we increase the average size of the new platforms
dlnnew as a control variable; in model 3, we increase further the interest rates
ddbank, stock price
stock, inter-bank lending rates
dinbank7 as more control variables. The results show that no matter what control variables are added, the good significance of the explanatory variable
dlnacprob does not change (significant at 1% level, as shown in
Table 8), which indicates the good robustness of the model. Meanwhile, it also strongly proves that the cumulative number of failed platforms is indeed the cause of the gradual increase of the average size of the failed platforms, and also proves the existence of fuze effect in the process of risk outbreak of P2P platforms.
6. Conclusions and Suggestions
Aiming at the risk prevention of FinTech for its sustainable development, taking the risk outbreak process of China’s P2P platforms as an example, through statistical and theoretical analysis, we find the phenomenon of risk outbreak process along the qualification chain from low to high, and name it as “fuze effect”. This risk outbreak in the form of the fuze effect is fatal to the P2P marketplace. On the other hand, for emerging industries or fields such as FinTech, the fuze effect is particularly prone to occur, leading to the risk outbreak in the form of zippers. Therefore, for the development of FinTech, both market regulatory authorities and entrepreneurs should keep high vigilance against the possible fuze effect. This article has some preliminary suggestions for both the government and the entrepreneurs.
For the market regulatory authorities such as the government, the suggestions are:
First of all, according to the key conditions to generate the fuze effect proposed in this paper, we should prevent the emergence of a large number of high-risk enterprises, such as appropriately raising the threshold for entry and establishing a regular evaluation and clean-up system for high-risk enterprises. In particular, we need to prevent speculations and deceptions under cover of beautiful words such as “innovation”, “new economy”, “new business forms” and “high-tech”, be on high alert for all kinds of “beautiful words”, not easily allow low-qualified enterprises “entering” to prevent them from harming the industry.
Second, according to this paper, another important condition for the generation of the fuze effect is the increase of deadweight cost caused by vicious competition. Therefore, the government should formulate good market competition rules, especially for the emerging markets, and strengthen the supervision of the market to effectively prevent the occurrence of vicious competition.
Third, for emerging industries, it is necessary to study and evaluate whether small enterprises with relatively low qualifications can form a “fuze effect” before deciding the entry threshold. If such enterprises have the potential threat of the fuze effect, it is necessary to set a high entry threshold at the very beginning. Only when we are sure that the fuze effect will not be induced can we open the market with a lower threshold.
Fourthly, when cleaning up high-risk enterprises, attention should be paid to the design of system interface [
41]; that is, systems and policies with blocking fuze effect should be introduced at the same time to prevent the harm of the exit of high-risk enterprises
Fifthly, because the government usually lacks management experience of new technology enterprises but cannot completely ban them lest losing the opportunity of development, it is necessary to make full use of “regulatory sandbox”, after the successful experience is obtained on a small scale experiment then popularize it on a large-scale. In fact, it is the real cause of a large number of P2P platforms that failed that no real “regulatory sandbox” has ever been implemented in China.
For entrepreneurs, there are two suggestions.
First, we should pay close attention to whether a large number of high-risk enterprises are piled up in the industry. If so, it is necessary to take protective measures in advance to prevent the harm of the fuze effect.
Second, in investment decision-making, entrepreneurs should be wary of those industries with low entry threshold, especially a sudden increase in the number of enterprises, because the emergence of a large number of low-qualified enterprises in the industry is the precursor of the fuze effect.


