
Experimental Study of a New Pneumatic Actuating System Using Exhaust Recycling


Abstract
:1. Introduction
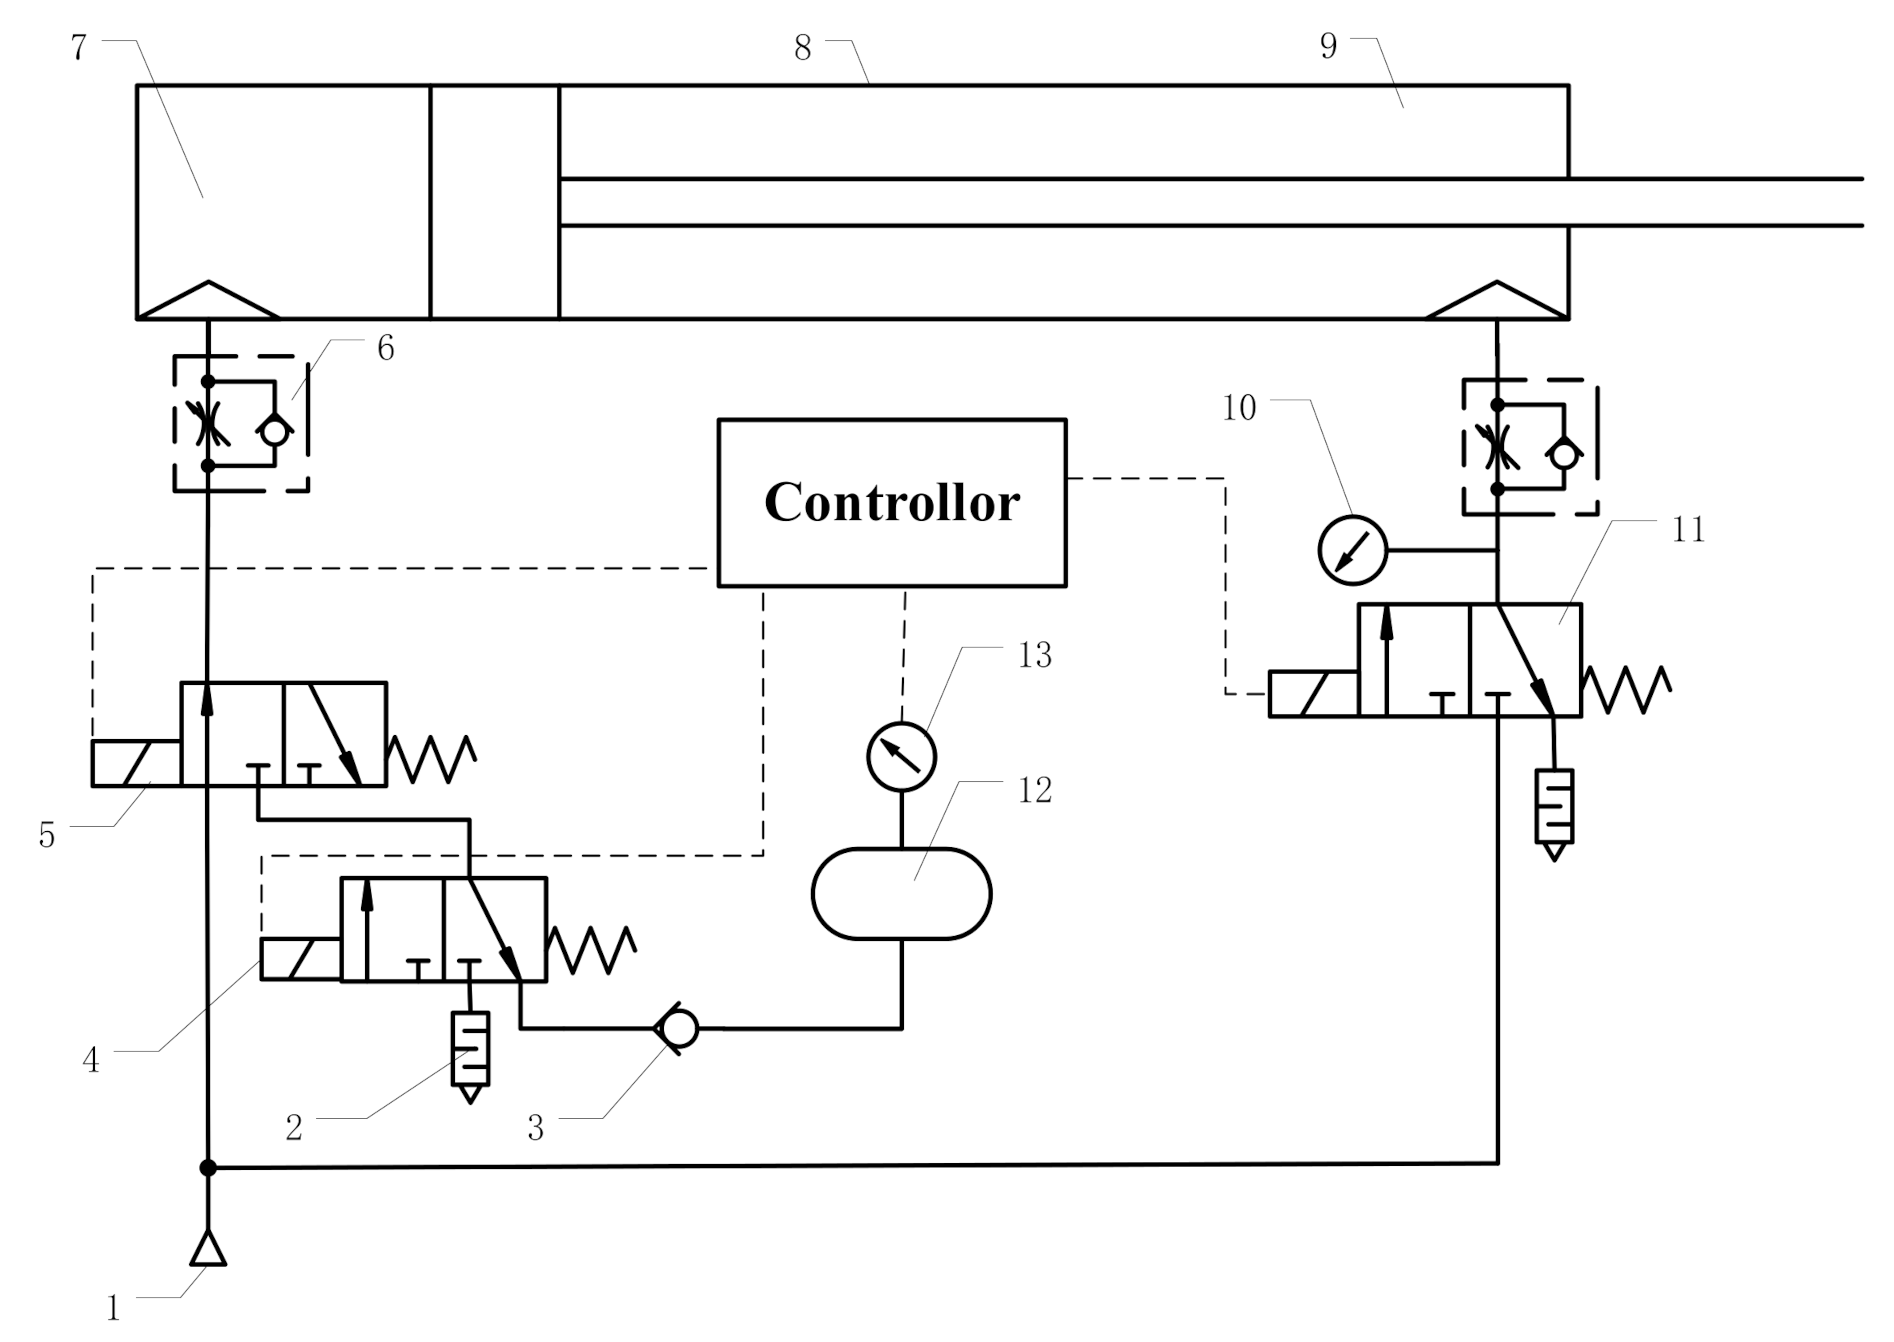
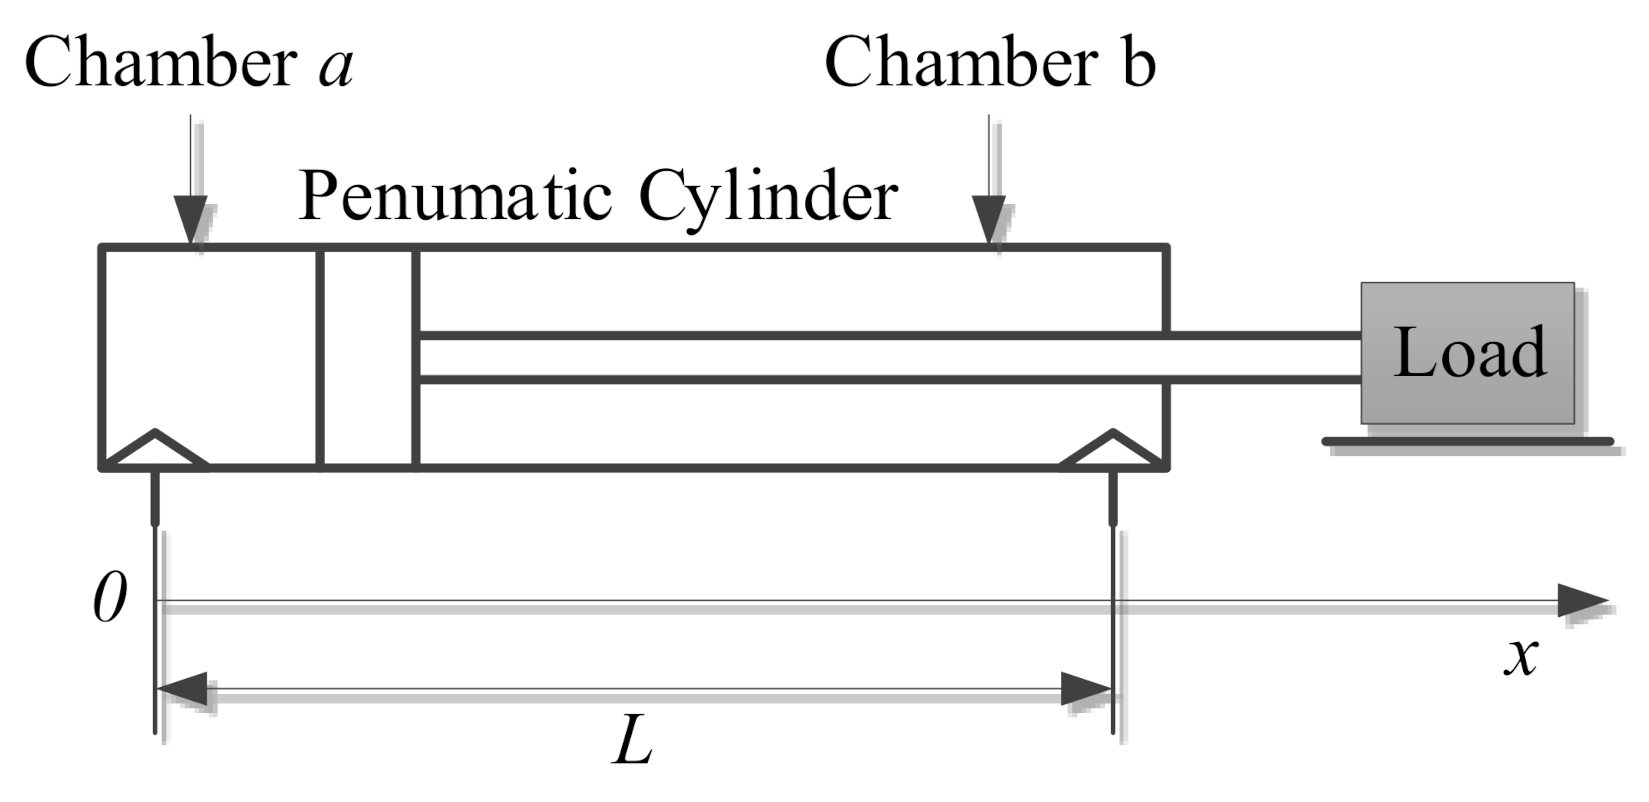
2. Configuration and Working Principles of EER Pneumatic Circuits
3. Mathematical Models of EER System
- (1)
- The working fluid (air) of the system follows all ideal gas laws.
- (2)
- There is no leakage between the chambers, and the effective areas of all intake and exhaust ports are the same.
- (3)
- The supply temperature is equal to the atmospheric temperature.
- (4)
- The air flowing into and out of chambers a and b is a stable one-dimensional flow that is equivalent to the flow of air through the nozzle contraction.
- (5)
- The working process is an isothermal process.
3.1. Continuity Equation of the EER System
3.2. Energy Equation of the EER System
3.3. State Equation of the EER System
3.4. Dynamic Equation
3.5. Gas State in Air Recovery Tank
3.6. Recovered Energy and Efficiency
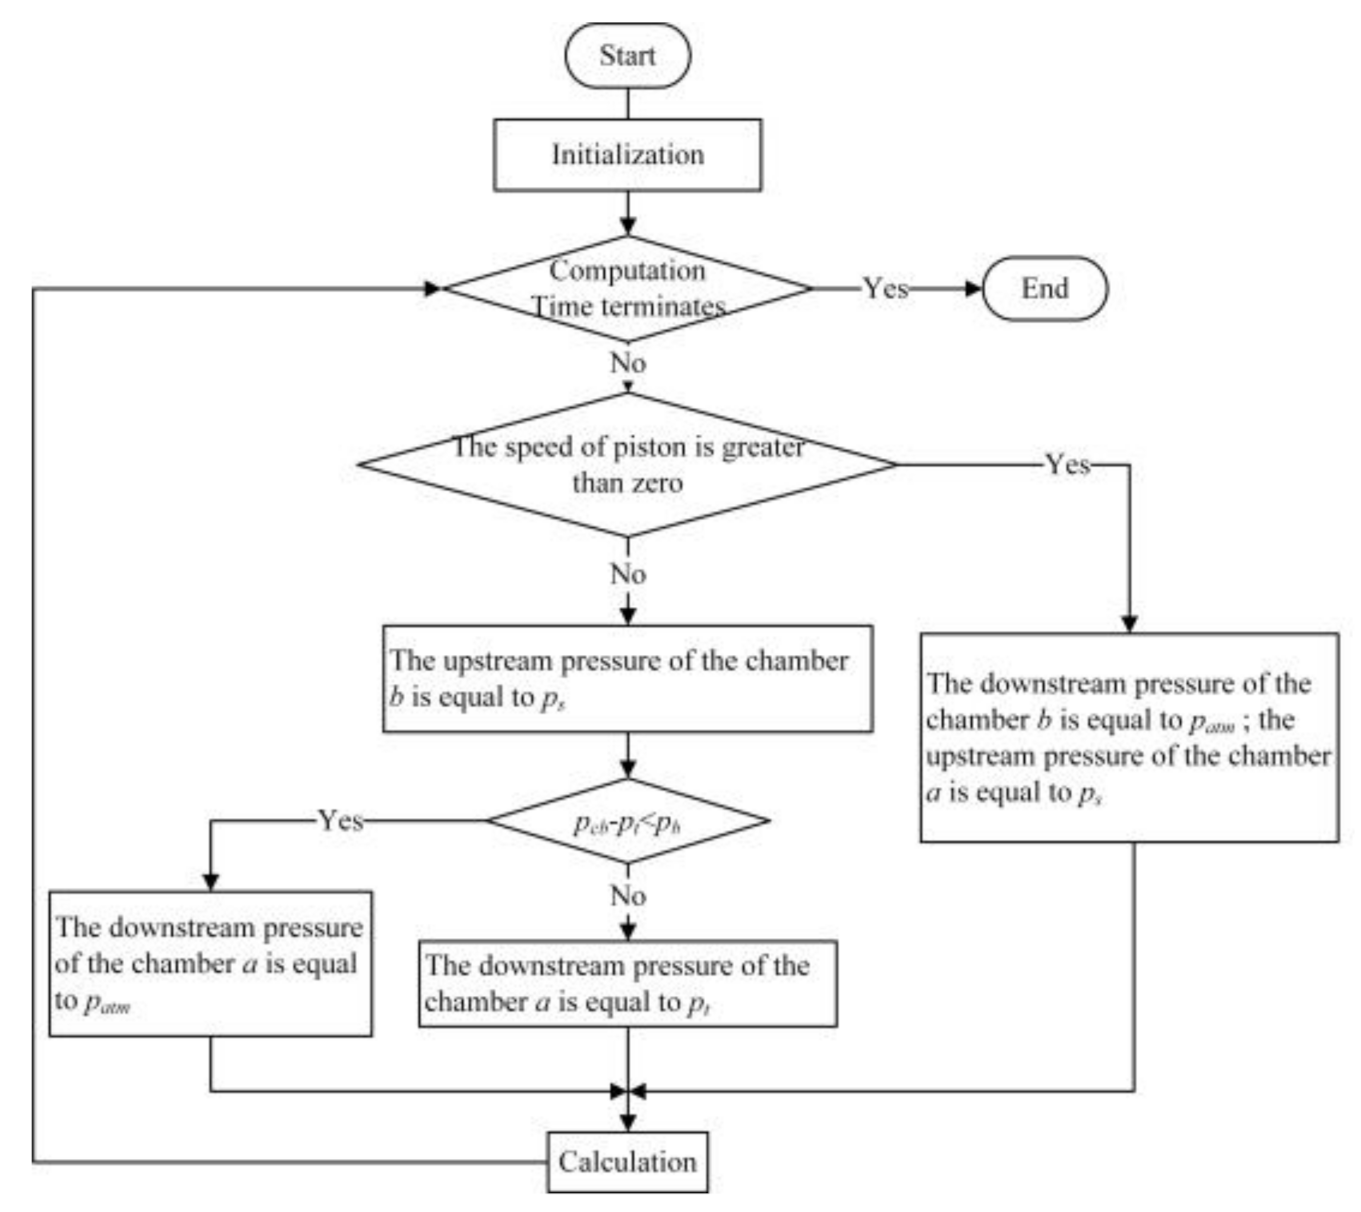
3.7. Algorithm
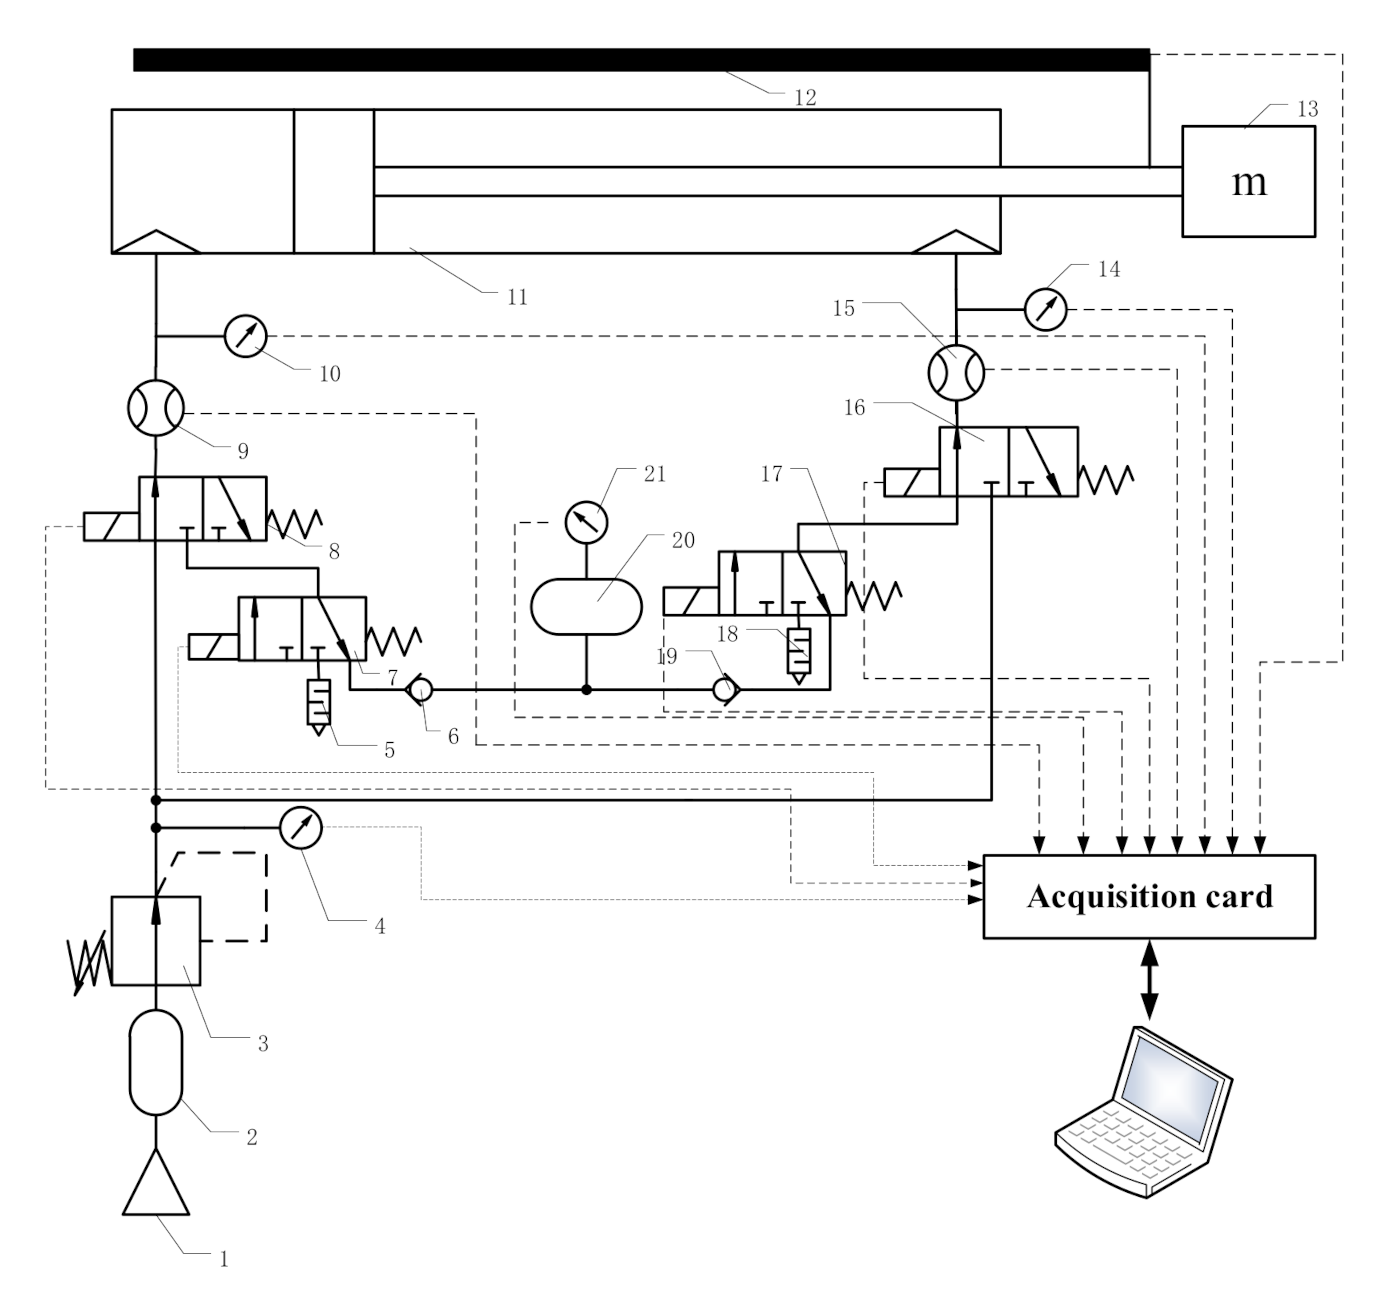
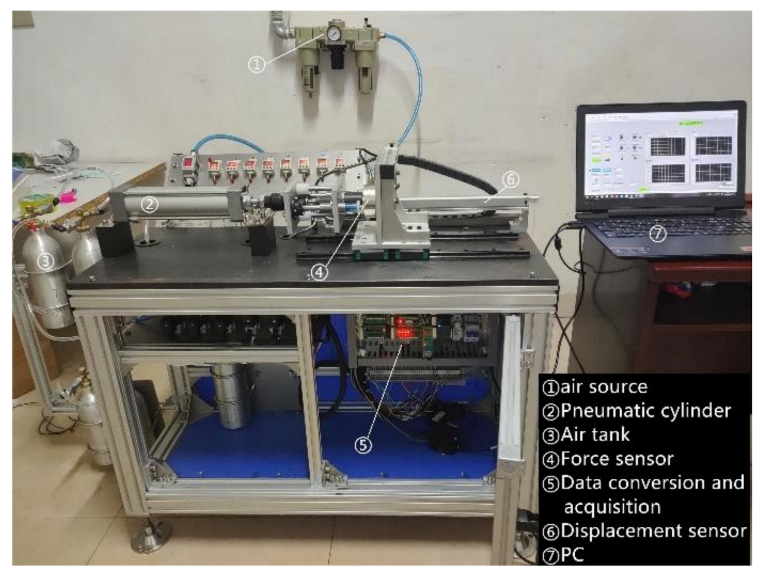
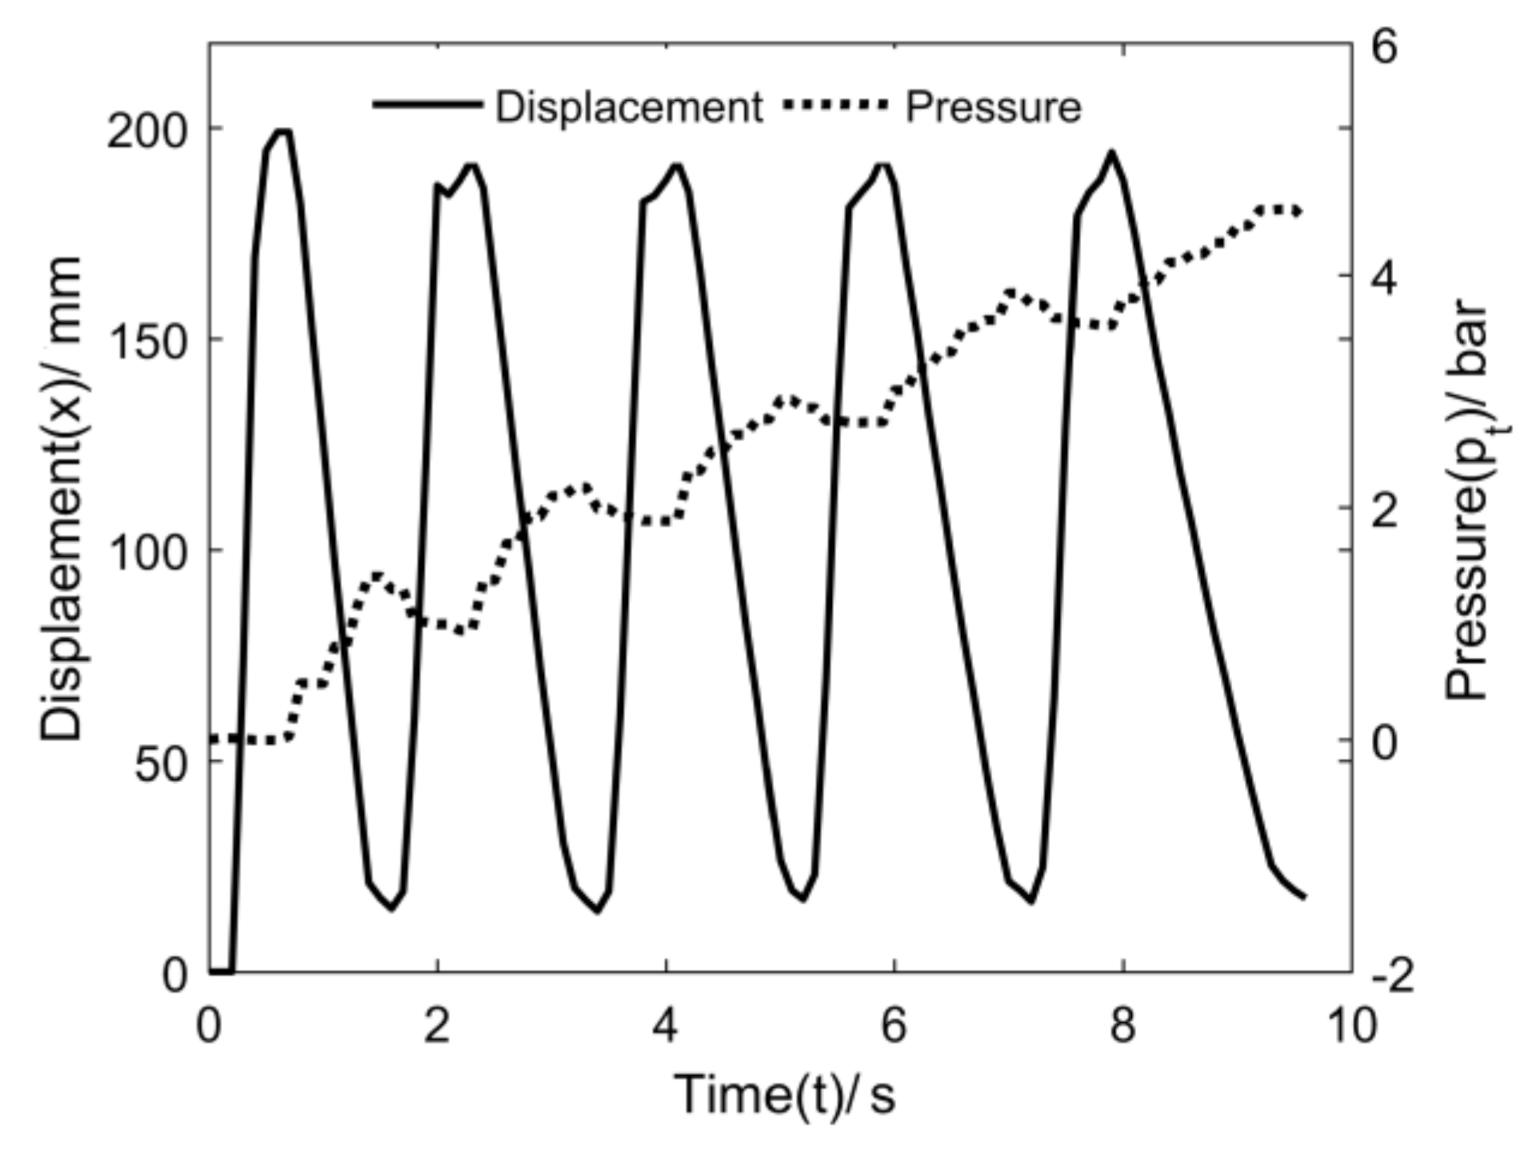
4. Experimental Verification of the Mathematical Model
5. Study of the EER System Characteristics
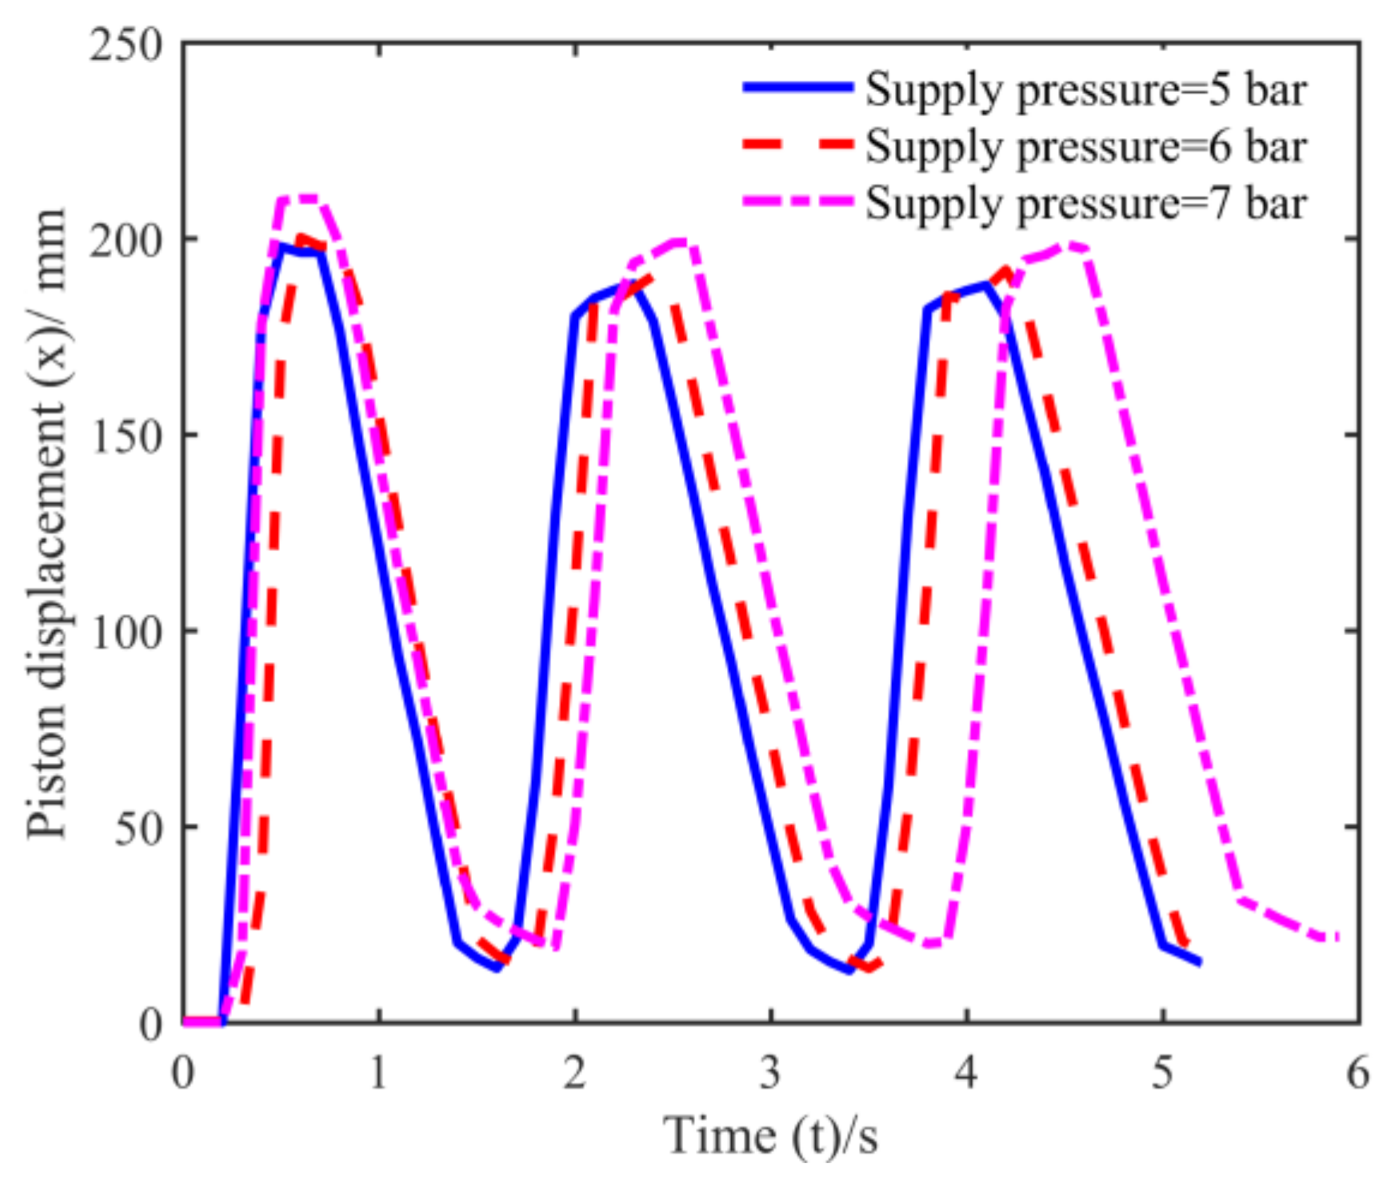
5.1. Influence of the Air Supply Pressure
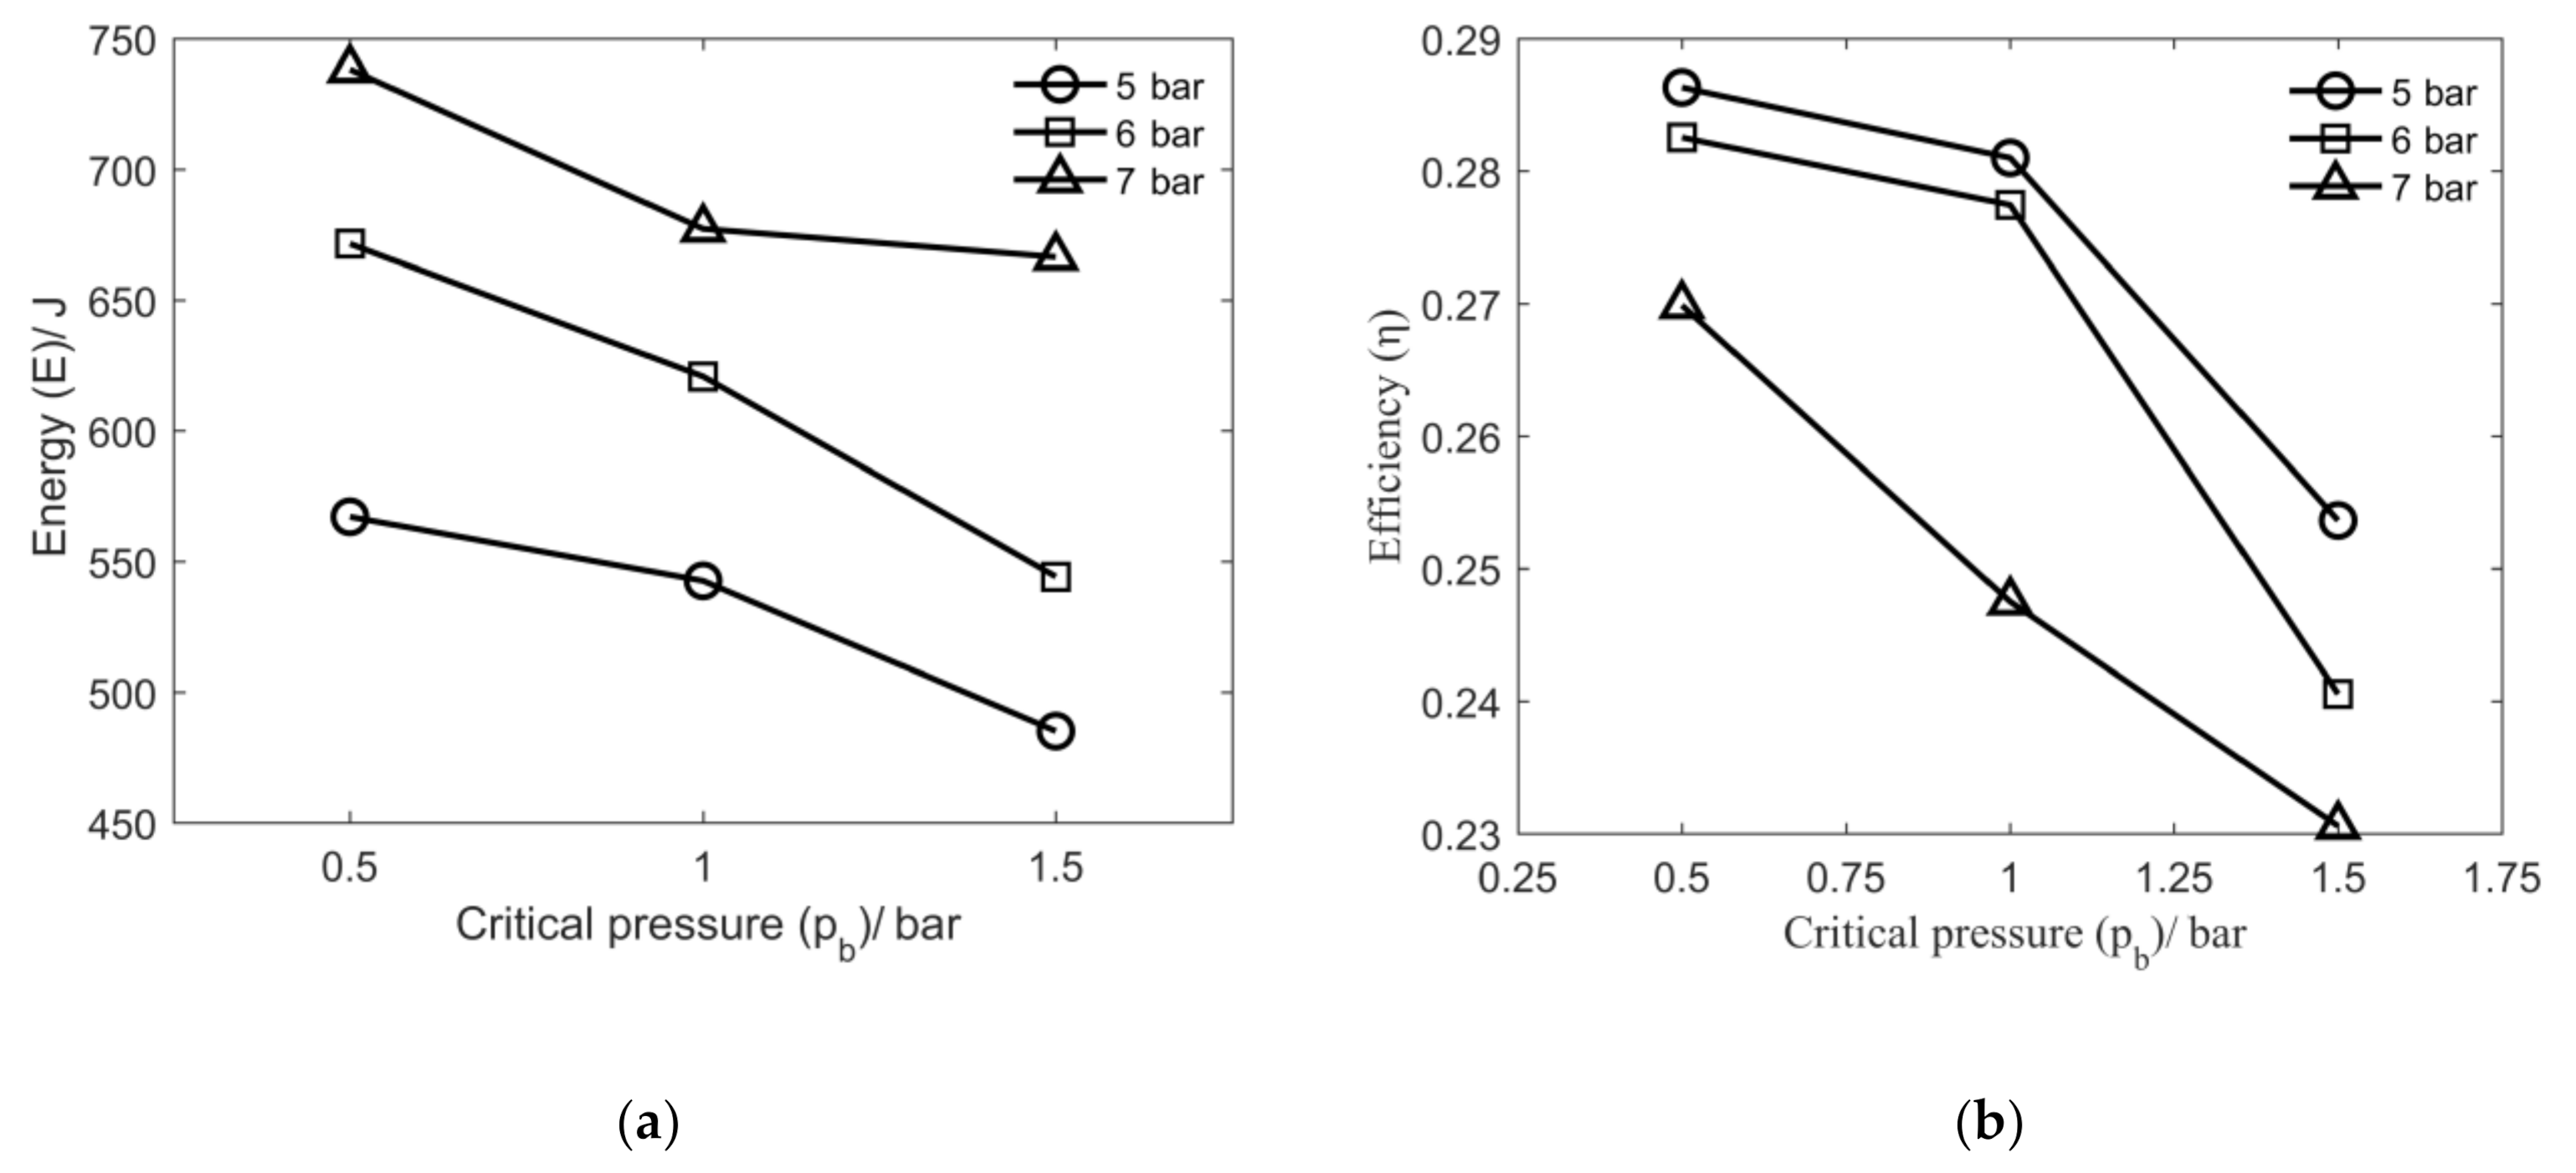
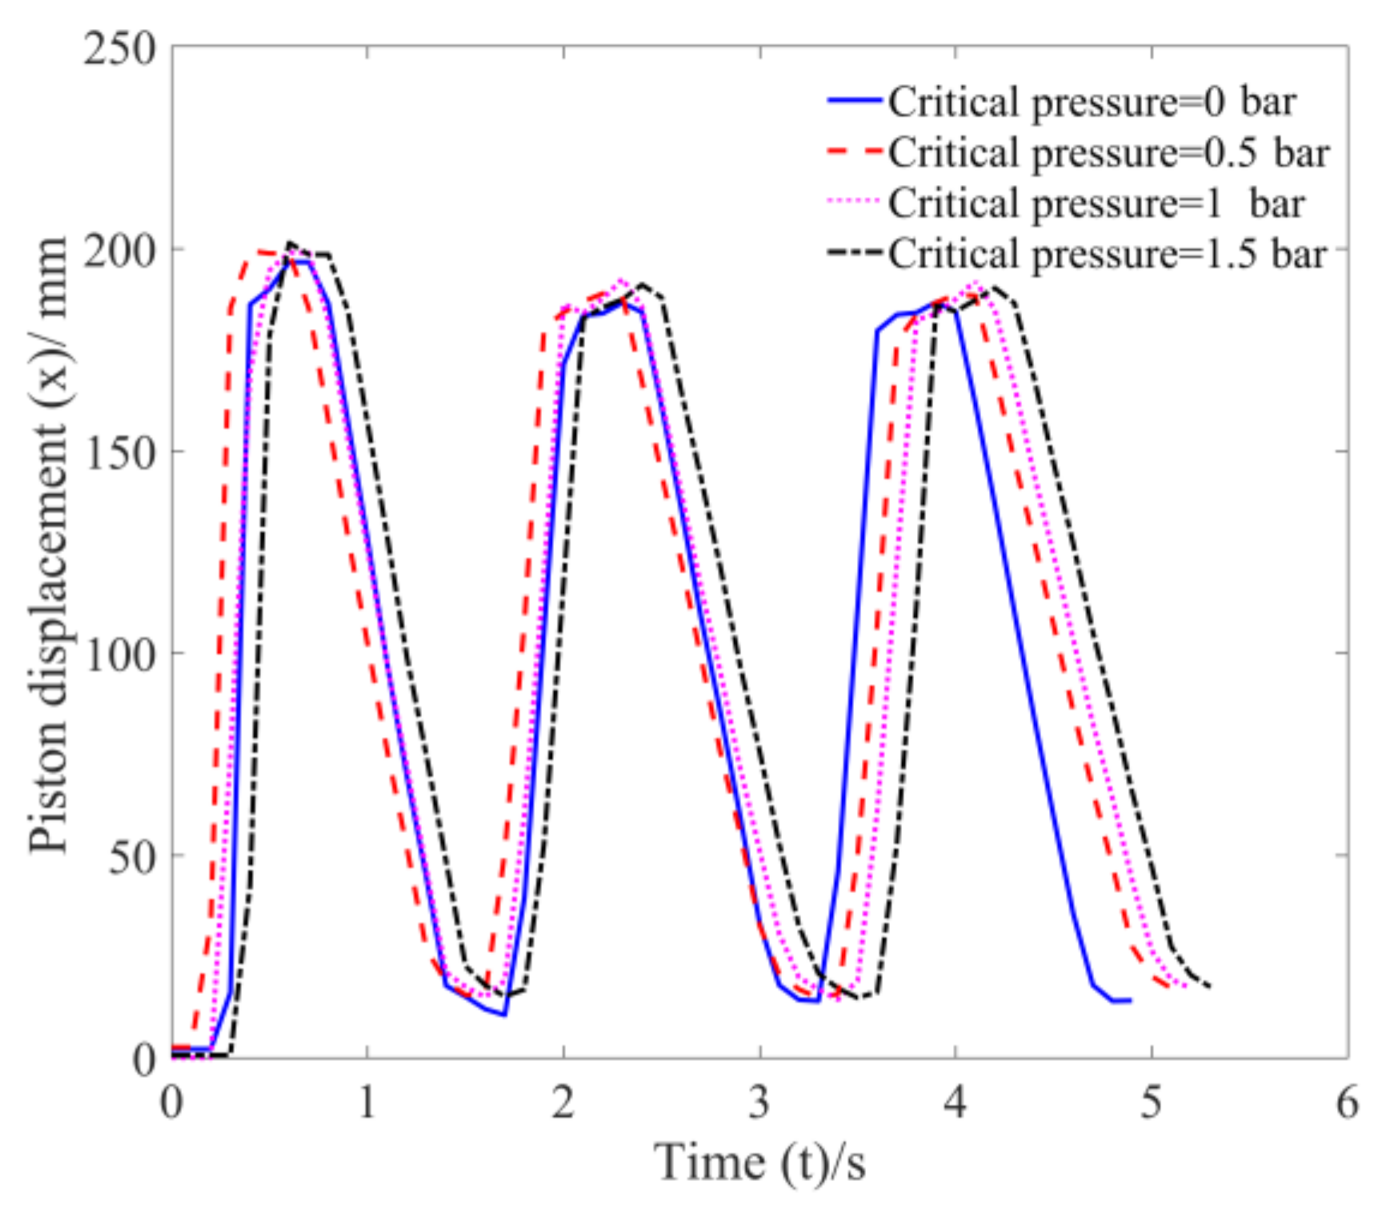
5.2. Influence of the Critical Pressure
5.3. Influence of the Gas Tank Volume
6. Conclusions
- (1)
- An EER pneumatic circuit is proposed to recycle the exhaust energy.
- (2)
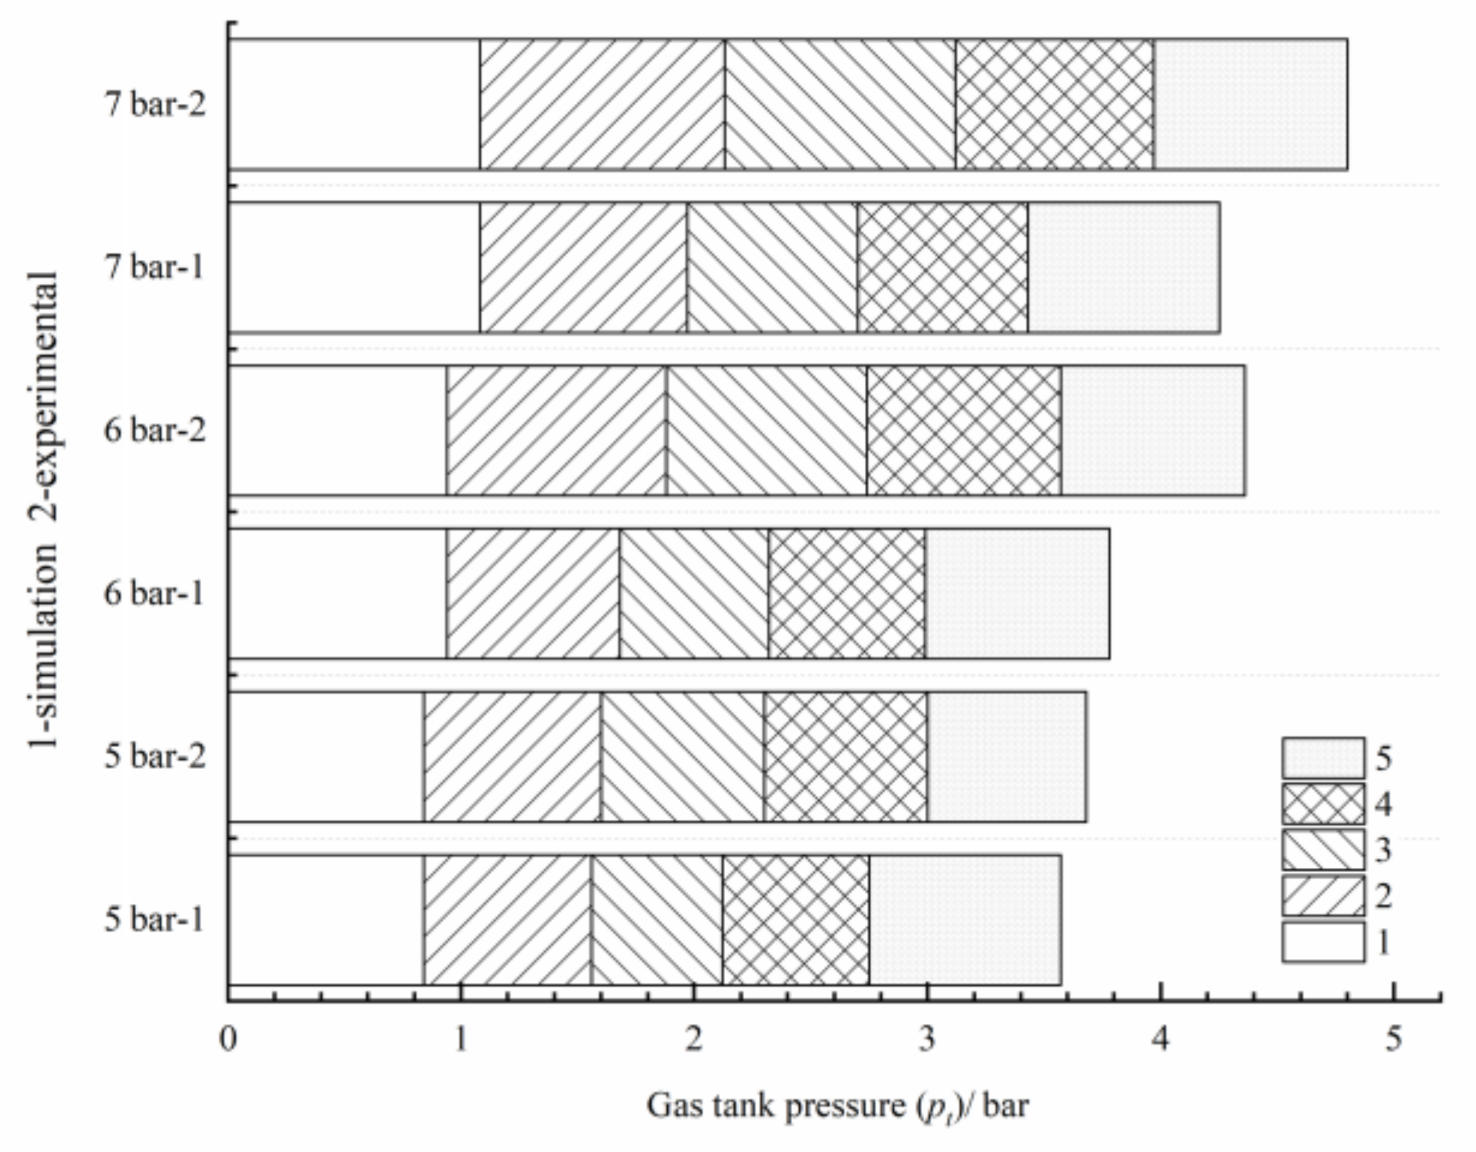
- The simulation results are in good agreement with the experimental results, which proves that the mathematical model is effective and accurate.
- (3)
- The EER characteristics are influenced by the air supply pressure, critical pressure, and volume of the gas tank. In each case, the energy recovery efficiency exceeds 23%.
- (4)
- At different critical pressures, the time required for pneumatic actuation to complete the three working cycles is different. When the critical pressure is set to 0 bar, 0.5 bar, 1 bar, and 1.5 bar, the times are equal to 4.9 s, 5.1 s, 5.2 s, and 5.3 s, respectively.
- (5)
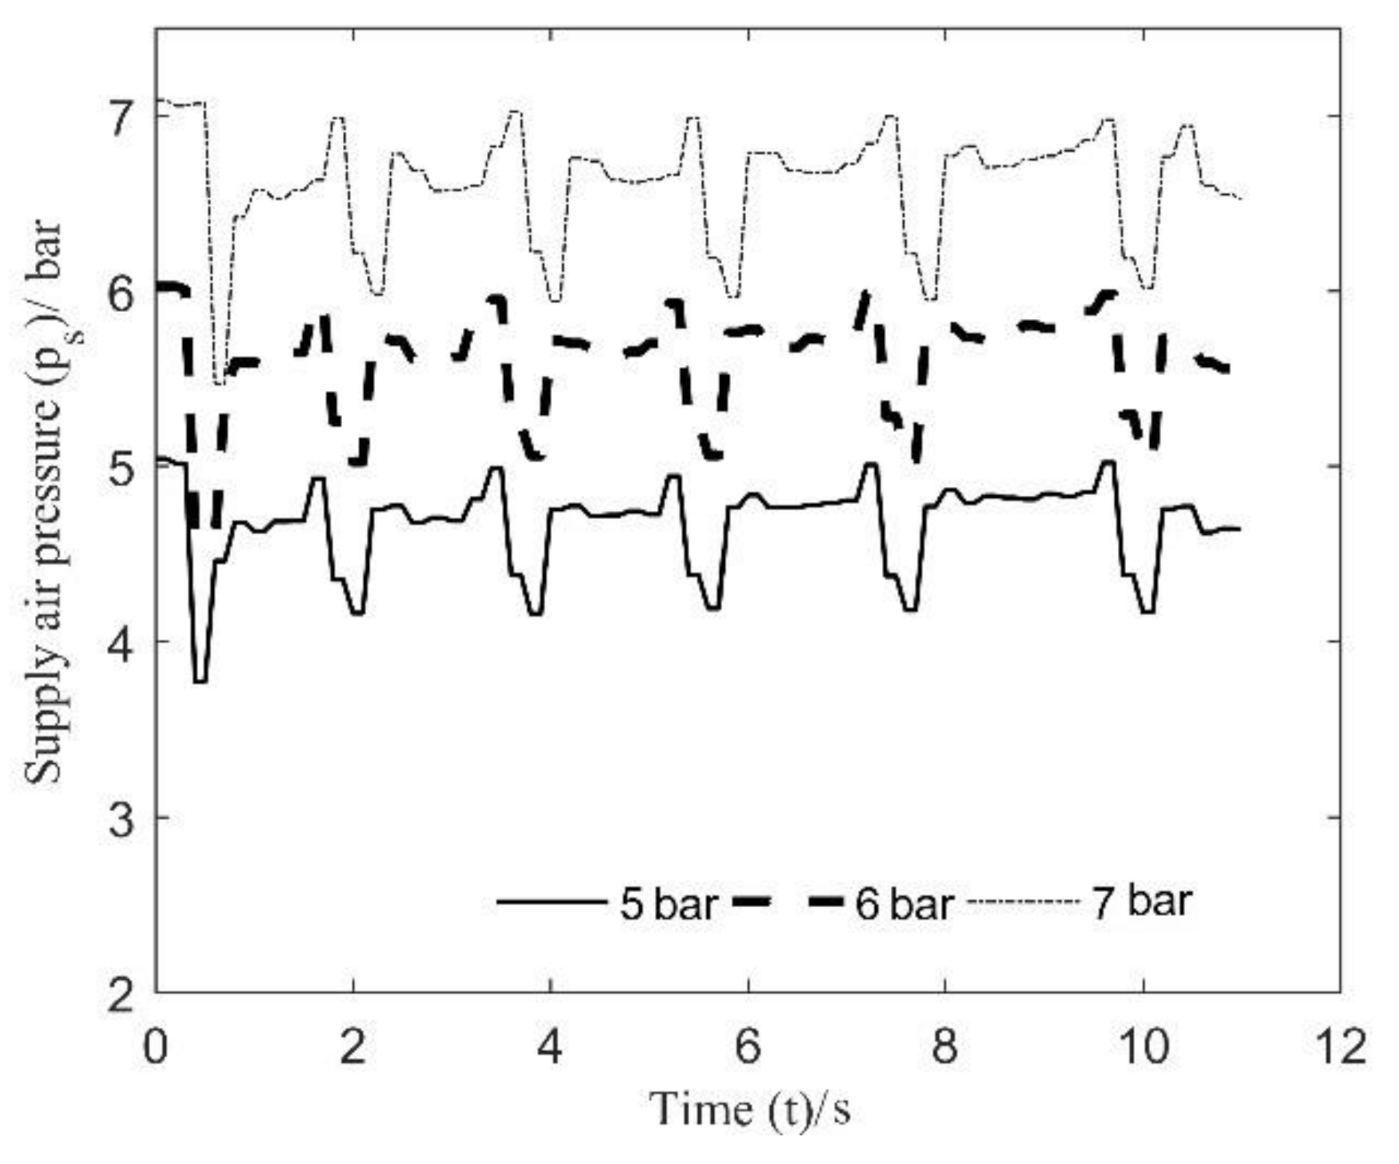
- At different air supply pressure, the time required for pneumatic actuation to complete the three working cycles is different. When the air supply pressure is set to 5 bar, 6 bar, and 7 bar, the time is equal to 5.2 s, 5.3 s, and 5.9 s, respectively.
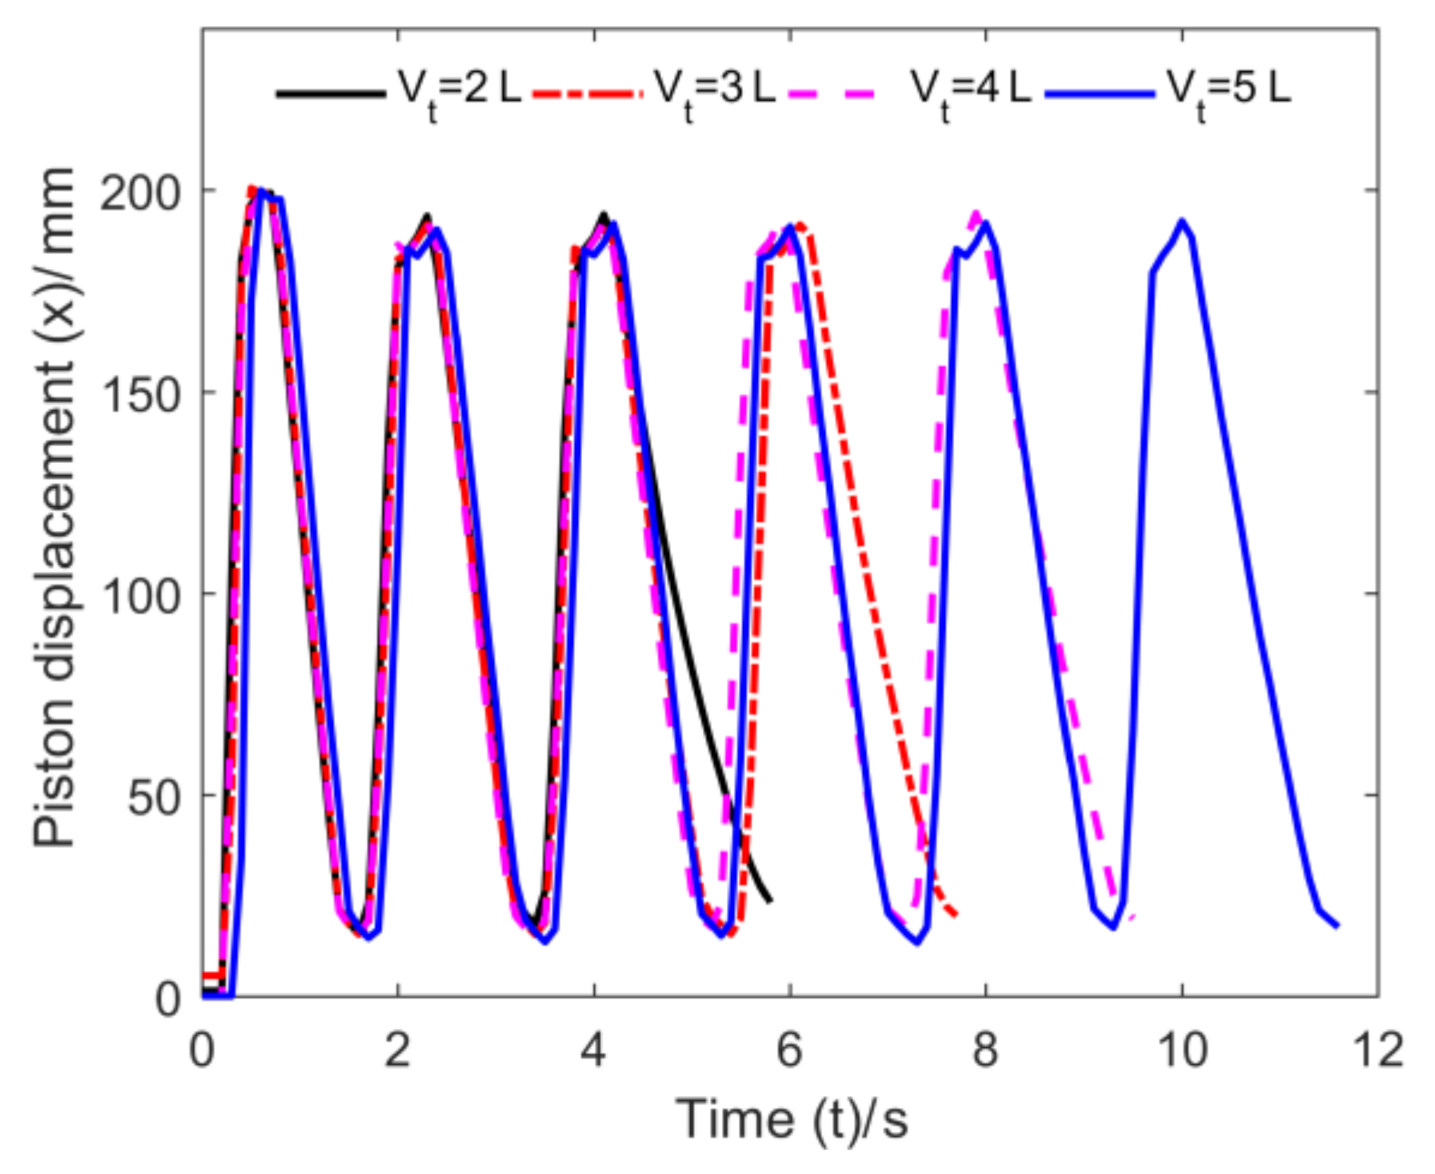
- (6)
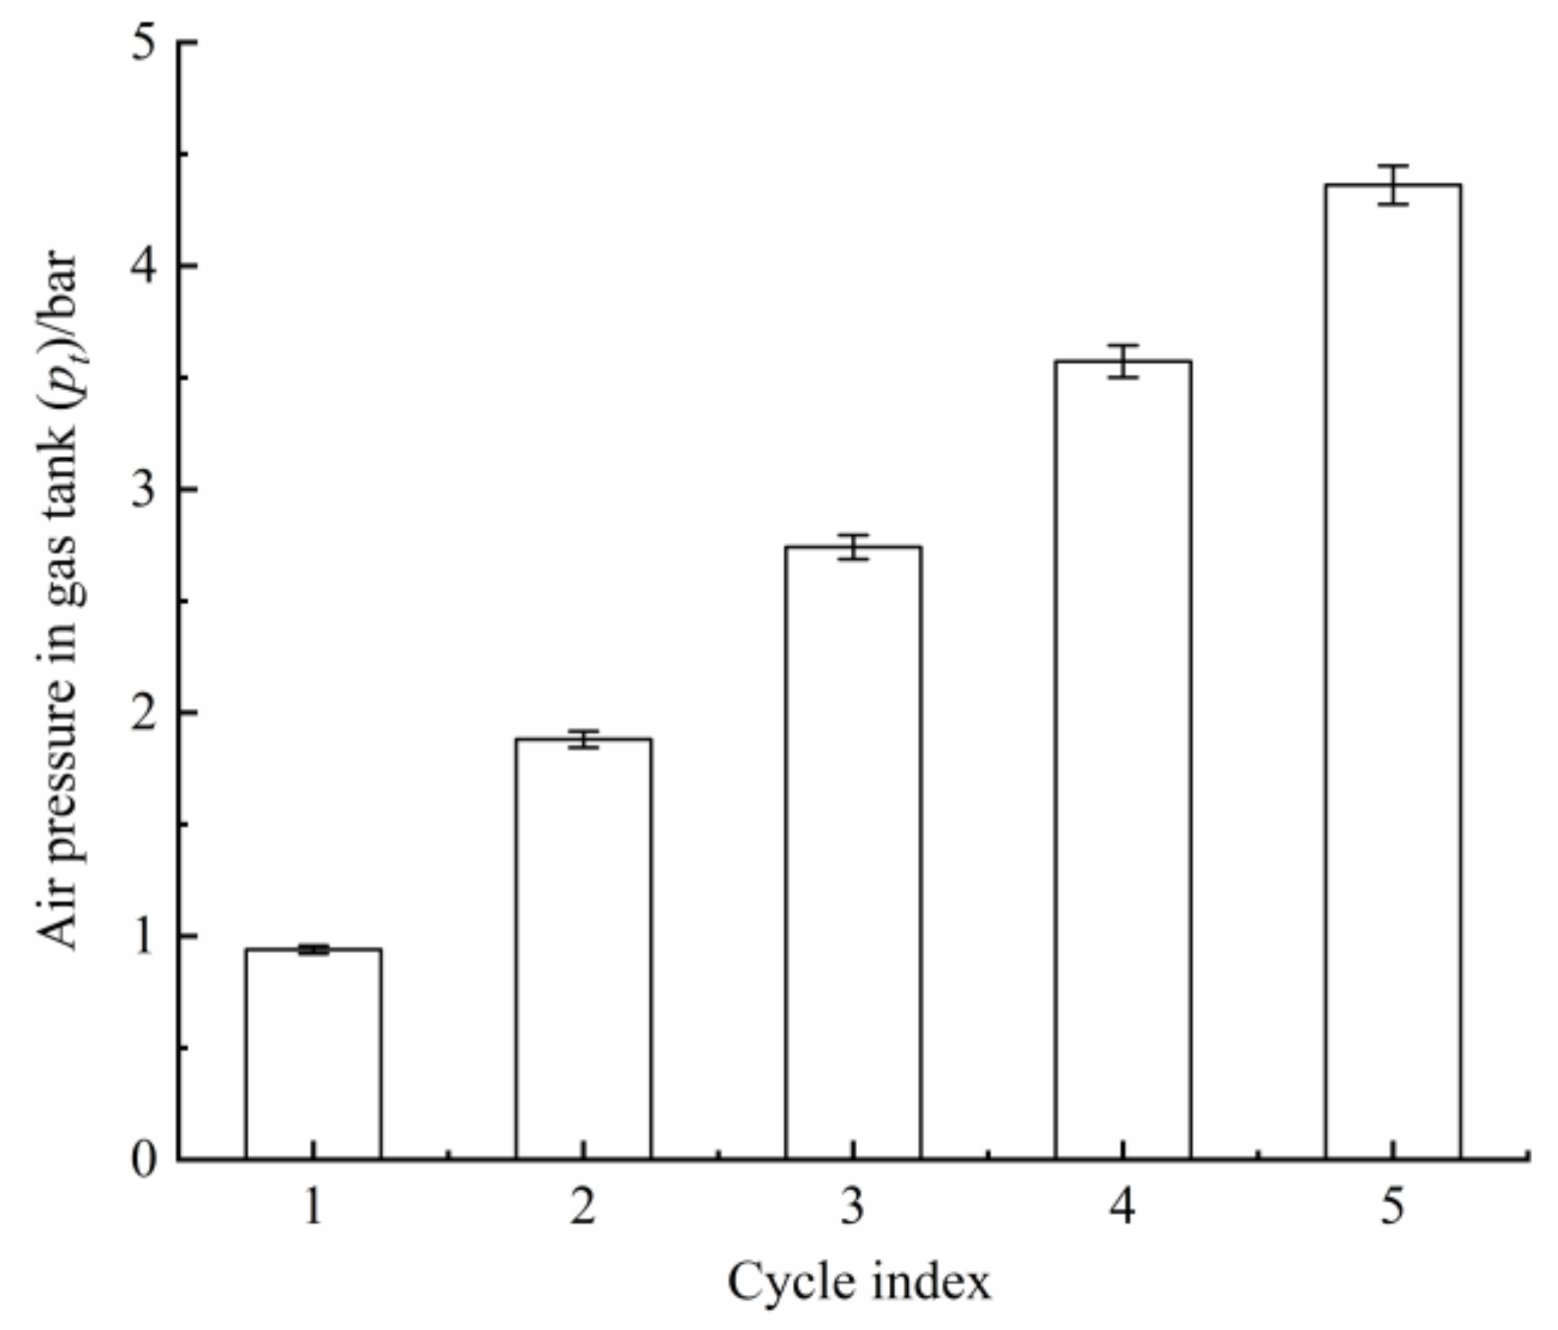
- When the volume of the gas tank is set to 2 L, 3 L, 4 L, and 5 L, the number of working cycles is 3, 4, 5, and 6, respectively.
Author Contributions
Funding
Data Availability Statement
Conflicts of Interest
References
- Saidur, R.; Rahim, N.A.; Hasanuzzaman, M. A Review on Compressed-Air Energy Use and Energy Savings. Renew. Sustain. Energy Rev. 2010, 14, 1135–1153. [Google Scholar] [CrossRef]
- Wang, J.; Pu, J.; Moore, P. A Practical Control Strategy for Servo-Pneumatic Actuator Systems. Control Eng. Pract. 1999, 7, 1483–1488. [Google Scholar] [CrossRef]
- Yusop, M.Y. Energy Saving for Pneumatic Actuation Using Dynamic Model Prediction. Ph.D. Thesis, Cardiff University, Cardiff, UK, 2006. [Google Scholar]
- Cai, M.L.; Kagawa, T. Energy Consumption Assessment of Pneumatic Actuating System Including Compressor. International Conference on Compressors and their Systems, 2nd ed.; I Mech E: London, UK, 2001; pp. 381–390. [Google Scholar]
- Wang, J.; Gordon, T. Energy Optimal Control of Servo-Pneumatic Cylinders Through Nonlinear Static Feedback Linearization. J. Dyn. Syst. Meas. Control 2012, 134, 051005. [Google Scholar] [CrossRef]
- Krzysztof, B.J.; Kuczyński, M. Low Air Consumption Control in Pneumatic Position System. IFAC Proc. Vol. 2009, 42, 147–151. [Google Scholar]
- Najjari, B.; Barakati, S.M.; Mohammadi, A. Position Control of an Electro-Pneumatic System Based on PWM Technique and FLC. ISA Trans. 2014, 53, 647–657. [Google Scholar] [CrossRef] [PubMed]
- Saravanakumar, D.; Mohan, B.; Muthuramalingam, T.; Sakthivel, G. Performance Evaluation of Interconnected Pneumatic Cylinders Positioning System. Sens. Actuators A Phys. 2018, 274, 155–164. [Google Scholar]
- Sato, K.; Sano, Y. Practical and Intuitive Controller Design Method for Precision Positioning of a Pneumatic Cylinder Actuator Stage. Speech Commun. 1983, 2, 111–114. [Google Scholar] [CrossRef]
- Li, T.C.; Wu, H.W.; Kuo, M.J. A Study of Gas Economizing Pneumatic Cylinder. J. Phys. Conf. Ser. 2006, 48, 1227–1232. [Google Scholar]
- Li, J.; Kawashima, K.; Fujita, T. Control Design of a Pneumatic Cylinder with Distributed Model of Pipelines. Precis. Eng. 2013, 37, 880–887. [Google Scholar] [CrossRef]
- Du, H.; Xiong, W.; Jiang, Z. Energy Efficiency Control of Pneumatic Actuator Systems Through Nonlinear Dynamic Optimization—ScienceDirect. J. Clean. Prod. 2018, 184, 511–519. [Google Scholar] [CrossRef]
- Du, H.; Hu, C.; Xiong, W. Applicability of Bridge-Type Pneumatic Energy-Saving Systems and Its Experimental Validation. Heliyon 2020, 6, e03826. [Google Scholar] [CrossRef]
- Du, H.; Hu, C.; Xiong, W. Energy Optimization of Pneumatic Actuating Systems Using Expansion Energy and Exhaust Recycling. J. Clean. Prod. 2020, 254, 119983. [Google Scholar] [CrossRef]
- Harris, P.; Nolan, S.; O’Donnell, G.E. Energy Optimisation of Pneumatic Actuator Systems in Manufacturing. J. Clean. Prod. 2014, 72, 35–45. [Google Scholar] [CrossRef]
- Teradhima, Y.; Kawakami, Y.; Arubaga, T.; Kawai, S. An Approach for Energy-Saving of Pneumatic Cylinders by Meter-in Circuit. In Proceedings of the 7th JFPS International Symposium on Fluid Power, Toyama, Japan, 15–18 September 2008. [Google Scholar]
- Fan, Y.; Kotaro, T.; Gangyan, L.; Toshiharu, K. Analysis of the Energy Efficiency of a Pneumatic Booster Regulator with Energy Recovery. Appl. Sci. 2017, 7, 816. [Google Scholar]
- Harris, P.; O’Donnell, G.E.; Whelan, T. Energy Efficiency in Pneumatic Production Systems: State of the Art and Future Directions. In Proceedings of the 19th CIRP International Conference on Life Cycle Engineering, Berkeley, CA, USA, 23–25 May 2012; Springer: Berlin/Heidelberg, Germany, 2012. [Google Scholar]
- Hepke, J.; Weber, J. Energy Saving Measures on Pneumatic Drive Systems. In Proceedings of the 13th Scandinavian International Conference on Fluid Power, Linkoping, Sweden, 3–5 June 2013; pp. 475–483. [Google Scholar]
- Shi, Y.; Jia, G.W.; Cai, M.L.; Xu, W.Q. Study on the Dynamics of Local Pressure Boosting Pneumatic System. Math. Probl. Eng. 2015, 2015, 1–11. [Google Scholar] [CrossRef]
- Shi, Y.; Cai, M.L. Dimensionless Study on Output Flow Characteristics of Expansion Energy Used Pneumatic Pressure Booster. J. Dyn. Syst. Meas. Control 2013, 135, 1–8. [Google Scholar] [CrossRef]
- Shi, Y.; Cai, M.L. Dimensionless Study on Outlet Flow Characteristics of an Air-Driven Booster. J. Zhejiang Univ. Sci. A 2012, 13, 481–490. [Google Scholar] [CrossRef]
- Merkelbach, S.; Murrenhoff, H. Exergy Based Analysis of Pneumatic Air Saving Measures. In Proceedings of the ASME/BATH 2015 Symposium on Fluid Power and Motion Control, Chicago, IL, USA, 12–14 October 2015. [Google Scholar]
- Cummins, J.J.; Barth, E.J.; Adams, D.E. Modeling of a Pneumatic Strain Energy Accumulator for Variable System Configurations with Quantifified Projections of Energy Effificiency Increases. In Proceedings of the ASME/BATH Symposium on Fluid Power & Motion Control, Chicago, IL, USA, 12–14 October 2015. [Google Scholar]
- Luo, X.; Wang, J.H.; Sun, H.; Derby, J.W.; Mangan, S.J. Study of a New Strategy for Pneumatic Actuator System Energy Efficiency Improvement via the Scroll Expander Technology. IEEE/ASME Trans. Mechatron. 2013, 18, 1508–1518. [Google Scholar] [CrossRef]
- Luo, X.; Sun, H.; Wang, J.H. An Energy Effificient Pneumatic-Electrical System and Control Strategy Development. In Proceedings of the IEEE 2011 American Control Conference, San Francisco, CA, USA, 29 June–1 July 2011. [Google Scholar]
- Doll, M.; Neumann, R.; Sawodny, O. Energy Efficient Use of Compressed Air in Pneumatic Drive Systems for Motion Tasks. In Proceedings of the IEEE 2011 International Conference on Fluid Power and Mechatronics, Beijing, China, 17–20 August 2011; pp. 340–345. [Google Scholar]
- Yu, Q.; Zhai, J.; Tan, X.; Fang, G. Dimensionless Study on Efficiency of New Exhaust Residual Pressure Utilization System. J. Beijing Univ. Aeronaut. Astronaut. 2020, 46, 1453–1459. [Google Scholar]
- Shi, Y.; Cai, M. Working Characteristics of Two Kinds of air-Driven Boosters. Energy Convers. Manag. 2011, 52, 3399–3407. [Google Scholar] [CrossRef]
- Cai, M.L. The Charge and Discharge of a Fixed Volume Tank. Hydraul. Pneum. Seals 2007, 3, 43–47. [Google Scholar]
- Yang, A.; Pu, J.; Wong, C.B. By-Pass Valve Control to Improve Energy Efficiency of Pneumatic Drive System. Control Eng. Pract. 2009, 17, 623–628. [Google Scholar] [CrossRef]
- Blagojević, V.; Šešlija, D.; Stojiljković, M. Efficient Control of Servo Pneumatic Actuator System Utilizing By-Pass Valve and Digital Sliding Mode. Sadhana 2013, 38, 187–197. [Google Scholar] [CrossRef]


| Symbol | Quantity | Value |
|---|---|---|
| R | Gas constant | 287 J/kg·K |
| Tamb | Ambient temperature | 293 K |
| pamb | Ambient pressure | 101,000 Pa |
| ha | Heat transfer coefficient of the left side | 30 W/(m2·K) |
| hb | Heat transfer coefficient of the right side | 20 W/(m2·K) |
| ht | Heat transfer coefficient of the gas tank | 20 W/(m2·K) |
| Aka | Effective area of piston of chamber a | 0.0031 m2 |
| Akb | Effective area of piston of chamber b | 0.0028 m2 |
| κ | Specific heat ratio | 1.4 |
| M | Mass of load | 30 kg |
| Fs | Maximum static friction force | 110 N |
| Fc | Coulomb friction force | 80 N |
| β | Viscous coefficient of pneumatic cylinder | 10 N/(m/s) |
| μ | Dynamic friction factor | 5 |
| L | Pneumatic cylinder stroke | 0.2 m |
| Ae | Effective area | 0.0001 m2 |
| Vt | Volume of air recovery tank | 0.004 m3 |
Publisher’s Note: MDPI stays neutral with regard to jurisdictional claims in published maps and institutional affiliations. |
© 2021 by the authors. Licensee MDPI, Basel, Switzerland. This article is an open access article distributed under the terms and conditions of the Creative Commons Attribution (CC BY) license (http://creativecommons.org/licenses/by/4.0/).
Share and Cite
Yu, Q.; Zhai, J.; Wang, Q.; Zhang, X.; Tan, X. Experimental Study of a New Pneumatic Actuating System Using Exhaust Recycling. Sustainability 2021, 13, 1645. https://doi.org/10.3390/su13041645
Yu Q, Zhai J, Wang Q, Zhang X, Tan X. Experimental Study of a New Pneumatic Actuating System Using Exhaust Recycling. Sustainability. 2021; 13(4):1645. https://doi.org/10.3390/su13041645
Chicago/Turabian StyleYu, Qihui, Jianwei Zhai, Qiancheng Wang, Xuxiao Zhang, and Xin Tan. 2021. "Experimental Study of a New Pneumatic Actuating System Using Exhaust Recycling" Sustainability 13, no. 4: 1645. https://doi.org/10.3390/su13041645