Article

A Step-by-Step Process towards an Evolutionary Policy Encouraging the Adoption of Sustainable Business Models

1
Department of Management, University of Bologna, via Capo di Lucca, 34, 40126 Bologna, Italy
2
Department of Civil, Chemical, Environmental and Materials Engineering, University of Bologna, via Terracini 28, 40131 Bologna, Italy
*
Author to whom correspondence should be addressed.
Sustainability 2021, 13(3), 1176; https://doi.org/10.3390/su13031176
Submission received: 1 October 2020 / Revised: 18 January 2021 / Accepted: 18 January 2021 / Published: 22 January 2021
(This article belongs to the Collection Sustainable Public Administration)

Abstract

:
The increasing awareness on environmental issues and their implications for society and economy, has led policymakers to rethink the legislative and financial measures supporting companies to innovate their business. As a result, companies are encouraged to integrate corporate sustainability (CS) into their value creation. Different from the past approaches, the current policy making process has been inspired by a multi-value creation system, aimed to deeply analyze the present situation, and identify the bottlenecks to design further steps to be taken. In this context, regional authorities cover a pivotal role in financing the pre-competitive phase of innovative and sustainable business models (SBMs). A survey was launched in the Emilia Romagna Region (ERR), analyzing the main factors contributing to maximizing CS. This paper investigates supply chain, welfare, environmental management as well as planning, control and communication strategy together with ecological footprints such as materials, energy, water, plastics, and waste ecological footprints. It gives a twofold contribution: first, it sets the stage for the construction of a theoretical model representing an SBM, and second, it gives a practical contribution by supporting the public administration decision-making in adopting a breakthrough roadmap facilitating the value transfer from industry to society.

1. Introduction

The increasing awareness about resource depletion, the impact of anthropogenic activities on the environment and their consequences on society and economy has led the international community to rethink the current production models and consumption patterns [1]. While complying with this intention, the UNEP published the Agenda 2030 [2] providing a shared global vision towards a sustainable future with 17 Sustainable Development Goals (SDGs). Among the SDGs, the goals 8 “Decent jobs and economic growth”, 9 “Industry, Innovation and Infrastructure” and 12 “Responsible production and consumption” fit with the “doing more with less” philosophy aimed to decouple the economic growth from the environmental footprint. Economic activities cover a fundamental role in the process of sustainable transition. As is generally known, industries and enterprises are among the major entities responsible for greenhouse gases (GHGs). The IPPC annual report reveals that global industry and waste/wastewater GHG emissions, have grown from 10.4 GtCO2eq in 1990 to 15.4 GtCO2eq in 2010 [3]; in Europe, it contributes to 40% of total emissions. Many measures have been enforced by governments over the years to limit social and environmental negative externalities. The recent economic and normative efforts on decarbonization have led to small incremental changes in large energy intensive industries and small–medium-sized enterprises (SMEs). However, the more frequent and acute weather events, such as droughts, storms and heat waves demonstrate that there is still much to be done. For years, social and economic externalities generated by firms have been ceded to governments by imposing taxes, regulations and penalties. Nowadays, pro-active measures aimed at encouraging companies to pursue shared value are essential. Incentives fostering innovation and competitiveness have become imperative to maximize the benefits that a sustainable business model (SBM) can provide to the environment and the society. Companies are therefore called upon to actively rethink their business in a sustainable and responsible way. A harmonized vision of the future is essential to consolidate the concept of sustainable development. It follows that the stakeholder engagement becomes a backbone to explore the socio-technical pathways that might support the achievement of such a vision [4]. The cooperation with external stakeholders allows us to better achieve that goal and maximize the benefits coming from a bottom-up approach and contributing to creating a positive impact for the local community [5,6]. In this landscape, the presence of the public administration is fundamental in promoting innovation and sustainability among enterprises. To enable crosspollination and mutual collaboration, new forms of interaction between state and non-state actors are required [7]. In this context, the role of public organizations can be considered as the connecting point between the SDGs and corporate strategies, thus translating global aspirations into local contexts. As pointed out by Heinrichs and Laws, collaborative decision-making processes reinforce the capacity of the public administration in boosting the diffusion of sustainability behavior in the local economy [8]. The orientation of corporate strategies towards a sustainable future becomes the basic principle to plan a set of smart and integrated measures on one side and design sustainable business models on another. Companies should reconnect their value proposition with the social progress [9]. Institutions should support this transition, moving from conventional economic success to multi-value creation.
The present work describes the step-by-step process introduced by the Department of Economy of Knowledge, Employment and Business of the Emilia Romagna Region (Italy) since 2014, in order to foster sustainability in local companies. This paper focuses on the results provided by a questionnaire on SBMs that represents the means by which the region investigates the performance of local companies and identifies issues hampering sustainability in the regional economy. This analysis is the starting point to strategically plan and allocate resources in an efficient way, in line with the sustainability agenda. The article is organized as follows: Section 2 provides a comprehensive theoretical overview of corporate sustainability concepts and their implications on SBMs. Section 3 highlights the role of public administration by describing the framework of business-oriented measures established by public authorities to reduce negative environmental externalities. Section 4 describes the process introduced by the regional department to define a state-based funding scheme that urges companies to redesign their business model in a sustainable way. Methods and results have been, respectively, presented in Section 5 and Section 6. Finally, Section 7 discusses the key findings of the research as well as limitations and further development.

2. Firms Innovation: From Corporate Sustainability to Sustainable Business Models

From the point of view of a regulatory body, such as the Italian regions, that promote, plan, incentivize and control the economic activities within their territory, it is necessary to provide a clear understanding of Corporate Sustainability (CS) and SBMs. CS is currently adopted to show the commitment towards sustainable issues. It describes a wider picture compared to corporate social responsibility (CSR) that is defined as “the commitment of business to contribute to sustainable economic development, working with employees, their families, the local community and society at large to improve their quality of life” [10]. We are witnessing a transitioning process where companies do not only have to relate their activities to the wellbeing of society, but have to totally rethink their business to maximize the sustainability profile in each area of their corporate governance. Although CS and CSR have evolved from different backgrounds, recent studies show that CSR and CS are converging [11] towards a common goal that is “meeting the needs of the present without compromising the ability of future generations to meet their own needs” [12]. Therefore, CSR becomes part of a wider construct where sustainability strategies are integrated in internal operations and processes as well as external pathways, such as the consumer behaviors and attitudes [13,14,15]. While societal responsibility covers all the dimensions of a company’s impact on society [16], CS deals with economic responsibility, social equity, and environmental integrity [17,18]. Because of that, CS is perceived as “the meeting of the needs of a firm’s direct and indirect stakeholders without compromising its ability to meet the needs of the future stakeholders as well” [19,20]. To be competitive and attractive, sustainability strategies must become part of the business model, securing the long-term viability of an organization by optimizing managerial and innovative capabilities, while satisfying customers’ and other stakeholders’ needs in compliance with the limits of the ecological and social systems [21,22,23,24]. CS management represents an attractive opportunity to SMEs, given the chances of access in new markets and customers, as well as the reduction in costs and higher returns on investment [5,25]. The aim of simultaneously considering all these aspects is represented by the so-called SBM that identifies the appropriate resources and values in the ecosystem [26,27], going beyond the organization and approaching the market in relation to the triple bottom line (TBL) of sustainability, where environment and society are considered as shareholders [28,29,30]. Consequently, SBM represents a link between the firm and the system level [1]. The dual perspective requires the application of systemic thinking and planning where government relationships, stakeholder interests and community development must be considered together in order to achieve a strict alignment between the natural mechanism and the human needs [31,32]. It follows that sustainability requires the engagement of multi-stakeholders to define a shared vision of the future and to explore the socio-technical pathways that might support the achievement of such a vision [4]. The cooperation with external stakeholders allows to better achieve that goal and maximize the benefits coming from a bottom-up approach [5], contributing to creating a positive impact for the local community [6], hence indirectly achieving the goal of CSR. In summary, the corporate sustainable strategy is “essential for sustainable development, but also for the successful management of the company” [33]. Yet, as pointed out by Engert et al., research about sustainable business is still mainly theoretical and not exhaustive [34]. Due to the complexity of multi-level economic, social and environmental interconnections, there is no comprehensive framework in designing SBM. A clear understanding of the current impacts and responsibilities of each stakeholder on the ecological issues is also crucial [35]. The systemic understanding of the present situation allows for a better identification of the inefficiencies and stimulates the design of tools and policies that can overcome the critical issues and incentivize the managers towards pro-active behavior [36]. In this context, economic activities are required to incorporate the major societal challenges into their business, to contribute to generating value for themselves and the overall society, both in a present and future scenario. In order to translate CS in SBM, a clear overview of the current situation is needed as is an understanding of how to internalize environmental externalities and how to re-design products, processes and/or services by promoting transformational innovation while, at the same time, ensuring the long-term profitability of the company as well as the system in which the company works (see Figure 1) [37].
Socio-technical innovation, together with ethical initiatives, may strongly benefit the society and contribute to achieving a desirable future through a value-sharing process [38]. This means that the value created can no longer be managed internally from companies, due to the characteristics of all stakeholders participating to its co-creation [39]. Moving towards an SBM needs massive investments in organizational and financial operations. This can be done through a radical or evolutionary transformation [40]. While the first implies huge economic availabilities and is typical in large corporations, the second is common in SMEs that necessitate a facilitating process [41,42]. Consequently, the presence of the public administration is fundamental in promoting innovation and sustainability among enterprises.

3. The Role of Policies and Incentives in Fostering Corporate Sustainability

It has been suggested that incremental environmental improvements carried out by individual companies may be inadequate to contend with the global environmental issues. The CSR, and consequently CS, has promoted a change in the manner of doing sustainability at the corporate level, moving from individual to collective behaviors by working beyond their own legal boundaries and operating in a broader social context. It follows that corporate sustainable strategies must be aligned with those designed by policy and decision makers [43]. At the same time, policy and decision makers bear a great responsibility in introducing new measures of fostering firms to innovate and rethink their business in a sustainable way [44]. It follows that the governments cover a fundamental role in supporting the transition pathways towards a broader value-network [41]. Despite the economic and regulatory efforts, a wide range of economic activities still have inert responses to the call for sustainability [45]. Many factors can hamper this process: from the lack of investments, capabilities, and competencies to the missing external levers and incentives.
One of the main concerns must be identified in the insufficient measures provided by the governmental bodies so far. According to the policy analysis pointed out by Schneider and Ingram [46], five types of policy tools exist: authority, incentive, capacity, symbolic and hortatory, and learning tools. The policy capturing the TBL of sustainability is quite a new field of research in politics theory. Lozano and Garcia underline that knowledge about the implementation and institutionalization of sustainability is still under-researched. The more experienced measures on environmental sustainability have been mostly of a command-and-control (CAC) and market-based (MB) type, traditionally focused on the economic value of natural resources, thus ignoring values that are not captured by the markets. While the first focuses on setting limits in emissions and releases, the second refers to taxation, in terms of tariffs, fees, charges, levies and pricing policies aimed to internalize externalities and address market failures. These systems are considered inefficient by a wide range of economists [47,48,49,50] evaluating the neoclassical approaches as limiting factors for sustainable innovation. Beyond the well-known problem of measuring and assessing externalities, the establishment of taxes and limits is seen as additional costs and/or efforts compromising the revenue and limiting the stimulation for the industrial stakeholders to go further than simply hedging over set requirements [51,52].
At the same time, a passive system does not actively stimulate stakeholders. As highlighted by Aragón-Correa and Sharma [53] and Goetz [54], MB instruments may push stakeholders to stop practicing unsustainable actions, but they do not encourage voluntary behavior change. Nevertheless, in the emerging trend on sustainable policy planning and designing, critical issues are identified in the approach used to foster sustainability and an integrated framework of economic, social and environmental policies has not been well-established [52]. This has contributed to fragmented innovation and has limited radical changes able to involve a wider range of stakeholders, going well beyond the industry. In recent years, win–win solutions have been explored through the implementation of participatory processes fostering knowledge creation, transfer and sharing among all the stakeholders that make up the local community [55]. Porter and van der Linder [44] emphasize the concept by which evolutionary policy lives up, not only to sustainability and eco-efficiency, but to competitiveness as well, thus contributing to a reliance on the local economy. It means that policy is not formulated independently from political agendas or what companies want [51]. The recent political agenda is based on the intention to shift the economy from linear to circular, and from fossil to bio-based resources by adopting digital and smart technologies [56,57]. Circular and bioeconomy are also highlighted in the European Industrial Strategy supporting the inter- and cross-border collaboration, thus moving away from the standalone behavior and making synergies out of conflicting policy [58]. A shared direction and a common vision can be established only by grouping together relevant stakeholders from industry, civil community and policy areas. According to that vision, each member of the participative process must support its attainment. In this context, CS become the link between technical and social innovation, in and outside the company. It follows that the co-value process completely fits with the current challenges represented by circular economy and bioeconomy, responding positively to social, economic and environmental concerns [59]. The knowledge transfer is supported by policymakers that are important actors and, at the same time, the viewers [60]. To pursue an effective transition, long-term interests of the society should be considered, and significant investments in the short-term should be established. In this dual-function, policymakers cover a pivotal role in financing the pre-competitive phase of innovative SBMs [61]. As highlighted by the European Commission in the report Excellence in Public Administration for competitiveness in EU Member States, the public administration should promote sustainability by first reforming the institutional framework conditions under which enterprises operate and then, establishing incentives and economic support. It gives higher importance to SMEs that usually face challenges in complying with the legislation and raising funding [62]. The accessibility to financial schemes becomes the central point among the services that a public administration should provide to make a sustainable economy [63]. Public administrations should better use their tools to stimulate companies to reduce their negative impacts [64]. A smart mix of regulative, incentive-based, market-based and informative instruments is needed [8]. Therefore, breakthrough policies must be converted in Structural and Investment Funds working on facilitating the value transfer from industry to society. The European Fund for Strategic Investments (EFSI) has so far mobilized EUR 370 billion in renewable energy, energy efficiency, research, development, and innovation, as well as social infrastructure [65]. In the framework of the Cohesion Policy, the Commission aims to invest EUR 373 billion for the period 2021–2027. Among the multitude of objectives, the second one, regarding the greener and low carbon economy has planned investments to promote an efficient and renewable energy system, sustainable water management, biodiversity enhancement as well as the transition to a circular economy. The allocation of funds on regional system happens through the Berlin method creating different funding systems such as the Regional Development Fund (ERDF), the European Social Fund Plus (ESF+) and the Cohesion Fund (CF). Each region is then called up to build up its own roadmap according to the Smart Specialization protocols and the regional laws that should be seen as inter-connected components of an integrated system. In contrast with the past approaches, the current planning process is inspired by a multi-value creation process, aiming to identify the relevant knowledge gaps, have a clear understanding of different viewpoints and design the steps to be taken collaboratively.

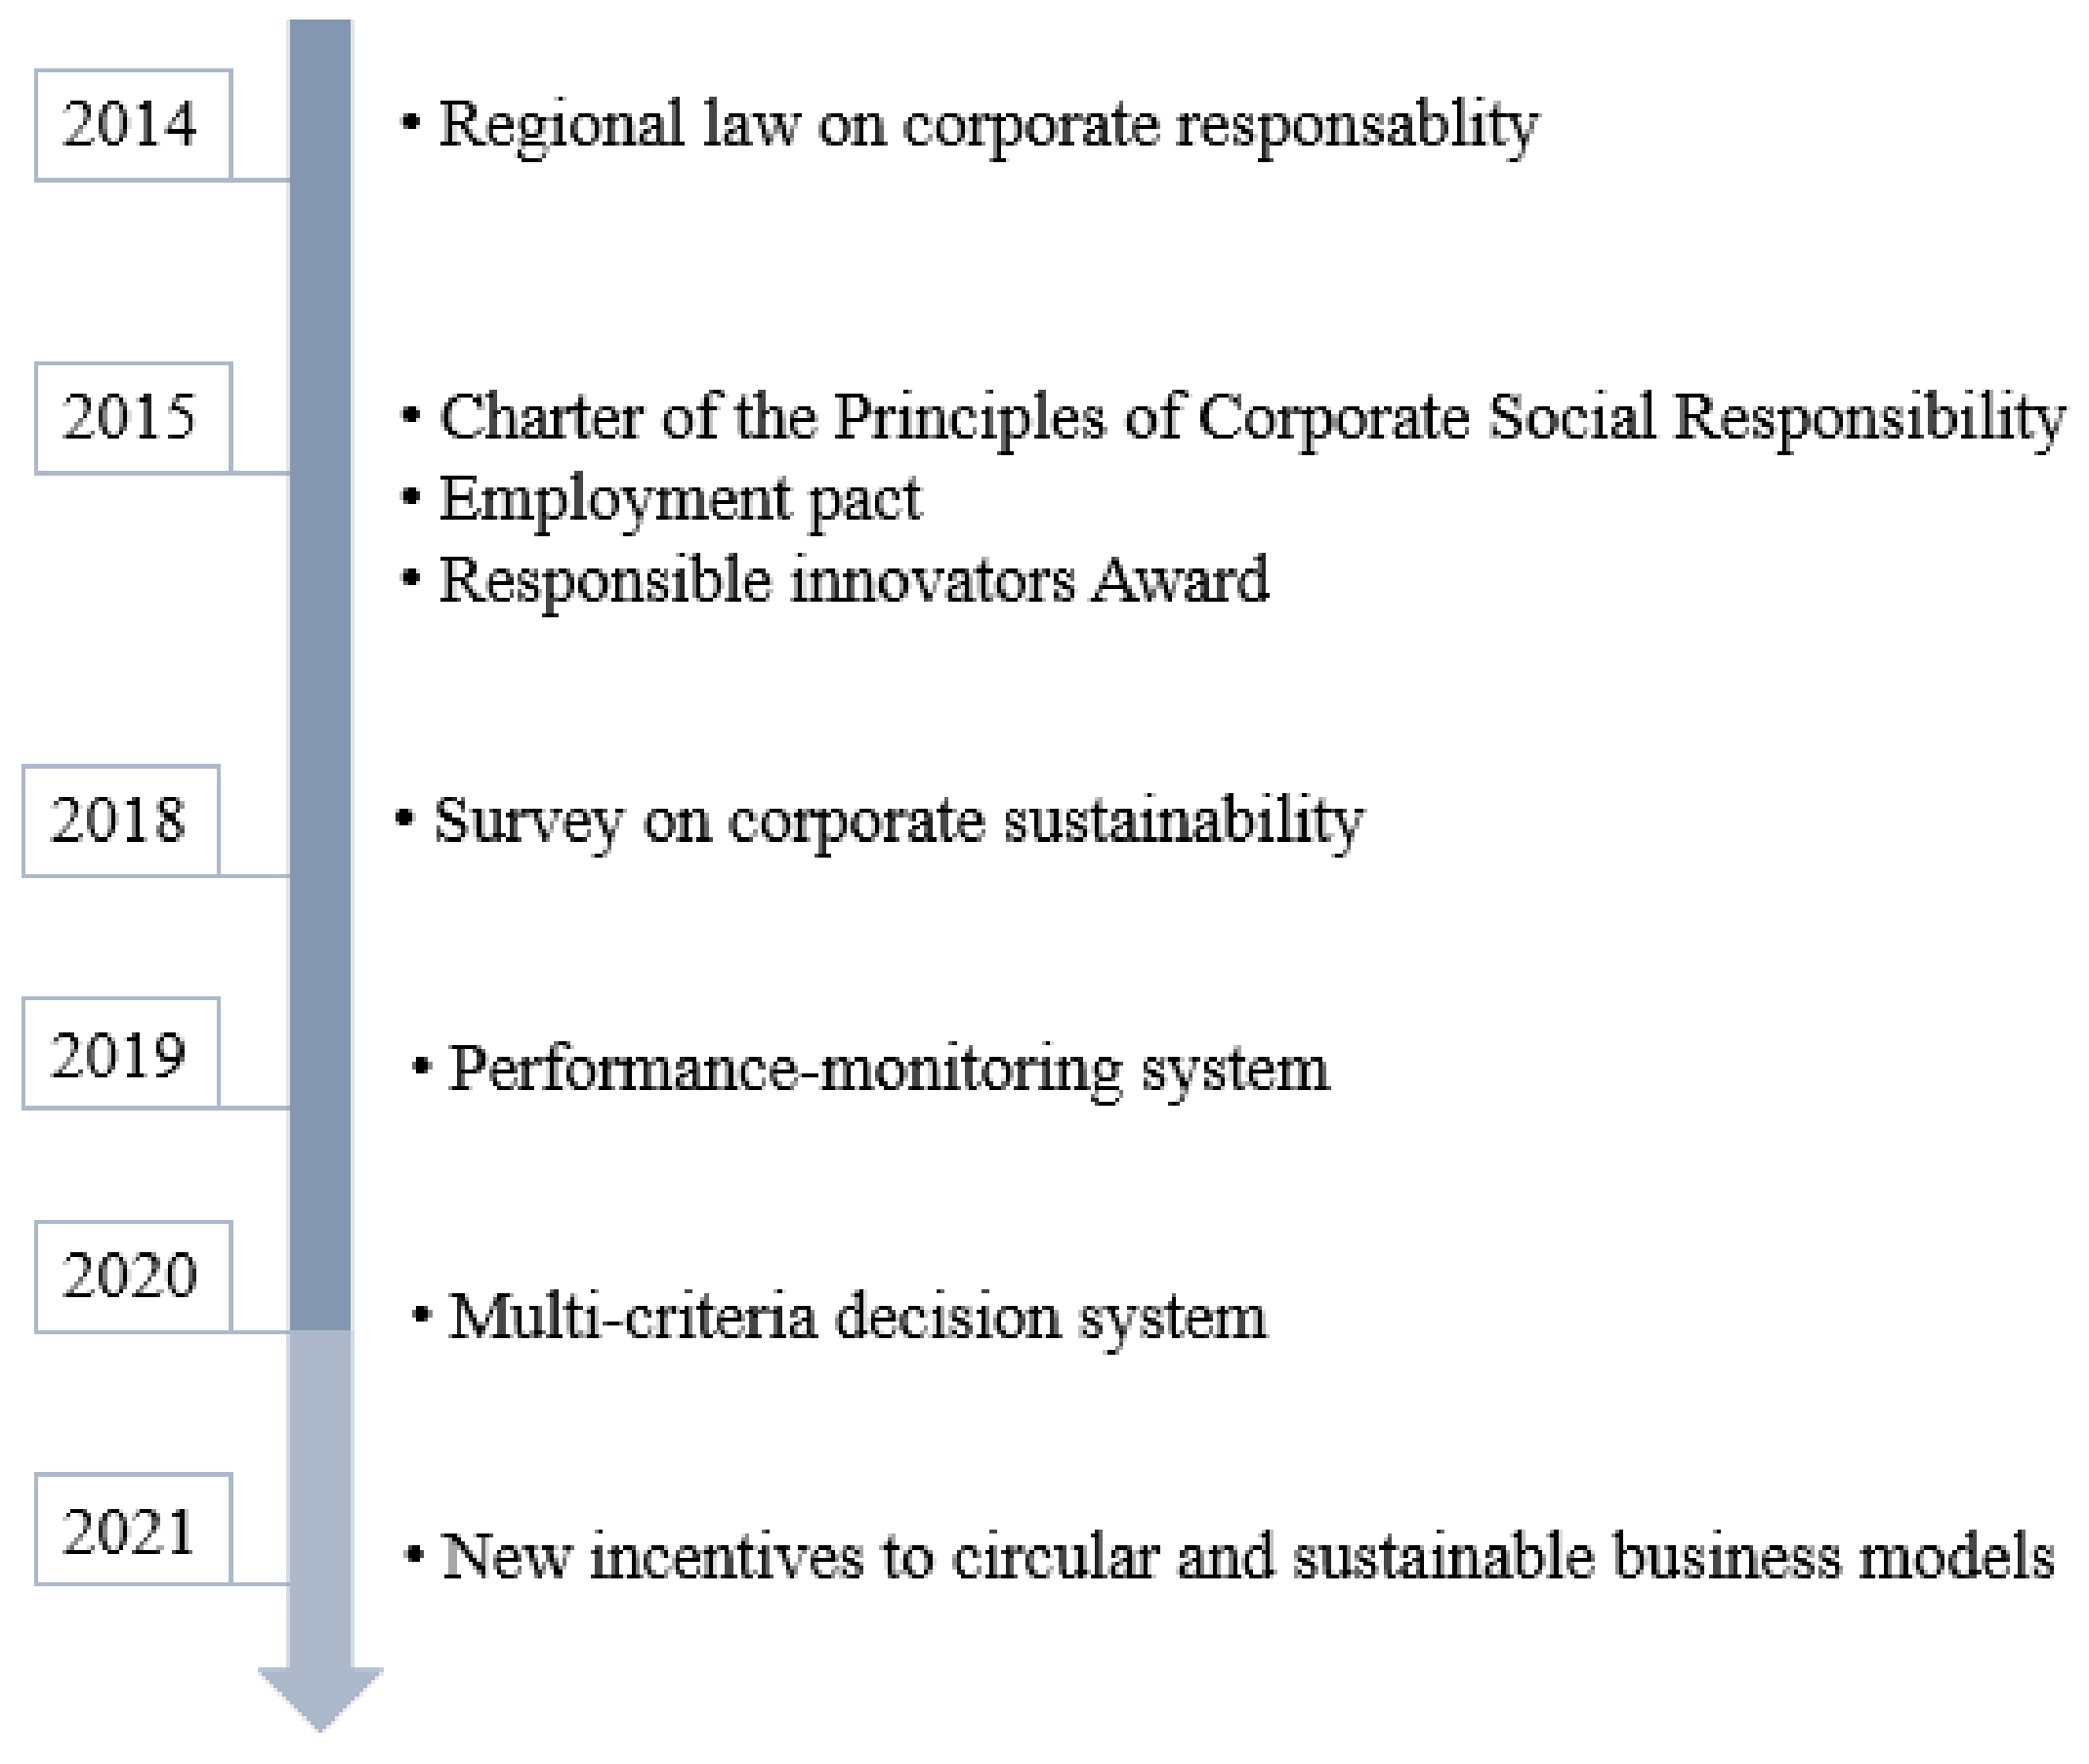
4. Emilia Romagna’s Process towards the Adoption of a Sustainable Business Model

As already highlighted, sustainability must be pursued through the TBL scheme adopting a multi-disciplinary approach. Public authorities are responsible for the establishment of structural and relational resources promoting a systemic change in production and consumption patterns [66]. In the field of sustainability policy, the ERR is one of the most innovative administration in Italy. As measured in the annual report L’Italia e gli obiettivi di Sviluppo Sostenibile [67], the region registers the most important performance indicators, especially the SDGs 4, 9 and 12. Emilia Romagna also ranks amongst the top regions in Italy for bureaucratic efficiency and quality of life. According to the economic configuration, ERR is one of leading regions in terms of per capita income and for many years has been classified as one of the richest regions in Europe. The presence of more than 400,000 economic activities contributes to 10% of the national GDP. The task of the Department of Economy of Knowledge, Employment and Business is about planning and coordinating regional policies for the development of the production, tourism, commercial and service economic systems. The region launched a new generation of public policies based on the interaction between institutional levels. In 2014, the Department introduced a business-oriented sustainability strategy promoting the value transfer from industry to society. In particular, the ERR started a demand-based process aimed to redesign the legislative and financial set of policies whose long-term goal is to boost the systemic adoption of SBMs in the economic activities located in the region.
The regional authorities have been working on both legislative and economic tools, simultaneously implementing assessment and monitoring actions (see Figure 2).
While the legislation introduces the key points of sustainable innovation, the public investments offer the means to implement the transition trajectories at different levels. In the framework of measures promoted within the regional program, the law 14/2014 includes a set of actions boosting principles and supporting actions on social innovation, CS and circular economy. According to the SDGs framework established within the Agenda 2030, the ERR has also published the Chart on CSR. Since 2015, the submission of the Chart’s principles is compulsory for all companies receiving regional funds from the Department of Economy of Knowledge, Employment and Business. Regional funds, and in particular the ERDF, started with almost EUR 482 million in the 2017–2020 period. These funds have been allocated in the field of research and innovation (29%), ICT development (6%), competitiveness and attractiveness of the production system (25%), promotion of low-carbon economy (22%), enhancement of artistic (8%), cultural and environmental resources and implementation of the urban agenda for attractive and participative cities (10%).
In 2018, the region decided to start a monitoring process relating to the implementation level of responsible and sustainable principles in firms that had previously submitted the Chart on CSR. The activity represents the first step of a wider and more ambitious plan aimed to evaluate the progress in sustainable innovation of the regional economy in accordance with the available financial and legislative tools. This shift was implemented to overcome one of the main issues regarding the outcomes of the funding schemes of the ERR, related to the impossibility of understanding not only the economic impact of its grants, but even the social and environmental effects. In fact, the companies reporting initiatives do not comprehend all the crucial information in order to understand the full value generated by its funding schemes. Some companies do have corporate reporting on CSR and sustainability [8], as a practice of measuring and disclosing the performance towards the TBL of sustainability [68]. However, there are different reporting standards created from international entities, such as the International Integrated Reporting (IIR), which deals with both finance and environmental performances and the Global Reporting Initiative (GRI) that provides a holistic representation of the company’s performance, including managerial, economic, social and environmental aspects. Despite the multitude of these reporting tools, there is a lack of a harmonized framework of indicators which deters having a comprehensive understanding of the strengths and weaknesses that characterize the regional economy. Moreover, the reporting of sustainability performance is usually carried out by large companies operating in certain “sensitive” industries [69,70]. Owing to the lack of resources, the level of diffusion of this type of communication tool in SMEs is less relevant than it is in bigger corporations [71].
In order to monitor the sustainable behavior adopted by SMEs as well, ERR has implemented a set of actions, including a mandatory survey. The survey was developed in a joint effort with the University of Bologna and the ERR. It contained 19 questions with 166 items, divided into five sections: supply chain, corporate welfare, environmental management, circular economy and finally, planning, control, and communication strategy. The questionnaire was sent online as mandatory to all the companies which were granted funds from the region. The sections represent the framework of the so-called business model for sustainability, investigating how the companies describe their ability to give a sustainable value proposition to its customers, how it manages and delivers this value through its internal managerial systems and the interactions with vendors, the territory, and other stakeholders. Each question has been designed in close collaboration with the region, in order to reflect the specific set of legislative and financial measures that have been established over the last 6 years in the field of corporate sustainability and responsibility in Emilia Romagna.
The questions have been presented in a four-point Likert scale, ranking from 1 to 4 where 1 is “not implemented” and 4 represents the “full implementation” of the sustainable actions in the four areas of investigation. It helps to create a model that summarizes and standardizes the performance of firms in the field of sustainability, by investigating all the corporate governance areas characterizing the activity under investigation. This procedure is quite common in Europe. Data collection represents a challenging action to determine the information needs of SMEs in relation to clean-process technologies and green products and services. Data acquisition and elaboration allow public administrations to support the companies in dealing with critical issues [72]. However, the survey presented in this research represents an innovative way to assess all the aspects regarding an SBM, thus not limiting the analysis to technical and technological elements but also including social, strategic and organizational ones. Moreover, since data are continuously collected, the process feeds on itself and reveals possible changes over the years and the effect of external pressures. This continuous observation process allows the region to orientate the funding towards areas where the performances have been lower than others. The process has been converted in a performance monitoring system (PMS) that identifies:
  • The critical issues relating to underperformance in the environmental management of regional economic activities.
  • The internal levers pushing the company to innovate.
  • The possible external inputs incentivizing the firm to rethink their business.

5. Materials and Methods

Integrating the holistic nature of sustainability in a company is a big challenge since it depends on many factors such as the type of activities (and the externalities’ impact on the environment), the system in which the firm is located, the size, the internal governance, the availability of incentives, and more generally, the presence of a pro-active context stimulating the business environment to innovate. From an organizational and operational point of view, these actions may have different impacts in accordance with the size and industry of the firm. For instance, while the manufacturing industry is committed to maximizing energy efficiency as well as minimizing the supply of raw materials and the waste generation [28,73], tourism, retail and the restorative activities are more oriented towards the consumer acceptance of services and/or products, by adopting ethical trade and protecting health and well-being through the use of local resources [74]. Considering the size, it is well-known that big corporations and brands are much more confident with sustainability-oriented processes. [75].
In order to analyze and compare the different elements measured by the questionnaire, a factor analysis has been used as a method of extraction of factors with eigenvalues higher than 1 (therefore without forcing the extraction with several factors defined a priori) and with a varimax rotation for a better interpretation of the factorial solution. This statistical technique allows a reduction in multidimensionality while retaining most of the information.
Factor analysis aims to identify latent variables or constructs from a group of questions. The mathematical factor analysis model can be expressed by using f to indicate the number of variables (X1, X2,…, Xf) and i to indicate the number of underlying factors (F1, F2,…, Fi, Fi). If Xi is assumed to be the variable that can be represented in latent factors, there can be m underlying factors whereby each observed variable is a linear function of these factors together with a residual variate (see Model 1). This model intends to reproduce the maximum correlations.
Xi = ai1F1 + ai2F2 + … + aimFm + ei
where i = 1, 2, …. p.
This method allows the extraction of a significant part of the variance from a group of theoretically identified questions, while creating a factor that significantly represents a complex theoretical construct. This enables a consideration of different questions pertinent to a certain topic while comparing them to other factors. All factors are tested for their internal consistency, showing Cronbach’s Alpha grade of >0.70 in all cases and other goodness-of-fit indices within acceptable ranges (RMSEA < 0.08; CFI > 0.90; TLI > 0.90; AVE > 0.40; CR > 0.70 (see Table 1).
As shown in the Table 1, 14 factors have been considered and categorized from A to N. Each factor contains elements that support the factor characterization. In particular:
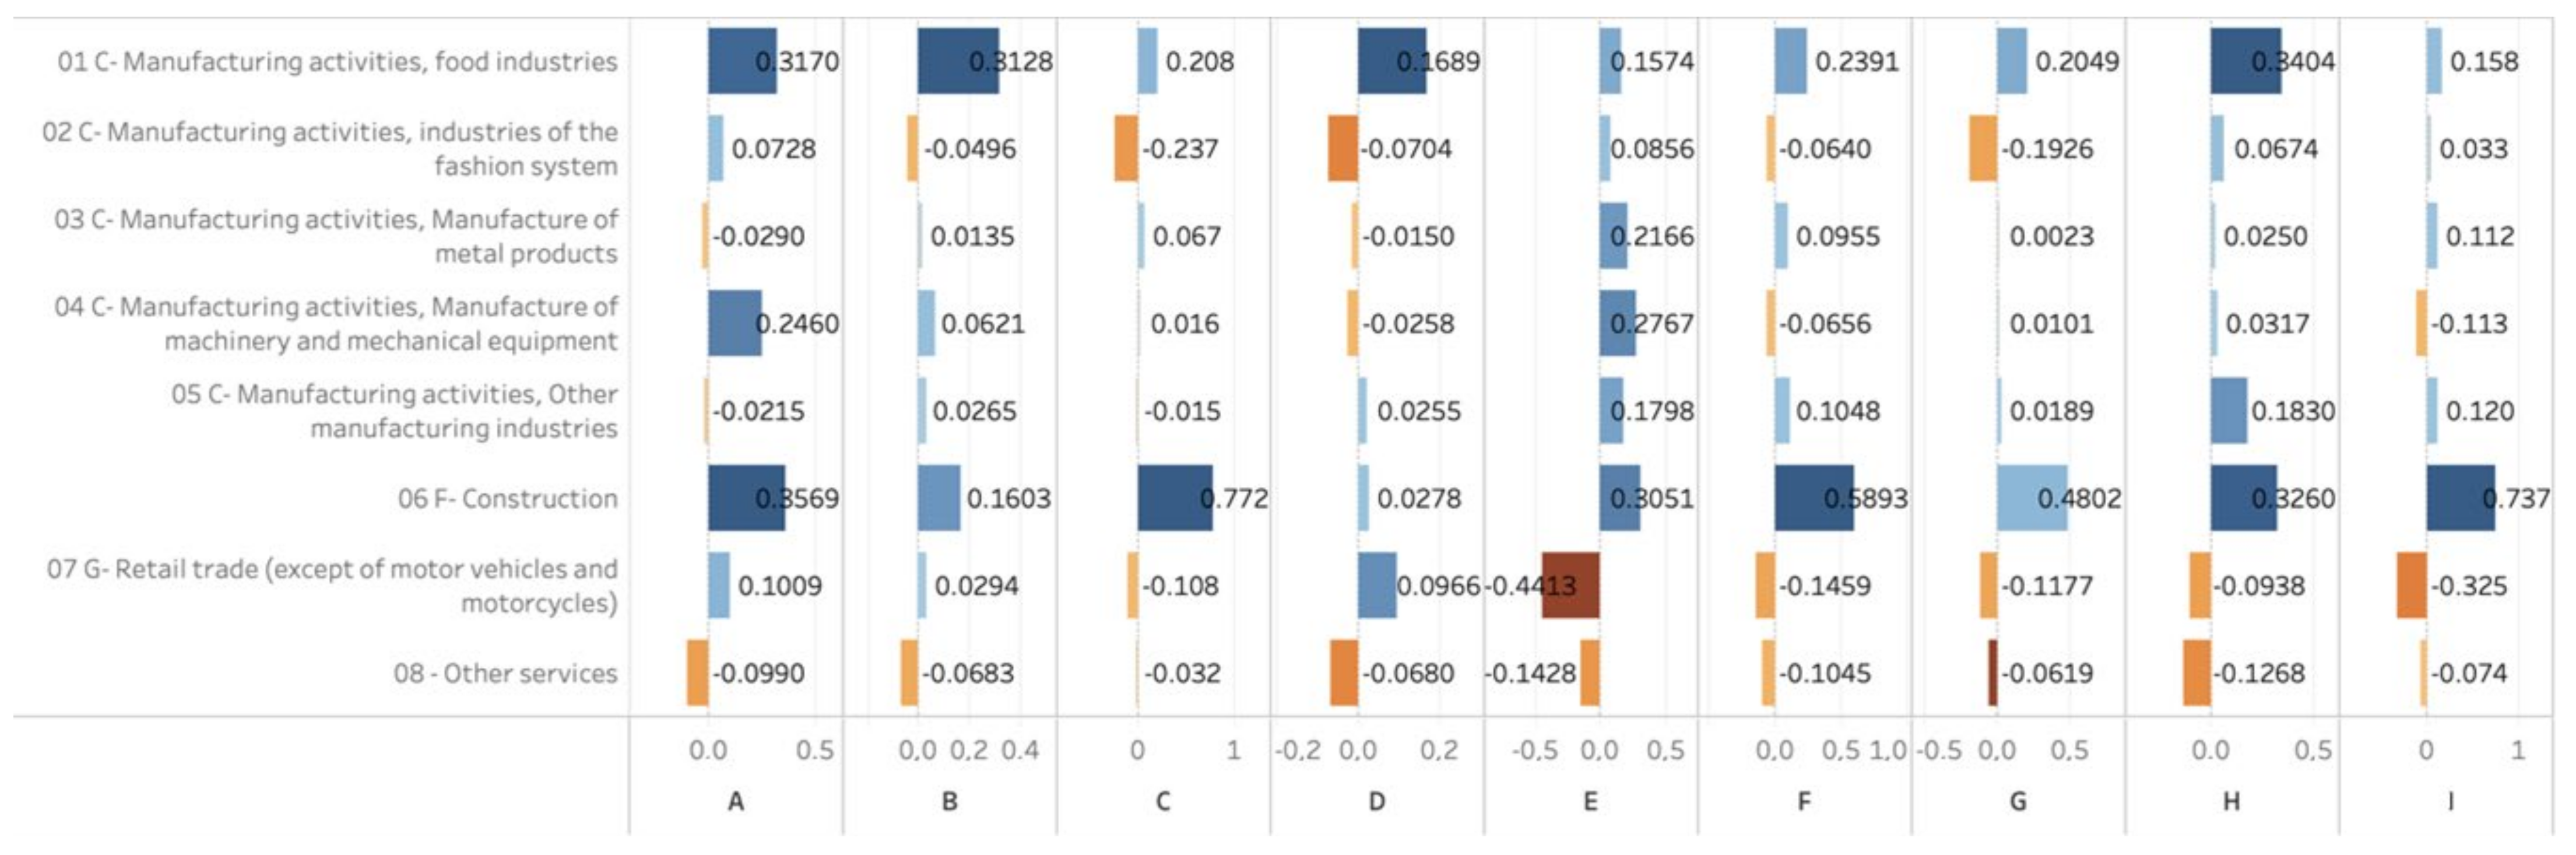
  • Vendors’ choice—conventional criteria (Factor A) include five matters representing the typical criteria used in the supply chain definition; it investigates the companies’ approaches in adopting certain traditional characteristics such as economic convenience, product quality, trust and direct knowledge of suppliers.
  • Vendors’ choice—sustainability criteria (Factor B) include five matters indicating the additional criteria summarizing the sustainability strategy adopted in the supply chain; it measures the propensity to choose suppliers with respect to ethical, environmental and social criteria, considering the effect on local employment, the environmental impact and other certifications.
  • The monitoring of suppliers on sustainability (Factor C) includes seven elements that relate to safety and environmental protection, use of products and rules in compliance with the environmental impact and workers’ health and other ethical and social clauses.
  • The section information and dialogue with customers/consumers (Factor D) is composed of seven elements that indicate the information that the company gives to its customers with respect to the environmental values and performances, results, social commitments, waste and sustainability actions that have been adopted.
  • Worker benefits (Factor E) are calculated with eight elements on training, social security, hourly flexibility, services, teleworking, leave and conventions and generally represents the actions on welfare.
  • The reporting tools (Factor F) are composed of six sub-topics referring to the external communication with attention to the social and sustainability report and the sustainability objectives of the United Nations.
  • The relations with the local community and the territory (Factor G) consist of five items on collaborations with the university, support for projects on the promotion of the territory, well-being, health or dialogue and support for social and environmental issues.
  • The strategic and financial motivations (Factor H) are composed of eight items with respect to the adoption of sustainable strategies and are measured with six elements on ethical sensitivity, the various competitive strategies, the supply chain, the reduction in waste and management savings.
  • The compliance motivation (Factor I) is composed of six items on the benefits of companies from residual sales, government incentives and regulatory requests.
  • The Ecological Footprint—Energy (Factor J) is measured with seven items ranging from the supply of energy from renewable sources and energy efficiency measures to the estimate of emissions into the atmosphere.
  • The Ecological Footprint—Materials (Factor K) is measured with seven items and takes higher values in the case of companies that use environmentally sustainable stationery materials, biodegradable and compostable plastics, ecological cleaning products, which cause material consumption reductions during production and the elimination of single-use products.
  • The Ecological Footprint—Water (Factor L), is measured with four items on the installation of flow limiters and electronic taps/with timers, use of tap water to replace mineral water bottles, installation of collection systems and use of rainwater and/or systems for the recovery and reuse of water and reduction in water consumption per unit of product, in the production process.
  • The Ecological Footprint—Plastic (Factor M) is composed of four items and has been introduced to increase awareness on marine plastic pollution and is measured from four questions on the practices of reducing harmful substances and the use of packaging and plastic residues.
  • The Ecological Footprint—Waste (Factor N) is measured by four items on the organization of separate collection, waste recovery and reduction.
The preliminary analysis has been done by considering the type of economic activities and the size: eight macro industries have been identified to make a proper representation of the factor distribution. The categories comprise manufacturing of food industries, fashion, metal products, machinery and mechanical equipment, other manufacturing industries, construction, retail and other services. The last two classifications include service industries, whether the former comprise manufacturing companies. According to the size, micro, small, medium and big companies have been considered according to the number of employees.

6. Results and Discussion

In March 2020, 894 questionnaires were collected and analyzed. Companies joining the program seem to be balanced and diversified in terms of type of economic activities: the main responses come from the manufacturing sector, since it represents the main economy of the region. Only few responses have arrived from start-ups. According to the size, 490 companies have no more than 9 employees, 270 are small companies while medium and big companies are, respectively, 115 and 19. It follows that the region is characterized by the prevalence of the manufacturing industry, mainly including SMEs.
Figure 3 shows the distribution of the factors in relation to the categories of industries. It can be noted that the industries which generally do better in terms of all factors belong to the food industry (Category 01) and the construction sector (Category 06). Those which perform worse are the Categories 02 (Fashion industry), 03 (Metal industry), 08 (Service sector).
Sustainable supply chain management is a key element of the business models adopted by construction and food industries that are the industries which perform better on vendors’ choice—conventional and sustainability criteria. Indeed, these industries were shown to adopt both criteria more than the others. Companies working in the manufacture of machinery and mechanical equipment are more inclined toward a selection of vendors based on conventional criteria. Construction companies demonstrate a better monitoring of suppliers on sustainability, while the fashion industry together with other service industries show a lack of attention on the supply chain orientation toward sustainability. The food industry provides more information and dialogue for clients and consumers, while again the fashion and other service industries as well as those involved in the manufacture of metal products and machinery demonstrate a lack of communication when compared to others. Concerning the social aspects contributing to an SBM, the manufacturing industries provide better benefits for workers and their working environment, while the service industries fall well behind the average. The construction and food industries place more attention on the external communication and reporting with emphasis on the sustainability objectives of the United Nations. The other industries have a lower propensity in the use of reporting tools. Another important element that enhances sustainability in business models is the relation with the local community and territory. The construction and food industries show more collaborations with the universities, support toward the territory or dialogue and support for social and environmental issues than the other industries. Strategic and financial motivations for sustainability are more accentuated for the food, construction and other manufacturing industries, while the compliance motivations are stronger for the construction industry only.
Figure 4 shows the distribution of the main factors according to size. Overall, an increasing tendency of all factors in relation to the size can be noted. Bigger companies make more use of vendors’ choice with conventional or sustainability criteria, have more monitoring of suppliers on sustainability, create more information and dialogue with customers/consumers, have better benefits for workers, make more use of reporting tools, increase their relations with the local community and the territory, and have more strategic and compliance incentives for sustainability.
In order to stimulate the adoption of circular and bioeconomy practices, a focus has been on the influence of the management of resources such as materials, energy, water, plastics and finally, on the attitude towards waste management. Figure 5 and Figure 6 show the distribution of the five ecological footprints according to industries and size.
The manufacturing industries show more attention toward the reduction in the energy footprint than those of service industries. Indeed, manufacturing companies invest more in the supply of energy from renewable sources and put more attention on energy efficiency or the emissions into the atmosphere. The fashion industry shows more inclination to the reduction in the materials footprint given the nature of the business. Indeed, fashion companies are more sensitive to the environmentally sustainable stationery materials and a decrease in material consumption during production. This is then followed by other services companies which are more sensitive to the use of biodegradable and compostable plastics. The water management system is characterized by lower performances for the food industries, which show a higher use of flow limiters and electronic taps/with timers, use of tap water to replace mineral water bottles, installation of collection systems and use of rainwater and/or systems for the recovery and reuse of water and reduction in water consumption per unit of product, in the production process. As mentioned above, the plastic footprint is measured from the practices of reducing harmful substances in plastic products and the use of packaging and plastic residues. Therefore, businesses involved in the manufacture of metal products or other manufacturing industries are less efficient in terms of reducing the plastic footprint than other industries. The performance of waste management is lower for manufacturing than for service industries. It looks like the manufacturing companies pay more attention to the organization of separate collection, waste recovery and reduction. With regard to the distribution of the footprints according to companies’ dimensions, it can be noted that bigger companies pay more attention to a better management of energy, materials, water, plastic and waste. Nevertheless, micro companies have a marked tendency to reduce the impact of materials usage when compared to small and medium ones. Indeed, the use of sustainable materials is lower for the small and medium enterprises (which means a higher footprint) than it is for the micro ones. In addition, the practices of reducing harmful substances and the use of packaging and plastic residues are higher for small companies when compared to medium ones.

7. Conclusions

The widespread reaction of scholars towards transition management and the use of evolutionary and demand-based policies makes the sustainability challenge more pragmatic [66]. The Agenda 2030 is the reference point for every local, national, or wider sustainable strategy. The SDGs have become the key supporting objectives to turn the critical production and consumption patterns into opportunities for sustainable economy and society. In the ERR, the measures established within the regional legislative framework are all aligned to the SDGs. Extant literature recognizes the importance of economic activities in addressing sustainability [76]. The ERR has been forcing innovation in the local economic activities by using CS as an additional value in doing business. Awards, policies, and public communications have stimulated the regional economic activities to intensify efforts in sustainable actions.
The assessment of the implications of investments on corporate environmental progress is well known to be arduous [77]. The identification of gaps and critical issues in the existing regional economic infrastructure allows us to continuously improve the efficiency of the fund allocation system and consequently, the adoption of high-performing SBMs. The ERR has launched a process of monitoring and assessing the current sustainability profile of regional economic activities to identify gaps and critical issues that could be filled out by a comprehensive and targeted state-based funding scheme oriented towards the continuous improvement of funding allocations for companies that expresses their interest in redesigning business models in a sustainable way. This allows the public administration to measure the effectiveness of funding provision not only in relation to the main objectives (i.e., promoting open innovation, investing in local sourcing, supporting circular economy systems), but even to assess the long-term impact in terms of social and environmental capital that the companies create for the territory.
In order to monitor this commitment, the ERR has outlined a survey investigating the main corporate aspects contributing to increasing sustainability and reducing the impact of externalities in any regional business activities, from industrial to commercial, recreational and touristic ones. In particular, a questionnaire has been used to examine the awareness and commitment of regional businesses towards economic responsibility, social equity and environmental integrity. The consistency and uniformity of data coming from this experimental phase has allowed the definition of a PMS able to capture information in the fields of supply chain, welfare, energy, raw materials, water, plastics and waste management. The results show a huge commitment towards innovative sustainability in the construction and manufacturing industry. Lower performances have been registered in the fashion industry. In addition, the trend shows an alignment of the resources and waste management with the regional policy commitment: the highest interest has been registered in the valorization of waste and plastics as a result of the measures established by the regional authorities on circular economy (including the plastics strategy) [78]. Negative performances have resulted in energy and raw materials management, which must be considered in further legislative measures.
This study represents the starting point for further activities. Beyond these considerations, the outcomes have inspired the construction of a theoretical model representing an SBM on one hand, and the creation of a multi-criteria decision system in the other. The model can be used as reference system which can support the definition of key performance indicators for corporate sustainability in different regional administrations, thus supporting the current research on business strategy. In addition, it can support the regional administration in adopting a breakthrough roadmap to be converted in Structural and Investment Funds, facilitating the value transfer from industry to society, according to the bottom-up approach.
To conclude, this paper gives a twofold contribution. First, for academia, it analyzes the role of the SBM in creating value for the territory by adding evidence to the ongoing debate on how to measure and monitor value creation and sharing. Second, it supports public professionals in creating a sustainable PMS and showing the use of factor analysis in comparing various determinants of the SBM. This research presents some limitations which can be addressed in further research. First, it needs to be considered that the questionnaire was mandatory and despite the possible pressure of control from the ERR, some companies might have been inclined to respond positively to some of the questions. Second, the questionnaire can be further developed with different metrics which can represent a better construct for the ecological footprint, considering all the above-mentioned footprints together in a single factor. Last, some of the items can be revised in order to include in the main model notions such as the supply chain cooperation and community engagement, to better investigate the incentives for being sustainable from the societal perspective.

Author Contributions

Conceptualization, E.F. and A.B.; formal analysis, E.F.; investigation, A.P.; methodology, G.A.; writing—original draft, E.F. and G.A.; writing—review and editing, A.P. and A.B. All authors have read and agreed to the published version of the manuscript.

Funding

This research received no external funding.

Institutional Review Board Statement

Not Applicable.

Informed Consent Statement

Not Applicable.

Data Availability Statement

3rd Party Data. Restrictions apply to the availability of these data. Data was obtained from the ERR and can be available from the authors with the permission of ERR.

Acknowledgments

The research group would like to thank Roberto Ricci Mingani, Paola Alessandri and Stefano Colombara from the Department for the Economy of Knowledge, Employment and Business of Emilia Romagna Region for their valuable collaboration and pro-active cooperation.

Conflicts of Interest

The authors declare no conflict of interest.

References

  1. Boons, F.; Montalvo, C.; Quist, J.; Wagner, M. Sustainable Innovation, Business Models and Economic Performance: An Overview. J. Clean. Prod. 2013, 45, 1–8. [Google Scholar] [CrossRef]
  2. The United Nations. United Nations Agenda 2030; United Nations: New York, CA, USA, 2015. [Google Scholar]
  3. Fischedick, M.; Roy, J.; Abdel, A.A.; Acquaye, A.; Ceron, J.P.; Geng, Y.; Kheshgi, H.; Lanza, A.; Per-czyk, D.; Price, L.; et al. Industry. In Climate Change 2014: Mitigation of Climate Change. Contribution of Working Group III to the Fifth Assessment Report of the Intergovernmental Panel on Climate Change; Cambridge University Press: Cambridge, UK; New York, NY, USA, 2014. [Google Scholar]
  4. Miller, T.R.; Wiek, A.; Sarewitz, D.; Robinson, J.; Olsson, L.; Kriebel, D.; Loorbach, D. The Future of Sustainability Science: A Solutions-Oriented Research Agenda. Sustain. Sci. 2014, 9, 239–246. [Google Scholar] [CrossRef]
  5. Bos-Brouwers, H.E.J. Corporate Sustainability and Innovation in SMEs: Evidence of Themes and Activities in Practice. Bus. Strat. Environ. 2009, 19, 417–435. [Google Scholar] [CrossRef]
  6. Ramaswamy, V.; Ozcan, K. The Co-Creation Paradigm; Walter de Gruyter GmbH: Berlin, Germany, 2014. [Google Scholar]
  7. Bevir, M. The SAGE Handbook of Governance; Indian Institute of Management: Kozhikode, India, 2011. [Google Scholar]
  8. Heinrichs, H.; Laws, N. “Sustainability State” in the Making? Institutionalization of Sustainability in German Federal Policy Making. Sustainability 2014, 6, 2623–2641. [Google Scholar] [CrossRef] [Green Version]
  9. Porter, M.E.; Kramer, M.R. Creating Shared Value. In Managing Sustainable Business: An Executive Education Case and Textbook; Lenssen, G.G., Smith, N.C., Eds.; Springer: Dordrecht, The Netherlands, 2019; pp. 323–346. ISBN 978-94-024-1144-7. [Google Scholar]
  10. WBCSD. Business Case for Sustainable Development Making a Difference toward the Johannesburg Summit 2002 and Beyond; World Business Council for Sustainable Development: Johanesburg, South Africa, 2002. [Google Scholar]
  11. Montiel, I. Corporate Social Responsibility and Corporate Sustainability. Organ. Environ. 2008, 21, 245–269. [Google Scholar] [CrossRef] [Green Version]
  12. Keeble, B.R. The Brundtland Report: ‘Our Common Future’. Med. War 1988, 4, 17–25. [Google Scholar] [CrossRef]
  13. Morioka, S.N.; Bolis, I.; Evans, S.; Carvalho, M.M. Transforming Sustainability Challenges into Competitive Advantage: Multiple Case Studies Kaleidoscope Con-Verging into Sustainable Business Models. J. Clean. Prod. 2017, 167, 723–738. [Google Scholar] [CrossRef]
  14. Stubbs, W.; Cocklin, C. Conceptualizing a “Sustainability Business Model”. Organ. Environ. 2008, 21, 103–127. [Google Scholar] [CrossRef]
  15. Biloslavo, R.; Bagnoli, C.; Edgar, D. An Eco-Critical Perspective on Business Models: The Value Triangle as an Approach to Closing the Sustainability Gap. J. Clean. Prod. 2018, 174, 746–762. [Google Scholar] [CrossRef] [Green Version]
  16. Van Marrewijk, M. Concepts and Definitions of CSR and Corporate Sustainability: Between Agency and Communion. J. Bus. Ethic. 2003, 44, 95–105. [Google Scholar] [CrossRef]
  17. Bansal, P. Evolving Sustainably: A Longitudinal Study of Corporate Sustainable Development. Strat. Manag. J. 2005, 26, 197–218. [Google Scholar] [CrossRef]
  18. Gladwin, T.N.; Kennelly, J.J.; Krause, T.-S. Shifting Paradigms for Sustainable Development: Implications for Management Theory and Research. Acad. Manag. Rev. 1995, 20, 874. [Google Scholar] [CrossRef] [Green Version]
  19. Dyllick, T.; Hockerts, K. Beyond the Business Case for Corporate Sustainability. Bus. Strategy Environ. 2002, 11, 130–141. [Google Scholar] [CrossRef]
  20. Burritt, R.L.; Schaltegger, S. Sustainability Accounting and Reporting: Fad or Trend? Account. Audit. Account. J. 2010, 23, 829–846. [Google Scholar] [CrossRef]
  21. Lüdeke-Freund, F.; Dembek, K. Sustainable Business Model Research and Practice: Emerging Field or Passing Fancy? J. Clean. Prod. 2017, 168, 1668–1678. [Google Scholar] [CrossRef]
  22. Geissdoerfer, M.; Vladimirova, D.; Evans, S. Sustainable Business Model Innovation: A Review. J. Clean. Prod. 2018, 198, 401–416. [Google Scholar] [CrossRef]
  23. Ordonez-Ponce, E.; Clarke, A.C.; Colbert, B.A. Collaborative Sustainable Business Models: Understanding Organizations Partnering for Community Sustainability. Bus. Soc. 2020, 0007650320940241. [Google Scholar] [CrossRef]
  24. Fiore, M.; Galati, A.; Gołębiewski, J.; Drejerska, N. Stakeholders’ Involvement in Establishing Sustainable Business Models. Br. Food J. 2020, 122, 1671–1691. [Google Scholar] [CrossRef]
  25. Shields, J.; Shelleman, J.M. Integrating Sustainability into SME Strategy. JSBS 2015, 25, 59–78. [Google Scholar]
  26. Upward, A.; Jones, P. An Ontology for Strongly Sustainable Business Models. Organ. Environ. 2016, 29, 97–123. [Google Scholar] [CrossRef] [Green Version]
  27. Goni, F.A.; Chofreh, A.G.; Orakani, Z.E.; Klemeš, J.J.; Davoudi, M.; Mardani, A. Sustainable Business Model: A Review and Framework Development. Clean Technol. Environ. Policy 2020, 1–9. [Google Scholar] [CrossRef]
  28. Bocken, N.M.P.; Short, S.W.; Rana, P.; Evans, S. A Literature and Practice Review to Develop Sustainable Business Model Archetypes. J. Clean. Prod. 2014, 65, 42–56. [Google Scholar] [CrossRef] [Green Version]
  29. Manninen, K.; Koskela, S.; Antikainen, R.; Bocken, N.; Bontempi, E.; Aminoff, A. Do Circular Economy Business Models Capture Intended Environmental Value Propositions? J. Clean. Prod. 2018, 171, 413–422. [Google Scholar] [CrossRef] [Green Version]
  30. Velter, M.; Bitzer, V.; Bocken, N.; Kemp, R. Sustainable Business Model Innovation: The Role of Boundary Work for Multi-Stakeholder Alignment. J. Clean. Prod. 2020, 247, 119497. [Google Scholar] [CrossRef]
  31. Seiffert, M.E.B.; Loch, C. Systemic Thinking in Environmental Management: Support for Sustainable Development. J. Clean. Prod. 2005, 13, 1197–1202. [Google Scholar] [CrossRef]
  32. Vieira, P.F. Environmental Problematic and Social Sciences in Brazil. Ecology and Development: Problematic and Politics; Escola Profissional para a Educaciao e Desenvolvimento (EPED): Rio de Janeiro, Brazil, 1992. [Google Scholar]
  33. Schaltegger, S.; Freund, F.L.; Hansen, E.G. Business Cases for Sustainability: The Role of Business Model Innovation for Corporate Sustainability. Int. J. Innov. Sustain. Dev. 2012, 6, 95. [Google Scholar] [CrossRef]
  34. Engert, S.; Rauter, R.; Baumgartner, R.J. Exploring the Integration of Corporate Sustainability into Strategic Management: A Literature Review. J. Clean. Prod. 2016, 112, 2833–2850. [Google Scholar] [CrossRef]
  35. Lewandowski, M. Designing the Business Models for Circular Economy—Towards the Conceptual Framework. Sustainability 2016, 8, 43. [Google Scholar] [CrossRef] [Green Version]
  36. Lozano, R.; Carpenter, A.; Huisingh, D. A Review of ‘Theories of the Firm’ and Their Contributions to Corporate Sustainability. J. Clean. Prod. 2015, 106, 430–442. [Google Scholar] [CrossRef]
  37. Nosratabadi, S.; Mosavi, A.; Shamshirband, S.; Zavadskas, E.K.; Rakotonirainy, A.; Ahmadi, M.H. Sustainable Business Models: A Review. Sustainability 2019, 11, 1663. [Google Scholar] [CrossRef] [Green Version]
  38. Barbieri, R.; Santos, D.F.L. Sustainable Business Models and ECo-innovation: A Life Cycle Assessment. J. Clean. Prod. 2020, 266, 121954. [Google Scholar] [CrossRef]
  39. Denning, S. Navigating the Phase Change to the Creative Economy. Strat. Leadersh. 2014, 42, 3–11. [Google Scholar] [CrossRef]
  40. Schaltegger, S.; Hansen, E.G.; Lüdeke-Freund, F. Business Models for Sustainability: Origins, Present Research, and Future Avenues. Organ. Environ. 2015, 29, 3–16. [Google Scholar] [CrossRef]
  41. Colombo, L.A.; Pansera, M.; Owen, R. The Discourse of Eco-Innovation in the European Union: An Analysis of the ECo-innovation Action Plan and Horizon 2020. J. Clean. Prod. 2019, 214, 653–665. [Google Scholar] [CrossRef] [Green Version]
  42. Triguero, A.; Moreno-Mondéjar, L.; Davia, M.A. Drivers of Different Types of Eco-Innovation in European SMEs. Ecol. Econ. 2013, 92, 25–33. [Google Scholar] [CrossRef]
  43. Cerin, P.; Karlson, L. Business Incentives for Sustainability: A Property Rights Approach. Ecol. Econ. 2002, 40, 13–22. [Google Scholar] [CrossRef]
  44. Porter, M.E.; Van Der Linde, C. Toward a New Conception of the Environment-Competitiveness Relationship. J. Econ. Perspect. 1995, 9, 97–118. [Google Scholar] [CrossRef]
  45. Chen, C.; Liu, L.Q. Pricing and Quality Decisions and Financial Incentives for Sustainable Product Design with Recycled Material Content under Price Leadership. Int. J. Prod. Econ. 2014, 147, 666–677. [Google Scholar] [CrossRef]
  46. Schneider, A.; Ingram, H. Behavioral Assumptions of Policy Tools. J. Polit. 1990, 52, 510–529. [Google Scholar] [CrossRef] [Green Version]
  47. Coase, R.H. The Problem of Social Cost. J. Law Econ. 1960, 3, 1–44. [Google Scholar] [CrossRef]
  48. Coase, R.H. The Problem of Social Cost. In Economic Analysis of the Law; John Wiley & Sons Ltd.: Hoboken, NJ, USA, 2007; pp. 1–13. ISBN 978-0-470-75213-5. [Google Scholar]
  49. Fullerton, D. Why Have Separate Environmental Taxes? NBER Tax Policy Econ. 1996, 10, 33–70. [Google Scholar] [CrossRef] [Green Version]
  50. Demsetz, H. The Theory of the Firm Revisited. J. Law Econ. Organ. 1988, 4, 141–161. [Google Scholar] [CrossRef]
  51. Nill, J.; Kemp, R. Evolutionary Approaches for Sustainable Innovation Policies: From Niche to Paradigm? Res. Policy 2009, 38, 668–680. [Google Scholar] [CrossRef]
  52. Zollo, M.; Cennamo, C.; Neumann, K. Beyond What and Why. Organ. Environ. 2013, 26, 241–259. [Google Scholar] [CrossRef]
  53. Aragón-Correa, J.A.; Sharma, S. A Contingent Resource-Based View of Proactive Corporate Environmental Strategy. Acad. Manag. Rev. 2003, 28, 71–88. [Google Scholar] [CrossRef] [Green Version]
  54. Goetz, K.S. Encouraging Sustainable Business Practices Using Incentives: A Practitioner’s View. Manag. Res. Rev. 2010, 33, 1042–1053. [Google Scholar] [CrossRef]
  55. Stirling, A. Pluralising Progress: From Integrative Transitions to Transformative Diversity. Environ. Innov. Soc. Transit. 2011, 1, 82–88. [Google Scholar] [CrossRef]
  56. European Environment Agency. European Commission Closing the Loop—An EU Action Plan for the Circular Economy COM/2015/0614 Final; European Environment Agency: Copenhagen, Denmark, 2015. [Google Scholar]
  57. European Environment Agency. European Commission A Sustainable Bioeconomy for Europe: Strengthening the Connection between Economy, Society and the Environment {SWD(2018) 431 Final}; European Environment Agency: Copenhagen, Denmark, 2018. [Google Scholar]
  58. European Environment Agency. European Commission Communication from the Commission to the European Parliament, the Council, the European Economic and Social Committee and the Committee of the Regions. A New Industrial Strategy for Europe COM(2020) 102 Final; European Environment Agency: Copenhagen, Denmark, 2020. [Google Scholar]
  59. Hoffman, A.J. Competitive Environmental Strategy: A Guide to the Changing Business Landscape; Island Press: Washington, DC, USA, 2000. [Google Scholar]
  60. Long, N. From Paradigm Lost to Paradigm Regained? The Case for an Actor-Oriented Sociology of Development. Revista Europea de Estudios Latinoamericanos y del Caribe. Eur. Rev. Lat. Am. Caribb. Stud. 1990, 49, 23–24. [Google Scholar]
  61. Musiolik, J.; Markard, J.; Hekkert, M. Networks and Network Resources in Technological Innovation Systems: Towards a Conceptual Framework for System Building. Technol. Forecast. Soc. Chang. 2012, 79, 1032–1048. [Google Scholar] [CrossRef] [Green Version]
  62. Aristovnik, A.; Obadić, A. The Impact and Efficiency of Public Administration Excellence on Fostering SMEs in EU Countries. Amfiteatru Econ. 2015, 17, 15. [Google Scholar]
  63. Ou, C.; Haynes, G. Acquisition of Additional Equity Capital by Small Firms—Findings from the National Survey of Small Business Finances. Small Bus. Econ. 2006, 27, 157–168. [Google Scholar] [CrossRef]
  64. Moors, E.H.; Mulder, K.; Vergragt, P.J. Towards Cleaner Production: Barriers and Strategies in the Base Metals Producing Industry. J. Clean. Prod. 2005, 13, 657–668. [Google Scholar] [CrossRef] [Green Version]
  65. European Court of Auditors. Review No 03/2019: Allocation of Cohesion Policy Funding to Member States for 2021–2027 (Rapid Case Review). Eur. Court. Audit. 2019. Available online: https://www.eca.europa.eu/en/Pages/DocItem.aspx?did=49531 (accessed on 15 January 2021).
  66. Farla, J.; Markard, J.; Raven, R.R.; Coenen, L. Sustainability Transitions in the Making: A Closer Look at Actors, Strategies and Resources. Technol. Forecast. Soc. Chang. 2012, 79, 991–998. [Google Scholar] [CrossRef] [Green Version]
  67. ASviS. L’Italia e Gli Obiettivi Di Sviluppo Sostenibile; ASviS: Rome, Italy, 2019. [Google Scholar]
  68. Clayton, A.F.; Rogerson, J.M.; Rampedi, I. Integrated Reporting vs. Sustainability Reporting for Corporate Responsibility in South Africa. Bull. Geogr. Sociocon. Ser. 2015, 29, 7–17. [Google Scholar] [CrossRef] [Green Version]
  69. O’Dwyer, B.; Owen, D.L. Assurance Statement Practice in Environmental, Social and Sustainability Reporting: A Critical Evaluation. Br. Account. Rev. 2005, 37, 205–229. [Google Scholar] [CrossRef]
  70. Newig, J.; Schulz, D.; Fischer, D.; Hetze, K.; Laws, N.; Lüdecke, G.; Rieckmann, M. Communication Regarding Sustainability: Conceptual Perspectives and Exploration of Societal Subsystems. Sustainability 2013, 5, 2976–2990. [Google Scholar] [CrossRef] [Green Version]
  71. Borga, F.; Citterio, A.; Noci, G.; Pizzurno, E. Sustainability Report in Small Enterprises: Case Studies in Italian Furniture Companies. Bus. Strat. Environ. 2009, 18, 162–176. [Google Scholar] [CrossRef]
  72. Anastas, P.T.; Breen, J.J. Design for the Environment and Green Chemistry: The Heart and Soul of Industrial Ecology. J. Clean. Prod. 1997, 5, 97–102. [Google Scholar] [CrossRef]
  73. Gunasekaran, A.; Spalanzani, A. Sustainability of Manufacturing and Services: Investigations for Research and Applications. Int. J. Prod. Econ. 2012, 140, 35–47. [Google Scholar] [CrossRef]
  74. Saarinen, J. Traditions of Sustainability in Tourism Studies. Ann. Tour. Res. 2006, 33, 1121–1140. [Google Scholar] [CrossRef]
  75. Jin, Z.; Navare, J.; Lynch, R. The Relationship between Innovation Culture and Innovation Outcomes: Exploring the Effects of Sustainability Orientation and Firm Size. R&D Manag. 2018, 49, 607–623. [Google Scholar] [CrossRef]
  76. Seuring, S.; Müller, P.D.M. From a Literature Review to a Conceptual Framework for Sustainable Supply Chain Management. J. Clean. Prod. 2008, 16, 1699–1710. [Google Scholar] [CrossRef]
  77. Costantini, V.; Crespi, F. Public Policies for a Sustainable Energy Sector: Regulation, Diversity and Fostering of Innovation. J. Evol. Econ. 2010, 23, 401–429. [Google Scholar] [CrossRef] [Green Version]
  78. Emilia Romagna Region E-R. Bollettino Ufficiale Della Regione Emilia-Romagna (BURERT); Emilia Romagna Region E-R: Bologna, Italy, 2015. [Google Scholar]
Figure 1. Shred value in triple bottom line (TBL): systemic thinking.
Sustainability 13 01176 g001
Figure 2. Step-by-step process of regional strategy on sustainable economy.
Sustainability 13 01176 g002
Figure 3. Distribution of the main factors between industries. (A) Vendors’ choice—conventional criteria; (B) vendors’ choice—sustainability criteria; (C) monitoring of suppliers on sustainability; (D) information and dialogue with customers/consumers; (E) benefits for workers; (F) reporting tools; (G) relations with the local community and the territory; (H) strategic and financial reasons for sustainability; (I) compliance reasons for sustainability.
Sustainability 13 01176 g003
Figure 4. Distribution of the main factors with size. (A) Vendors’ choice—conventional criteria; (B) vendors’ choice—sustainability criteria; (C) monitoring of suppliers on sustainability; (D) information and dialogue with customers/consumers; (E) benefits for workers; (F) reporting tools; (G) relations with the local community and the territory; (H) strategic and financial reasons for sustainability; (I) compliance reasons for sustainability.
Sustainability 13 01176 g004
Figure 5. Distribution of the ecological footprints between industries.
Sustainability 13 01176 g005
Figure 6. Distribution of the ecological footprints with size.
Sustainability 13 01176 g006
Table 1. Performance monitoring system.
FactorQuestionnaire ItemsCronbach’s AlphaRMSEACFITLIAVECR
A. Vendors’ Choice—Conventional Criteria50.700.0590.980.950.510.71
B. Vendors’ Choice—Sustainability Criteria50.790.0670.970.960.490.70
C. Monitoring of suppliers on sustainability70.890.0140.980.990.510.87
D. Information and dialogue with customers/consumers70.870.0740.980.960.530.86
E. Benefits for workers80.830.090.960.940.490.81
F. Reporting tools60.790.0620.990.980.570.89
G. Relations with the local community and the territory50.840.070.980.960.490.82
H. Strategic and financial reasons for sustainability80.870.070.980.950.480.87
I. Compliance reasons for sustainability60.820.0600.980.960.490.81
J. Ecological Footprint: Energy70.840.080.940.920.460.82
K. Ecological Footprint: Materials50.760.080.960.930.490.76
L. Ecological Footprint: Water40.810.070.940.920.470.79
M. Ecological Footprint: Plastic40.760.060.980.970.470.77
N. Ecological Footprint: Waste40.710.070.980.960.490.71
Publisher’s Note: MDPI stays neutral with regard to jurisdictional claims in published maps and institutional affiliations.

