
Fine-Granularity Urban Microclimate Monitoring Using Wearable Multi-Source Sensors

 ,
,
Abstract
:1. Introduction
1.1. Research Background
1.2. Research Significance
1.3. Research Description
2. Device and Methods
- (1)
- Installation positions
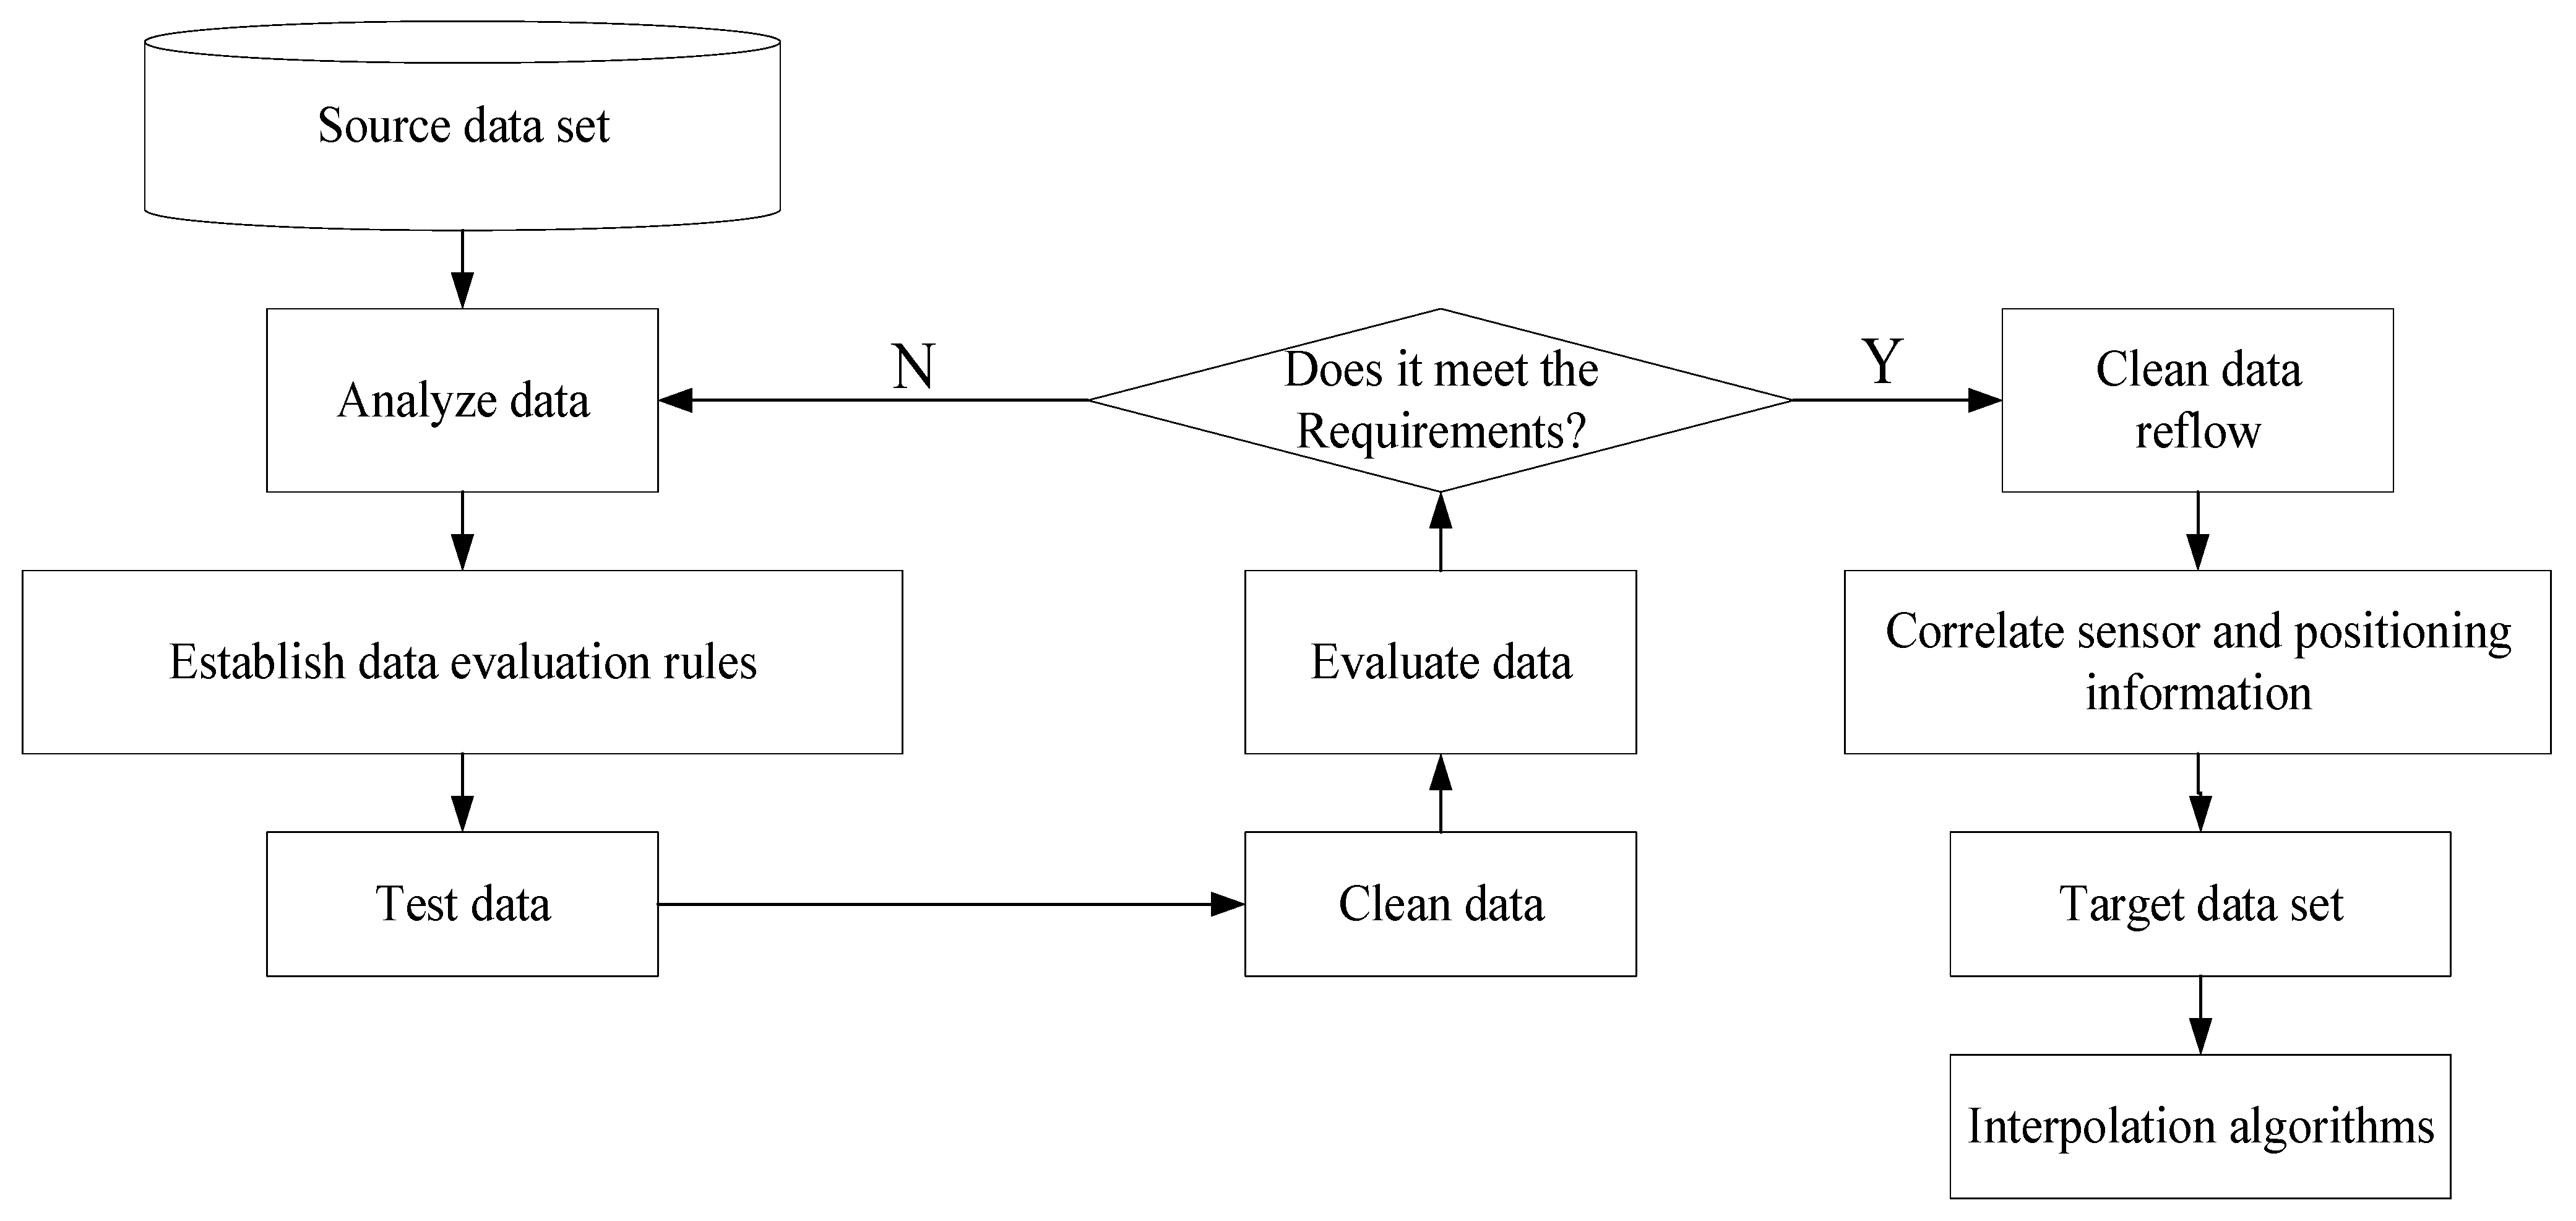
- (2)
- Data processing
- (3)
- Data storage
- (4)
- Microclimate classification
2.1. Pseudo-Range Differential Positioning of BeiDou Navigation Satellite System
2.2. Wearable Monitoring Device
2.2.1. Microcomputer Module
2.2.2. Sensor Module
2.2.3. Positioning Module
2.3. Data Transmission System
2.4. Mobile Environment Data Processing
2.4.1. Environment Data
2.4.2. Data Processing
2.4.3. Evaluation Model
2.5. Data Analysis and Visualization
3. Result Analysis
4. Conclusions
- Compared with the existing environmental data monitored by meteorological environment monitoring stations which rely on fixed positions, the data monitored by three-dimensional monitoring stations in the wide area of the blocks in cities is more accurate because three-dimensional monitoring stations can achieve multi-point measurement covering a radius of 1000 m and a height of 200–300 m.
- Dynamic checking and high accuracy: This invention can synchronously obtain the officially released high-accuracy monitoring data of meteorological and environmental monitoring stations in the monitoring areas and build a mathematical model to dynamically check the high-frequency sensors, which helps to improve the monitoring accuracy and regularly corrects the zero drift. Thus, people can acquire massive amounts of high-accuracy information at a low cost.
- Conducive to the establishment of a large database of environmental data: It can integrate the mass data acquired via mobile and fixed monitoring covered by this system to build a large database and provide more valuable data services for the evaluation of SDG indicator 11.6.2 [29].
Author Contributions
Funding
Institutional Review Board Statement
Informed Consent Statement
Data Availability Statement
Conflicts of Interest
References
- Yunesian, M.; Rostami, R.; Zarei, A.; Fazlzadeh, M.; Janjani, H. Exposure to high levels of PM2.5 and PM10 in the metropolis of Tehran and the associated health risks during 2016–2017. Microchem. J. 2019, 150, 104174. [Google Scholar] [CrossRef]
- Fu, B.-j.; Zhuang, X.-l.; Jiang, G.-b.; Shi, J.-b.; Lu, Y.-h. FEATURE: Environmental Problems and Challenges in China. Environ. Sci. Technol. 2007, 41, 7597–7602. [Google Scholar] [CrossRef] [PubMed] [Green Version]
- Becerra-Pérez, L.A.; Ramos-Álvarez, R.A.; DelaCruz, J.J.; García-Páez, B.; Páez-Osuna, F.; Cedeño-Laurent, J.G.; Boldo, E. An Economic Analysis of the Environmental Impact of PM2.5 Exposure on Health Status in Three Northwestern Mexican Cities. Sustainability 2021, 13, 10782. [Google Scholar] [CrossRef]
- Ma, Y.; Li, D.; Zhou, L. Health Impact Attributable to Improvement of PM2.5 Pollution from 2014–2018 and Its Potential Benefits by 2030 in China. Sustainability 2021, 13, 9690. [Google Scholar] [CrossRef]
- Füzéki, E.; Schröder, J.; Groneberg, D.A.; Banzer, W. Physical Activity and Its Related Factors during the First COVID-19 Lockdown in Germany. Sustainability 2021, 13, 5711. [Google Scholar] [CrossRef]
- Yan, C.; Wang, L.; Zhang, Q. Study on Coupled Relationship between Urban Air Quality and Land Use in Lanzhou, China. Sustainability 2021, 13, 7724. [Google Scholar] [CrossRef]
- Sharma, A.; Massey, D.D.; Taneja, A. A study of horizontal distribution pattern of particulate and gaseous pollutants based on ambient monitoring near a busy highway. Urban Clim. 2018, 24, 643–656. [Google Scholar] [CrossRef]
- Zhou, Z.; Chen, Y.; Song, P.; Ding, T. China’s urban air quality evaluation with streaming data: A DEA window analysis. Sci. Total. Environ. 2020, 727, 138213. [Google Scholar] [CrossRef]
- Rodríguez-Álvarez, J. Urban Energy Index for Buildings (UEIB): A new method to evaluate the effect of urban form on buildings’ energy demand. Landsc. Urban Plan. 2016, 148, 170–187. [Google Scholar] [CrossRef]
- Hong, T.; Chen, Y.; Lee, S.H.; Piette, M.A. CityBES: A Web-based Platform to Support City-Scale Building Energy Efficiency. Urban Comput. 2016, 14, 2016. [Google Scholar]
- Panigrahi, C.R.; Sarkar, J.L.; Pati, B.; Buyya, R.; Mohapatra, P.; Majumder, A. Mobile Cloud Computing and Wireless Sensor Networks: A review, integration architecture, and future directions. IET Netw. 2021, 10, 141–161. [Google Scholar] [CrossRef]
- Yeom, K. Development of urban air monitoring with high spatial resolution using mobile vehicle sensors. Environ. Monit. Assess. 2021, 193, 375. [Google Scholar] [CrossRef] [PubMed]
- Gros, A.; Bozonnet, E.; Inard, C.; Musy, M. Simulation tools to assess microclimate and building energy-A case study on the design of a new district. Energy Build. 2016, 114, 112–122. [Google Scholar] [CrossRef]
- Sadeghi, A.R.; Bahadori, Y. Urban Sustainability and Climate Issues: The Effect of Physical Parameters of Streetscape on the Thermal Comfort in Urban Public Spaces; Case Study: Karimkhan-e-Zand Street, Shiraz, Iran. Sustainability 2021, 13, 10886. [Google Scholar] [CrossRef]
- Li, X.; Ying, Y.; Xu, X.; Wang, Y.; Hussain, S.A.; Hong, T.; Wang, W. Identifying key determinants for building energy analysis from urban building datasets. Build. Environ. 2020, 181, 107114. [Google Scholar] [CrossRef]
- Oleniacz, R.; Gorzelnik, T. Assessment of the Variability of Air Pollutant Concentrations at Industrial, Traffic and Urban Background Stations in Krakow (Poland) Using Statistical Methods. Sustainability 2021, 13, 5623. [Google Scholar] [CrossRef]
- Liu, X.; Gao, X. A New Study on Air Quality Standards: Air Quality Measurement and Evaluation for Jiangsu Province Based on Six Major Air Pollutants. Sustainability 2018, 10, 3561. [Google Scholar] [CrossRef] [Green Version]
- Natanian, J.; Auer, T. Balancing urban density, energy performance and environmental quality in the Mediterranean: A typological evaluation based on photovoltaic potential. Energy Procedia 2018, 152, 1103–1108. [Google Scholar] [CrossRef]
- Xue, Y.; Li, X.; Duo, S.; Ren, Y.; Li, Y. Study of a New Pseudo-range Differential Method for the Correction of Ephemeris Error and Ionospheric Error. In Proceedings of the 2013 3rd International Conference on Advanced Measurement and Test (AMT 2013), Xiamen, China, 13–14 March 2013; pp. 711–715. [Google Scholar]
- Xie, J.; Zhang, J. Development and Innovation of BeiDou Navigation Satellite System. Aerosp. China 2020, 21, 5–10. [Google Scholar]
- Meng, J.; Wang, M.; Xuekelaiti, X. Characteristics of air pollution and environmental economic efficiency in Beijing-Tianjin-Hebei and surrounding areas. Arab. J. Geosci. 2021, 14, 1072. [Google Scholar] [CrossRef]
- Liu, D.; Sun, K. Short-term PM2.5 forecasting based on CEEMD-RF in five cities of China. Environ. Sci. Pollut. Res. 2019, 26, 32790–32803. [Google Scholar] [CrossRef] [PubMed]
- Li, J.; Shen, J.; Li, X. Prediction of PM2.5 Concentration Based on NDFA-LSSVM Model. In Proceedings of the 2018 Chinese Automation Congress (CAC), Xi’an, China, 30 November–2 December 2018. [Google Scholar]
- Zhang, W.; Liu, Z.; Zhang, Y.; Yaluk, E.; Li, L. The Impact of Air Quality on Inbound Tourist Arrivals over China Based on Grey Relational Analysis. Sustainability 2021, 13, 10972. [Google Scholar] [CrossRef]
- Jin, Y.; Zhang, N. Comprehensive Assessment of Thermal Comfort and Indoor Environment of Traditional Historic Stilt House, a Case of Dong Minority Dwelling, China. Sustainability 2021, 13, 9966. [Google Scholar] [CrossRef]
- Xu, J.; Liu, J.; Xu, Y.; Pei, T. Visualization and analysis of local and distant population flows on the Qinghai-Tibet Plateau using crowd-sourced data. J. Geogr. Sci. 2021, 31, 231–244. [Google Scholar] [CrossRef]
- Li, X.; Yang, T.; Zeng, Z.; Li, X.; Zeng, G.; Liang, J.; Chen, X. Underestimated or overestimated? Dynamic assessment of hourly PM2.5 exposure in the metropolitan area based on heatmap and micro-air monitoring stations. Sci. Total. Environ. 2021, 779, 146283. [Google Scholar] [CrossRef] [PubMed]
- Lepenies, R.; Zakari, I.S. Citizen Science for Transformative Air Quality Policy in Germany and Niger. Sustainability 2021, 13, 3973. [Google Scholar] [CrossRef]
- Shelestov, A.; Yailymova, H.; Yailymov, B.; Kussul, N. Air Quality Estimation in Ukraine Using SDG 11.6.2 Indicator Assessment. Remote Sens. 2021, 13, 4769. [Google Scholar] [CrossRef]


| Serial No. | Meaning | Description |
|---|---|---|
| (1) | UTC Time | hhmmss (hour minute seconds) |
| (2) | Positioning state | A = effective positioning, V = invalid positioning |
| (3) | Latitude | ddmm.mmmmm (degree minute) |
| (4) | Hemisphere (latitude) | N (Northern Hemisphere) or S (Southern Hemisphere) |
| (5) | Longitude | ddmm.mmmmm (degree minute) |
| (6) | Hemisphere (longitude) | E (East Longitude) or W (West Longitude) |
| (7) | Speed Kn | Speed over ground, knots |
| (8) | Track true | Track made good, degrees True |
| (9) | Date | Date: dd/mm/yy |
| (10) | Mag variation | Magnetic variation, degrees |
| (11) | Var direction | Magnetic variation direction E/W |
| (12) | Mode indicator | Positioning system mode indicator |
| Experiment No. | Mobile Tool | Monitoring Location | Monitoring Height | Moving Speed |
|---|---|---|---|---|
| 1 | People | Campus A | About 1 m | 1 m/s |
| 2 | Bicycle | Campus A | About 1 m | 2.5 m/s |
| 3 | Unmanned aerial vehicle | Campus B | 20 m | 10~20 m/s |
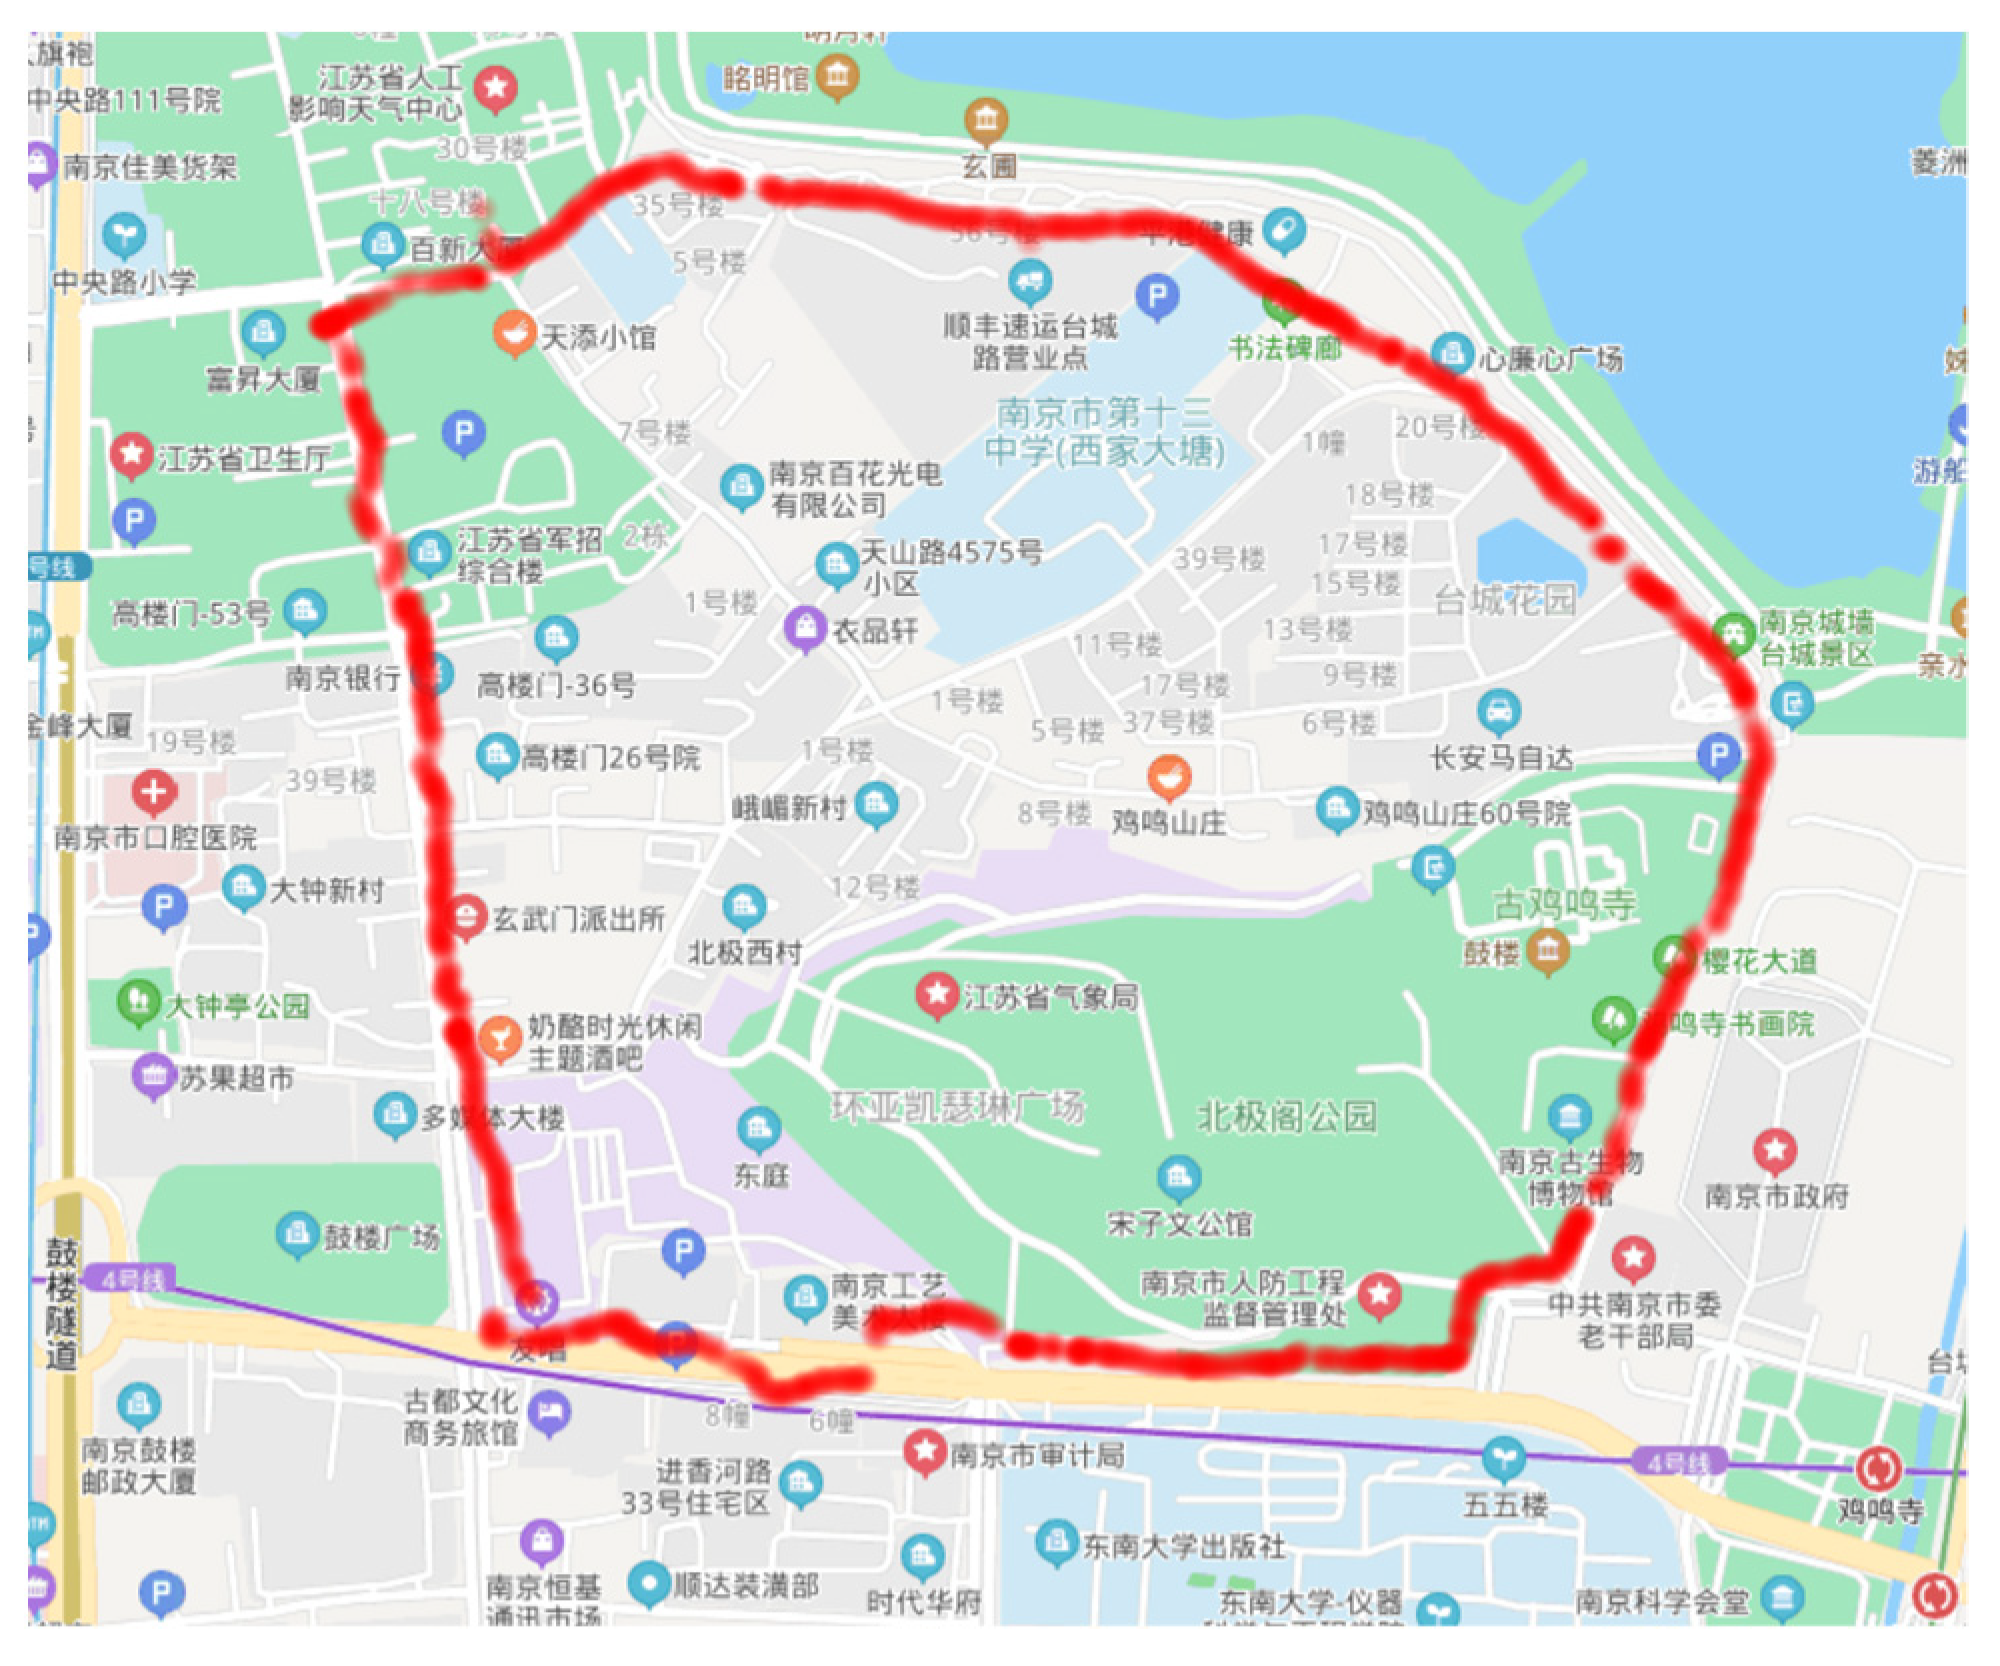
| 4 | Bicycle | Urban area (morning) | About 1 m | 2.5 m/s |
| 5 | Bicycle | Urban area (evening) | About 1 m | 2.5 m/s |
| Serial No. | Main Pollutants | Duration | Concentration Limit | Unit | |
|---|---|---|---|---|---|
| Level I | Level II | ||||
| 1 | SO2 | Annual mean concentration | 20 | 60 | μg/m3 |
| 24 h mean concentration | 50 | 150 | |||
| 1 h mean concentration | 150 | 500 | |||
| 2 | NO2 | Annual mean concentration | 40 | 40 | |
| 24 h mean concentration | 80 | 80 | |||
| 1 h mean concentration | 200 | 200 | |||
| 3 | CO | 24 h mean concentration | 4 | 4 | mg/m3 |
| 1 h mean concentration | 10 | 10 | |||
| 4 | O3 | 8-h daily maximum concentration | 100 | 160 | μg/m3 |
| 1 h mean concentration | 160 | 200 | |||
| 5 | PM10 | Annual mean concentration | 40 | 70 | |
| 24 h mean concentration | 50 | 150 | |||
| 6 | PM2.5 | Annual mean concentration | 15 | 35 | |
| 24 h mean concentration | 35 | 75 | |||
Publisher’s Note: MDPI stays neutral with regard to jurisdictional claims in published maps and institutional affiliations. |
© 2021 by the authors. Licensee MDPI, Basel, Switzerland. This article is an open access article distributed under the terms and conditions of the Creative Commons Attribution (CC BY) license (https://creativecommons.org/licenses/by/4.0/).
Share and Cite
Ren, J.; Li, R.; Jia, F.; Yang, X.; Luo, Y.; Wu, C.; Wang, W.; Yang, Y. Fine-Granularity Urban Microclimate Monitoring Using Wearable Multi-Source Sensors. Sustainability 2021, 13, 14062. https://doi.org/10.3390/su132414062
Ren J, Li R, Jia F, Yang X, Luo Y, Wu C, Wang W, Yang Y. Fine-Granularity Urban Microclimate Monitoring Using Wearable Multi-Source Sensors. Sustainability. 2021; 13(24):14062. https://doi.org/10.3390/su132414062
Chicago/Turabian StyleRen, Jinjing, Runfa Li, Fengshuo Jia, Xinhao Yang, Yusheng Luo, Chenglin Wu, Wei Wang, and Yuan Yang. 2021. "Fine-Granularity Urban Microclimate Monitoring Using Wearable Multi-Source Sensors" Sustainability 13, no. 24: 14062. https://doi.org/10.3390/su132414062