Article

Usability Evaluation of Food Wastage Mobile Application: A Case of Pakistan

1
Department of Information Technology, Faculty of Physical Sciences, Government College University, Faisalabad 38000, Pakistan
2
Department of Computer Science, Faculty of Engineering and Technology, Lahore College for Women University, Lahore 54000, Pakistan
*
Authors to whom correspondence should be addressed.
Sustainability 2021, 13(24), 14027; https://doi.org/10.3390/su132414027
Submission received: 26 July 2021 / Revised: 24 October 2021 / Accepted: 28 November 2021 / Published: 20 December 2021
(This article belongs to the Special Issue Sustainability in Agribusiness Food Chains)

Abstract

:
The continuous rise in food scarcity is creating an alarming situation in underdeveloped countries and Pakistan is no exception. According to the Global Hunger Report published in 2020, Pakistan was ranked 88th among 107 countries, with 28.5% of the population under-nourished. To address the situation, food resources need to be more effectively utilized. To reduce food wastage, various efforts have been made to identify the issues associated with the lack of adoption of food wastage mobile application(s). Using purposeful sampling and data from 150 respondents collected from a public sector university and a software house, participants’ experience in using selected food wastage mobile applications were evaluated. In terms of usability parameters, the study proposes improvements in the prototype design.

1. Introduction

The terms food waste and food loss are used interchangeably; however, they are quite different in terms of their scope. Food waste is defined with respect to retailers and consumers, whereas food loss refers to a decrease in food quantity and quality while making it inadequate for human consumption starting from harvesting to processing and eventually distribution [1].
By reducing food waste and food loss, more food can be made available for consumption. In the food waste paradigm, the output of the agricultural system is sufficient for human consumption; however, food waste has a direct relationship with food insecurity. Avoiding food wastage leads to utilization/consumption of more food and ultimately less burden on scarce natural resources [2,3,4].
Food wastage and hunger are two extreme concerns on the landscape of global food insecurity. The rising issue of hunger and malnutrition is a challenge for the world especially for developing countries [3,4]. It is estimated that each year around 1.3 billion tons of food is wasted around the globe, with a major share from the developed countries [5]. According to the Food and Agriculture Organization (FAO), food worth USD 680 billion and USD 310 billion was wasted in developed and developing countries, respectively [6]. In Pakistan, approximately 36 million tons of food was wasted which is 40% of total food consumption [5]. Wasted food results in rising environmental issues such as the emission of greenhouse gases and global warming [2,3,7]. Moreover, an average of 1.4 billion hectares of land has been reported to be occupied by wasted food [8].
Food wastage has a negative impact on the economy due to imprudent loss of productive resources. According to FAO [5], 1.21 million tons of food was wasted in Sweden. In the USA, 55 million tons of food was wasted per year, which is 29% of the annual production cost. It was estimated that food wastage in the USA would reach 50% in 2030 [9]. In India, due to the lack of cold storage facilities, 40% of food is wasted annually [10,11]. These statistics are alarming and require emergency measures to avoid global food scarcity.
Various studies have investigated food wastage behavior and the social impact of food wastage [6,8,12]. In 2017, an under-nourishment rate of 20.4% was observed in Africa, 11.4% in Asia, and 6.1% in Latin America and the Caribbean. Apart from developing countries, 14% of food insecurity was also observed in the USA [4].
One solution to the problem of overcoming the hunger rate, is to reduce food wastage [12,13]. In this regard, advanced technological solutions can be devised to assess, measure, and monitor food consumption and waste patterns. To avoid food wastage, mobile applications can greatly facilitate the monitoring of food usage patterns and influence the user to change food consumption behavior [14].
In this research, the food wastage issue was addressed by evaluating technological solutions in the form of mobile applications. Multiple applications have been designed by the research community; however, they fall short in two major areas: (1) adoption by the user and (2) providing effective results. The main reason for this is the gap in adopting and coherently employing user experience and usability principles at the application design stage [13].
In this study, the objective was to evaluate selected food wastage mobile applications according to usability principles and to propose improved design through proof-of-concept evaluation. In considering this overarching objective, two research questions were set:
RQ1:
How could a solution be designed by considering usability principles for food wastage mobile applications in the context of Pakistan?
RQ2:
How could the proposed solution be evaluated for its adoption by users?
This research has both theoretical and practical applications. First, the study proposed a design solution based on usability principles. Second, proof-of-concept implementation is carried out to transform the design into a working prototype. Third, the study engaged users to evaluate the proposed solution for its adoption. User responses were analyzed statistically (i.e., paired sample t-test) to measure the effectiveness of the proposed solution.
The paper is structured as follows: in the next section, the literature related to this study is discussed. In Section 3, the research method adopted to conduct this research is explained. In Section 4, the results of the evaluation are provided. In Section 5, the findings of the study are discussed and in Section 6, conclusions are provided.

2. Literature Review

Usability evaluation consists of a systematic process of data collection for an in-depth analysis of solutions and products in a smart technological environment. The objective of usability evaluation is to test the quality of the interface design, figure out potential interaction issues, minimize navigation among interfaces and minimize workload, produce an eye appealing design, and verify the design according to the standards of usability [15,16].
From the broader perspective, usability evaluation has been classified into two forms, including formative and additive. The formative evaluation work at the beginning of the project sought to identify potential interaction issues and to fix them before the finalization of the product. However, an additive evaluation looks at the finished system to determine whether it meets the usability standards or not. In this research, both additive and formative evaluations were considered.
The usability evaluation for mobile applications involves multiple factors: i.e., screen size, limited capacity, interface, and context of use. These factors are considered major challenges for mobile devices [17,18,19,20]. Thus, the usability testing of mobile applications is of greater importance and a challenging task [21,22]. Nielsen [23] highlighted five attributes for usability evaluation: learnability, efficiency, memorability, errors, and satisfaction. Rosario et al. [24] evaluated the effectiveness and efficiency of mobile applications for the health sciences library; however, they did not measure user satisfaction. Alturki and Gay [25] evaluated usability through the metrics of the ISO 92141-11 usability standard, which measure the satisfaction of users. These standards provide objective measures to practice usability. Riihiaho [26] concluded that learnability, memorability, error along with cognitive load, are far less critical compared to usability and efficiency. Learnability, memorability, and error recognition, along with cognitive load, are difficult to explore without the interaction of the users [19,20,21].
From the findings of Zaina and Álvaro [27], it was evident that the attribute of learnability had an impact on effective interaction and achieving optimal performance. Learnability increased user experience and the effectiveness of their interaction with the application. Furthermore, learnability influences user satisfaction [28,29,30]. There are a number of activities that contribute to improving the user experience, which further influences user interaction such as successful completion of task in a given time and completion of the task using synchronized steps [31].
Apart from learnability, memorability also influences user experience with mobile applications [32]. Memorability determines the exact needs of the users and users can remember their actions. Since users can easily remember their steps, they can readily perform these activities [33,34]. In addition to this, memorability can be quantified by requesting members to perform various activities they carried out earlier or have now become adept in performing [25].
Kaikkonen et al. [35] identified that mobile applications should not be defective and should be easy to learn. Moreover, the menu should be efficient, effective, and easy to use. Ji et al. [36] suggested usability principles that include consistency, familiarity, predictability, learnability, simplicity, feedback, error indication, recoverability, memorability, flexibility, effectiveness, efficiency, and effort. Kim et al. [37] highlighted that usability is directly associated with memory, learning, effectiveness, efficiency, flexibility, and user satisfaction. Nayebi et al. [38] suggested that mobile applications should be easy to use and user-friendly. Moreover, the tasks should be completed quickly. Singh and Razali. [39] highlighted that effectiveness, efficiency, satisfaction, usefulness, and aesthetics are key dimensions of usability. Lai and Zhang [40] emphasized that mobile application should be easy to use, effective, and satisfactory for users. Hoehle and Venkatesh [41] highlighted mobile usability guidelines and constructs for measuring the usability of mobile applications. These constructs include graphics, color, control capabilities, access methods, finger manipulation, suitable font, shape, hierarchy, animation, and screen transitions. In multiple research studies, other usability parameters were also identified, which include consistency, simplicity, feedback, flexibility, user-friendliness, and aesthetics.
The detailed review of literature facilitates the researcher to understand the problem area. To identify the problem area, an in-depth analysis of usability principles was performed to select appropriate usability parameters for the research study.

3. Materials and Methods

3.1. Criteria for Selection of Food Wastage Mobile Application

At the commencement of the research study, food wastage mobile applications were identified from the “App 164 Store” based on their user rating, usage, and familiarity. This resulted in the selection of seven applications, which were further analyzed (Table 1) to identify the potential mobile application for this research. The expired monitor mobile application was selected based on its features, which include google maps service, coverage for a large geographical area, and integration with BYODs, alert system, and “best before date” information about the food. The selected application was analyzed according to HCI usability features to improve its design.
The comparison facilitated in the selection of a representative application named “expired monitor” which had comprehensive features and high ratings over the web.

3.2. Research Phases

The research was divided into two major phases: phase I and phase II. In phase I and II, the usability analysis of the expired monitor mobile application was carried out by employing usability parameters selected for this research and provided in Table 2.
Based on the detailed review of literature, a comparison was conducted to justify adopted usability principles. The comparison is summarized in Table 1.
Various existing studies mentioned in Table 2 are aligned with the identified usability principles. Besides the detailed review of literature on usability parameters, an in-depth analysis is carried out on existing food wastage mobile applications to select the appropriate one to proceed with improvement in the design. The existing application comparison is provided in Table 1.
The survey instrument items were devised for each usability parameter based on extensive literature analysis. The questionnaire was designed for both phases (phase I and II) by adopting a quantitative research approach. A total of 150 respondents were approached to measure the usability of the selected application before and after the proposed design. The participants of the survey were well aware of food wastage mobile applications, were technically equipped to use the application, and had sufficient knowledge of HCI usability principles.
During the survey in phase I, the participants’ responses towards the existing design of a mobile application were observed and collected. In phase II, the same respondents were approached to perform a usability evaluation of the design proposed by this study.

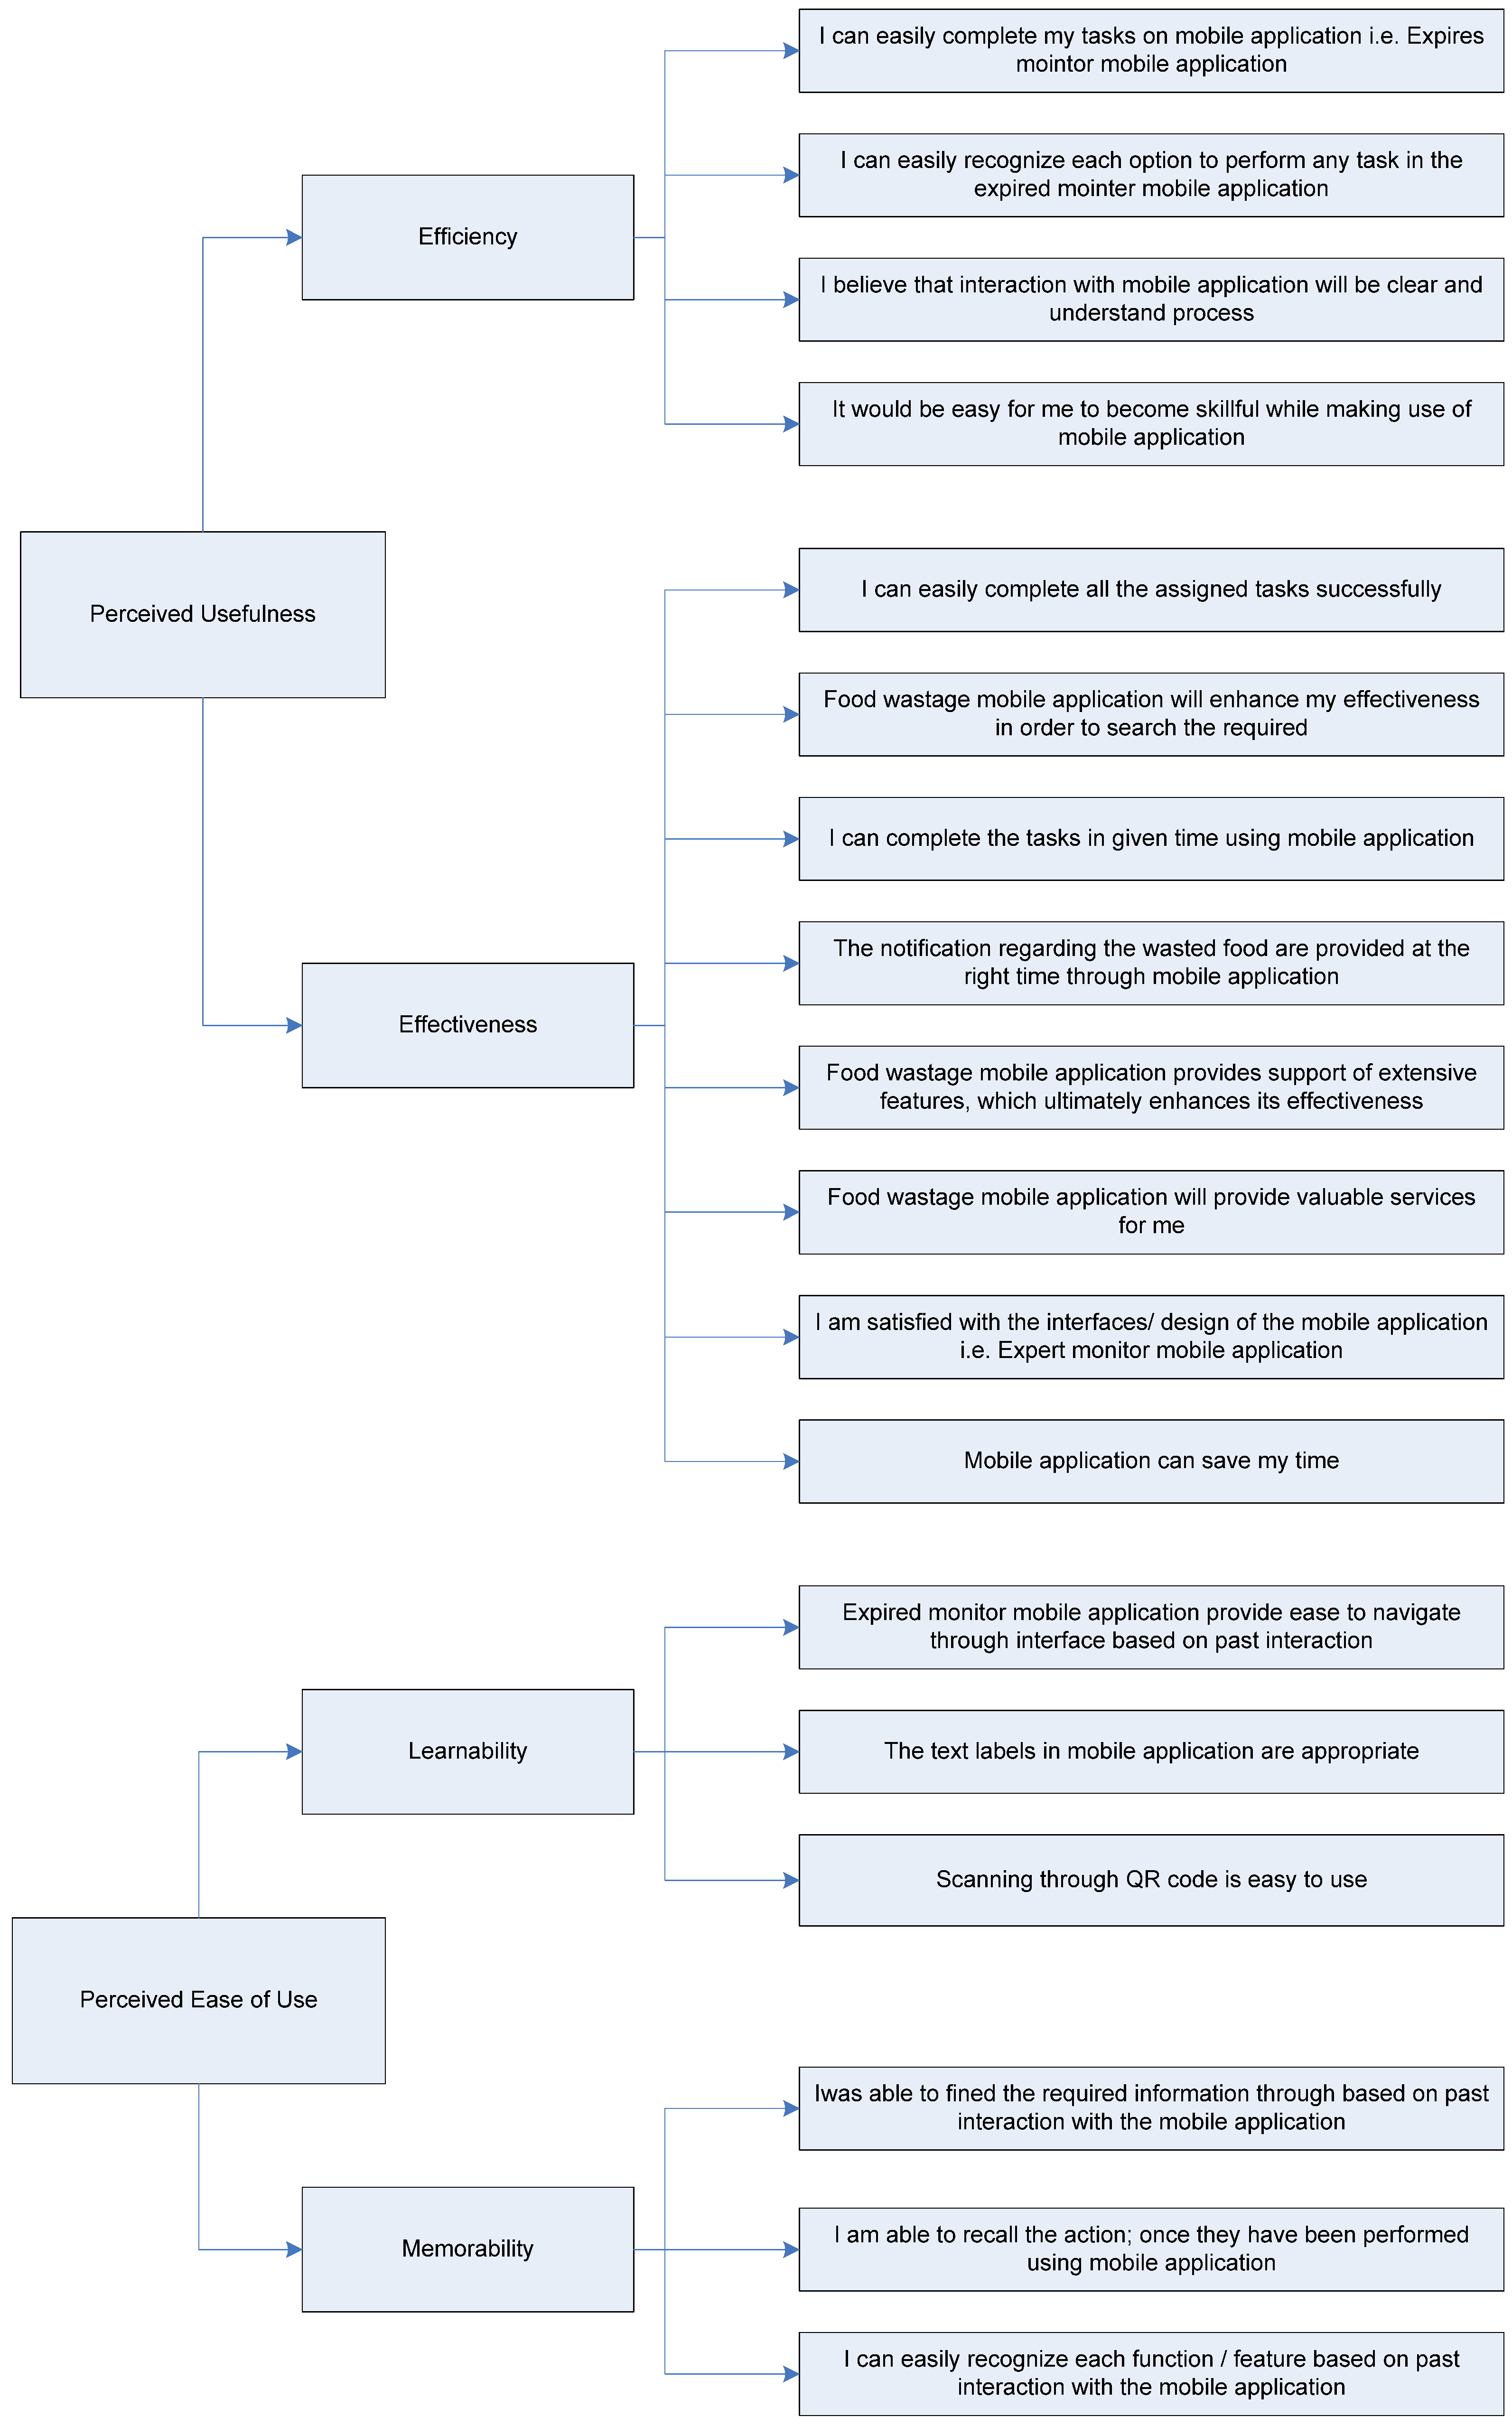
3.3. Questionnaire Design and Items

In this research, the Technology Adoption Model (TAM) was employed, which measures users’ acceptance and use of technology. Thematic analysis was carried out to map TAM constructs to usability parameters. At the base level, the usability parameters were mapped and grouped into two major constructs of TAM: perceived usefulness and perceived ease of use. These constructs of TAM had been employed in various other studies to measure users’ behavior and intention towards technology adoption i.e., expired monitor mobile application in this case [34,49].
The selected constructs were used to measure users’ responses towards the existing and proposed design of the selected mobile application. The mapping of usability parameters and survey instrument items is provided in Figure 1. At the root level, usability attributes were grouped over the constructs of TAM to measure users’ behavior towards the effectiveness of the mobile application.

Ethical Information

Research including participants requires ethical considerations and formal procedures to ensure them. In this research, participants’ personal information was not considered; however, respondents’ consent was mandatory and obtained before the survey.
The survey instrument items were obtained from existing studies as they were already validated and were further customized to address the needs of this research.

3.4. Sampling Strategy and Data Collection

Purposive sampling is a technique in which the researcher relies on his or her own judgment while selecting members of the population to participate in the study [50]. In this research, the population for the survey was selected based on the expertise of using food wastage mobile applications. A total of 185 respondents were approached; however, 150 responses were received for both phases (phase I and phase II). Incomplete responses were excluded from the dataset.
The respondents were information technology (IT) students and professionals from a public sector university and software houses respectively.
The region of Punjab, Pakistan was selected for data collection. To evaluate responses, a five-point Likert scale was used where five (5) represented strongly agree, four (4) represented agree, three (3) represented neutral, two (2) represented disagree, and one (1) represented strongly disagree. The survey was conducted physically to observe participants’ behavior and ensure data validity. SPSS 25.0 was used to perform statistical tests.

4. Results

To measure instrument validity, tests for reliability and construct validity were conducted on the data. Thereafter, a paired sample t-test was applied to measure the proposed application design from the users’ perspective.

4.1. Data Analysis

Cronbach’s alpha was employed to test the internal consistency of the survey instrument items. Four cutoff points were used to measure reliability including excellent reliability (0.90 and above), high reliability (0.70–0.90), moderate reliability (0.50–0.70), and low reliability <0.50 [51]. The results show that three constructs fall under the category of “high reliability”, Table 3.
The results showed that all constructs fall under the category of “high reliability”. However, one construct, efficiency got a score lower than 0.7 and was categorized under “moderate reliability”.

4.2. Construct Validity

Construct validity was performed using factor analysis with “varimax” rotation. This data reduction technique is used to reduce a large number of variables to a smaller set of variables [41]. Further, it is used to group items into their respective usability parameters. The Bartlett test of sphericity was found to be significant at p < 0.000, and the Kaiser–Meyer–Olkin (KMO) test for sampling adequacy was found to be significant with a value of 0.876. The recommended value for KMO was greater than 0.5.
The results of construct validity were analyzed, and a few survey instrument items were excluded due to low factor loadings, as shown in Table 4.
The variables such as EEF2, EEF5, and EEF6 of effectiveness were not considered due to low factor loadings; similarly, variable E1 of efficiency was also ignored. These excluded survey instrument items, represented as ‘-‘ in Table 4.
The data were analyzed further using paired sample t-test to measure the mean differences among the sampled data to judge the effectiveness of the proposed design.

4.3. Food Wastage Mobile Applications Behavior of Respondents (Phase-I)

In phase I, the design analysis of the selected mobile application was carried out based on the usability parameters: i.e., effectiveness, efficiency, learnability, and memorability. The questionnaire was used to evaluate the effectiveness of the existing design (Figure A1). The results of phase I showed that the mean values of the usability parameters were low, which indicated that users were less satisfied with the original design of the selected mobile application.

4.4. Food Wastage Mobile Application Behavior of Respondents (Phase-II)

The design of the original application was modified according to usability parameters and another survey was conducted in phase II. The new prototype was provided to participants to evaluate the effectiveness of the proposed design.
The original design of the mobile application required manual entry of information such as product name, best before date, product description, and attaching a QR code picture. In contrast, the proposed design used an integrated QR scanner that could automatically add product-related information, which provided ease to the users and enhanced the effectiveness of the mobile application. Additionally, the interfaces of the proposed design were reduced in terms of the number of screens. The reduction in the number of screens resulted in good navigation across the application [24,35,36,47]. Moreover, the placement of all the features under the menu tab reduced the overload of visiting interfaces one by one and increased the application’s effectiveness. By managing the menu, the features of the application could easily be recognized by the users which contributed towards learnability and memorability of the mobile application [24,36,37,39]. Besides the other features, a search feature was also added in the design to facilitate users in accessing relevant information. Finally, a prominent feature of timely notifications and alerts was made available in the proposed design. By providing all these features in the proposed design, the application became more robust and effective for users. The proof-of-concept implementation of the proposed design was carried out in the form of prototype construction by considering usability parameters of efficiency, effectiveness, learnability, and memorability. The prototype was further evaluated through a paired sample t-test [52]. The results of the test are provided in Table 5. The results of usability parameters were found to be significant at (p < 0.000).
The mean values of the proposed design (Figure A2) were higher when compared to the mean values of the constructs in the original design of the mobile application. Therefore, a noticeable experience transformation was observed after considering usability parameters in the proposed design. From this evaluation, it was apparent that the proposed design would positively influence the user experience and improve their satisfaction level with the food wastage mobile application.

5. Discussion

5.1. Recommendations

In this research, a design was proposed for a food waste mobile application by considering usability parameters. The usability elements of layout, navigation, design, content, and performance were integrated in the interfaces to make the application more effective. The proposed design was evaluated through proof-of-concept implementation and participant observation surveys.
The user responses from the experience of using both designs were statistically analyzed to measure the effectiveness of the proposed design. The findings of the study were transformed into five recommendations:
Recommendation 1:
 Layout
For layout design, the major elements considered to be more effective included placing contents together in the form of a menu, avoiding horizontal scrolling, arranging contents vertically, avoiding making use of tabs, and making the search field visible to everyone.
Recommendation 2:
 Navigation
Another major consideration of the usability element was navigation. The objective was to make navigation menus easy and simple. Further, one-level navigation menus were used to avoid multiple options in the menu. In the proposed design, the menu was integrated to make titles, links, and navigation items self-explanatory and descriptive.
Recommendation 3:
 Design
The third major usability element was design. In the proposed design, the idea was to make the design simple, consistent, uniform, and clear. The same color scheme was followed throughout the mobile application. This made things easily identifiable, accessible, and visible for application users.
Recommendation 4:
 Content
Another important usability element for consideration was content. It was decided to avoid long texts and make use of simple words and sentences in the mobile application. Further, the feature of sorting content based on their importance was added.
Recommendation 5:
 Performance
The last considered usability element was performance. The aspect of performance was linked with the functionality of the mobile application. How quickly did the application respond to users’ queries? In this research, the focus was on the prototype. Therefore, the said usability principle was not considered while designing the interface.
The above major usability elements could be employed in future mobile applications to enhance their user experience and effectiveness.

5.2. Limitations of the Study

In this study, participants were students and professionals who were familiar with the usage of mobile applications, usability principles and the selected mobile application: i.e., the expired monitor mobile application. With consideration of the COVID-19 pandemic situation and accessibility to participants, a purposive sampling method was employed. To address the generalization aspect, there is a need to include mobile application users with a more diverse demographic background to be more representative of the whole population of Pakistan.

5.3. Future Recommendations

The future recommendations based on the gaps identified are provided below.
Recommendation 6
Expired monitor mobile application could be extended to analyze users’ experience with big data and data mining; big data have undoubtedly revolutionized the user experience. Big data analytics are used to evaluate the user’s behavior and its interaction with users [53]. This application can monitor individual behavior in the detection of expired food and its wastage.
Recommendation 7
Social media applications promote user behavior and influence others’ behavior to use a certain application or to promote trends. The results of this research study argue that user behavior must be transformed by inducing the importance of monitoring food consumption and reducing food wastage. This application can be integrated with social media platforms that will induce user behavior to reduce food wastage. For example, users can share their experience or provide weekly reports of food wasted that can promote the user experience as well as application.
Recommendation 8
Expired monitor mobile application can be upgraded by integrating artificial intelligence techniques. This approach allows for users’ purchase behavior to be evaluated and suggestions can be provided regarding their purchase behavior and about the products they consume on a regular basis.

5.4. Social, Economic and Environmental Implications

The proposed mobile application for food waste has social, economic, and environmental implications that directly affect the community. The development of the expired monitor mobile application will enhance the effective use of food and change current consumption patterns in Pakistan. This will further reduce food insecurities in underprivileged communities and contribute towards prosperity and improved economic conditions.
To address environmental sustainability, there is a strong need to prevent pollution through the adoption of more sustainable consumption behaviors [52,54], for which technology can play a major role.

6. Conclusions

Usability evaluation of different mobile applications plays a pivotal role in user experience management and enhancing the interaction of the users with mobile applications. In this research, the TAM model was employed for the usability evaluation of a food wastage mobile application. The TAM model has two core constructs: perceived usefulness (PU) and perceived ease of use (PEOU). The construct of PU considers efficiency and effectiveness, whereas the PEOU construct considers learnability and memorability.
The usability parameter of effectiveness is measured for completed tasks, satisfaction with interfaces, on-time alerts/notifications generated from the system, time-based task completion, and appropriate use of text labels. However, the usability parameter of efficiency is measured in terms of completed tasks and recognition of options available in the mobile application.
The construct of perceived ease of use is addressed through two major usability parameters: learnability and memorability. With the enhancement of learnability in the mobile application, increased user satisfaction was observed. While executing both phases of the survey (i.e., phase I and phase II), it is concluded that the proposed design represented better usability in comparison to the existing design of the mobile application.
In addition to this, the advanced statistical analysis carried out concludes that the proposed design has provided an enhanced usability experience for the expired monitor mobile application which will ultimately improve user satisfaction. The results show that an increase in learnability and memorability ultimately affect higher perceived ease of use, which is one of the core constructs of the TAM model. Additionally, it could be deduced that an increase in effectiveness and efficiency ultimately improves the usefulness of the technology. Overall, an increase in perceived usefulness and perceived ease of use leads to the adoption of technology.
It is evident from the results that the proposed design had better usability compared to the existing design of the mobile application. However, the results generated from this study cannot be extended to the general population due to sampling bias. In this study, the focus was on university students and technically equipped people having knowledge of HCI usability principles. This sample was selected to serve the purpose of developing a mobile application based on HCI usability principles.

Author Contributions

Conceptualization, M.N., M.R. and M.A.; methodology, M.N., M.R. and M.A.; formal analysis, S.M., K.B. and M.S.; resources, M.N., M.R, M.A. and S.M; data curation, M.N., K.B. and M.S.; writing—original draft preparation, M.N. and M.R.; writing—review and editing, M.R., M.A. and S.M.; funding acquisition, M.R., M.A., S.M., K.B. and M.S. All authors have read and agreed to the published version of the manuscript.

Funding

There research work received no external funding.

Institutional Review Board Statement

The study was conducted according to the guidelines provided by the Institutional Review Board, GCUF, Faisalabad.

Informed Consent Statement

Informed consent was obtained from all subjects involved in the study.

Data Availability Statement

Data used in this research will be available.

Conflicts of Interest

There is no conflict of interest.

Appendix A

Figure A1. Existing design/interface of expired monitor mobile application.
Sustainability 13 14027 g0a1

Appendix B

Figure A2. Proposed design/interface of expired monitor mobile application.
Sustainability 13 14027 g0a2

References

  1. Irani, Z.; Sharif, A.M.; Lee, H.; Aktas, E.; Topaloğlu, Z.; Wout, T.V.; Huda, S. Managing food security through food waste and loss: Small data to big data. Comput. Oper. Res. 2018, 98, 367–383. [Google Scholar] [CrossRef]
  2. FAO. Food Wastage Footprint & Climate Change; FAO: Rome, Italy, 2011; pp. 1–4. [Google Scholar]
  3. FAO. How to Feed the World in 2050. Insights from an Expert Meet; FAO: Rome, Italy, 2009. [Google Scholar]
  4. FAO. Food Security and Nutrition in the World; FAO: Rome, Italy, 2020. [Google Scholar]
  5. FAO; IFAD; UNICEF; WFP; WHO. The State of Food Security and Nutrition in the World 2018: Building Climate Resilience for Food Security and Nutrition; FAO: Rome, Italy, 2017. [Google Scholar]
  6. Dalmia, S. Visual screens in Canteens providing Real Time information of Food Wastage. In Proceedings of the 2018 Second International Conference on Green Computing and Internet of Things (ICGCIoT), Karnataka, India, 16–18 August 2018; pp. 201–204. [Google Scholar]
  7. Abeliotis, K.; Lasaridi, K.; Costarelli, V.; Chroni, C. The implications of food waste generation on climate change: The case of Greece. Sustain. Prod. Consum. 2015, 3, 8–14. [Google Scholar] [CrossRef]
  8. Jayalakshmi, K.; Pavithra, S.; Aarthi, C. Waste to wealth—A novel approach for food waste management. In Proceedings of the 2017 IEEE International Conference on Electrical, Instrumentation and Communication Engineering (ICEICE), Karur, India, 27–28 April 2017; pp. 1–5. [Google Scholar]
  9. Yildirim, H.; Capone, R.; Karanlik, A.; Bottalico, F.; Debs, P.; El Bilali, H. Food Wastage in Turkey: An Exploratory Survey on Household Food Waste. J. Food Nutr. Res. 2016, 4, 483–489. [Google Scholar]
  10. Akshay. India Wastes as Much Food as the UK Consumes. Available online: https://www.deccanchronicle.com/nation/in-other-news/230219/india-wastes-as-much-food-as-the-uk-consumes.html (accessed on 6 February 2019).
  11. Eu Fusion. Estimated European Food Waste Level. 2012. Available online: https://www.eu-fusions.org/phocadownload/Publications/Estimates%20of%20European%20food%20waste%20levels.pdf (accessed on 10 June 2021).
  12. Sandaruwani, J.R.C.; Gnanapala, W.A.C. Food Wastage and its Impacts on Sustainable Business Operations: A Study on Sri Lankan Tourist Hotels. Procedia Food Sci. 2016, 6, 133–135. [Google Scholar] [CrossRef] [Green Version]
  13. Young, C.W.; Russell, S.V.; Robinson, C.A.; Chintakayala, P.K. Sustainable Retailing—Influencing Consumer Behav-iour on Food Waste. Bus. Strateg. Environ. 2018, 27, 1–15. [Google Scholar] [CrossRef] [Green Version]
  14. FAO. Global Forest Resources Assessment 2015—Country Report Brazil; FAO: Rome, Italy, 2015. [Google Scholar]
  15. Kayem, A.V.D.M. Graphical Passwords—A Discussion. In Proceedings of the 2016 30th International Conference on Advanced Information Networking and Applications Workshops (WAINA), Crans-Montana, Switzerland, 23–25 March 2016; pp. 596–600. [Google Scholar]
  16. GHR. Global Hunger Report. 2020. Available online: https://www.globalhungerindex.org/pakistan.html#:~:text=In%20the%202020%20Global%20Hunger,See%20overview%20of%20GHI%20calculation%5D (accessed on 19 January 2021).
  17. Billi, M.; Burzagli, L.; Catarci, T.; Santucci, G.; Bertini, E.; Gabbanini, F.; Palchetti, E. A unified methodology for the evaluation of accessibility and usability of mobile applications. Univers. Access Inf. Soc. 2010, 9, 337–356. [Google Scholar] [CrossRef]
  18. Hussain, A.; Hashim, N.L.; Nordin, N.; Tahir, H.M. A METRIC-BASED EVALUATION MODEL FOR APPLICATIONS ON MOBILE PHONES. J. Inf. Commun. Technol. 2013, 12, 55–71. [Google Scholar] [CrossRef]
  19. Nah, F.F.; Siau, K.; Sheng, H. The value of mobile applications: A utility company study. Commun. ACM 2005, 48, 85–90. [Google Scholar] [CrossRef]
  20. Zhang, D.; Adipat, B. Challenges, Methodologies, and Issues in the Usability Testing of Mobile Applications. Int. J. Hum. Comput. Interact. 2005, 18, 293–308. [Google Scholar] [CrossRef]
  21. Miah, S.J.; Gammack, J.; Hasan, N. Extending the framework for mobile health information systems Research: A content analysis. Inf. Syst. 2017, 69, 1–24. [Google Scholar] [CrossRef] [Green Version]
  22. Svanæs, D.; Alsos, O.A.; Dahl, Y. Usability testing of mobile ICT for clinical settings: Methodological and practical challenges. Int. J. Med. Inform. 2010, 79, e24–e34. [Google Scholar] [CrossRef]
  23. Nielsen, J. Usability Engineering; AP Professional: Cambridge, UK, 1993; pp. 26–36. [Google Scholar]
  24. Rosario, J.-A.; Ascher, M.T.; Cunningham, D.J. A Study in Usability: Redesigning a Health Sciences Library’s Mobile Site. Med. Ref. Serv. Q. 2012, 31, 1–13. [Google Scholar] [CrossRef]
  25. Alturki, R.; Gay, V. Usability Testing of Fitness Mobile Application: Methodology and Quantitative Results. Comput. Sci. Inf. Technol. 2017, 97–114. [Google Scholar] [CrossRef]
  26. Riihiaho, S. Usability Testing. In The Wiley Handbook of Human Computer Interaction Set; Wiley-Blackwell: Hoboken, NJ, USA, 2017. [Google Scholar]
  27. Zaina, L.A.; Álvaro, A. A design methodology for user-centered innovation in the software development area. J. Syst. Softw. 2015, 110, 155–177. [Google Scholar] [CrossRef]
  28. Kurtz, A.J. The Influence of Aesthetics on the Learnability and Memorability of Website Interfaces. Available from ProQuest Dissertations & Theses Global. Available online: https://www.proquest.com/dissertations-theses/influence-aesthetics-on-learnability-memorability/docview/594659171/se-2?accountid=135034 (accessed on 10 June 2021).
  29. ICF. Market Study on Date Marking and Other Information Provided on Food Labels and Food Wastage Prevention; European Commission: Brussels, Belgium, 2018; pp. 45–55. [Google Scholar]
  30. Usda. How Much Food Waste Is There in the United States? 2019. Available online: https://www.usda.gov/foodwaste/faqs (accessed on 10 June 2021).
  31. Grandhi, B.; Appaiah Singh, J. What a waste! A study of food wastage behavior in Singapore. J. Food Prod. Mark. 2016, 22, 471–485. [Google Scholar] [CrossRef]
  32. Widodo, I.D. Usability Testing for Android Based Application ‘jogja Smart Tourism’. IOP Conf. Ser. Mater. Sci. Eng. 2017, 215, 012031. [Google Scholar]
  33. Weichbroth, P. Usability of Mobile Applications: A Systematic Literature Study. IEEE Access 2020, 8, 55563–55577. [Google Scholar] [CrossRef]
  34. Siarohin, A.; Zen, G.; Alameda-Pineda, X.; Ricci, E.; Sebe, N.; Majtanovic, C. How to make an image more memorable? A deep style transfer approach. In Proceedings of the 2017 ACM on International Conference on Multimedia Retrieval, Bucharest, Romania, 6–9 June 2017; pp. 322–329. [Google Scholar]
  35. Kaikkonen, A.; Kekäläinen, A.; Cankar, M.; Kallio, T.; Kankainen, A. Usability Testing of Mobile Applications: A Comparison Between Laboratory and Field Testing. J. Usability Stud. 2005, 1, 4–16. [Google Scholar]
  36. Ji, Y.G.; Park, J.H.; Lee, C.; Yun, M.H. A Usability Checklist for the Usability Evaluation of Mobile Phone User Interface. Int. J. Hum. Comput. Interact. 2006, 20, 207–231. [Google Scholar] [CrossRef]
  37. Kim, K.; Proctor, R.W.; Salvendy, G. The relation between usability and product success in cell phones. Behav. Inf. Technol. 2012, 31, 969–982. [Google Scholar] [CrossRef]
  38. Nayebi, F.; Desharnais, J.-M.; Abran, A. The state of the art of mobile application usability evaluation. In Proceedings of the 2012 25th IEEE Canadian Conference on Electrical and Computer Engineering (CCECE), Montreal, QC, Canada, 29 April–2 May 2012; pp. 1–4. [Google Scholar]
  39. Singh, D.; Razali, R. Usability Dimensions for Mobile Applications—A Review. Res. J. Appl. Sci. Eng. Technol. 2013, 11, 2225–2231. [Google Scholar] [CrossRef]
  40. Lai, J.; Zhang, D. ExtendedThumb: A Target Acquisition Approach for One-Handed Interaction With Touch-Screen Mobile Phones. IEEE Trans. Hum. Mach. Syst. 2015, 45, 362–370. [Google Scholar] [CrossRef]
  41. Hoehle, H.; Venkatesh, V. Mobile Application Usability: Conceptualization and Instrument Development. MIS Q. 2015, 39, 435–472. [Google Scholar] [CrossRef]
  42. Medhi, I.; Patnaik, S.; Brunskill, E.; Gautama, S.N.; Thies, W.; Toyama, K. Designing mobile interfaces for novice and low-literacy users. ACM Trans. Comput. Interact. 2011, 18, 1–28. [Google Scholar] [CrossRef]
  43. Tucker, C.A.; Farrelly, T. Household food waste: The implications of consumer choice in food from purchase to dispos-al. Local Environ. 2016, 21, 682–706. [Google Scholar] [CrossRef]
  44. Farr-Wharton, G.; Choi, J.H.J.; Foth, M. Food talks back: Exploring the role of mobile applications in reducing domestic food wastage. In Proceedings of the 26th Australian Computer-Human Interaction Conference on Designing Futures: The Future of Design, Sydney, Australia, 2–5 December 2014; pp. 352–361. [Google Scholar] [CrossRef] [Green Version]
  45. Tullis, T.S.; Nigel Bevan, A. An Overview of his Contributions to Usability and UX. J. Usability Stud. 2019, 14, 134–144. [Google Scholar]
  46. Alaimo, L.S.; Fiore, M.; Galati, A. How the Covid-19 Pandemic Is Changing Online Food Shopping Human Behaviour in Italy. Sustainability 2020, 12, 9594. [Google Scholar] [CrossRef]
  47. Heo, J.; Ham, D.-H.; Park, S.; Song, C.; Yoon, W.C. A framework for evaluating the usability of mobile phones based on multi-level, hierarchical model of usability factors. Interact. Comput. 2009, 21, 263–275. [Google Scholar] [CrossRef]
  48. Ziefle, M.; Bay, S. How to Overcome Disorientation in Mobile Phone Menus: A Comparison of Two Different Types of Navi-gation Aids. Hum. Comput. Interact. 2006, 21, 393–433. [Google Scholar] [CrossRef]
  49. Ali, A.; Alrasheedi, M.; Ouda, A.; Capretz, L.F. A Study of The Interface Usability Issues of Mobile Learning Applica-tions for Smart Phones from the User’s Perspective. Int. J. Integr. Technol. Educ. 2014, 3. [Google Scholar]
  50. Ames, H.; Glenton, C.; Lewin, S. Purposive sampling in a qualitative evidence synthesis: A worked example from a synthesis on parental perceptions of vaccination communication. BMC Med. Res. Methodol. 2019, 19, 1–9. [Google Scholar] [CrossRef] [PubMed]
  51. Taber, K.S. The Use of Cronbach’s Alpha When Developing and Reporting Research Instruments in Science Education. Res. Sci. Educ. 2018, 48, 1273–1296. [Google Scholar] [CrossRef]
  52. Amicarelli, V.; Tricase, C.; Spada, A.; Bux, C. Households’ Food Waste Behavior at Local Scale: A Cluster Analysis after the COVID-19 Lockdown. Sustainability 2021, 13, 3283. [Google Scholar] [CrossRef]
  53. Orlovska, J.; Wickman, C.; Söderberg, R. Big Data Usage Can Be a Solution for User Behavior Evaluation: An Automotive Industry Example. Procedia CIRP 2018, 72, 117–122. [Google Scholar] [CrossRef]
  54. Amicarelli, V.; Bux, C. Food waste measurement toward a fair, healthy and environmental-friendly food system: A critical review. Br. Food J. 2020, 123, 2907–2935. [Google Scholar] [CrossRef]
Figure 1. Systematic mapping of usability attributes and survey questionnaire items.
Sustainability 13 14027 g001
Table 1. Comparative Analysis of existing food wastage mobile applications.
AuthorMobile ApplicationsFeaturesLimitations of Food Wastage Mobile Applications
[31]11 h food applicationThe application was designed for a small business. Food was sold at half price.Though socio-economic consideration was considered. Google map service, was not available.
[42]No Food WastedThis application presented a picture of the leftover food at the restaurant. The application was introduced for limited areas only.
[43]Food CloudIntegration with social organizations and businesses in the UK and Ireland.Application is successfully implemented in limited areas.
[44]No Food WasteCollected leftover food from people and distribute it among the homeless in India.Application lacked integration with the mega mall’s mobile applications.
[43]CheetahFood Application showing foods that faced issues related to refrigeration.Alert based system was not found in this application.
[12]ZmartFriFood monitoring in the refrigeration. Provided monitoring of food in the fridge.Food monitoring in the refrigerator, but could not provide alert-based system.
[44]Fridge CamThe technical solution for food wastage by camera-based monitoring in the fridge.It did not provide the best before date information.
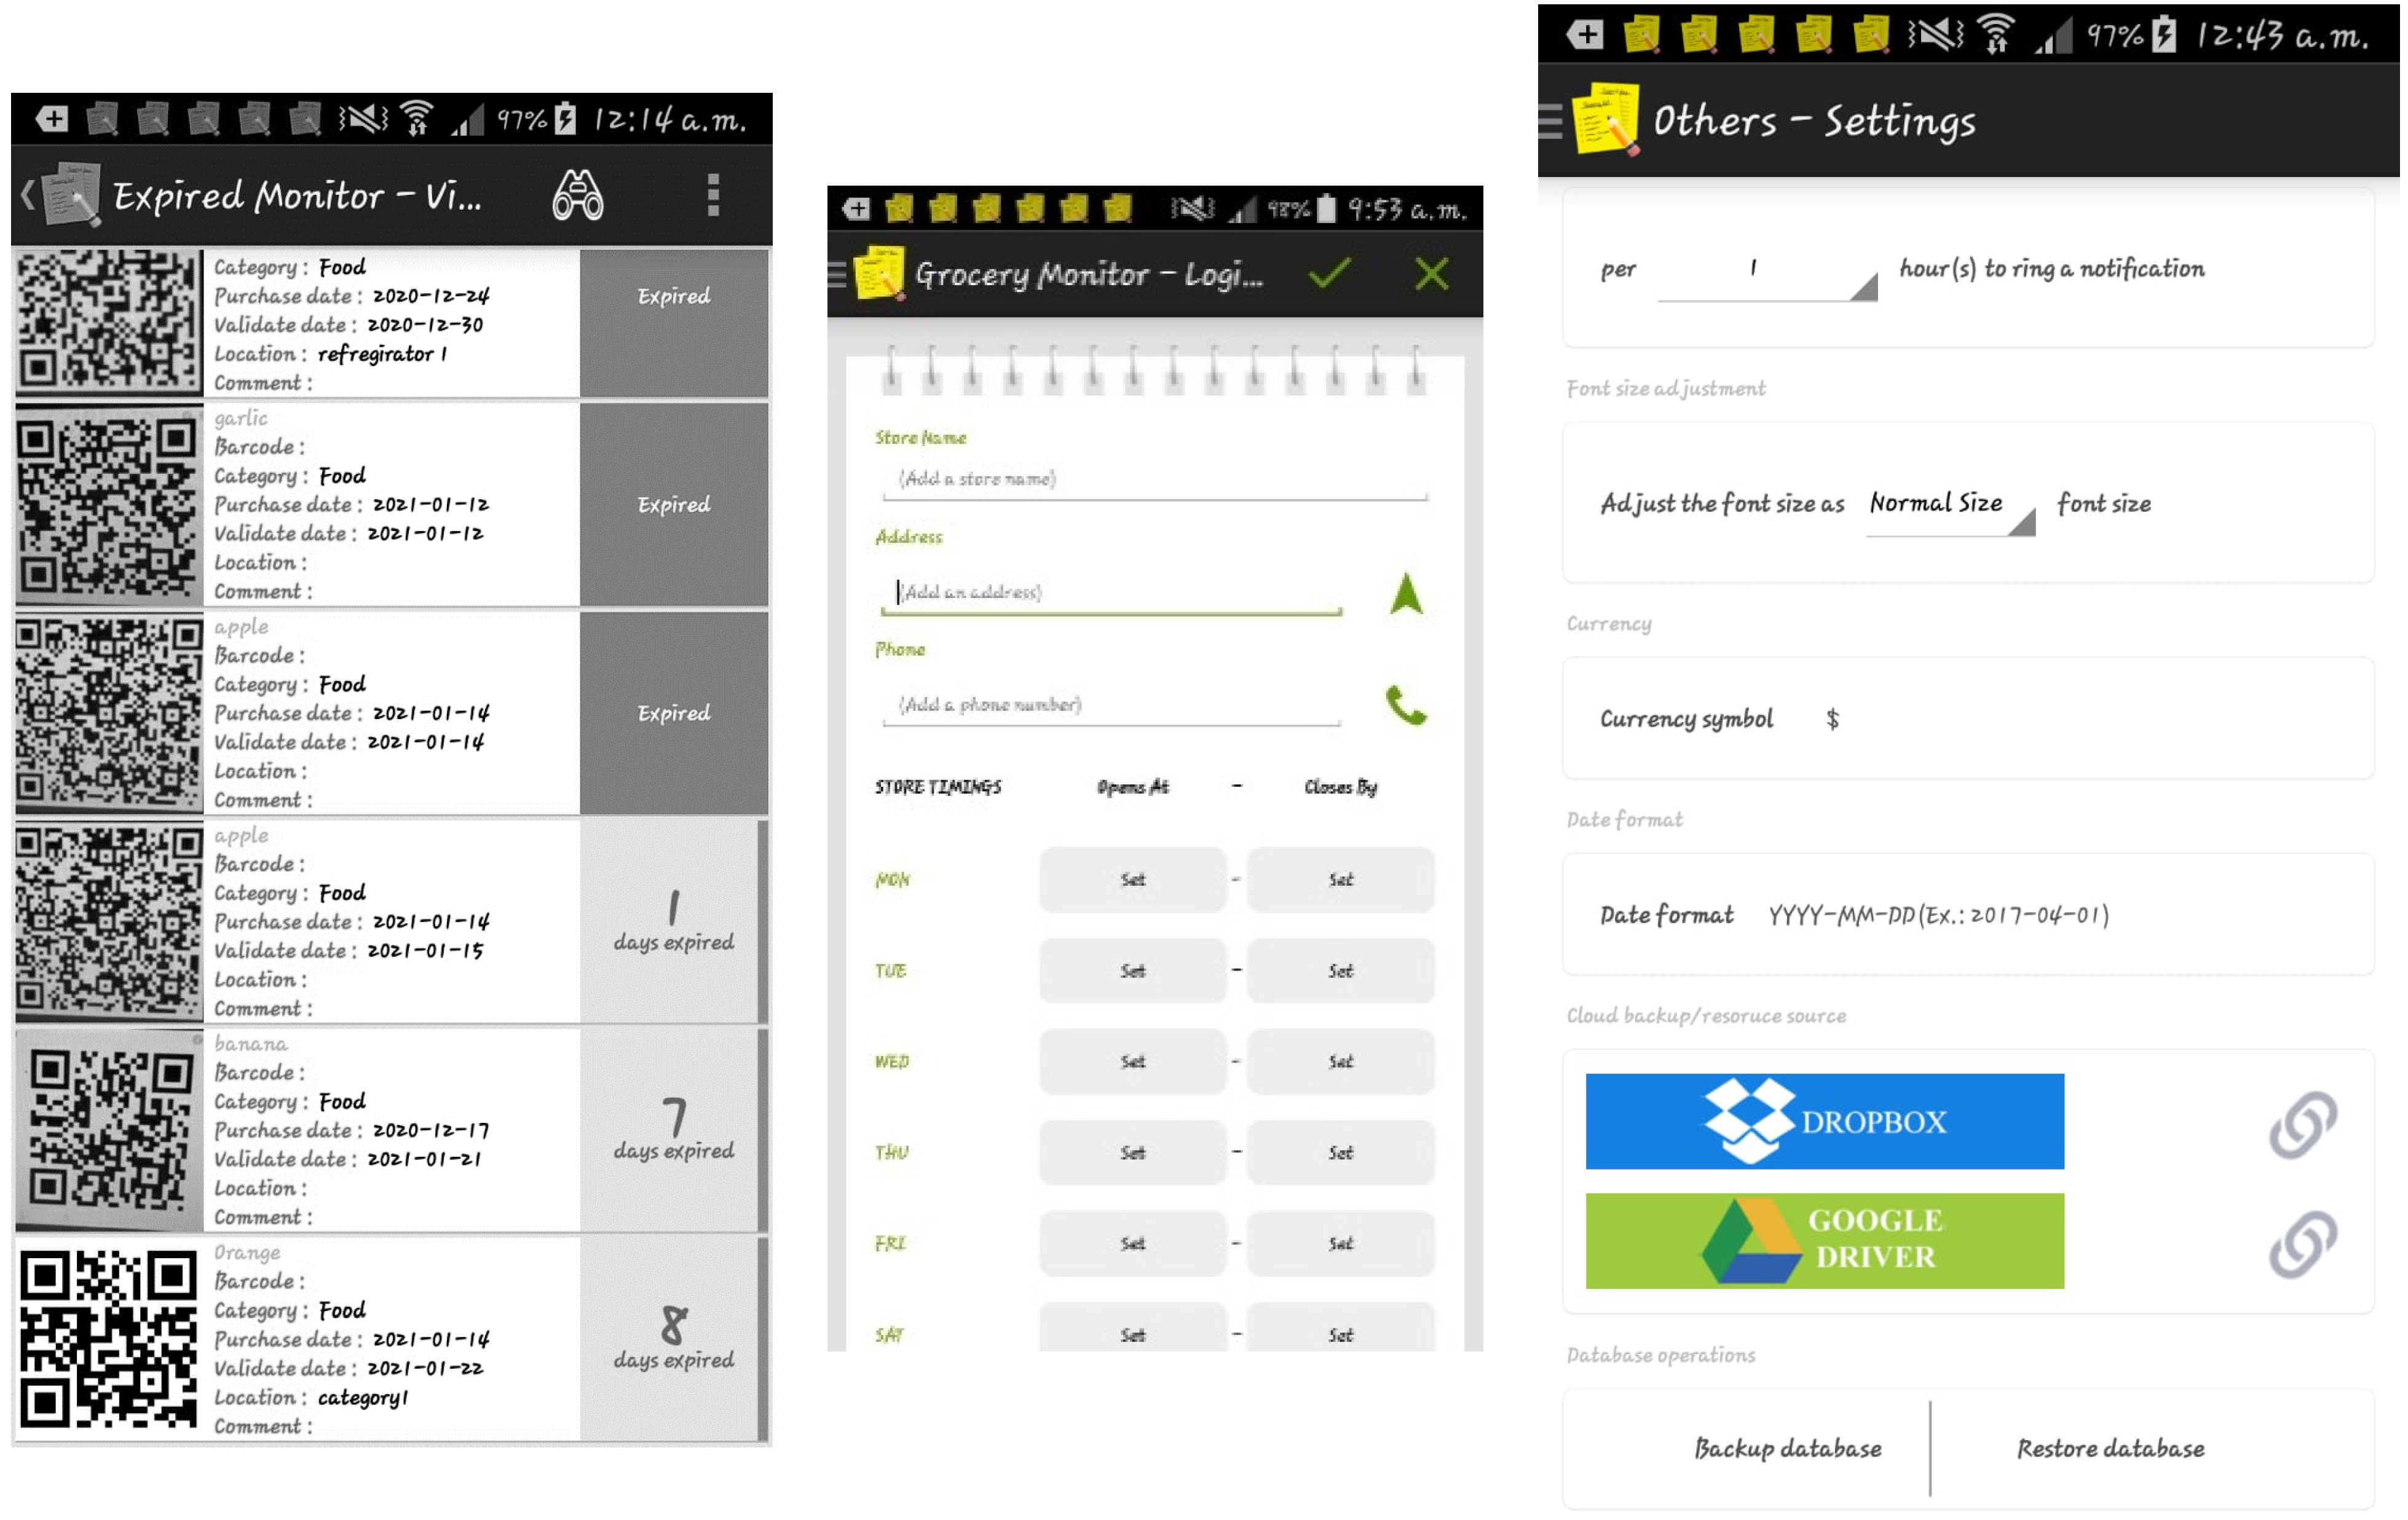
Expired Monitor Mobile ApplicationProvision of Google map service.
High Geographical coverage.
Provision of best before date food information.
Alert-based system for wasted food.
Based on the support of extensive/comprehensive features, the mobile application was selected.
Table 2. Adopted usability principles.
Usability PrinciplesSynonyms in Various /Research StudiesConceptCitationsJustification for Adopted Usability Parameters
EfficiencyEase of use
High productivity
Effort
The users can perform their tasks quickly. This principle involves the concept of speed associated with the tasks.[11,23,36,37,38,39,40,45,46]Adopted from the identified studies.
EffectivenessUsefulnessThis concept refers to performing tasks effectively.[24,36,37,39,40,46]Adopted from the identified studies.
Ease of recallRecall;
Memorability;
Recognition;
Reduction in Cognitive workload
This concept refers to remembering the operations performed in the system.[24,36,37]Adopted from the identified studies.
Ease of learningLearnabilityThis concept refers to the easy learning of the system. The system should be remembered by the users based on usability principles.[24,35,36,37,47]Adopted from the identified studies
Error ControlErrorsThis concept is linked with handling operational errors.[17,24,35,36,37]Error control was not adopted. Only interfaces were designed. Error control should be adopted when full functionality is provided for the proposed design.
Other Usability ParametersConsistency
Simplicity
Feedback
Flexibility
User Friendly
Aesthetics
Interface design parameters i.e., proposed design (solution) in this case.[36,37,38,39,40,48]These constructs were considered for the design of interfaces for the proposed solution.
Table 3. Reliability analysis using Cronbach’s alpha.
Usability ParametersNo. of ItemsCronbach Alpha
Effectiveness40.812
Efficiency60.674
Learnability30.725
Memorability30.736
Table 4. Principal component analysis (PCA) with varimax rotation method.
Survey Instrument ItemsEffectivenessEfficiencyLearnabilityMemorability
EFF10.454
EEF2-
EEF30.660
EEF40.480
EEF5-
EEF6-
EEF70.757
EEF80.870
E1 -
E2 0.704
E3 0.740
E4 0.756
LA1 0.685
LA2 0.669
LA3 0.659
MEM1 0.575
MEM2 0.544
MEM3 0.707
Table 5. Usability attributes evaluation (paired-sample t-test).
Usability ParametersDisciplineMeanStd. DeviationSignificance
Effectiveness (Pair 1)Existing Design3.13600.495520.000
Proposed Design3.82800.58115
Efficiency (Pair 2)Existing Design2.65330.547350.000
Proposed Design2.98670.73870
Learnability (Pair 3)Existing Design3.14440.602530.000
Proposed Design3.85780.59996
Memorability (Pair 4)Existing Design3.04670.605750.000
Proposed Design3.70890.69224
Publisher’s Note: MDPI stays neutral with regard to jurisdictional claims in published maps and institutional affiliations.

