
Flood Hazard Zonation Using an Artificial Neural Network Model: A Case Study of Kabul River Basin, Pakistan

 , , ,
, , ,  ,
,
Abstract
:1. Introduction
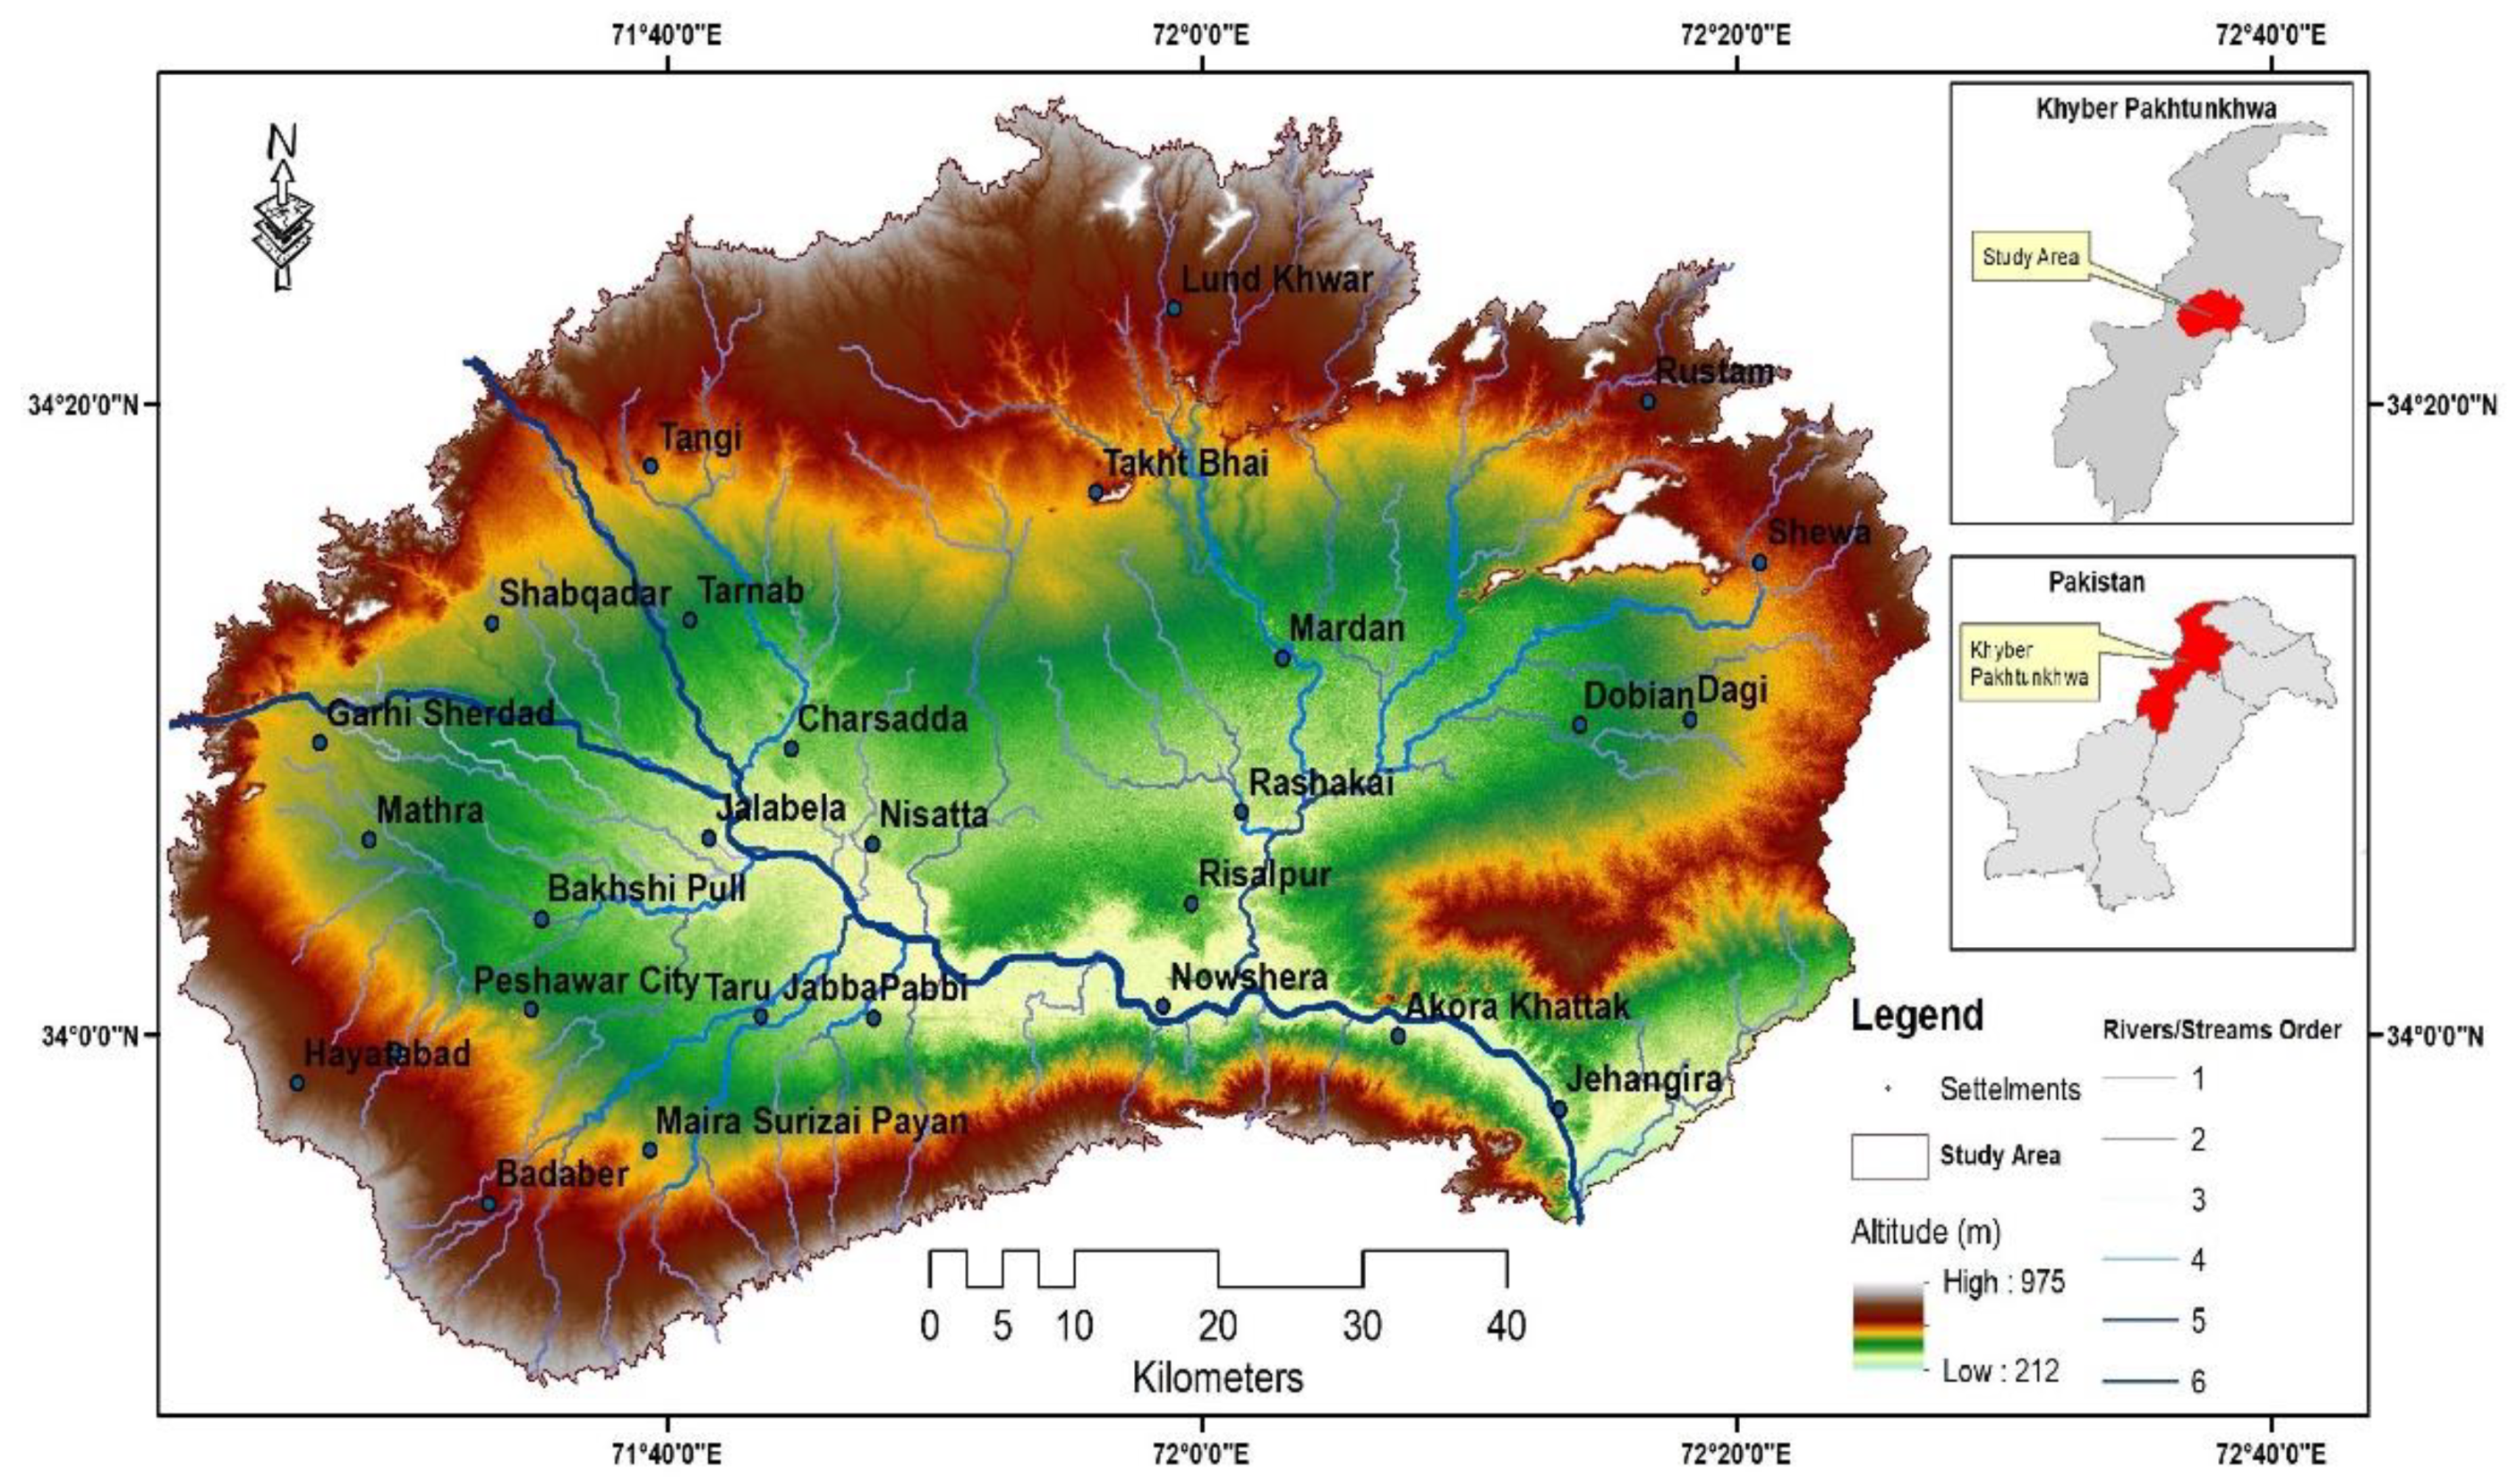
2. The Study Area
3. Methods and Materials
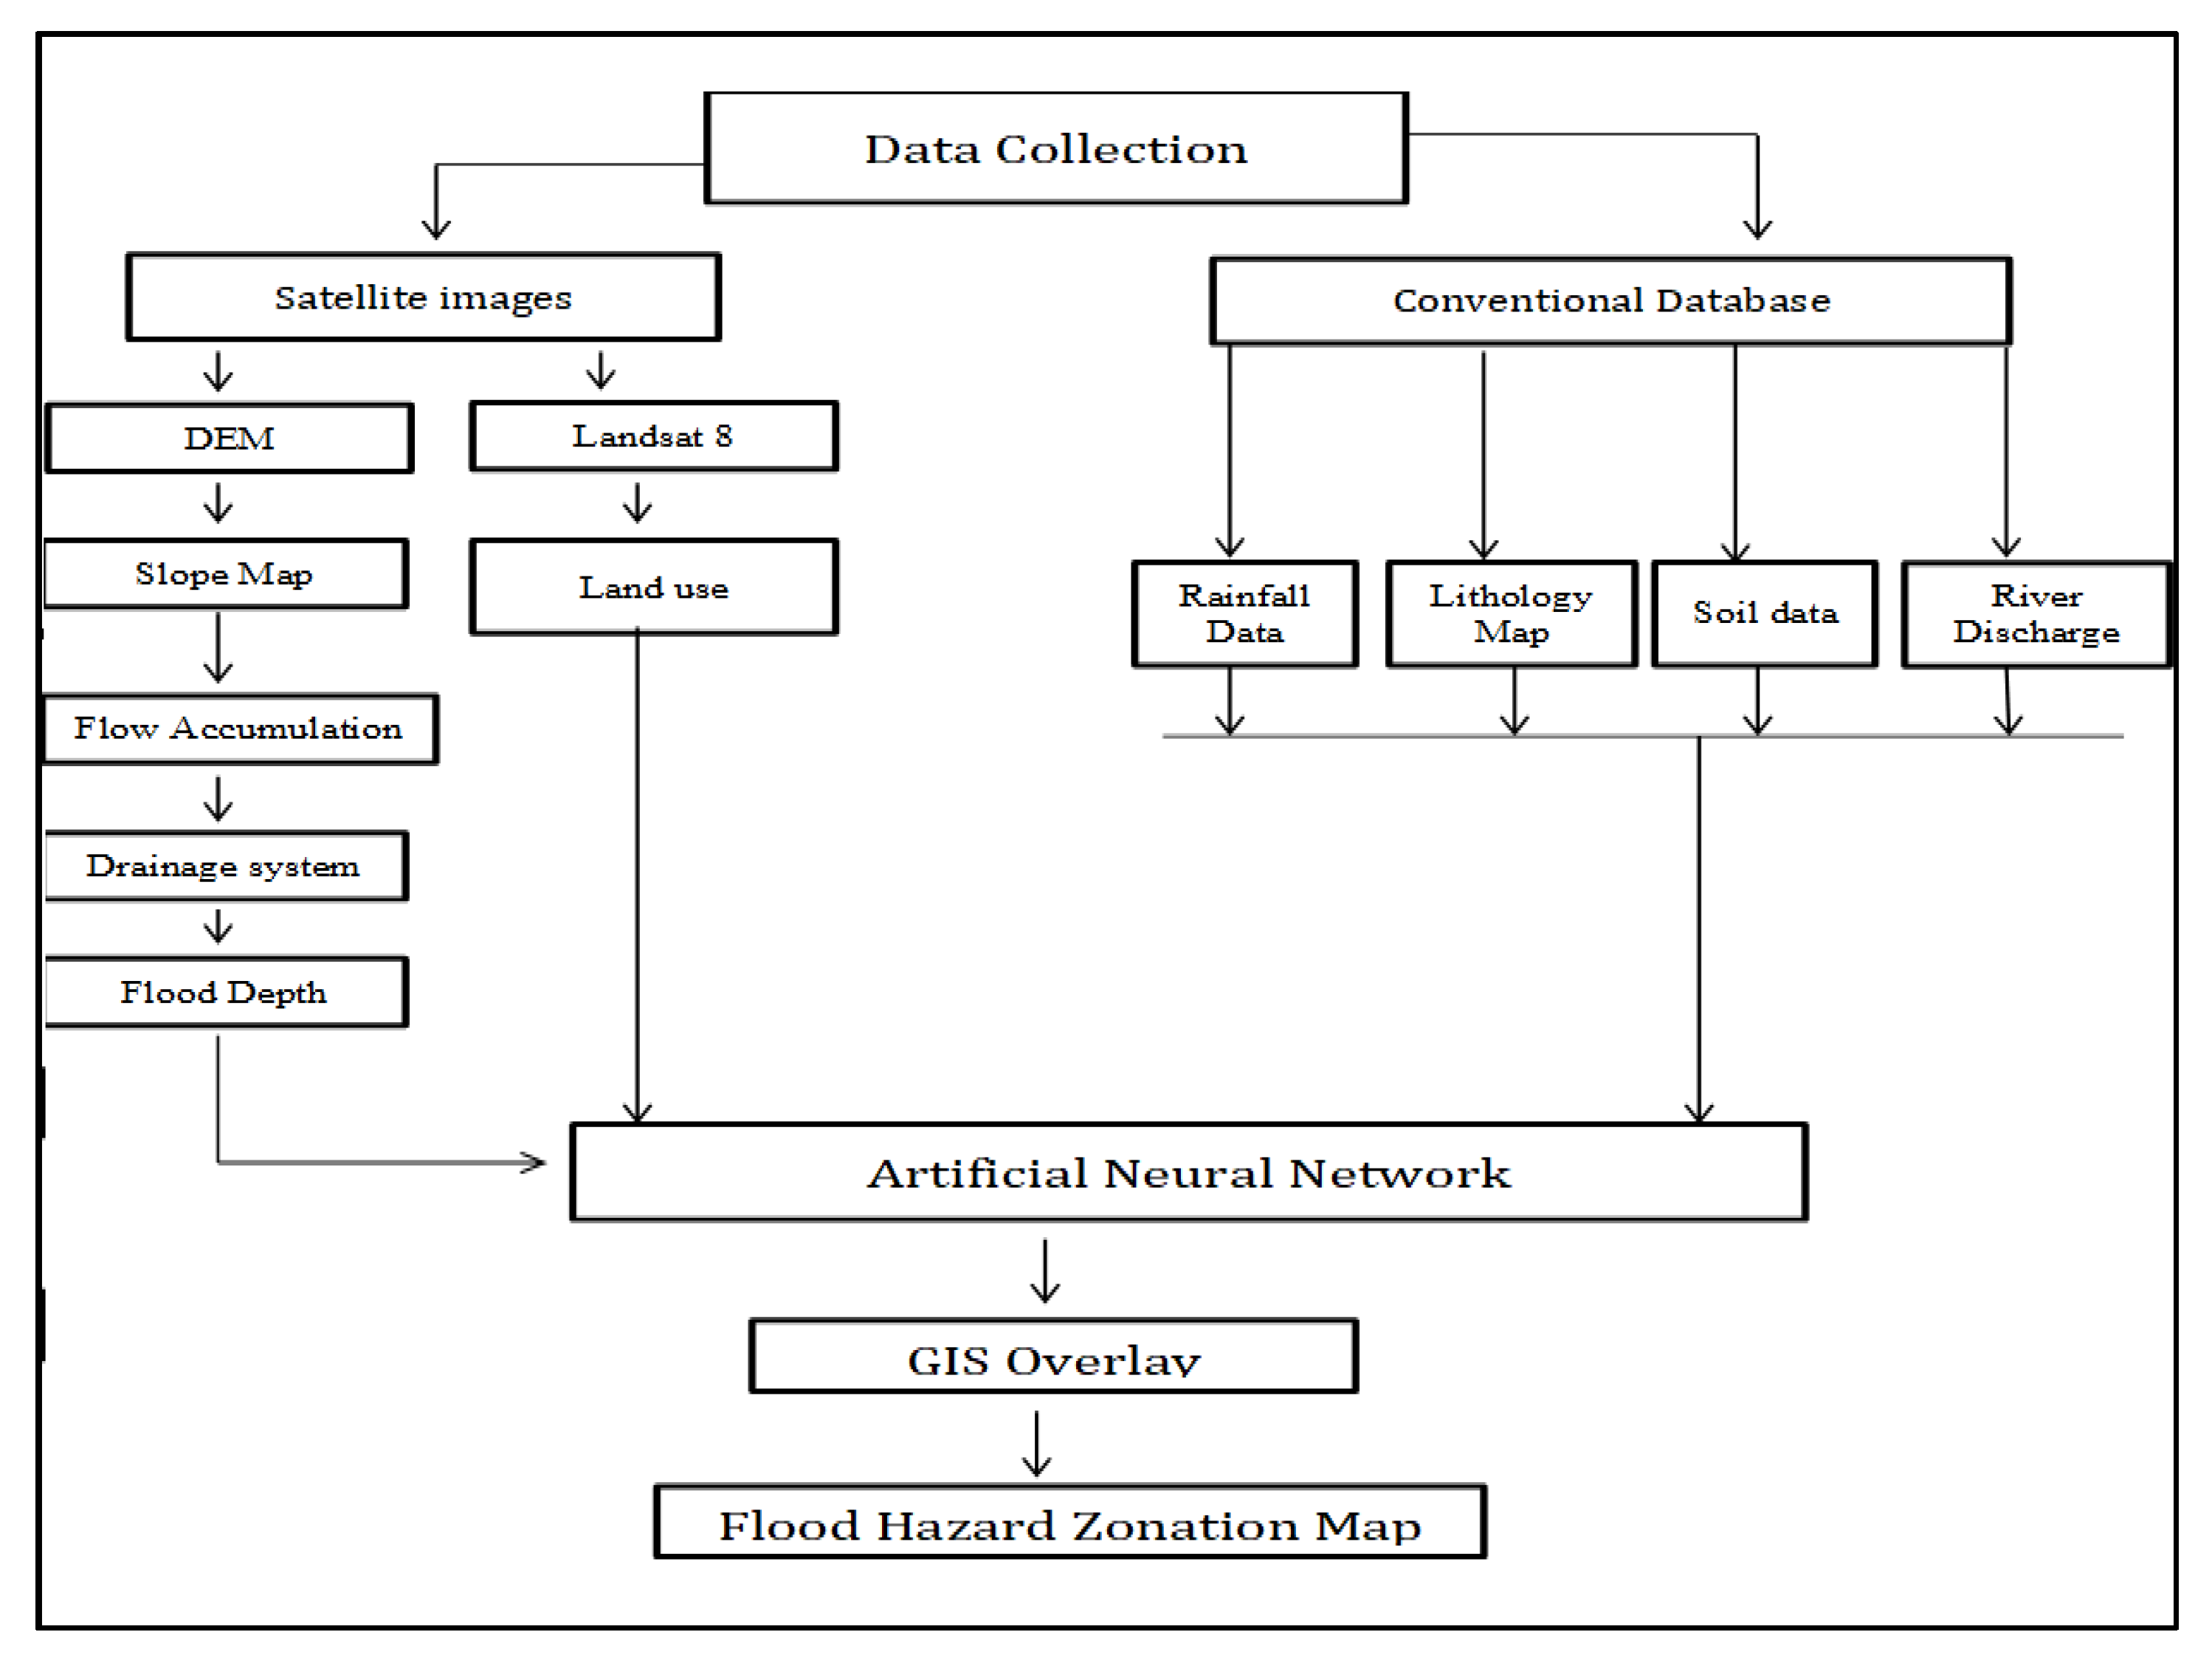
3.1. Data Collection
3.2. Data Analysis
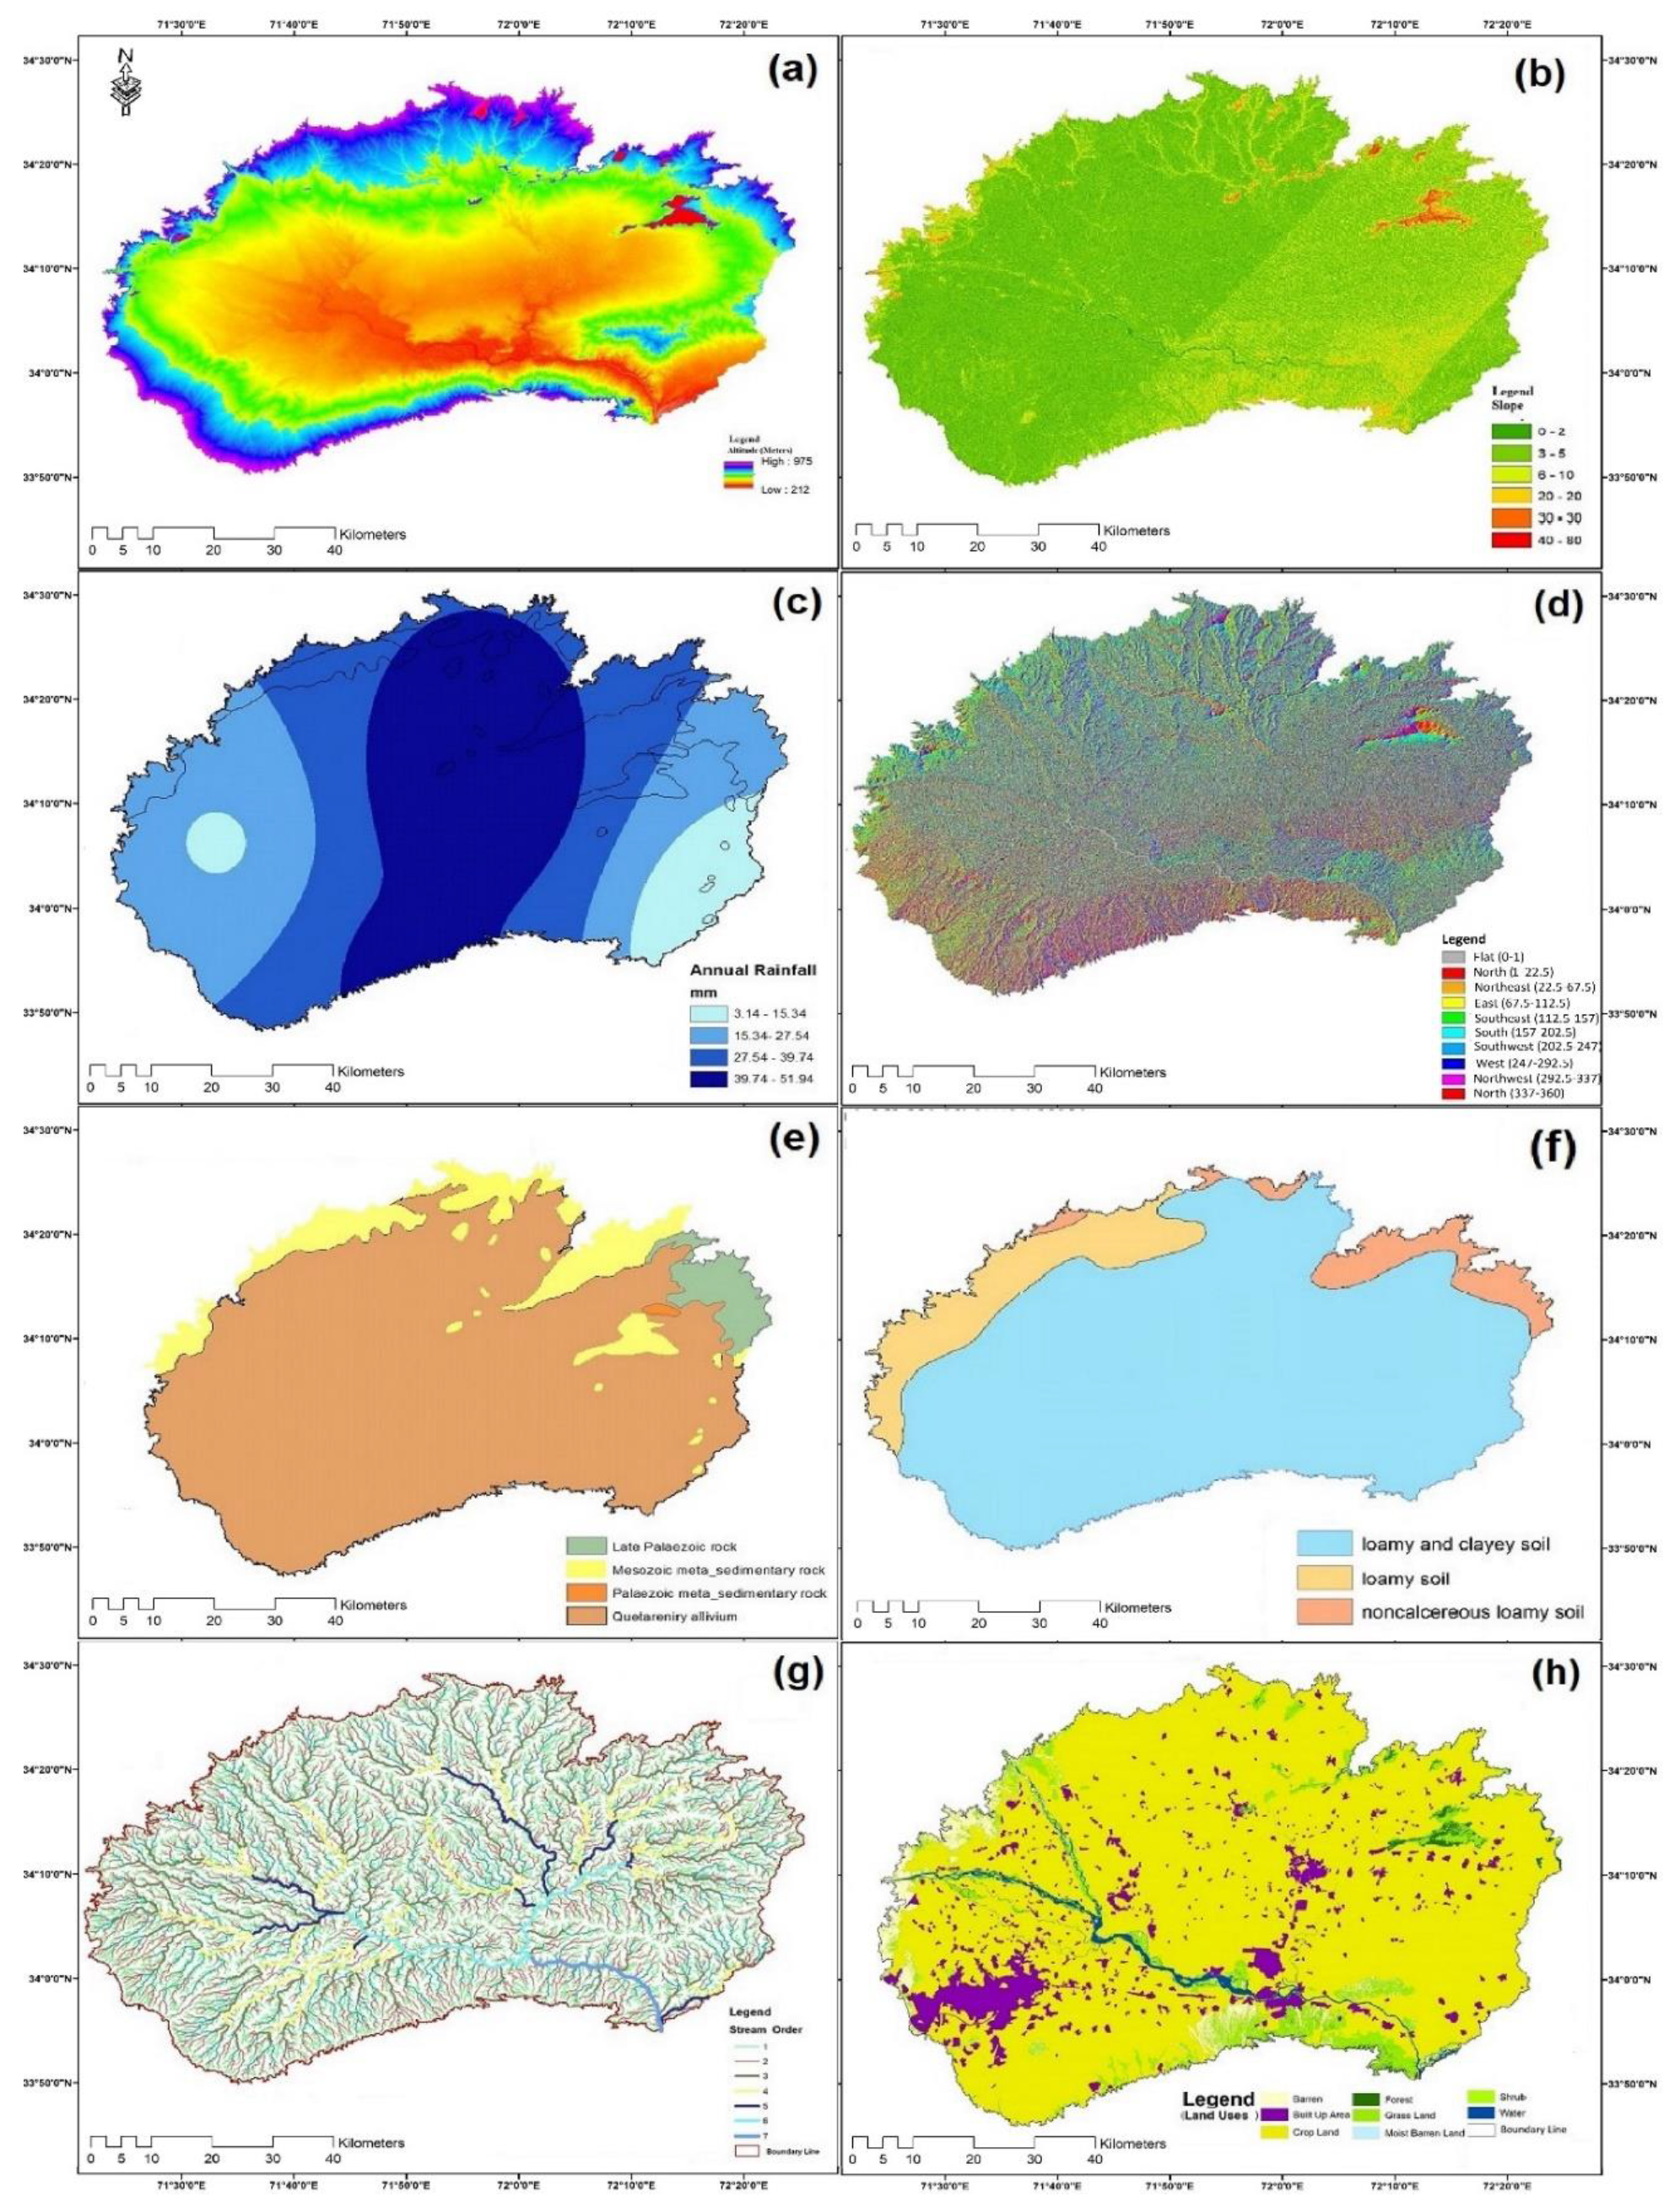
3.3. Digital Elevation Model & Slope
3.4. Rainfall
3.5. River Discharge
3.6. Flow Accumulation
3.7. Lithology
3.8. Soil Texture
3.9. Drainage Pattern
3.10. Flood Depth
3.11. Land Use
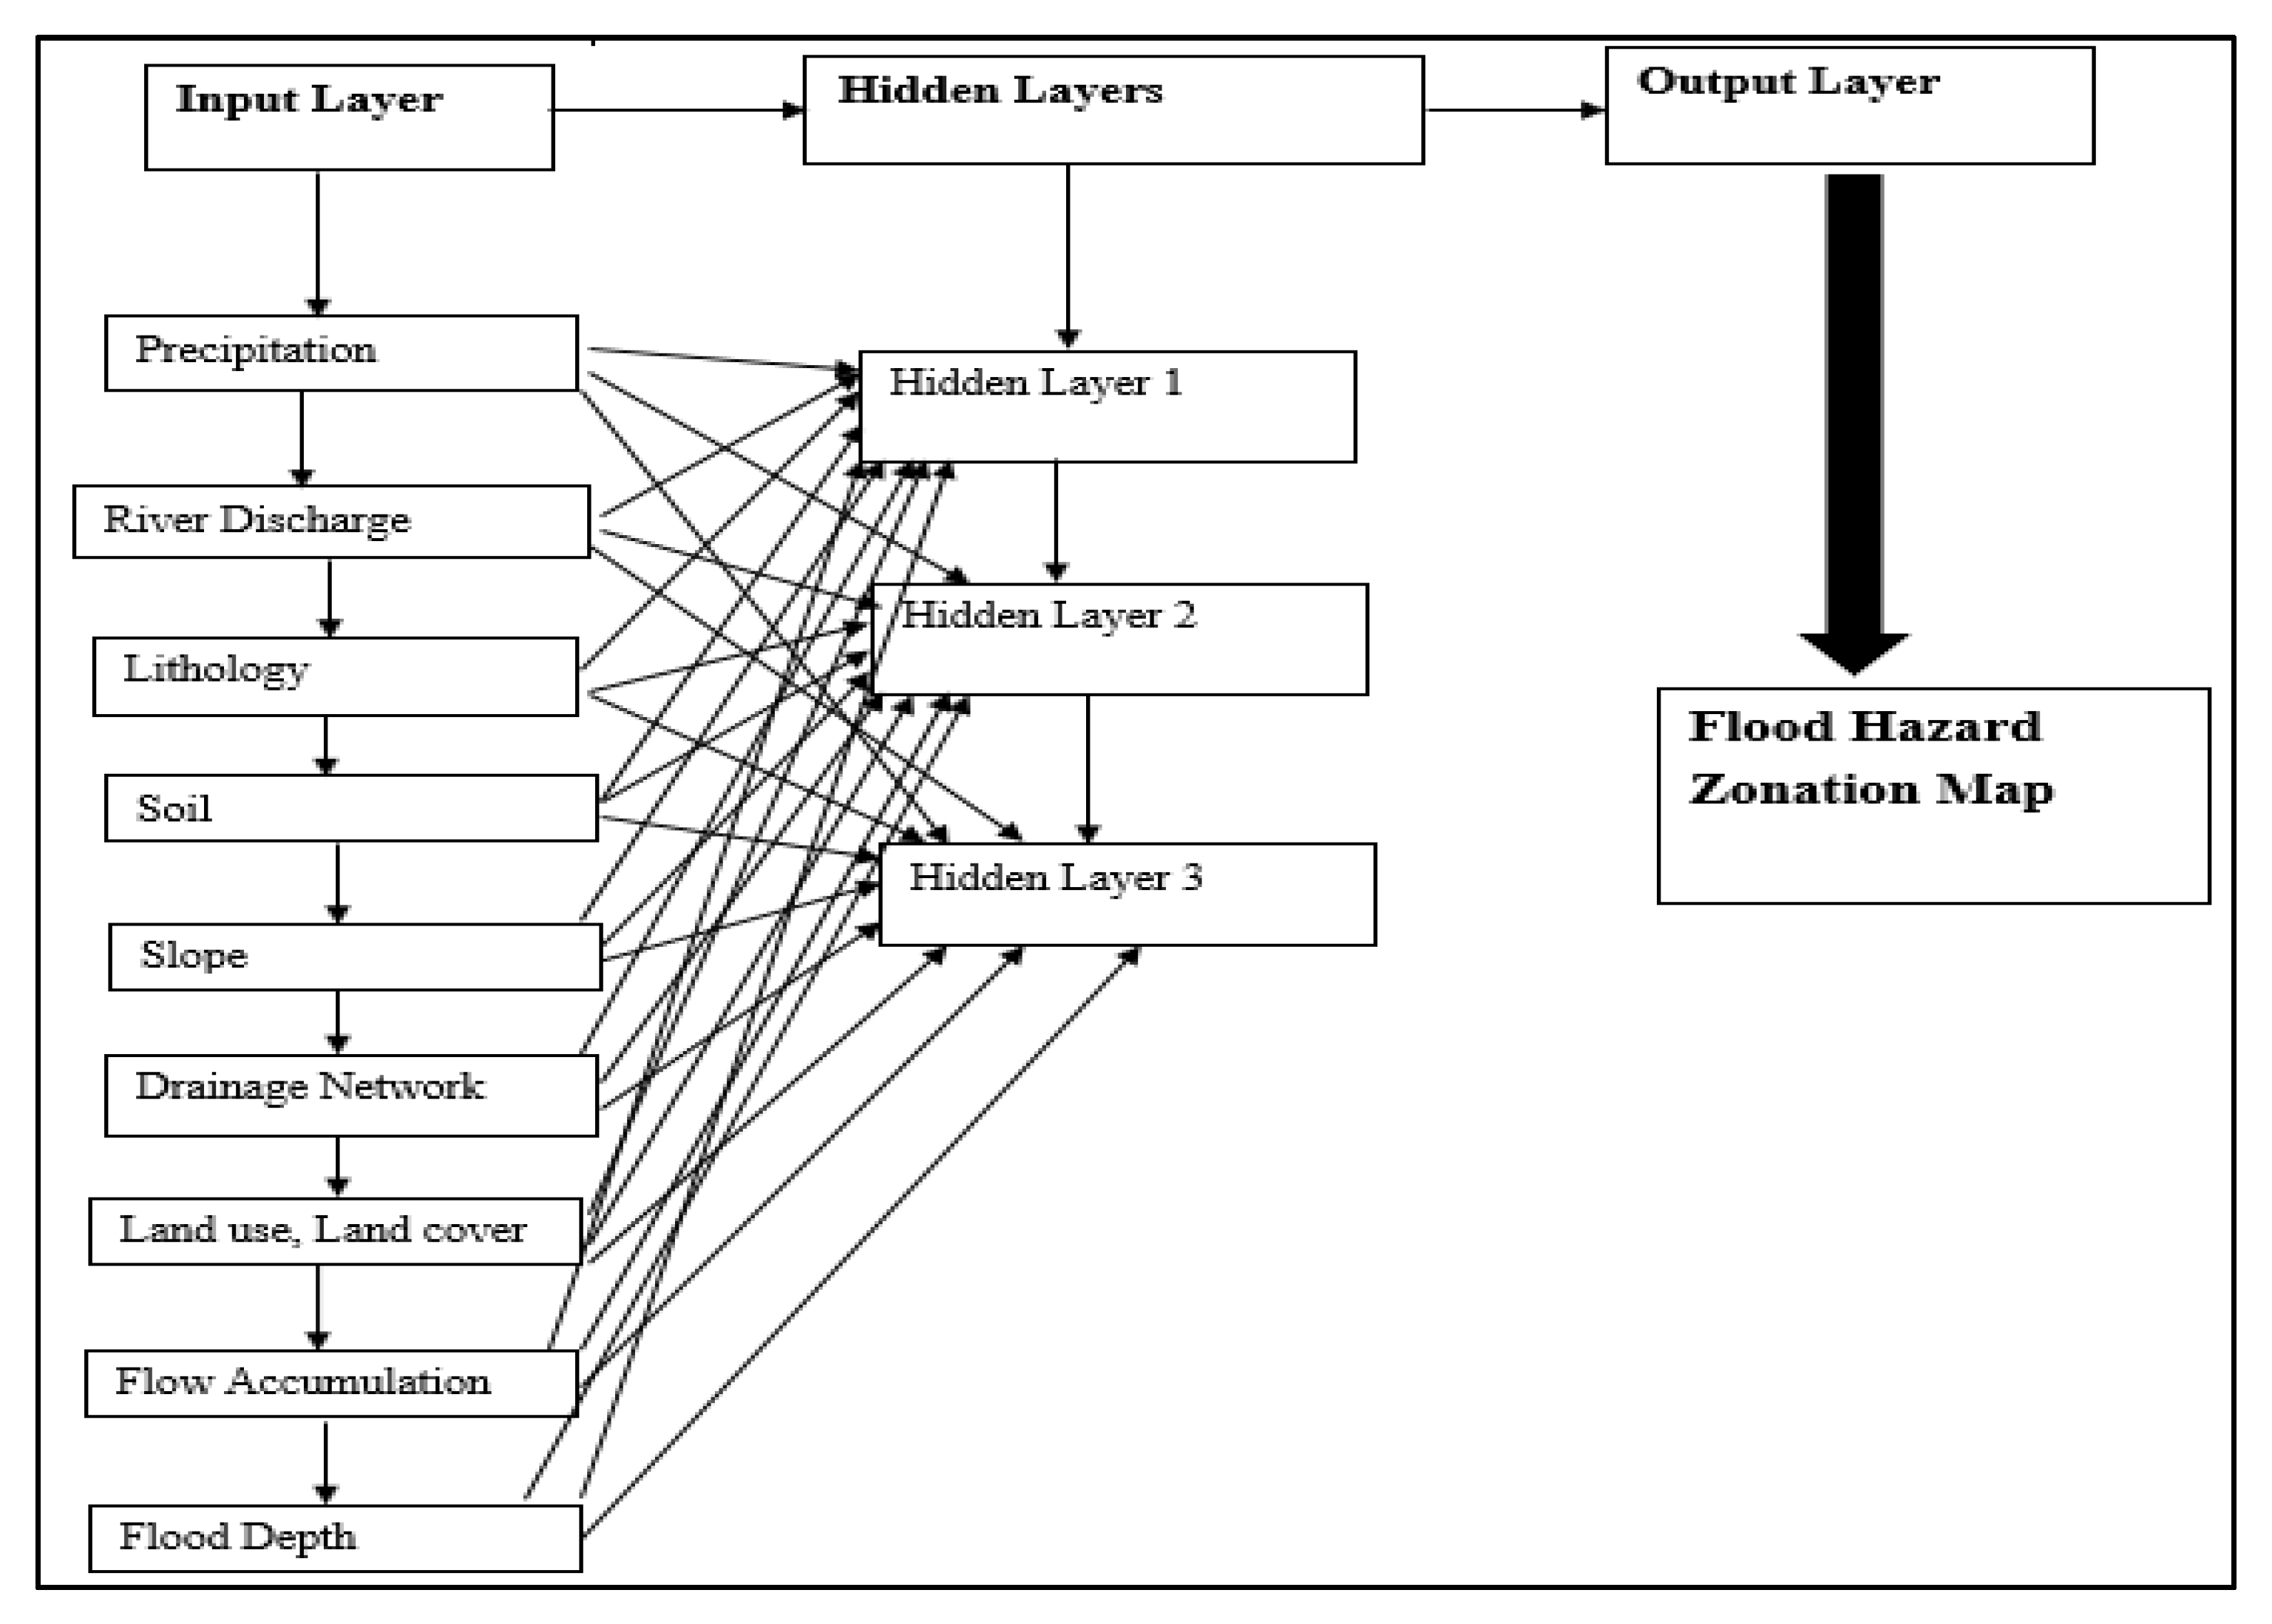
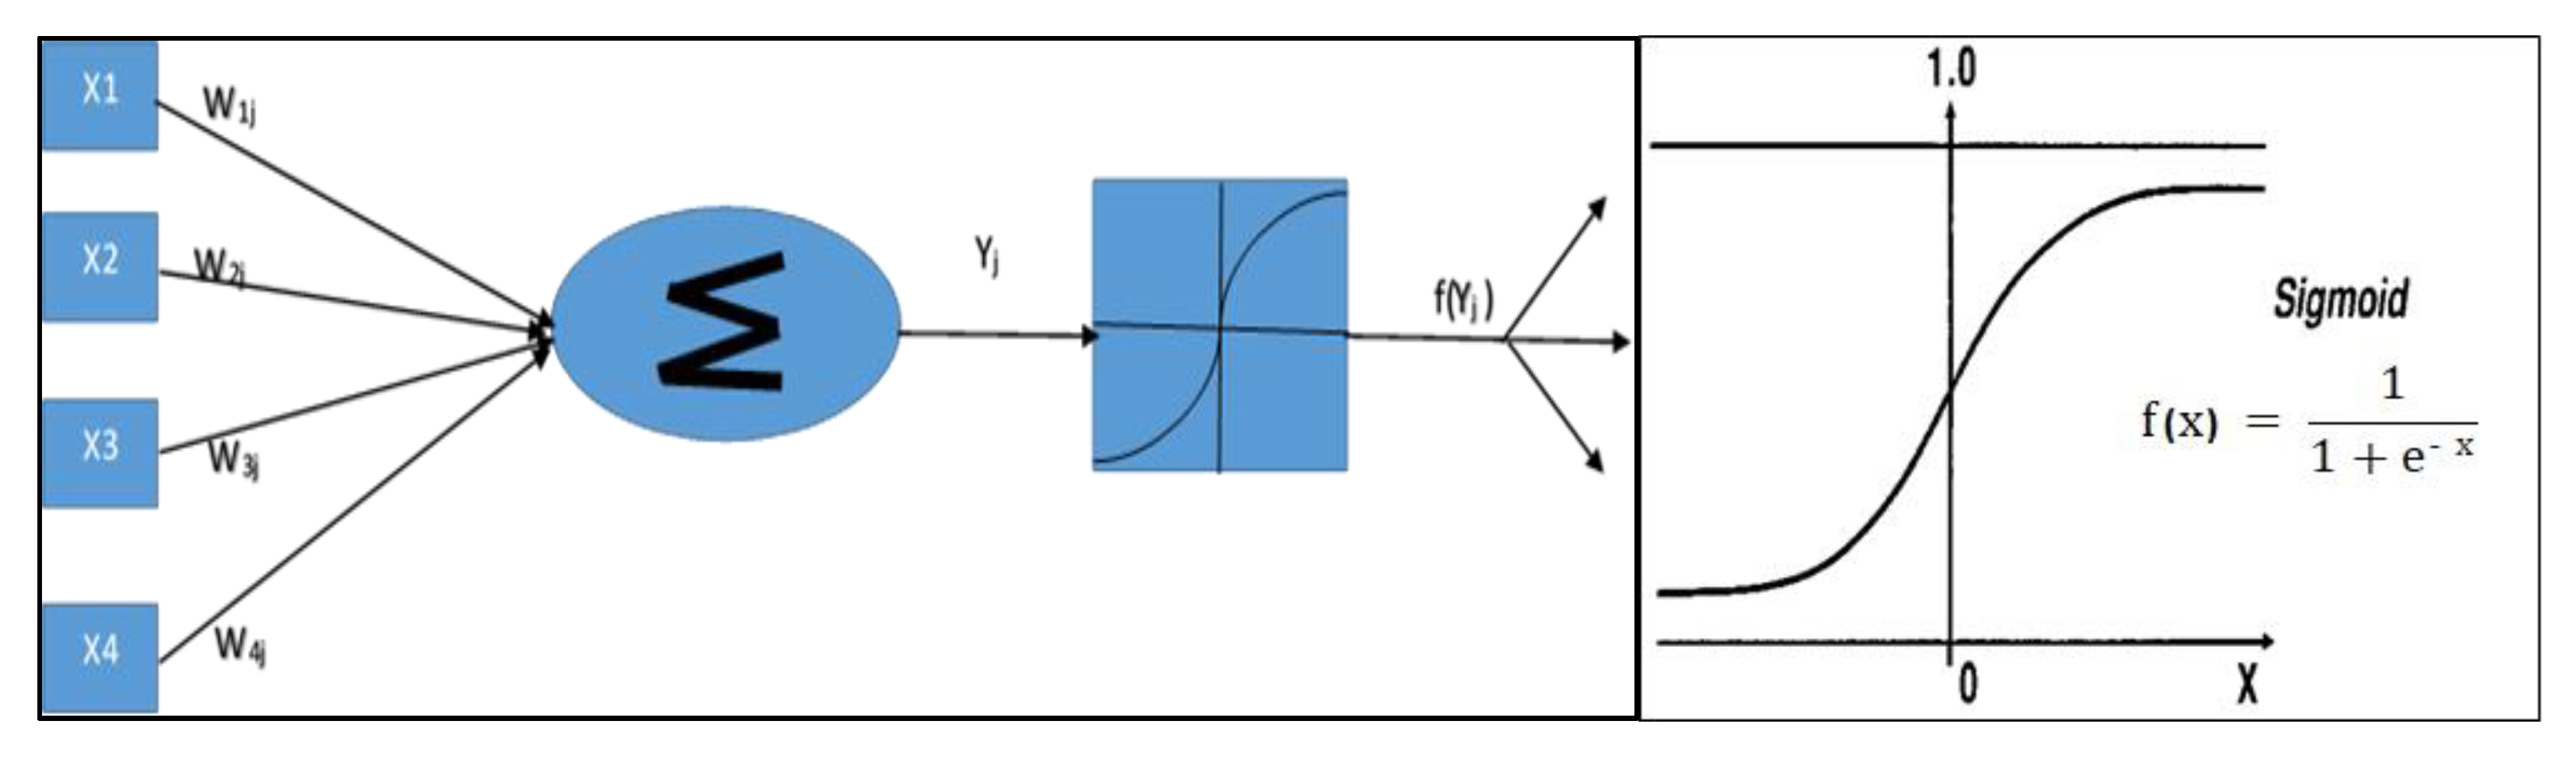
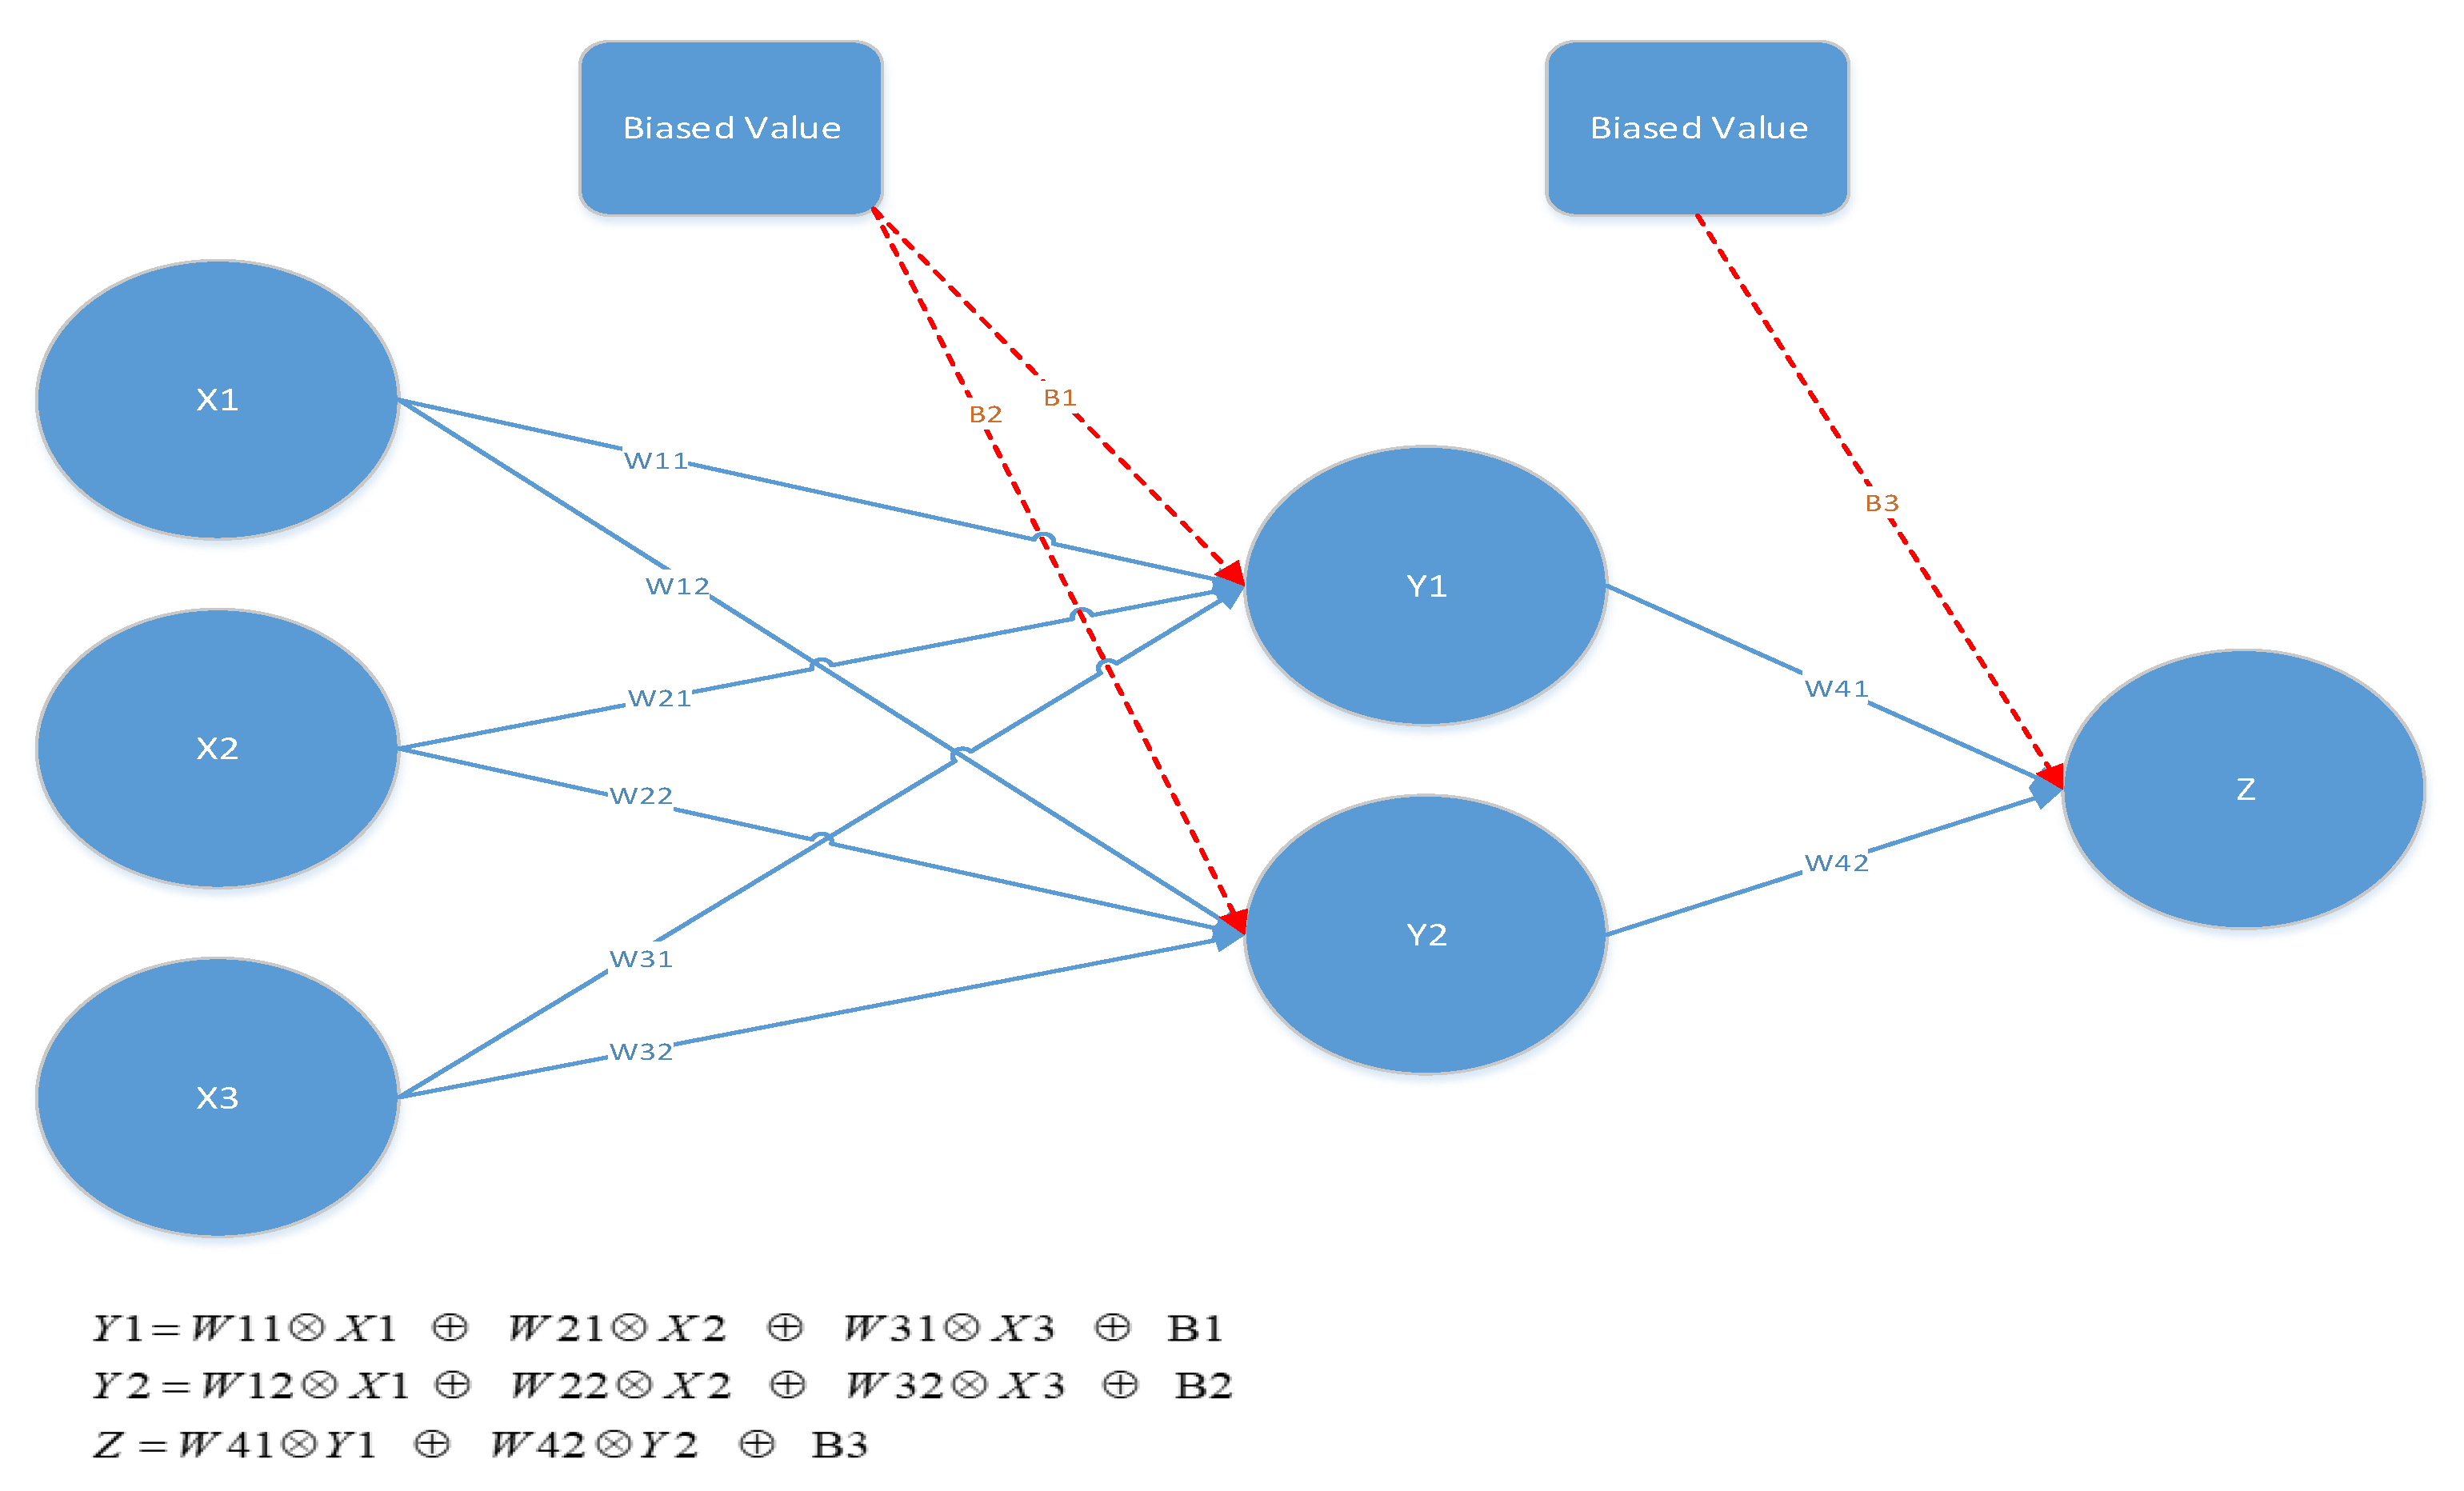
4. Artificial Neural Network Model for Flood Hazard Zonation
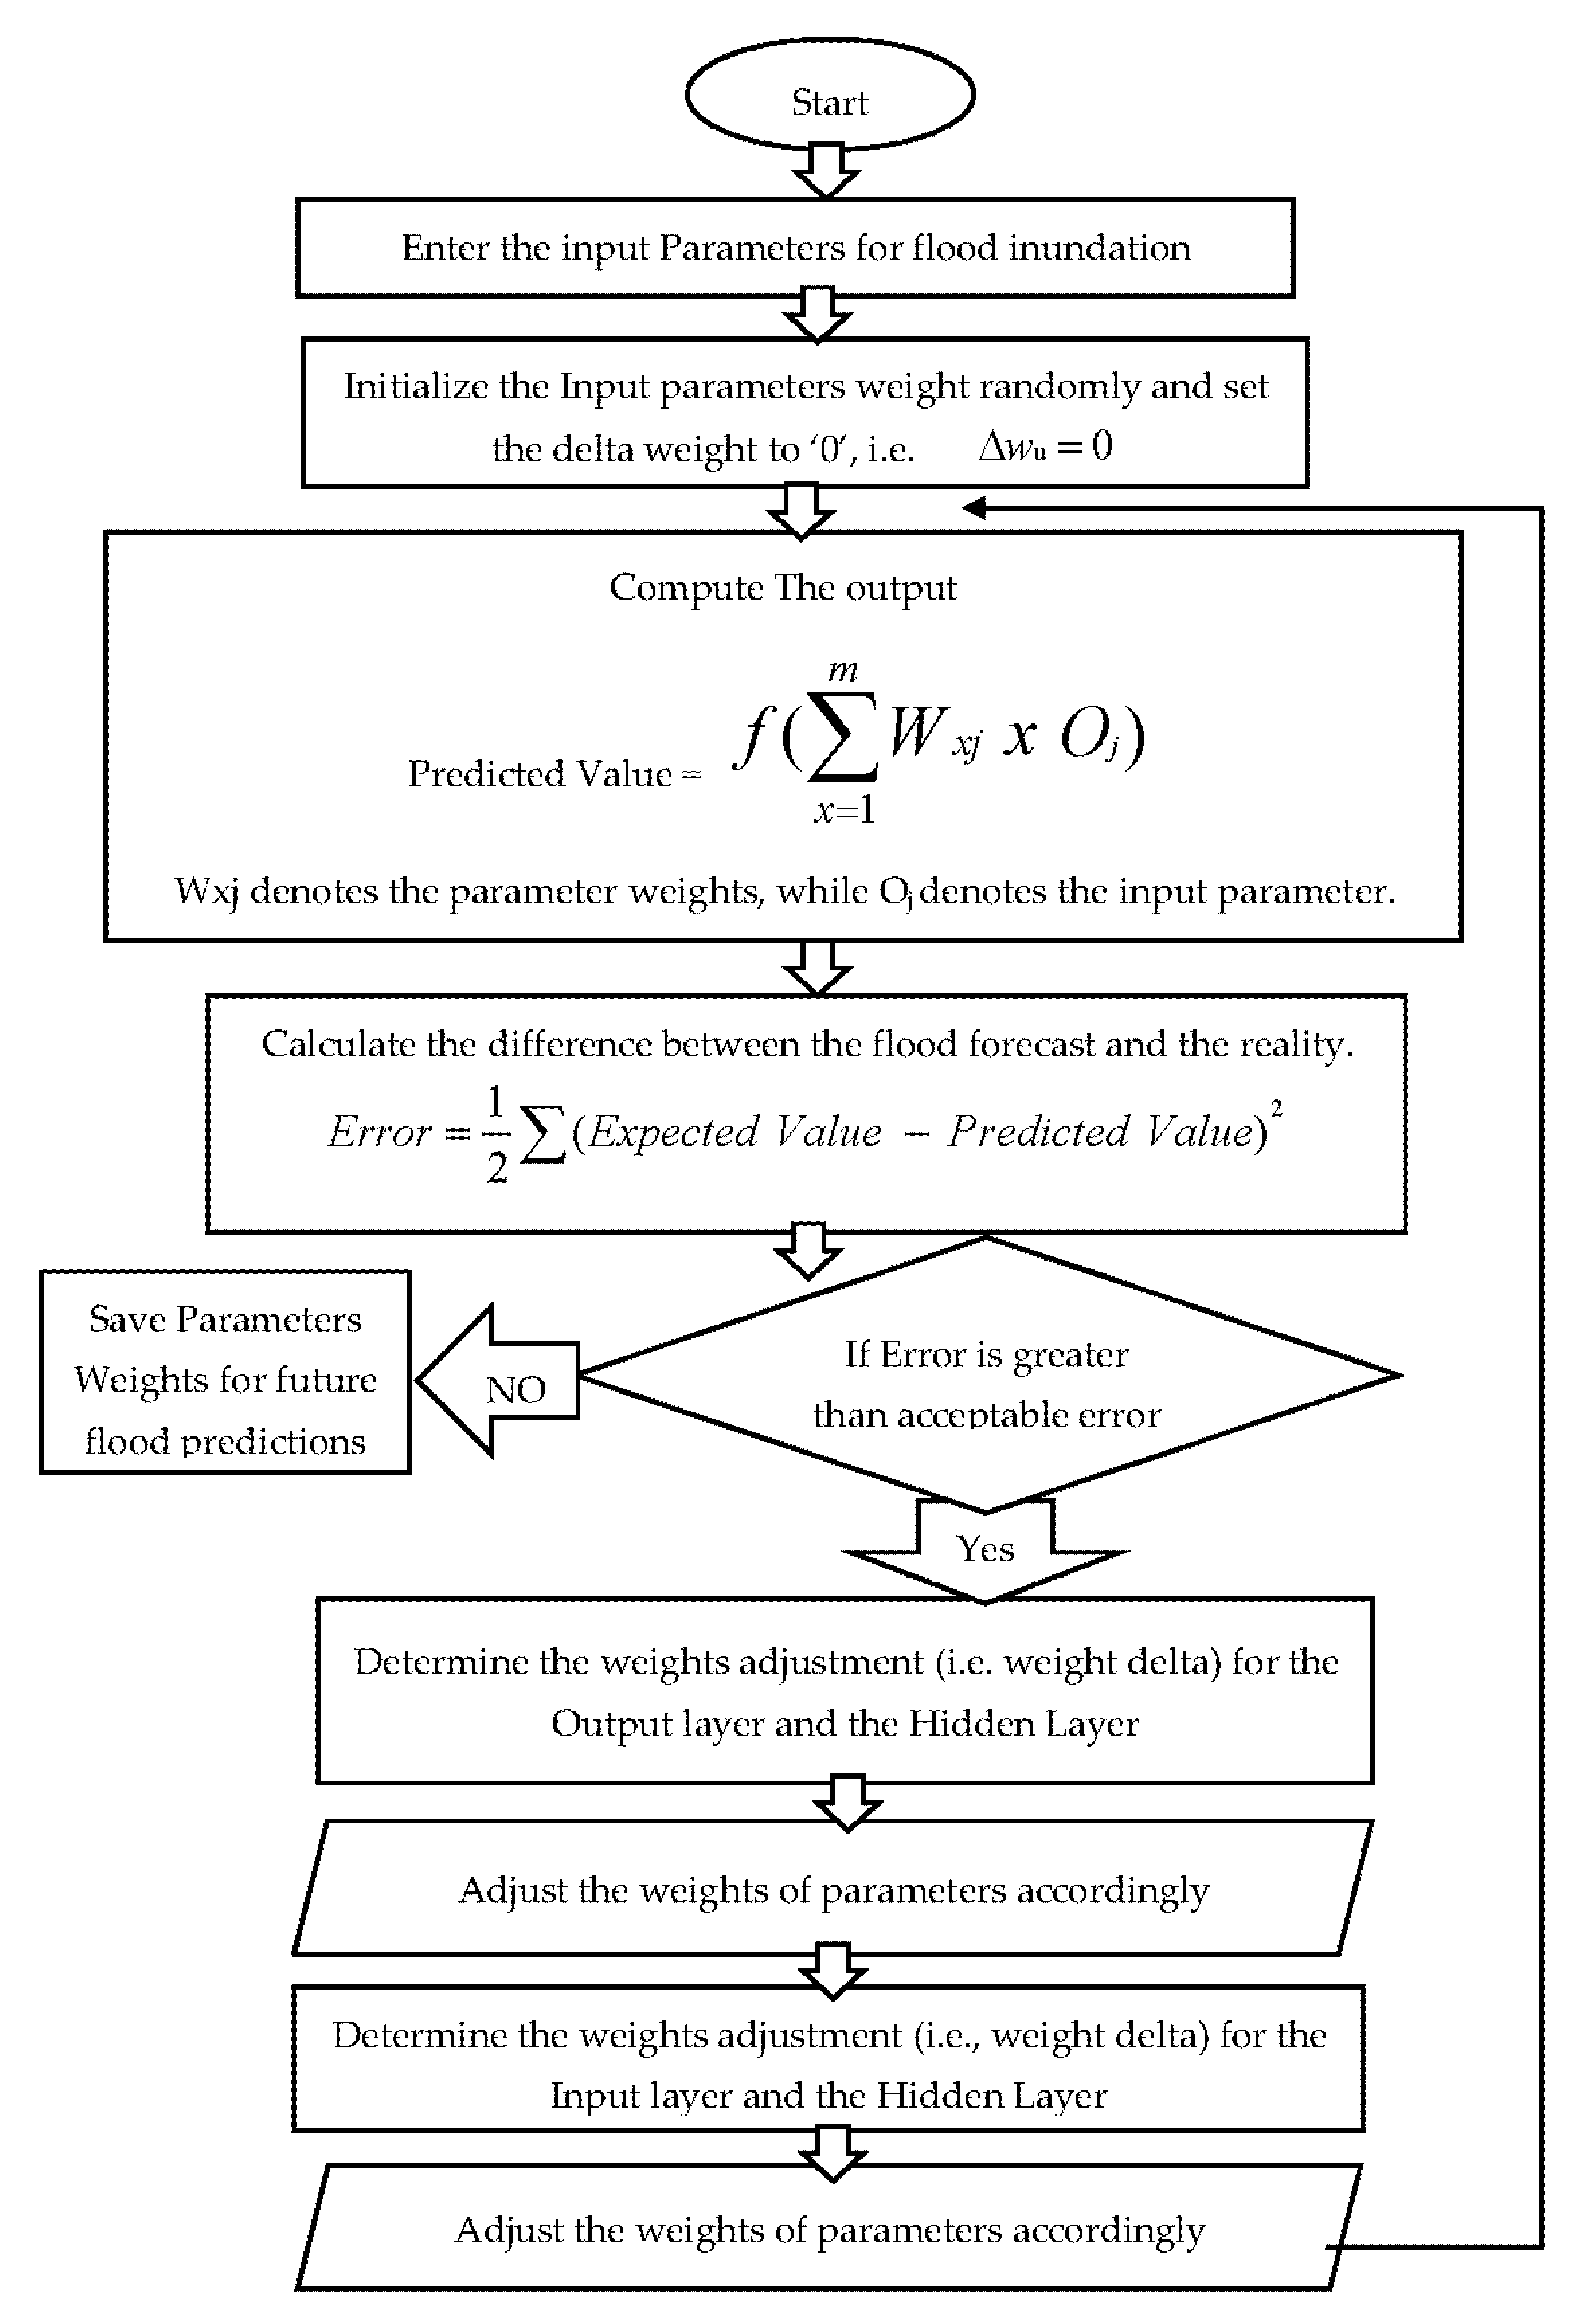
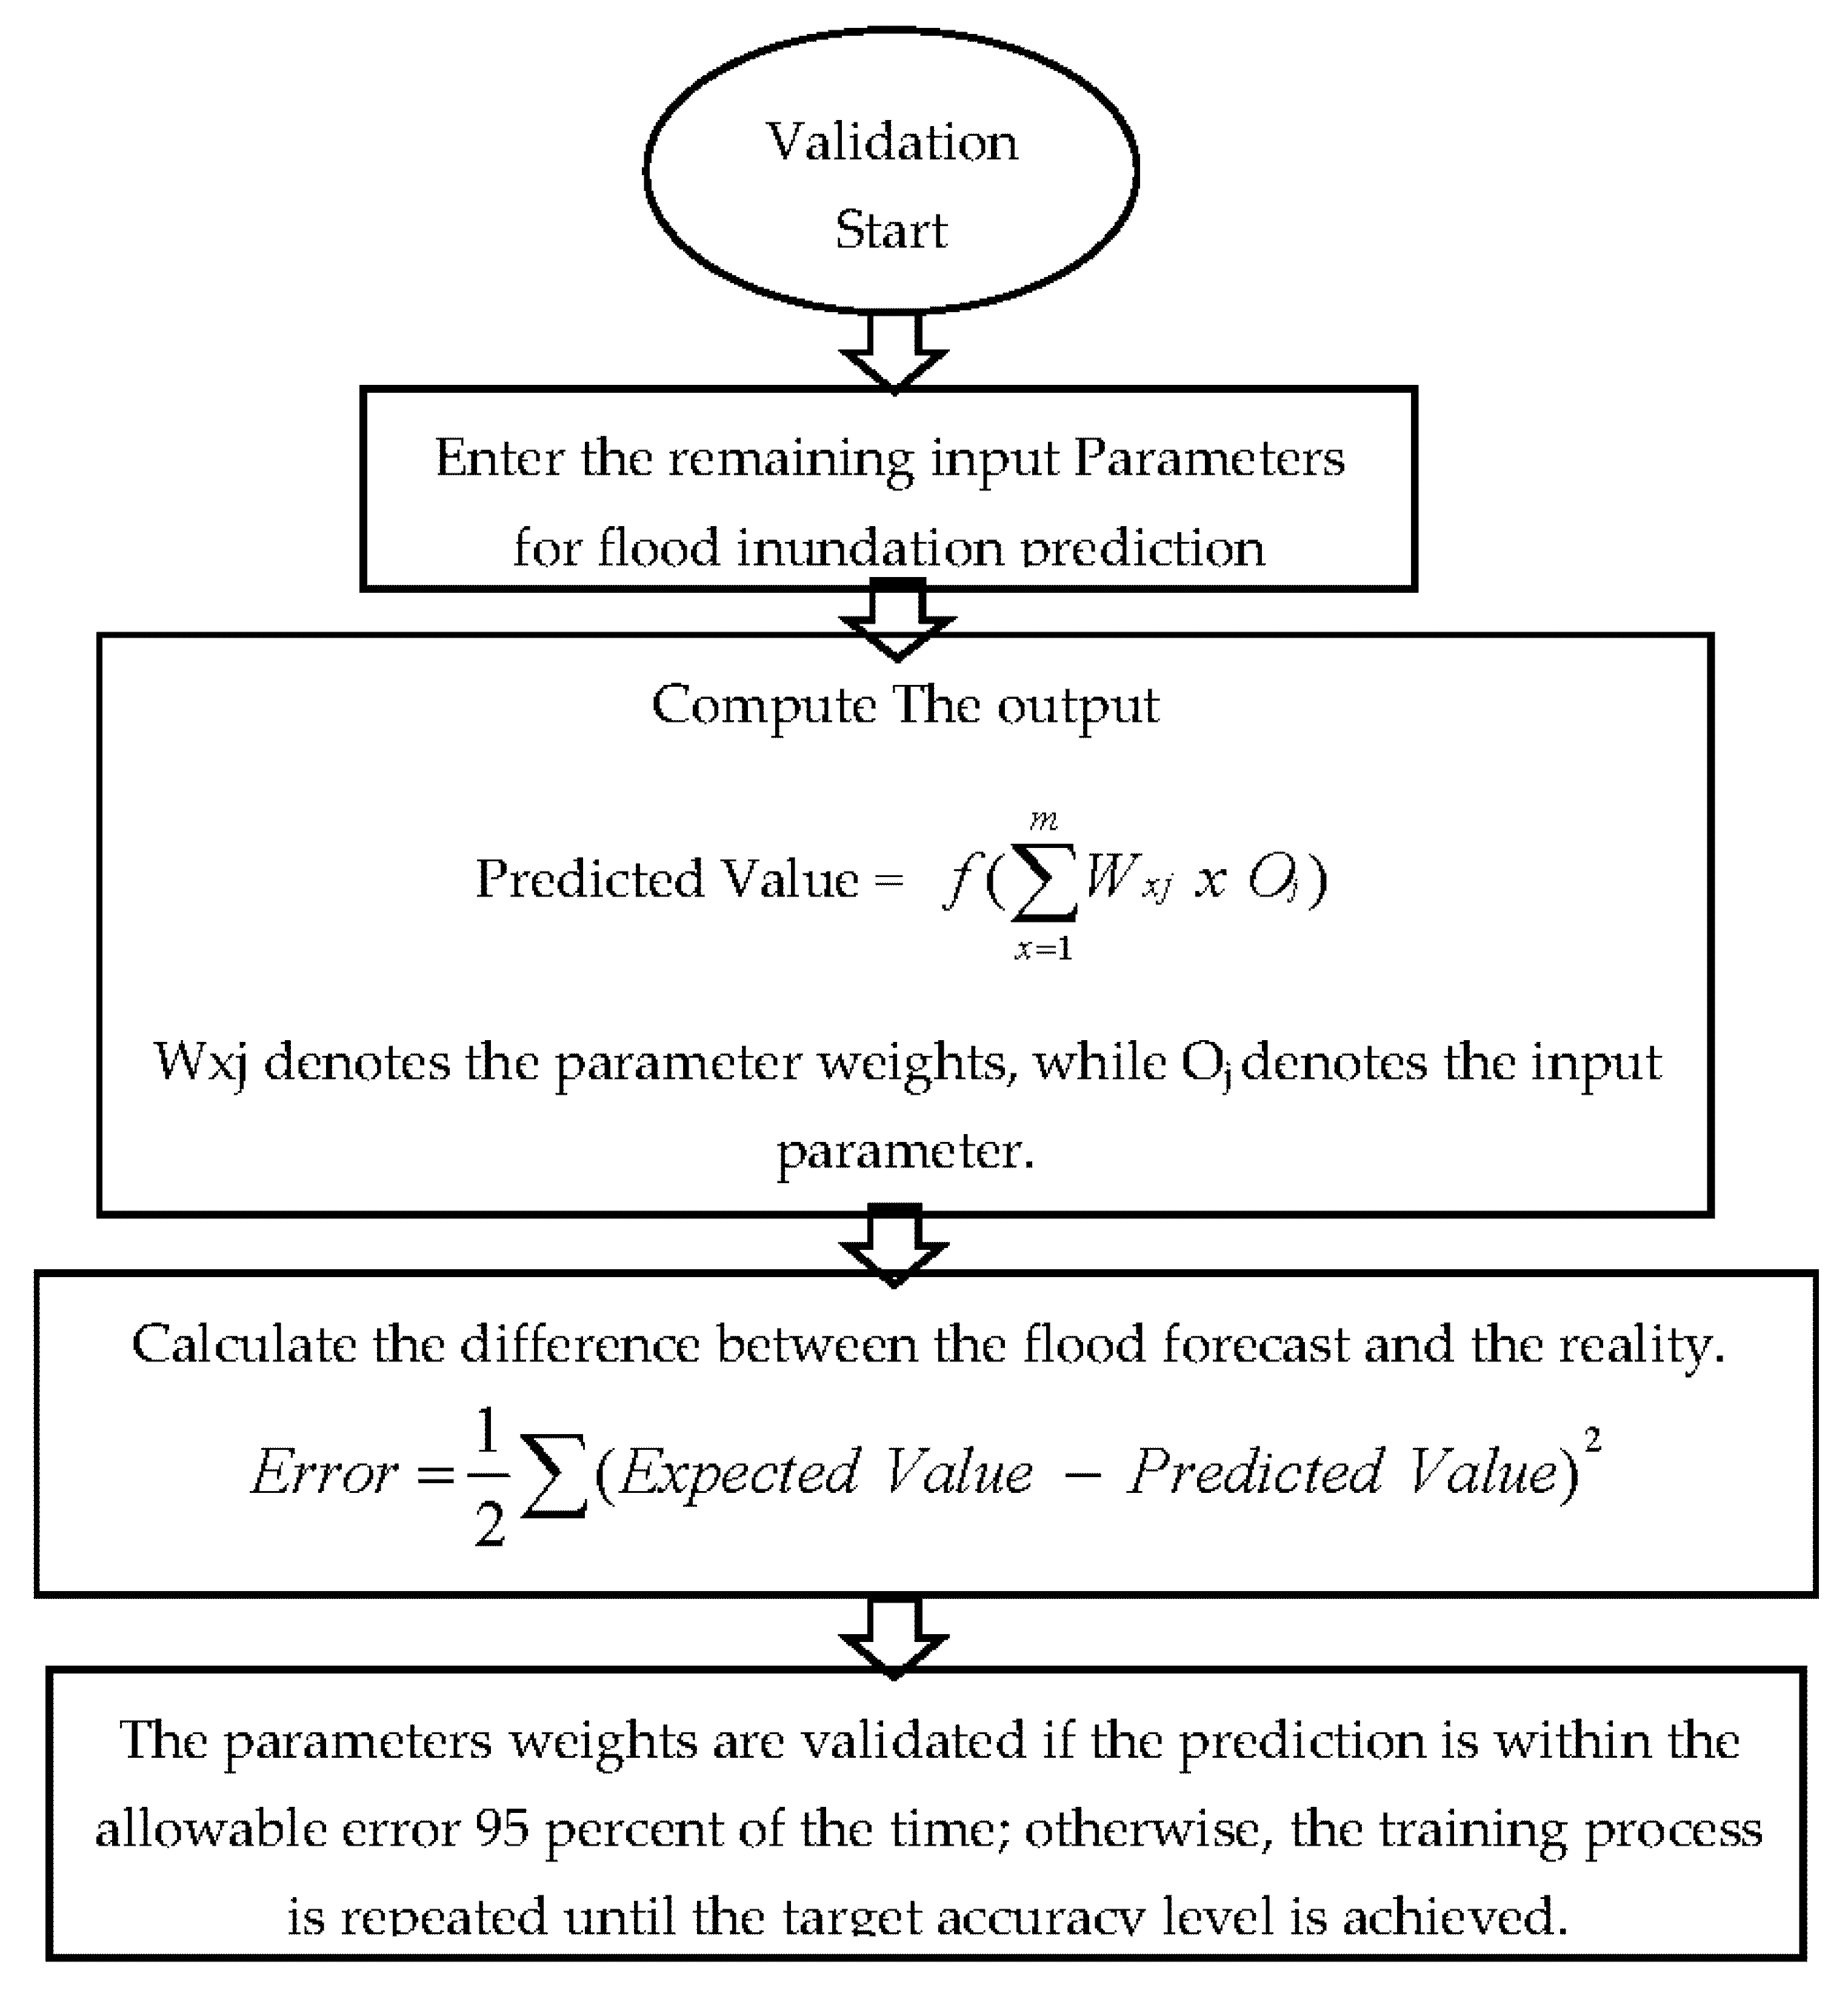
4.1. ANN Training, Testing and Results
- Training;
- Validation.
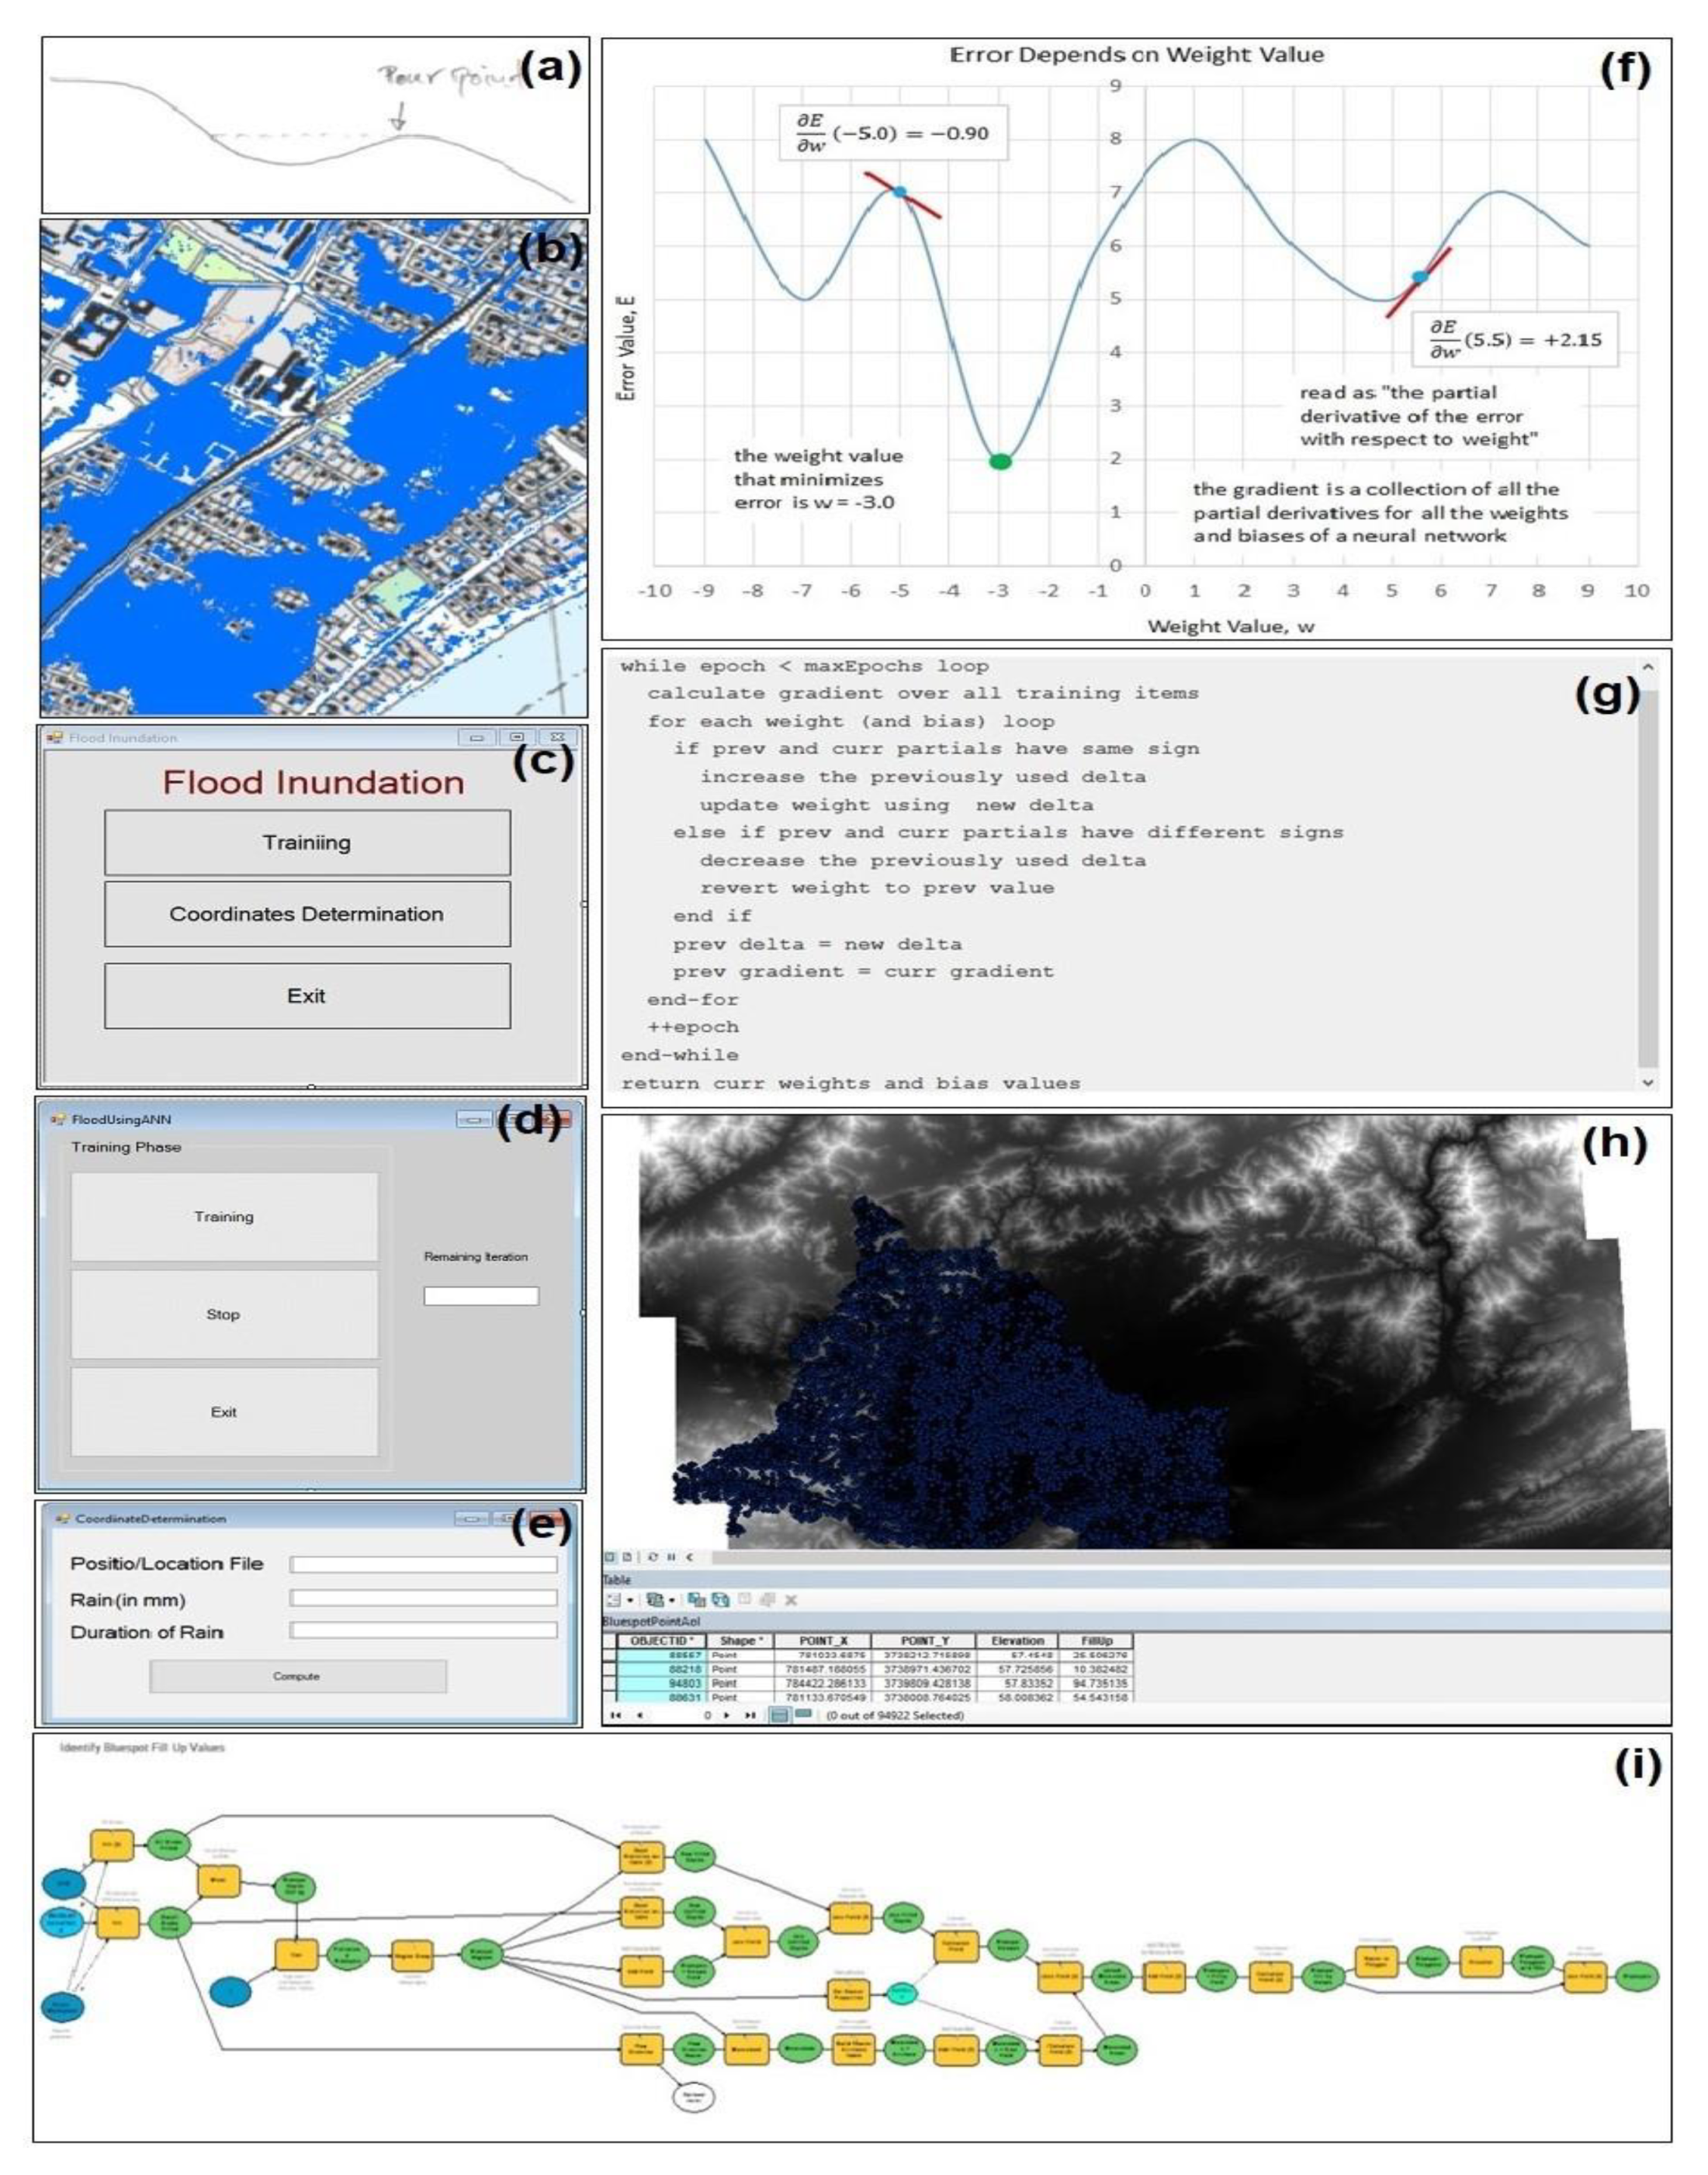
4.2. Understanding Gradients and the Rprop Algorithm
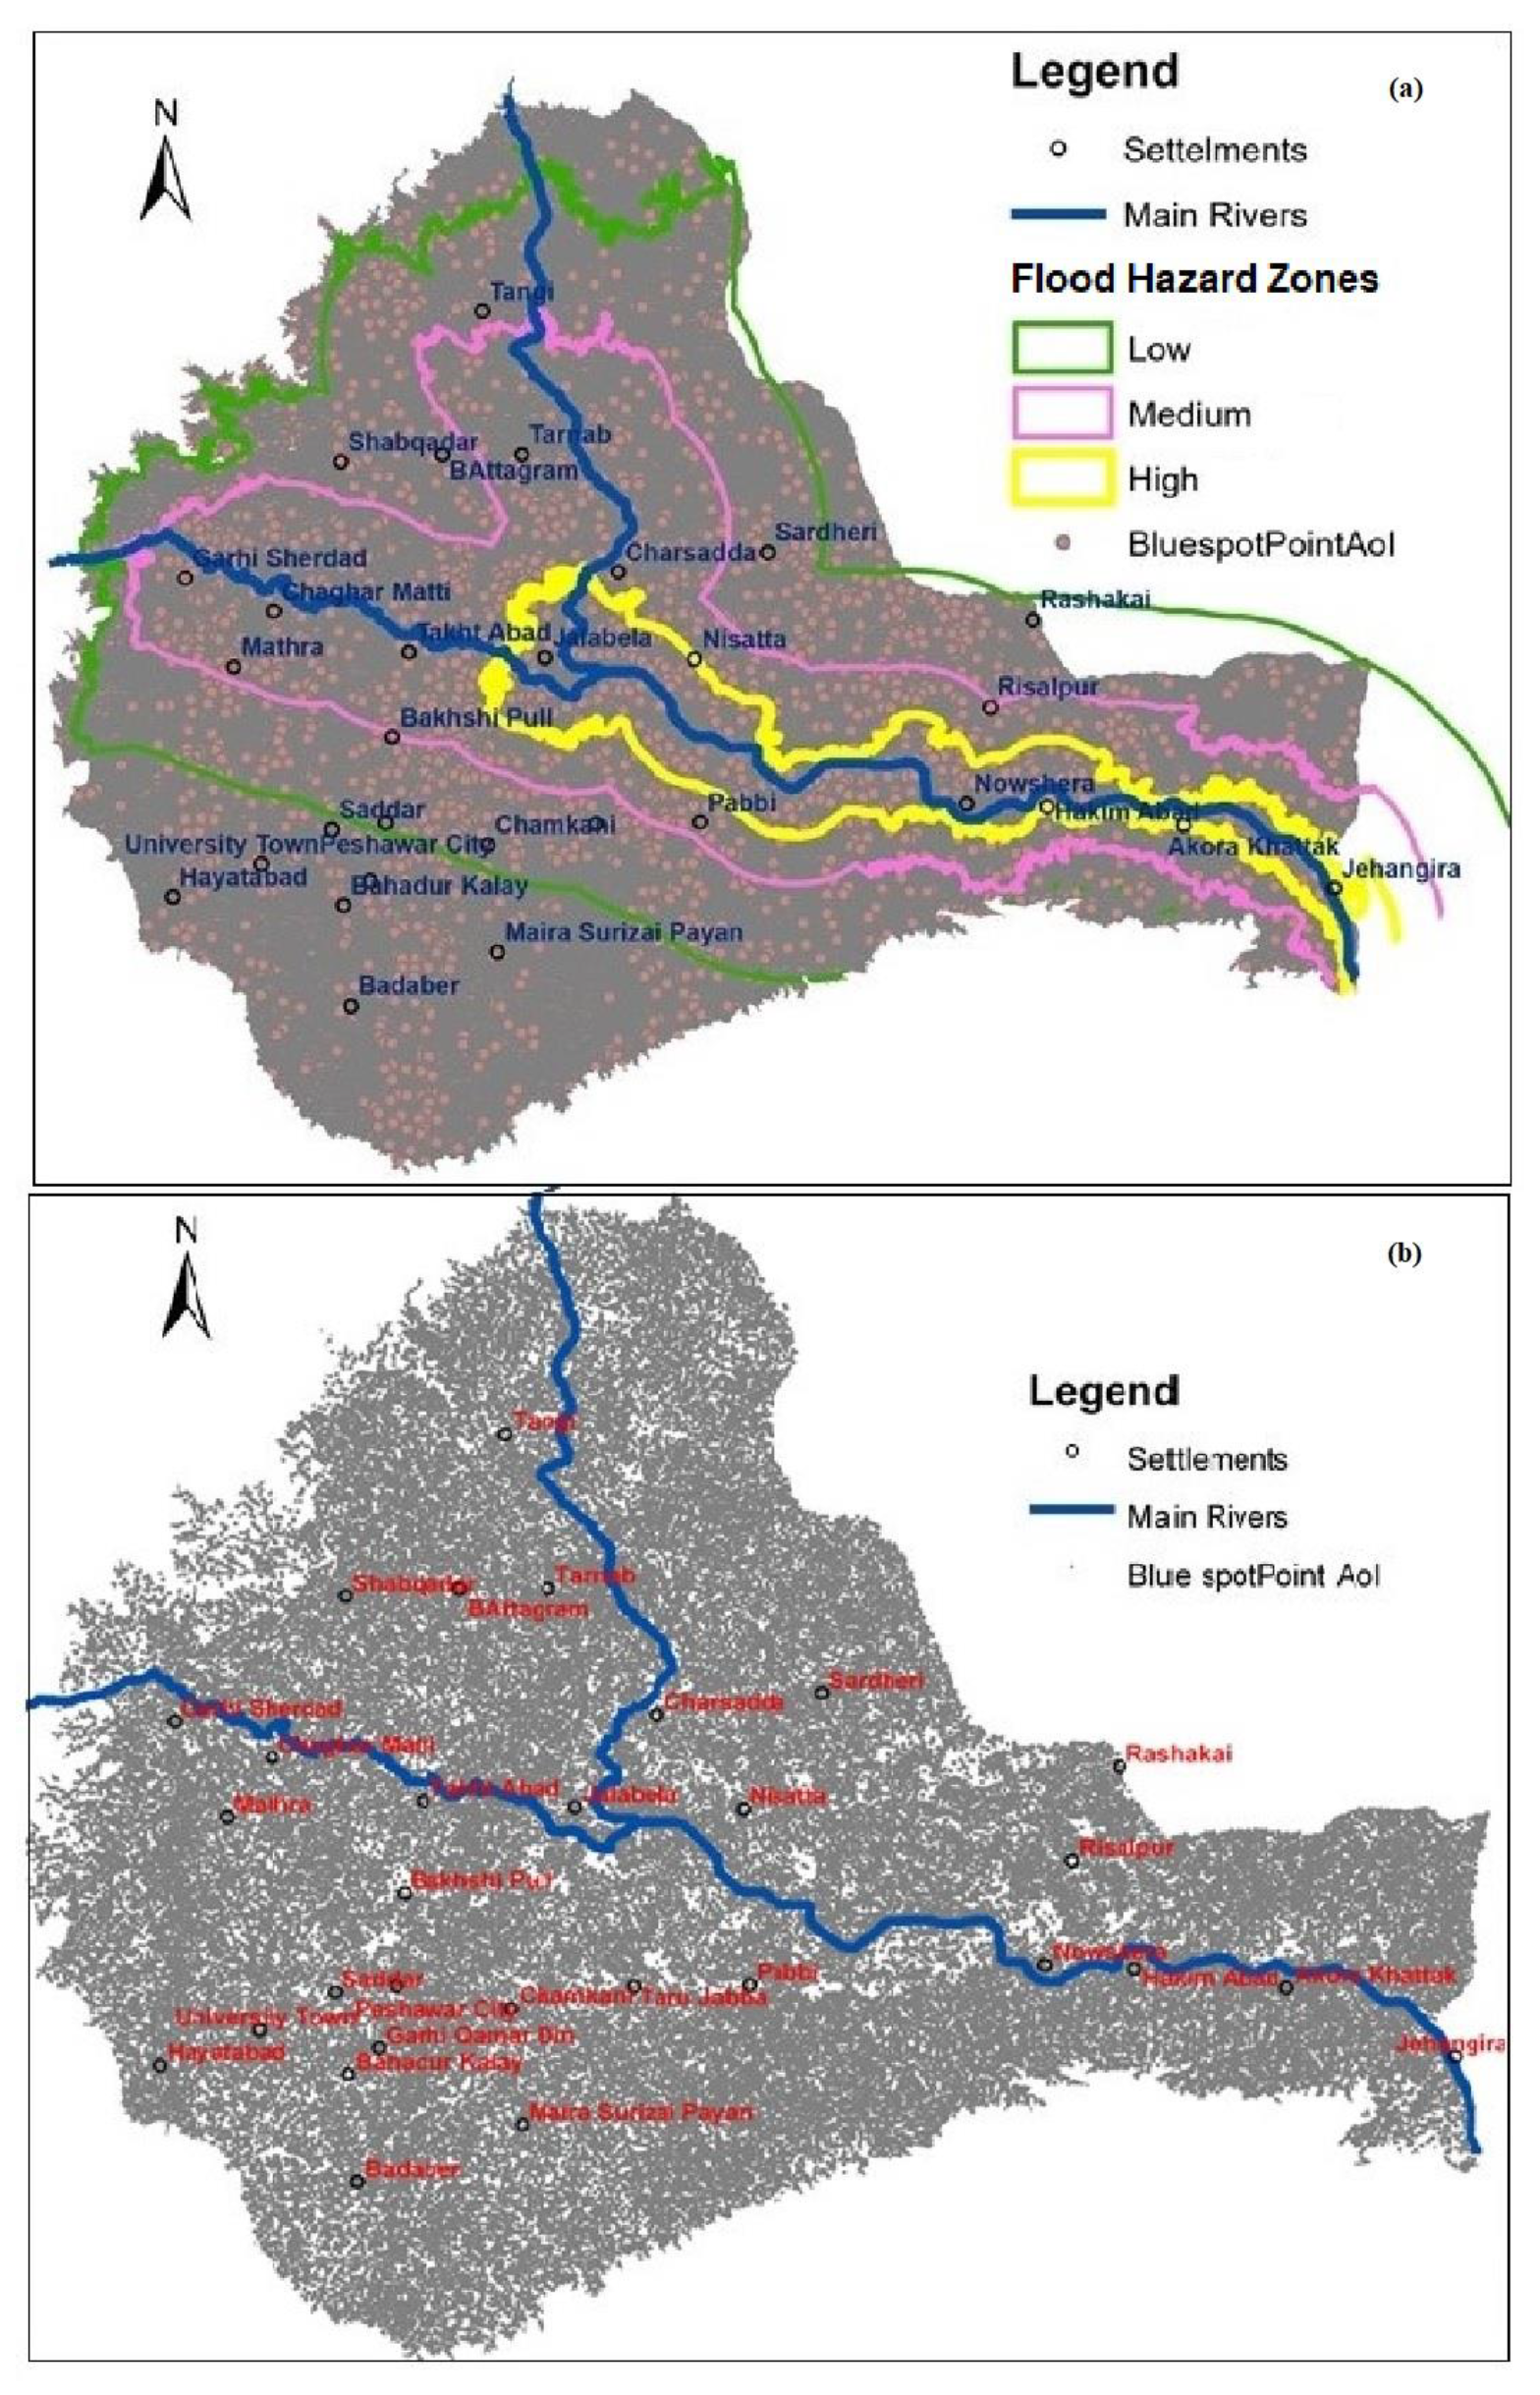
- Blue Spot Analysis were performed by using ArcGIS model; (Figure 10a,b)
- For dynamic determination of flood situation based on
- Rainfall, river discharge, etc., a program developed based on RPROP of ANN.
- Surface Development Using the developed program, a scenario of flood 2010 was generated showing the inundated area.
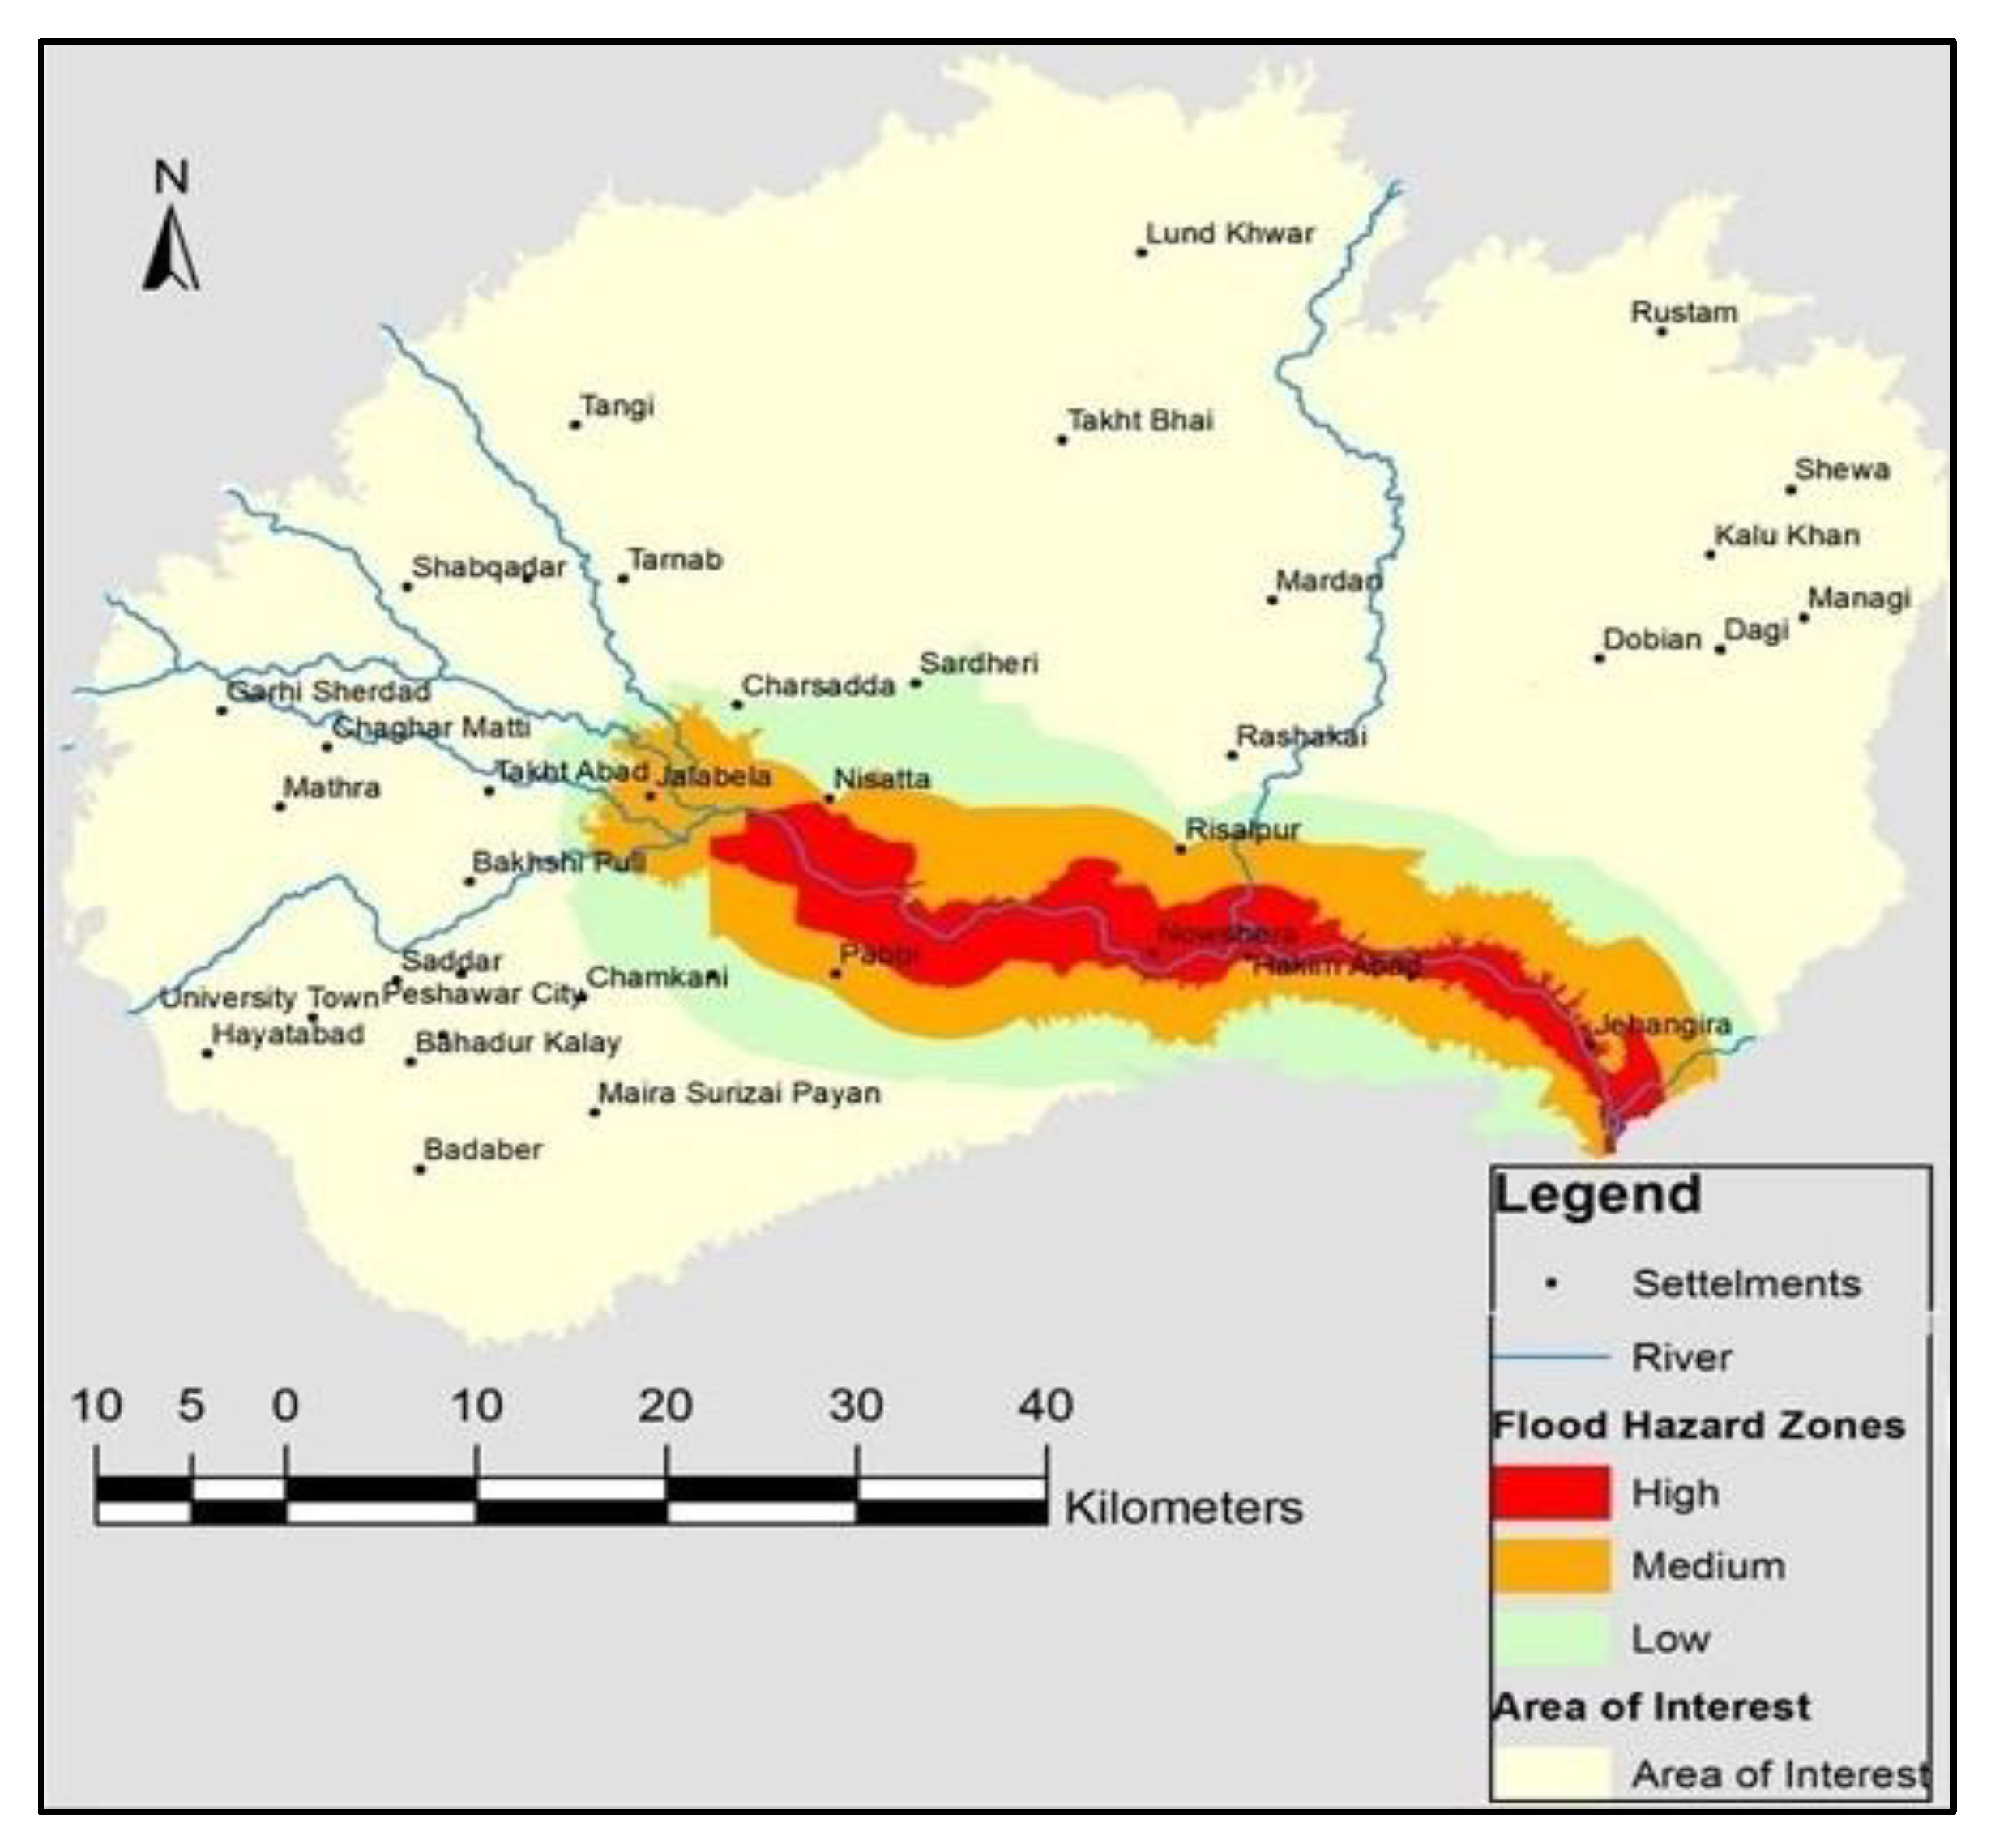
4.3. Flood Hazard Zones Generated by ANN
5. Summary and Conclusions
Author Contributions
Funding
Data Availability Statement
Acknowledgments
Conflicts of Interest
References
- Feng, L.-H.; Lu, J. The Practical Research on Flood Forecasting Based on Artificial Neural Networks. Expert Syst. Appl. 2010, 37, 2974–2977. [Google Scholar] [CrossRef]
- Farooq, M.; Shafique, M.; Khattak, M.S. Flood Hazard Assessment and Mapping of River Swat Using HEC-RAS 2D Model and High-Resolution 12-M Tandem-X DEM (Worlddem). Nat. Hazards 2019, 97, 477–492. [Google Scholar] [CrossRef]
- Mahmood, S.; Rahman, A. Flash Flood Susceptibility Modeling Using Geo-Morphometric and Hydrological Approaches in Panjkora Basin, Eastern Hindu Kush, Pakistan. Environ. Earth Sci. 2019, 78, 43. [Google Scholar] [CrossRef]
- Ullah, K.; Zhang, J. GIS-Based Flood Hazard Mapping Using Relative Frequency Ratio Method: A Case Study of Panjkora River Basin, Eastern Hindu Kush, Pakistan. PLoS ONE 2020, 15, e0229153. [Google Scholar] [CrossRef] [PubMed] [Green Version]
- Rahman, A.; Mahmood, S.; Dawood, M.; Rahman, G.; Chen, F. Impact of Climate Change on Flood Factors and Extent of Damages in the Hindu Kush Region. In Oxford Research Encyclopedia of Natural Hazard Science; Oxford University Press: Oxford, UK, 2019. [Google Scholar]
- Mohd, M.S.; Alias, B.; Daud, D. GIS Analysis for Flood Hazard Mapping: Case Study Segamat, Johor, West Malaysia. In Proceedings of the Seminar Nasional GIS 2006: Geographic Information System Application for Mitigation in Natural Disaster, Jakarta, Indonesia, 29 November 2006; pp. 1–15. [Google Scholar]
- Falah, F.; Rahmati, O.; Rostami, M.; Ahmadisharaf, E.; Daliakopoulos, I.N.; Pourghasemi, H.R. Artificial Neural Networks for Flood Susceptibility Mapping in Data-Scarce Urban Areas. In Spatial Modeling in GIS and R for Earth and Environmental Sciences; Elsevier: Amsterdam, The Netherlands, 2019; pp. 323–336. [Google Scholar]
- Kenyon, W.; Hill, G.; Shannon, P. Scoping the Role of Agriculture in Sustainable Flood Management. Land Use Policy 2008, 25, 351–360. [Google Scholar] [CrossRef]
- Mikhailov, V.N.; Morozov, V.N.; Cheroy, N.I.; Mikhailova, M.V.; Zav’yalova, Y.F. Extreme Flood on the Danube River in 2006. Russ. Meteorol. Hydrol. 2008, 33, 48–54. [Google Scholar] [CrossRef]
- Hossain, B.; Sohel, M.S.; Ryakitimbo, C.M. Climate Change Induced Extreme Flood Disaster in Bangladesh: Implications on People’s Livelihoods in the Char Village and Their Coping Mechanisms. Prog. Disaster Sci. 2020, 6, 100079. [Google Scholar] [CrossRef]
- Jonkman, S.N.; Kelman, I. An Analysis of the Causes and Circumstances of Flood Disaster Deaths. Disasters 2005, 29, 75–97. [Google Scholar] [CrossRef]
- Zhang, Q.; Xu, C.-Y.; Zhang, Z.; Chen, Y.D.; Liu, C.; Lin, H. Spatial and Temporal Variability of Precipitation Maxima during 1960–2005 in the Yangtze River Basin and Possible Association with Large-Scale Circulation. J. Hydrol. 2008, 353, 215–227. [Google Scholar] [CrossRef]
- Khan, A.N.; Collins, A.E.; Qazi, F. Causes and Extent of Environmental Impacts of Landslide Hazard in the Himalayan Region: A Case Study of Murree, Pakistan. Nat. Hazards 2011, 57, 413–434. [Google Scholar]
- Khan, A.N.; Ali, A. Implication of Floods—2010 on Education Sector in Pakistan. In Disaster Recovery; Springer: Cham, Switzerland, 2014; pp. 117–133. [Google Scholar]
- Baig, M.A. Floods and Flood Plains in Pakistan. In Proceedings of the 20th International Congress on Irrigation and Drainage, Lahore, Pakistan, 13–18 October 2008. [Google Scholar]
- Tehrany, M.S.; Lee, M.-J.; Pradhan, B.; Jebur, M.N.; Lee, S. Flood Susceptibility Mapping Using Integrated Bivariate and Multivariate Statistical Models. Environ. Earth Sci. 2014, 72, 4001–4015. [Google Scholar] [CrossRef]
- Kumar, R. Flood Hazard Assessment of 2014 Floods in Sonawari Sub-District of Bandipore District (Jammu&Kashmir): An Application of Geoinformatics. Remote Sens. Appl. Soc. Environ. 2016, 4, 188–203. [Google Scholar]
- Li, Y.; Li, H.X.; Huang, J.; Liu, C. An Approximation Method for Evaluating Flash Flooding Mitigation o Sponge City Strategies – A Case Study of Central Geelong. J. Clean. Prod. 2020, 257, 120525. [Google Scholar] [CrossRef]
- Islam, M.M.; Sado, K. Development Priority Map for Flood Countermeasures by Remote Sensing Data with Geographic Information System. J. Hydrol. Eng. 2002, 7, 346–355. [Google Scholar] [CrossRef]
- Dixon, B. Applicability of Neuro-Fuzzy Techniques in Predicting Ground-Water Vulnerability: A GIS-Based Sensitivity Analysis. J. Hydrol. 2005, 309, 17–38. [Google Scholar] [CrossRef]
- Toosi, A.S.; Doulabian, S.; Tousi, E.G.; Calbimonte, G.H.; Alaghmand, S. Large-Scale Flood Hazard Assessment under Climate Change: A Case Study. Ecol. Eng. 2020, 147, 105765. [Google Scholar] [CrossRef]
- Biswajeet, P.; Mardiana, S. Flood Hazrad Assessment for Cloud Prone Rainy Areas in a Typical Tropical Environment. Disaster Adv. 2009, 2, 7–15. [Google Scholar]
- Cunderlik, J.M.; Burn, D.H. Analysis of the Linkage between Rain and Flood Regime and Its Application to Regional Flood Frequency Estimation. J. Hydrol. 2002, 261, 115–131. [Google Scholar] [CrossRef]
- Pradhan, B.; Youssef, A.M. Manifestation of Remote Sensing Data and GIS on Landslide Hazard Analysis Using Spatial-Based Statistical Models. Arab. J. Geosci. 2010, 3, 319–326. [Google Scholar] [CrossRef]
- Sezer, E.A.; Pradhan, B.; Gokceoglu, C. Manifestation of an Adaptive Neuro-Fuzzy Model on Landslide Susceptibility Mapping: Klang Valley, Malaysia. Expert Syst. Appl. 2011, 38, 8208–8219. [Google Scholar] [CrossRef]
- Oh, H.-J.; Pradhan, B. Application of a Neuro-Fuzzy Model to Landslide-Susceptibility Mapping for Shallow Landslides in a Tropical Hilly Area. Comput. Geosci. 2011, 37, 1264–1276. [Google Scholar] [CrossRef]
- Nardi, F.; Vivoni, E.R.; Grimaldi, S. Investigating a Floodplain Scaling Relation Using a Hydrogeomorphic Delineation Method. Water Resour. Res. 2006, 42, W09409. [Google Scholar] [CrossRef]
- Grimaldi, S.; Petroselli, A.; Arcangeletti, E.; Nardi, F. Flood Mapping in Ungauged Basins Using Fully Continuous Hydrologic–Hydraulic Modeling. J. Hydrol. 2013, 487, 39–47. [Google Scholar] [CrossRef]
- Hoptroff, R.G. The Principles and Practice of Time Series Forecasting and Business Modelling Using Neural Nets. Neural Comput. Appl. 1993, 1, 59–66. [Google Scholar] [CrossRef]
- Kia, M.B.; Pirasteh, S.; Pradhan, B.; Mahmud, A.R.; Sulaiman, W.N.A.; Moradi, A. An Artificial Neural Network Model for Flood Simulation Using GIS: Johor River Basin, Malaysia. Environ. Earth Sci. 2012, 67, 251–264. [Google Scholar] [CrossRef]
- Biswajeet, P.; Saied, P. Comparison between Prediction Capabilities of Neural Network and Fuzzy Logic Techniques for L and Slide Susceptibility Mapping. Disaster Adv. 2010, 3, 26–34. [Google Scholar]
- Minns, A.W.; Hall, M.J. Artificial Neural Networks as Rainfall-Runoff Models. Hydrol. Sci. J. 1996, 41, 399–417. [Google Scholar] [CrossRef]
- Kasiviswanathan, K.S.; Sudheer, K.P.; He, J. Probabilistic and Ensemble Simulation Approaches for Input Uncertainty Quantification of Artificial Neural Network Hydrological Models. Hydrol. Sci. J. 2018, 63, 101–113. [Google Scholar] [CrossRef]
- Tealab, A. Time Series Forecasting Using Artificial Neural Networks Methodologies: A Systematic Review. Future Comput. Inform. J. 2018, 3, 334–340. [Google Scholar] [CrossRef]
- Poonia, V.; Tiwari, H.L. Rainfall-Runoff Modeling for the Hoshangabad Basin of Narmada River Using Artificial Neural Network. Arab. J. Geosci. 2020, 13, 1–10. [Google Scholar] [CrossRef]
- Jain, S.K.; Mani, P.; Jain, S.K.; Prakash, P.; Singh, V.P.; Tullos, D.; Kumar, S.; Agarwal, S.P.; Dimri, A.P. A Brief Review of Flood Forecasting Techniques and Their Applications. Int. J. River Basin Manag. 2018, 16, 329–344. [Google Scholar] [CrossRef]
- Merkuryeva, G.; Merkuryev, Y.; Sokolov, B.V.; Potryasaev, S.; Zelentsov, V.A.; Lektauers, A. Advanced River Flood Monitoring, Modelling and Forecasting. J. Comput. Sci. 2015, 10, 77–85. [Google Scholar] [CrossRef]
- Campolo, M.; Andreussi, P.; Soldati, A. River Flood Forecasting with a Neural Network Model. Water Resour. Res. 1999, 35, 1191–1197. [Google Scholar] [CrossRef]
- Islam, A.S. Improving Flood Forecasting in Bangladesh Using an Artificial Neural Network. J. Hydroinformatics 2010, 12, 351–364. [Google Scholar] [CrossRef] [Green Version]
- Iqbal, M.S.; Dahri, Z.H.; Querner, E.P.; Khan, A.; Hofstra, N. Impact of Climate Change on Flood Frequency and Intensity in the Kabul River Basin. Geosciences 2018, 8, 114. [Google Scholar] [CrossRef] [Green Version]
- Lashkaripour, G.R.; Hussaini, S.A. Water Resource Management in Kabul River Basin, Eastern Afghanistan. Environmentalist 2008, 28, 253–260. [Google Scholar] [CrossRef]
- Kottek, M.; Grieser, J.; Beck, C.; Rudolf, B.; Rubel, F. World Map of the Köppen-Geiger Climate Classification Updated. Meteorol. Z. 2006, 15, 259–263. [Google Scholar] [CrossRef]
- Bibi, T.; Nawaz, F.; Abdul Rahman, A.; Latif, A. Flood Hazard Assessment Using Participatory Approach and Weighted Overlay Methods. Int. Arch. Photogramm. Remote. Sens. Spat. Inf. Sci. 2019, XLII–4/W16, 153–160. [Google Scholar] [CrossRef] [Green Version]
- Atkinson, P.M.; Tatnall, A.R.L. Introduction Neural Networks in Remote Sensing. Int. J. Remote Sens. 1997, 18, 699–709. [Google Scholar] [CrossRef]
- Tsakiri, K.; Marsellos, A.; Kapetanakis, S. Artificial Neural Network and Multiple Linear Regression for Flood Prediction in Mohawk River, New York. Water 2018, 10, 1158. [Google Scholar] [CrossRef] [Green Version]


| S.NO | Meteorological Station | Lat/Long | Altitude (m) | Mean Annual Precipitation (mm) |
|---|---|---|---|---|
| 1 | Peshawar | 34°2′/71°56′ | 328 | 484 |
| 2 | Cherat | 33°49′/71°33′ | 892 | 592 |
| 3 | Risalpur | 34°3′/71°58′ | 312 | 523 |
| S.No | Rivers | Gauging Station |
|---|---|---|
| 1 | Kabul River | Warsak Dam |
| 2 | Swat River | Munda Headworks |
| 3 | Kalpani River | Risalpur |
| 4 | Budhni River | Darmangi, Peshawar |
| 5 | Jindi River | Utmanzai, Charsadda |
| 6 | Bara River | G.T Road, Tarnab |
Publisher’s Note: MDPI stays neutral with regard to jurisdictional claims in published maps and institutional affiliations. |
© 2021 by the authors. Licensee MDPI, Basel, Switzerland. This article is an open access article distributed under the terms and conditions of the Creative Commons Attribution (CC BY) license (https://creativecommons.org/licenses/by/4.0/).
Share and Cite
Saeed, M.; Li, H.; Ullah, S.; Rahman, A.-u.; Ali, A.; Khan, R.; Hassan, W.; Munir, I.; Alam, S. Flood Hazard Zonation Using an Artificial Neural Network Model: A Case Study of Kabul River Basin, Pakistan. Sustainability 2021, 13, 13953. https://doi.org/10.3390/su132413953
Saeed M, Li H, Ullah S, Rahman A-u, Ali A, Khan R, Hassan W, Munir I, Alam S. Flood Hazard Zonation Using an Artificial Neural Network Model: A Case Study of Kabul River Basin, Pakistan. Sustainability. 2021; 13(24):13953. https://doi.org/10.3390/su132413953
Chicago/Turabian StyleSaeed, Muhammad, Huan Li, Sami Ullah, Atta-ur Rahman, Amjad Ali, Rehan Khan, Waqas Hassan, Iqra Munir, and Shuaib Alam. 2021. "Flood Hazard Zonation Using an Artificial Neural Network Model: A Case Study of Kabul River Basin, Pakistan" Sustainability 13, no. 24: 13953. https://doi.org/10.3390/su132413953