Article

Can Crop Insurance Encourage Farmers to Adopt Environmentally Friendly Agricultural Technology—The Evidence from Shandong Province in China

Agricultural Information Institute, Chinese Academy of Agricultural Science, No. 12 Zhongguancun South Street, Haidian District, Beijing 100081, China
*
Author to whom correspondence should be addressed.
The authors have equal contribution.
Sustainability 2021, 13(24), 13843; https://doi.org/10.3390/su132413843
Submission received: 1 November 2021 / Revised: 8 December 2021 / Accepted: 9 December 2021 / Published: 15 December 2021

Abstract

:
It is critical to encourage farmers to adopt agriculture technology that is beneficial to the environment in the context of the ongoing emphasis on the ecological growth of agriculture, yet risk and uncertainty diminish the incentive to adopt these technologies. This research examines whether crop insurance might affect and increase willingness to adopt Environmentally Friendly Agricultural Technology (EFAT) from a psychological perspective, utilizing data from 219 questionnaires in Shandong Province. The findings suggest that crop insurance can boost readiness to embrace technology in three ways: motivation, ability, and opportunity; however, the positive effect of motivation on farmers diminishes as capacity increases. Insurance companies must offer products that contain the risk of adopting EFAT as an insurance obligation as soon as feasible to successfully boost willingness to use technologies and collaborate with agricultural technology departments to provide farmers with training as well as disaster avoidance services.

1. Introduction

The agriculture of China has had tremendous development over the last 40 years, with an average annual growth rate of 10.9%, relying mostly on a crude production method involving the use of a large number of fertilizers and pesticides [1]. However, China has also become a developing country that utilizes the most fertilizers and pesticides as a result of this approach. To encourage the development of a “resource-conserving” and “environmentally friendly” agricultural business, the government of China highlighted that agricultural production methods must shift from a resource-intensive model to a more sophisticated model in 2017. Based on the application of new discoveries in natural science, China has studied and introduced a number of EFATs, such as pollution control, biological control, organic fertilizer, water-saving irrigation, and so on, which has slowed the growth of agricultural surface source pollution to some extent and increased net income of rural families [2].
EFAT, on the other hand, is marked by a high degree of difficulty in development, a long lead time, a high amount of risk, and unpredictable returns, which often forces farmers to abandon existing production methods and reduce the use of agricultural chemicals. Even if farmers have a basic understanding of environmental issues, given the uncertainty of agricultural product prices and distribution routes in the future, the danger of production variations caused by EFAT would surely diminish farmers’ willingness to use them [3]. Many researchers have looked at the elements that influence technology adoption from many aspects, which can be summed into three categories: individual traits, technology attributes, and external factors. Family features, age, education, planting scale, and land resources are among the inherent motivators for farmers to employ technology [4,5,6,7,8,9,10,11,12,13,14], but the uncertainty and complexity of these technologies greatly restrict this kind of desire [15].
Since the adoption of EFAT entails production risks, some experts have looked into whether crop insurance may successfully enhance the usage of them. Carter found that remote index insurance can alleviate the problem of traditional insurance information asymmetry and encourage farmers to embrace EFAT [16]. The impact of crop insurance on farmers’ pesticide and fertilizer application behavior has also been studied by several Chinese scholars [17,18,19,20]. However, these studies primarily focus on changes in farmers’ production behavior as a result of engaging in crop insurance from a moral hazard perspective; there is limited study on whether risk diversification in crop insurance can increase the desire of farmers to use technologies. Therefore, this paper combines motivation, opportunity, and ability (MOA) theory with crop insurance to investigate the mechanism and pathway of crop insurance influencing farmers’ willingness to adopt technologies from a psychological perspective. Additionally, we will look at how crop insurance affects farmers’ adoption of technologies in various situations as well as the relationship between motivation, opportunity, and ability.
MacInnis presented the MOA theory in 1989 as a way to explain individual information behavior [21]. According to the idea, the interplay and combined action of motivation, opportunity, and ability drive specific behaviors and have a substantial impact on people’s decision-making behavior. Motivation relates to a force that directs an individual toward a specific goal, opportunity refers to situational circumstances that help or hinder information processing, and ability involves the knowledge and skills that an individual possesses to achieve a given activity. Because of its high explanatory and predictive potential for individual behavior, the model has been frequently employed in the study of individual behavioral decision making in recent years. Gruen used the MOA model to investigate the elements that influence consumer technology exchange in a virtual community setting [22], Siemsen used the MOA model to explain knowledge sharing behavior among employees [23], and Radaelli investigated how employees share their knowledge and how this affects their ability to be creative at work [24]. According to this research, crop insurance can boost farmers’ desire to accept technologies if it increases their motivation, opportunity, and ability.
Motivation is the force that pushes people to do particular things and achieve specific objectives [25], and it is made up of two primary components: needs and triggers. Individual behavioral decisions are influenced by motivation and have a direct impact on the actor’s judgment. Price guarantee, yield guarantee, and honor incentive motivation are three features of crop insurance that drive farmers to adopt EFAT. Price protection or yield protection means that if farmers use the technologies indicated in the insurance contract, they can enjoy a better degree of protection at the same premium level. The risk protection function of crop insurance may effectively hedge the risk of fluctuation owing to the deployment of technology and stabilize the income of farmers. The honor incentive motivation refers to when an insurance company picks the yearly model production farmers from among the insured farmers who employ EFAT in the current year, and they will receive preferential rates as a result of their selection. This incentive can raise the quality of agricultural products while lowering farmers’ premium payment costs and encouraging the use of technology. As a result, the motivation of crop insurance has a positive influence on the decision to utilize technology. Hypothesis H1 is offered based on the foregoing analysis.
Hypothesis 1 (H1).
The desire of farmers to adopt EFAT can be boosted by the motivation of crop insurance.
Opportunity refers to the external environment faced by an individual within a given time, which is not controlled by the individual but has a driving or inhibiting effect on the individual’s behavior. We argue that the propensity of farmers to accept technology is impacted by the external environment, involving the simplicity of technologies, social networks, and the ability to receive loans after enrolling in crop insurance. The broader the distribution and simplicity of technology, the more likely it will be adopted, and adoption of technology increases as the number of comparable practitioners utilizing EFAT grows. In addition, due to the increased hazards associated with agriculture and the absence of adequate collateral, the balance of agricultural loans in China was just 2.5% of the total RMB loans made by financial institutions in 2020. The problem of credit has been a significant impediment to agricultural reproductive development. Crop insurance can stabilize farmers’ income through risk diversification, reduce the non-performing loan rate of banks to a certain extent, and may get farmers a credit to refill their capital on time. Based on the information presented above, hypothesis H2 is proposed.
Hypothesis 2 (H2).
The desire of farmers to adopt EFAT can be boosted by the opportunity provided by crop insurance.
Ability refers to the attributes that influence the efficiency with which individuals complete specific tasks and is classified into two categories: knowledge and skills [26]. In this paper, ability is defined as the capacity of farmers to withstand dangers and master technology. Because agriculture is risky, and the application of technology increases the uncertainty of returns, farmers will weigh the risks of adopting technologies against their personal risk and the ability to withstand adversity when deciding whether to do so. In addition, the skill to master the technology is also a crucial factor for farmers to consider. The cost of technology is significant, and, if it is not used appropriately, it will impair crop growth and development, resulting in lower yields; thus, even if farmers have a great incentive to adopt technology, the likelihood of their doing so is minimal in the absence of appropriate capacity assistance. If insurance firms can give catastrophe prevention and mitigation information and services to farmers that use technology, or engage local agricultural specialists to give technical counseling and lectures to help farmers avoid dangers early in the technology adoption process and decrease operational risks, farmers will be more ready to use ecologically beneficial farming methods. Derived from the information presented above, hypothesis H3 is proposed.
Hypothesis 3 (H3).
Ability of crop insurance can increase farmers’ willingness to adopt EFAT.
The three hypotheses proposed above are tested by the following section arrangement: Section 2 will discuss the design of the questionnaire, how the research sample was chosen, and propose econometric models; Section 3 will analyze the results and test the mediation effect; Section 4 will compare the results with the previous ones to illustrate the reliability; Section 5 will summarize the full text and make policy recommendations.

2. Materials and Methods

2.1. Questionnaire Design

In order to ensure the scientific validity of the questionnaire, it was built based on the research target of the impact of crop insurance on farmer adoption of technology, with reference to the present mature scales [27]. The questionnaire has 12 measurable factors that are linked to four latent variables: motivation, opportunity, ability, and willingness to adopt technology. The three observed variables that correspond to each latent variable were designed in a way that is in line with the current state of crop insurance in China and reflects the hypothesis provided in Section 1. Meanwhile, we conducted a presurvey before the formal survey to modify and improve the questionnaire according to the problems reflected by farmers in the presurvey. The degree of willingness to adopt EFAT is assessed using a five-point Likert scale (totally disagree = 1; disagree = 2; average = 3; agree = 4; strongly agree = 5), as shown in Table 1.

2.2. Sampling Method

Vegetables, as a key aspect of their dietary nutrition, have become a vital category of agricultural goods in the food consumption pattern of the Chinese population. With 719 million tons of vegetable yield, China’s vegetable output ranked top in the world in 2019, accounting for more than half of global output. In recent years, in order to promote the development of the green vegetable sector and raise people’s living standards, the Chinese government has fostered the popularization of green vegetable production technology by promoting the strong growth of pollution-free green veggies. Thus, the readiness of producers to embrace technology is investigated in this research using vegetables as an example. Shandong Province produced 81.181 million tons of vegetables in 2019, accounting for 11.3% of total output and ranking first in China. Moreover, Shandong Province aggressively supports technology and encourages the use of EFAT. Farmers in this region have a higher demand for vegetable insurance as a result of the intensive marketing of vegetable insurance in recent years; hence, Shandong Province was chosen as the research location.
A stratified random sampling strategy was used to sample the farmers. We divided all the counties in Shandong Province into three quantiles according to annual yield. ZhangQiu, ShouGuang, and LanLing were selected as the sample areas. To guarantee the representativeness of the study subjects, three townships were randomly picked in each county. The administrative villages in the three townships were split into three groups based on their per capita income levels: high, medium, and poor. To make a total of nine sample villages, one administrative village was randomly picked from each group, and 10 households involved in vegetable cultivation were randomly selected in each village for a questionnaire survey. In total, our sample includes 270 households residing in 27 villages in 9 townships in 3 counties. Considering the limited cultural level of vegetable farmers, this survey adopted the method of face-to-face interviews to fill in the questionnaire. The investigators included senior undergraduates and masters and doctoral students who had undergone training. We provided each farmer participating in the survey a reward of 30 RMB (1 USD = 6.4 RMB).

2.3. Basic Models

This paper constructs a hypothetical model based on MOA theory to discuss the influence of crop insurance on technology adoption from the standpoints of motivation, opportunity, and ability. Since the latent variables are abstract and the results cannot be viewed immediately, structural equation modeling is required to tackle the problem. Structural equation modeling allows us to handle both the measurement of latent variables as well as the structure between latent variables in one model, and it also permits independent variables of the regression equation to be free of measurement mistakes [28]. Therefore, we use structural equation modeling to measure the effect of crop insurance under various clauses on farmers’ willingness to adopt EFAT, with the following measurement and structural equations.
x = Λ x θ + δ
y = Λ y η + ε
η = B η + Γ θ + ζ
where Equations (1) and (2) are measurement models and Equation (3) is a structural model. Equation (1) is the measurement equation for the exogenous latent variable and Equation (2) is the measurement equation for the endogenous latent variable. x is the vector of exogenous observed variables, θ is the vector of exogenous latent variables, Λ x is the relationship between the exogenous observed variables and the exogenous latent variable, and δ is the error. y is the vector of endogenous observed variables, η is the vector of endogenous latent variables, Λ y is the relationship between endogenous observed variables and endogenous latent variables, and ε is the error term vector of endogenous variables. B and Γ are both path coefficients, B denotes the relationship between endogenous latent variables, Γ denotes the effect of exogenous latent variables on the values of endogenous latent variables, and ζ is the error term of the structural equation. In this study, the endogenous latent variable η is the effect of crop insurance on farmers’ willingness to adopt technology under different contracts, and the exogenous latent variable θ includes three factors that have an impact on the willingness to choose technology in terms of motivation, opportunity, and ability that crop insurance has under different contracts.

3. Results

3.1. Data Description

The survey started in October 2020 and lasted for a week. After removing the blank, partial, and missing responses to legitimate questions, 219 questionnaires were retrieved, with a valid questionnaire rate of 91.25%. Regarding the sample size, we need to make an explanation. Boomsma [29] argued that the higher the sample size, the better the model’s convergence and parameter estimate accuracy. When the sample size is less than 100, the resulting correlation matrix is not stable enough, reducing dependability of structural equation modeling; he recommends that the sample size should be at least greater than 100 and ideally 200. Hair [30] believes that the number of samples used in regression analysis should be at least five times the total number of model variables. Compared with other research utilizing [31,32,33] structural equation models, most sample sizes are above 100, so the sample size of 219 in this study has little bearing on the model’s correctness.
Eggplant and fruits, such as cucumber and tomatoes, dominated the vegetable production of the sample farmers, while a small number of farmers grew leek, onion, and other green vegetables. In terms of farmer characteristics, the labor force engaged in vegetable production is primarily male, accounting for 79%, and the majority of farmers are between the ages of 46 and 55, accounting for about 39%, while only 9% of young laborers aged 35 and under are engaged in vegetable cultivation. In terms of education, 128 individuals have completed junior high school, accounting for 58%, and 41 persons have a high school diploma or more, accounting for 21%, indicating that education levels are generally low. In terms of production characteristics, vegetable farming is mostly small-scale in the research region, with 122 families (56%) having a planting space of less than 0.8 acres and only 13% having a planting area of more than 1.6 acres; farmers had a lot of expertise with vegetable growing, with 90% of them having grown vegetables for more than 5 years; couples make up the majority of the labor force, accounting for around 63% of the total, and just 20% of farmers have more than three people on their property. Vegetable is the major source of income for most households, with 81 percent having a total household income of more than 40,000 yuan and 64% having a total household income of more than 40,000 yuan from vegetable. The characteristics of the sample farmers are shown in Table 2.

3.2. Test of Reliability and Validity
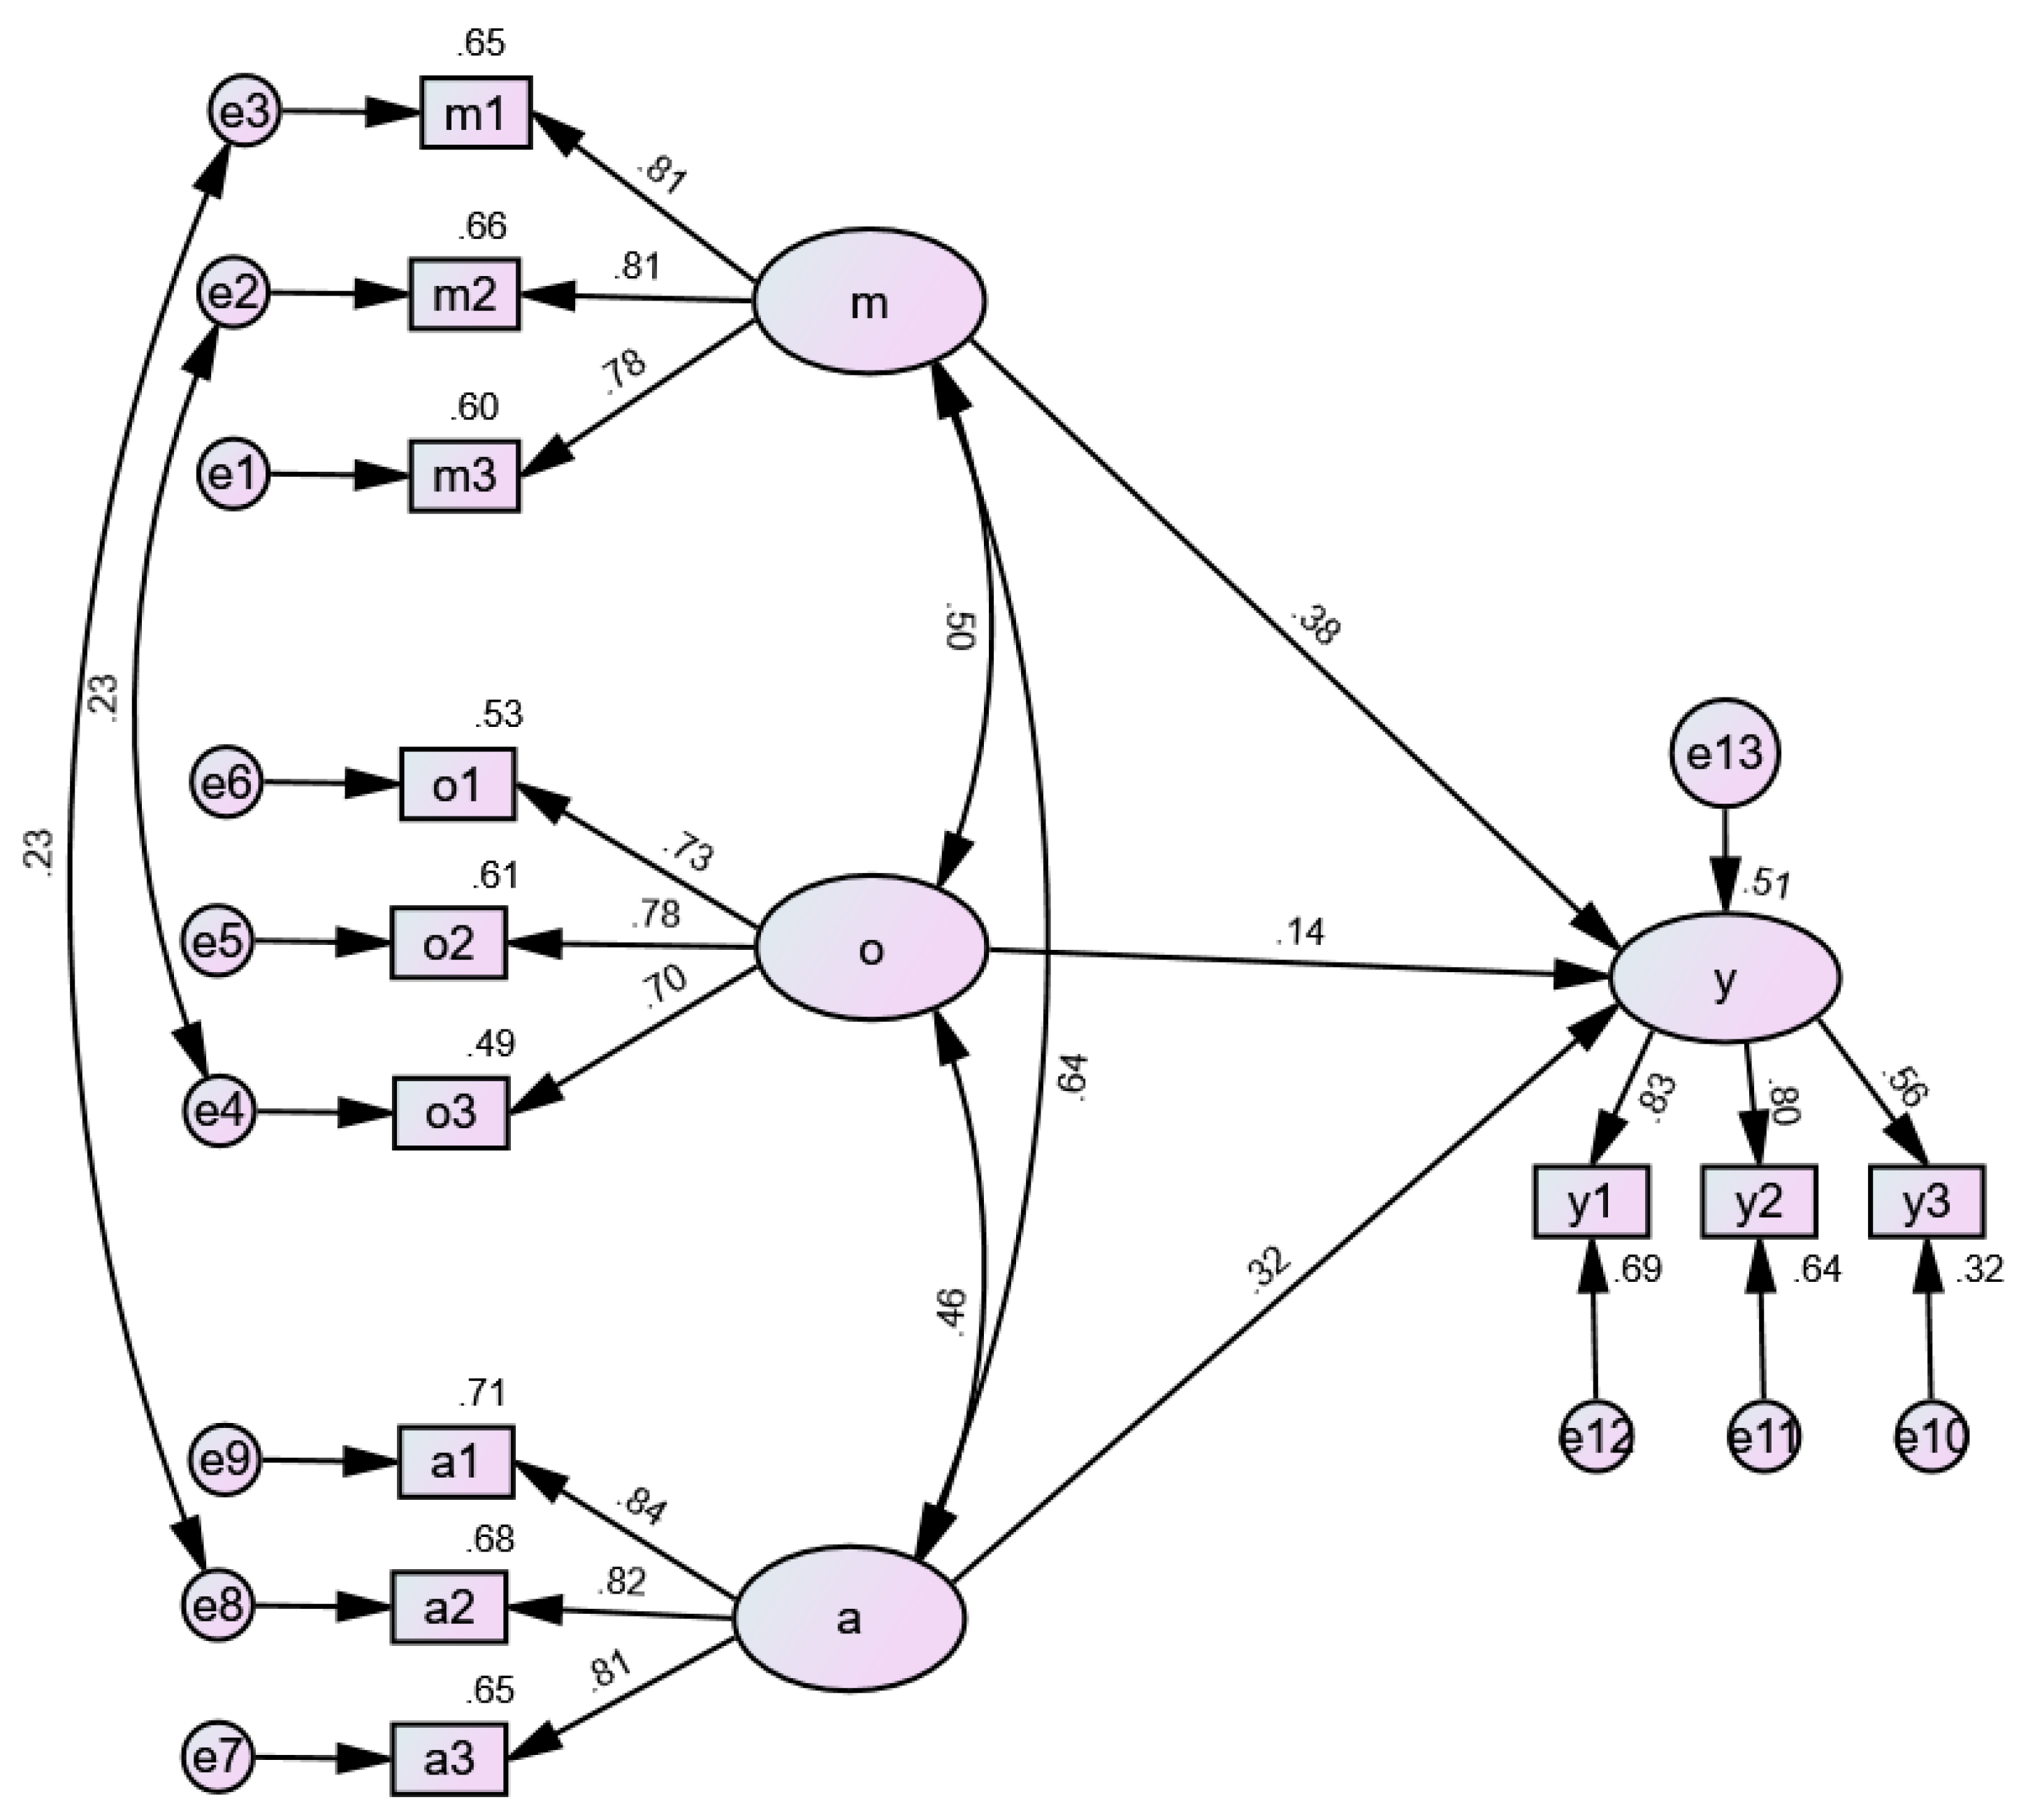
Before conducting the empirical analysis, the reliability and validity of the data need to be tested. The Cronbach’s alpha coefficient, introduced by Lee Cronbach in the mid-nineteenth century, is a data reliability test indication that reaches 0.6 or above, suggesting that the questionnaire data have strong correlation and trustworthy dependability. Using SPSS 26.0 to assess each variable, the overall dimension of the data had an alpha value of 0.884, suggesting that the data in this study is reliable. Additionally, the alpha value of each dimension is larger than 0.7, indicating that each dimension of data fits the requirements.
The two main methodologies of validity testing are exploratory factor analysis (EFA) and confirmatory factor analysis (CFA). The first stage in exploratory factor analysis (EFA) is to perform the Bartlett sphere test, which aims to test the degree of correlation among the variables. The second stage involves using principal component analysis and the maximum variance technique of rotation to solve for common components and estimate the number of factors retrieved. The KMO value was 0.862, which is larger than 0.8 and significant at the 99 percent confidence level, suggesting that the data in this study is eligible for factor analysis. With an eigenvalue larger than 1, a total of four elements are identified. With factor loadings larger than 0.7, m1, m2, and m3 belong to factor 1 and are dubbed “the motivation of crop insurance”; with factor loadings greater than 0.8, a1, a2, and a3 belong to factor 2 and are dubbed “the ability of crop insurance”; with factor loadings greater than 0.7, o1, o2, and o3 belong to factor 3 and are dubbed “the opportunity of crop insurance”; with factor loadings greater than 0.7, y1, y2, and y3 belong to factor 4 and are dubbed “willingness to adopt EFAT under the influence of crop insurance”.
The validated factor analysis (CFA) includes a structural validity test, combined reliability and convergent validity test, and discriminant validity test [34]. The main purpose of the structural validity test is to verify the explanatory validity of the equation setting on the dependent variable. The test statistics mainly refer to two absolute fit indices, χ 2 /df and RMSEA, as well as relative fit indices such as CFI. As shown in Table 3, the absolute fit index χ 2 /df and RMSEA have fit values of 1.702 and 0.054, respectively, which are less than 3 and 0.08, suggesting optimal equation fit; the CFI, IFI, and TLI relative fit index are all larger than 0.9, indicating satisfactory equation fit. As a result of the structural validity test, the effect of crop insurance on farmers’ readiness to embrace EFAT may be explained by the three influence channels of crop insurance: motive, opportunity, and capacity.
The combined reliability and convergent validity tests are conducted to verify the representativeness of the sub-questions under the four variables of motivation, opportunity, ability, and adoption willingness. As shown in Table 4, the factor loadings of each sub-topic under the four variables of motivation, opportunity, ability, and adoption willingness for crop insurance are all greater than 0.7, indicating that each sub-topic is strongly representative of the variables. In addition, the average variance extracted (AVE) of each variable was greater than 0.5 and the combined reliability (CR) is greater than 0.8, showing that the convergent validity is satisfactory.
The main purpose of the discriminant validity test is to verify the discriminant validity of the sub-question of each variable, that is, an item that should not belong to the same variable is a member of different variable. As shown in Table 5, the absolute values of the correlation coefficients of agricultural insurance motivation, opportunity, capacity, and adoption willingness are all less than the evolution of AVE, demonstrating that there is some discriminant validity among the variables.

3.3. Main Results

The structural equation model was fitted using Amos 26.0 software based on the given theoretical model. Meanwhile, maximum likelihood estimation (ML) is the most widely used approach of structural equation; this paper employs it to estimate the model as well. Hu, Bentler [35] pointed out that ML is still acceptable in most circumstances, and it may estimate data with non-normal distribution, as long as the amount of data isn’t too large. Figure 1 and Table 6 illustrate the ideal model and fit index. The fit indexes are within acceptable limits, suggesting that the study findings are consistent with the theoretical model.
The model result is shown in Figure 1 and Table 7. It should be noted that the initial model did not include the interaction between the residual items, but the model suggested that the residuals e2 and e4, e3 and e8 have mutual influence, implying that m2 and o3, m1 and a2 have mutual impact. The fundamental explanation for the correlation between m2 and o3 might be that as costs decrease, the production scale will be expanded, requiring farmers to guarantee output. Similarly, the major explanation for the link of m1 and a2 is that, as farmers’ catastrophe prevention and loss reduction capacities increase, they are more likely to pay attention to market risks. Thus, in order to improve the goodness of fit of the model, the interactions between residual terms are established on the basis of the original model. Following the principle of releasing one parameter at a time, a total of four residual correlation routes are added, like e2 and e4, e3 and e8.
As shown in Figure 1 and Table 7, crop insurance has considerable beneficial impacts on farmers’ technology choice, with standard coefficients of 0.38, 0.14, and 0.315 on motivation, opportunity, and ability, respectively, with confidence level of 0.1 or less than 0.1. Thus, hypotheses H1, H2, and H3 are all verified positively; insurance firms may help farmers implement EFAT by producing price or yield insurance, disaster prevention, loss reduction services, and technical guidance. Furthermore, the “insurance + loan” approach can help farmers receive loans and encourage them to pursue technology. In terms of the influencing factors, the motivation of crop insurance has the greatest influence on the adoption of EFAT, which, to some degree, reflects concerns of farmers about the risk connected with technology usage; the opportunity of crop insurance has the least impact, which may be related to the tiny scale of the farmers analyzed.

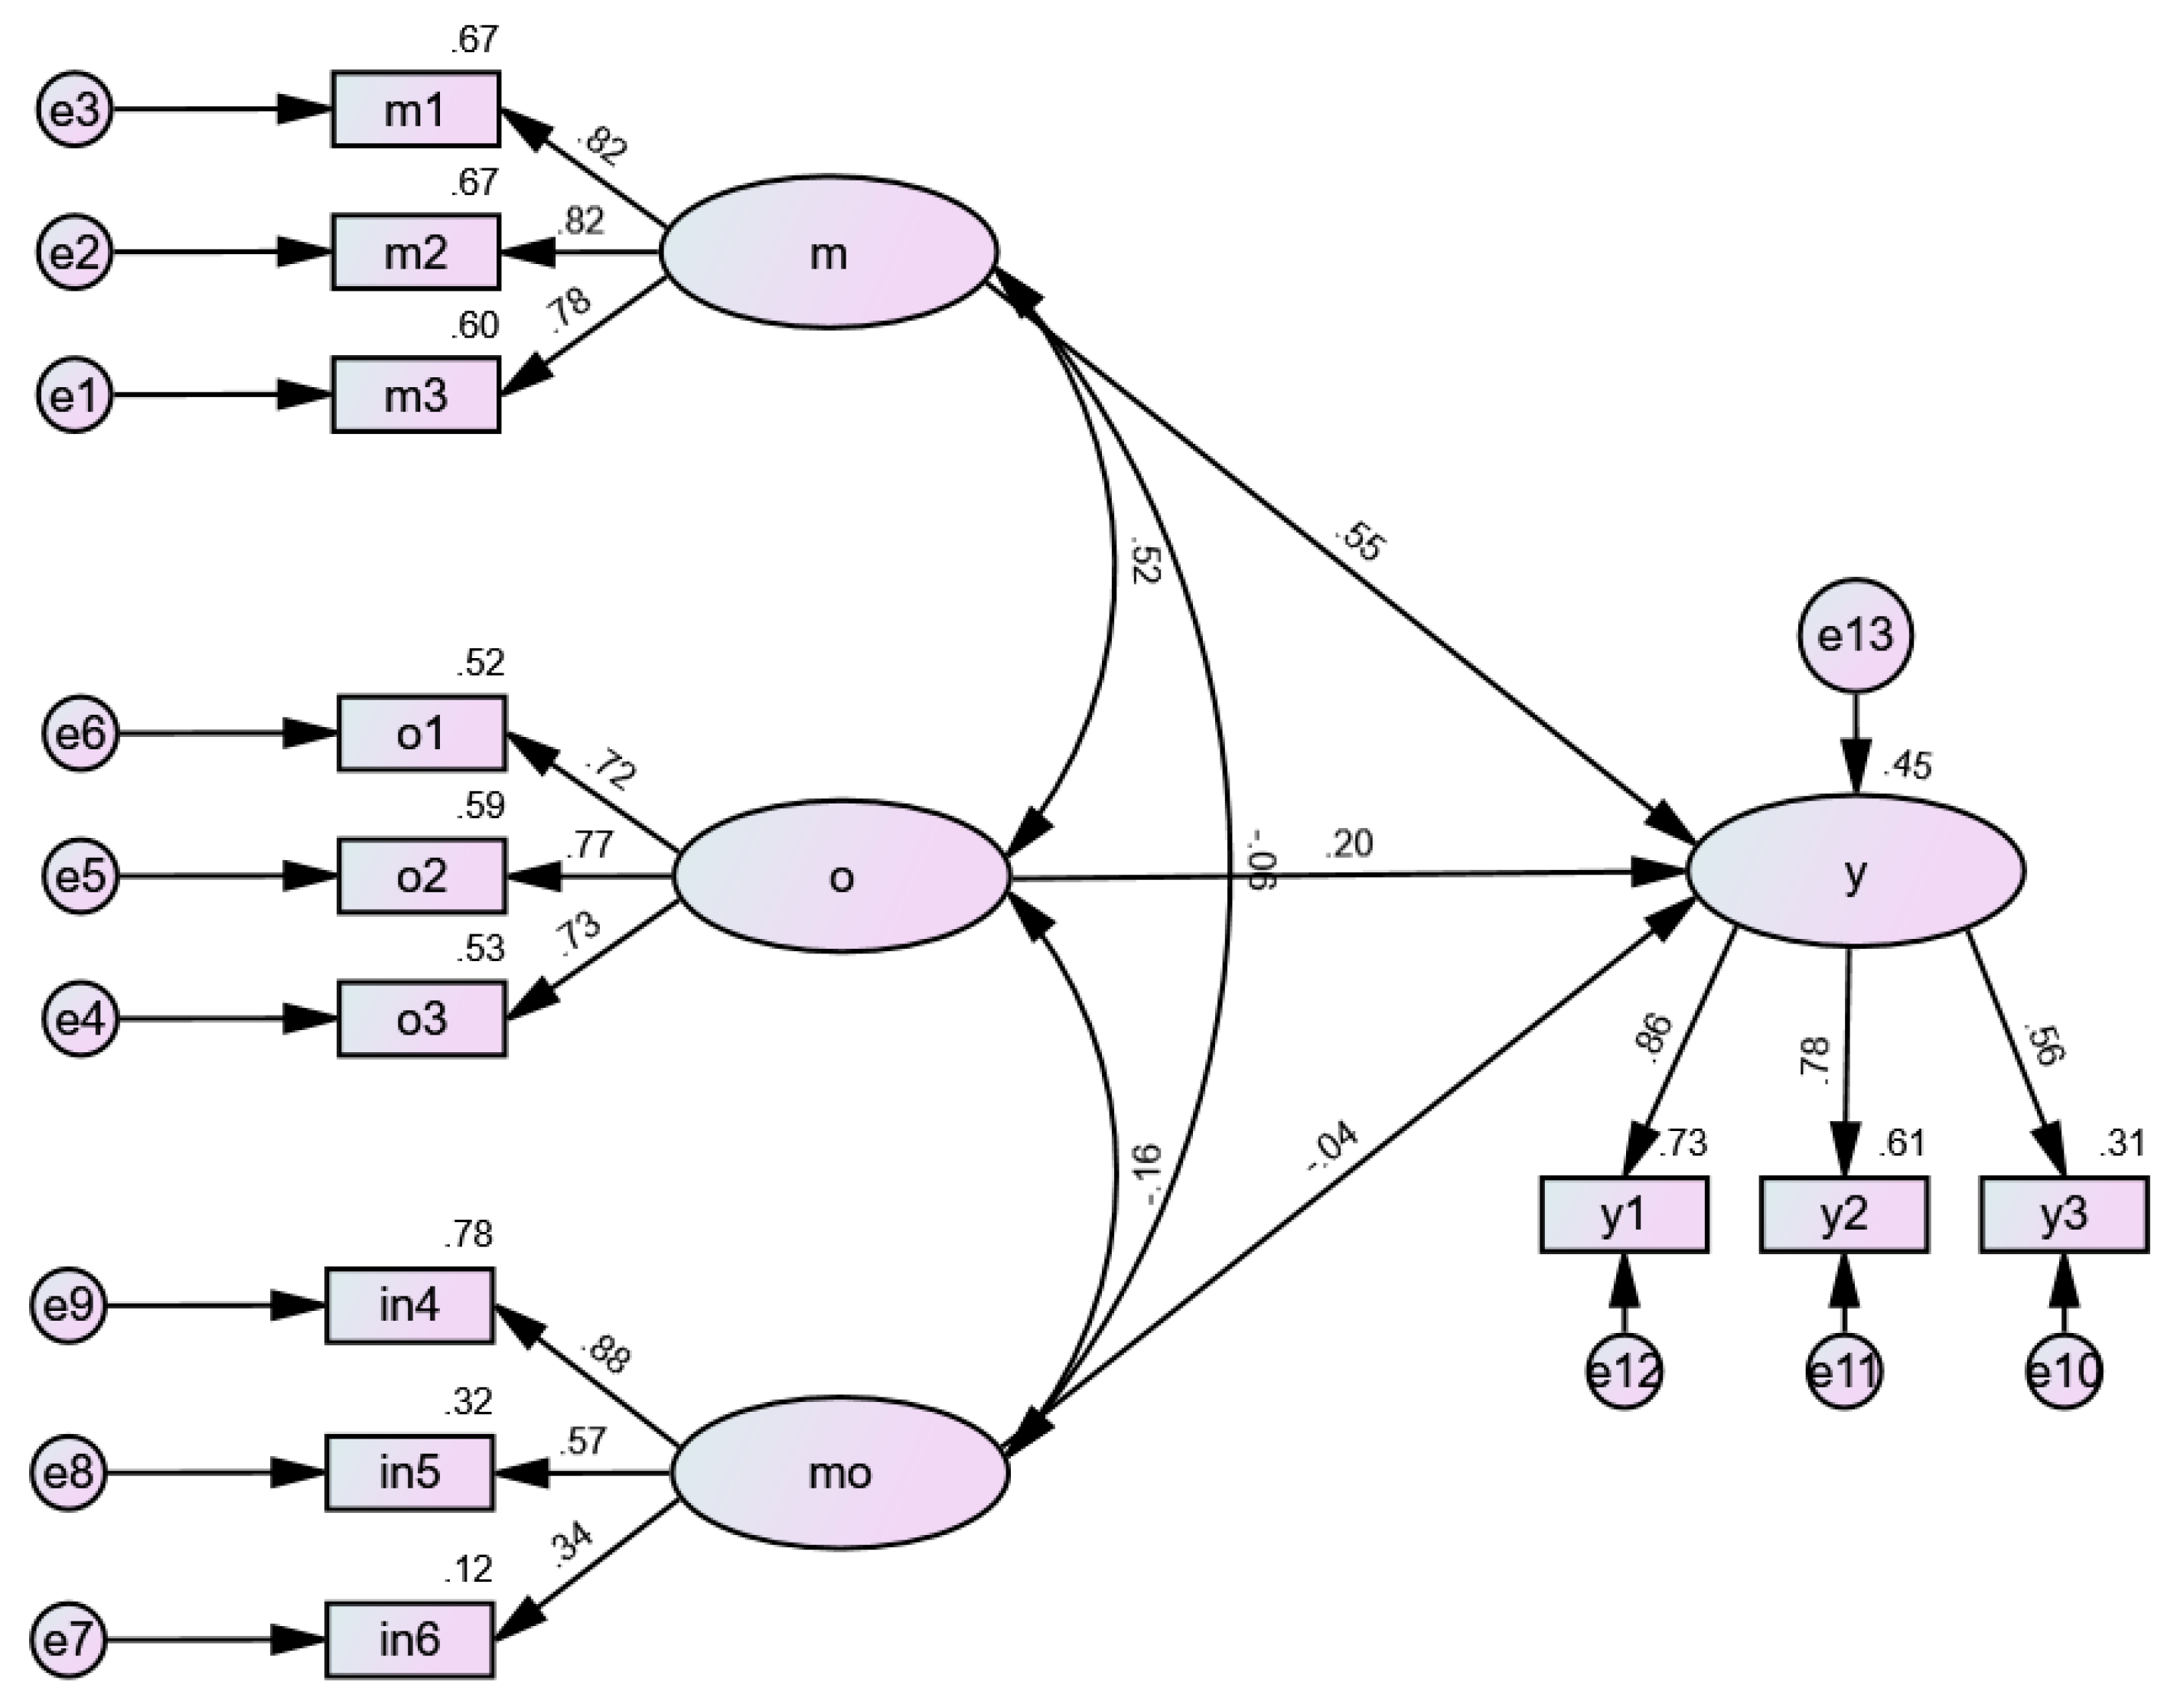
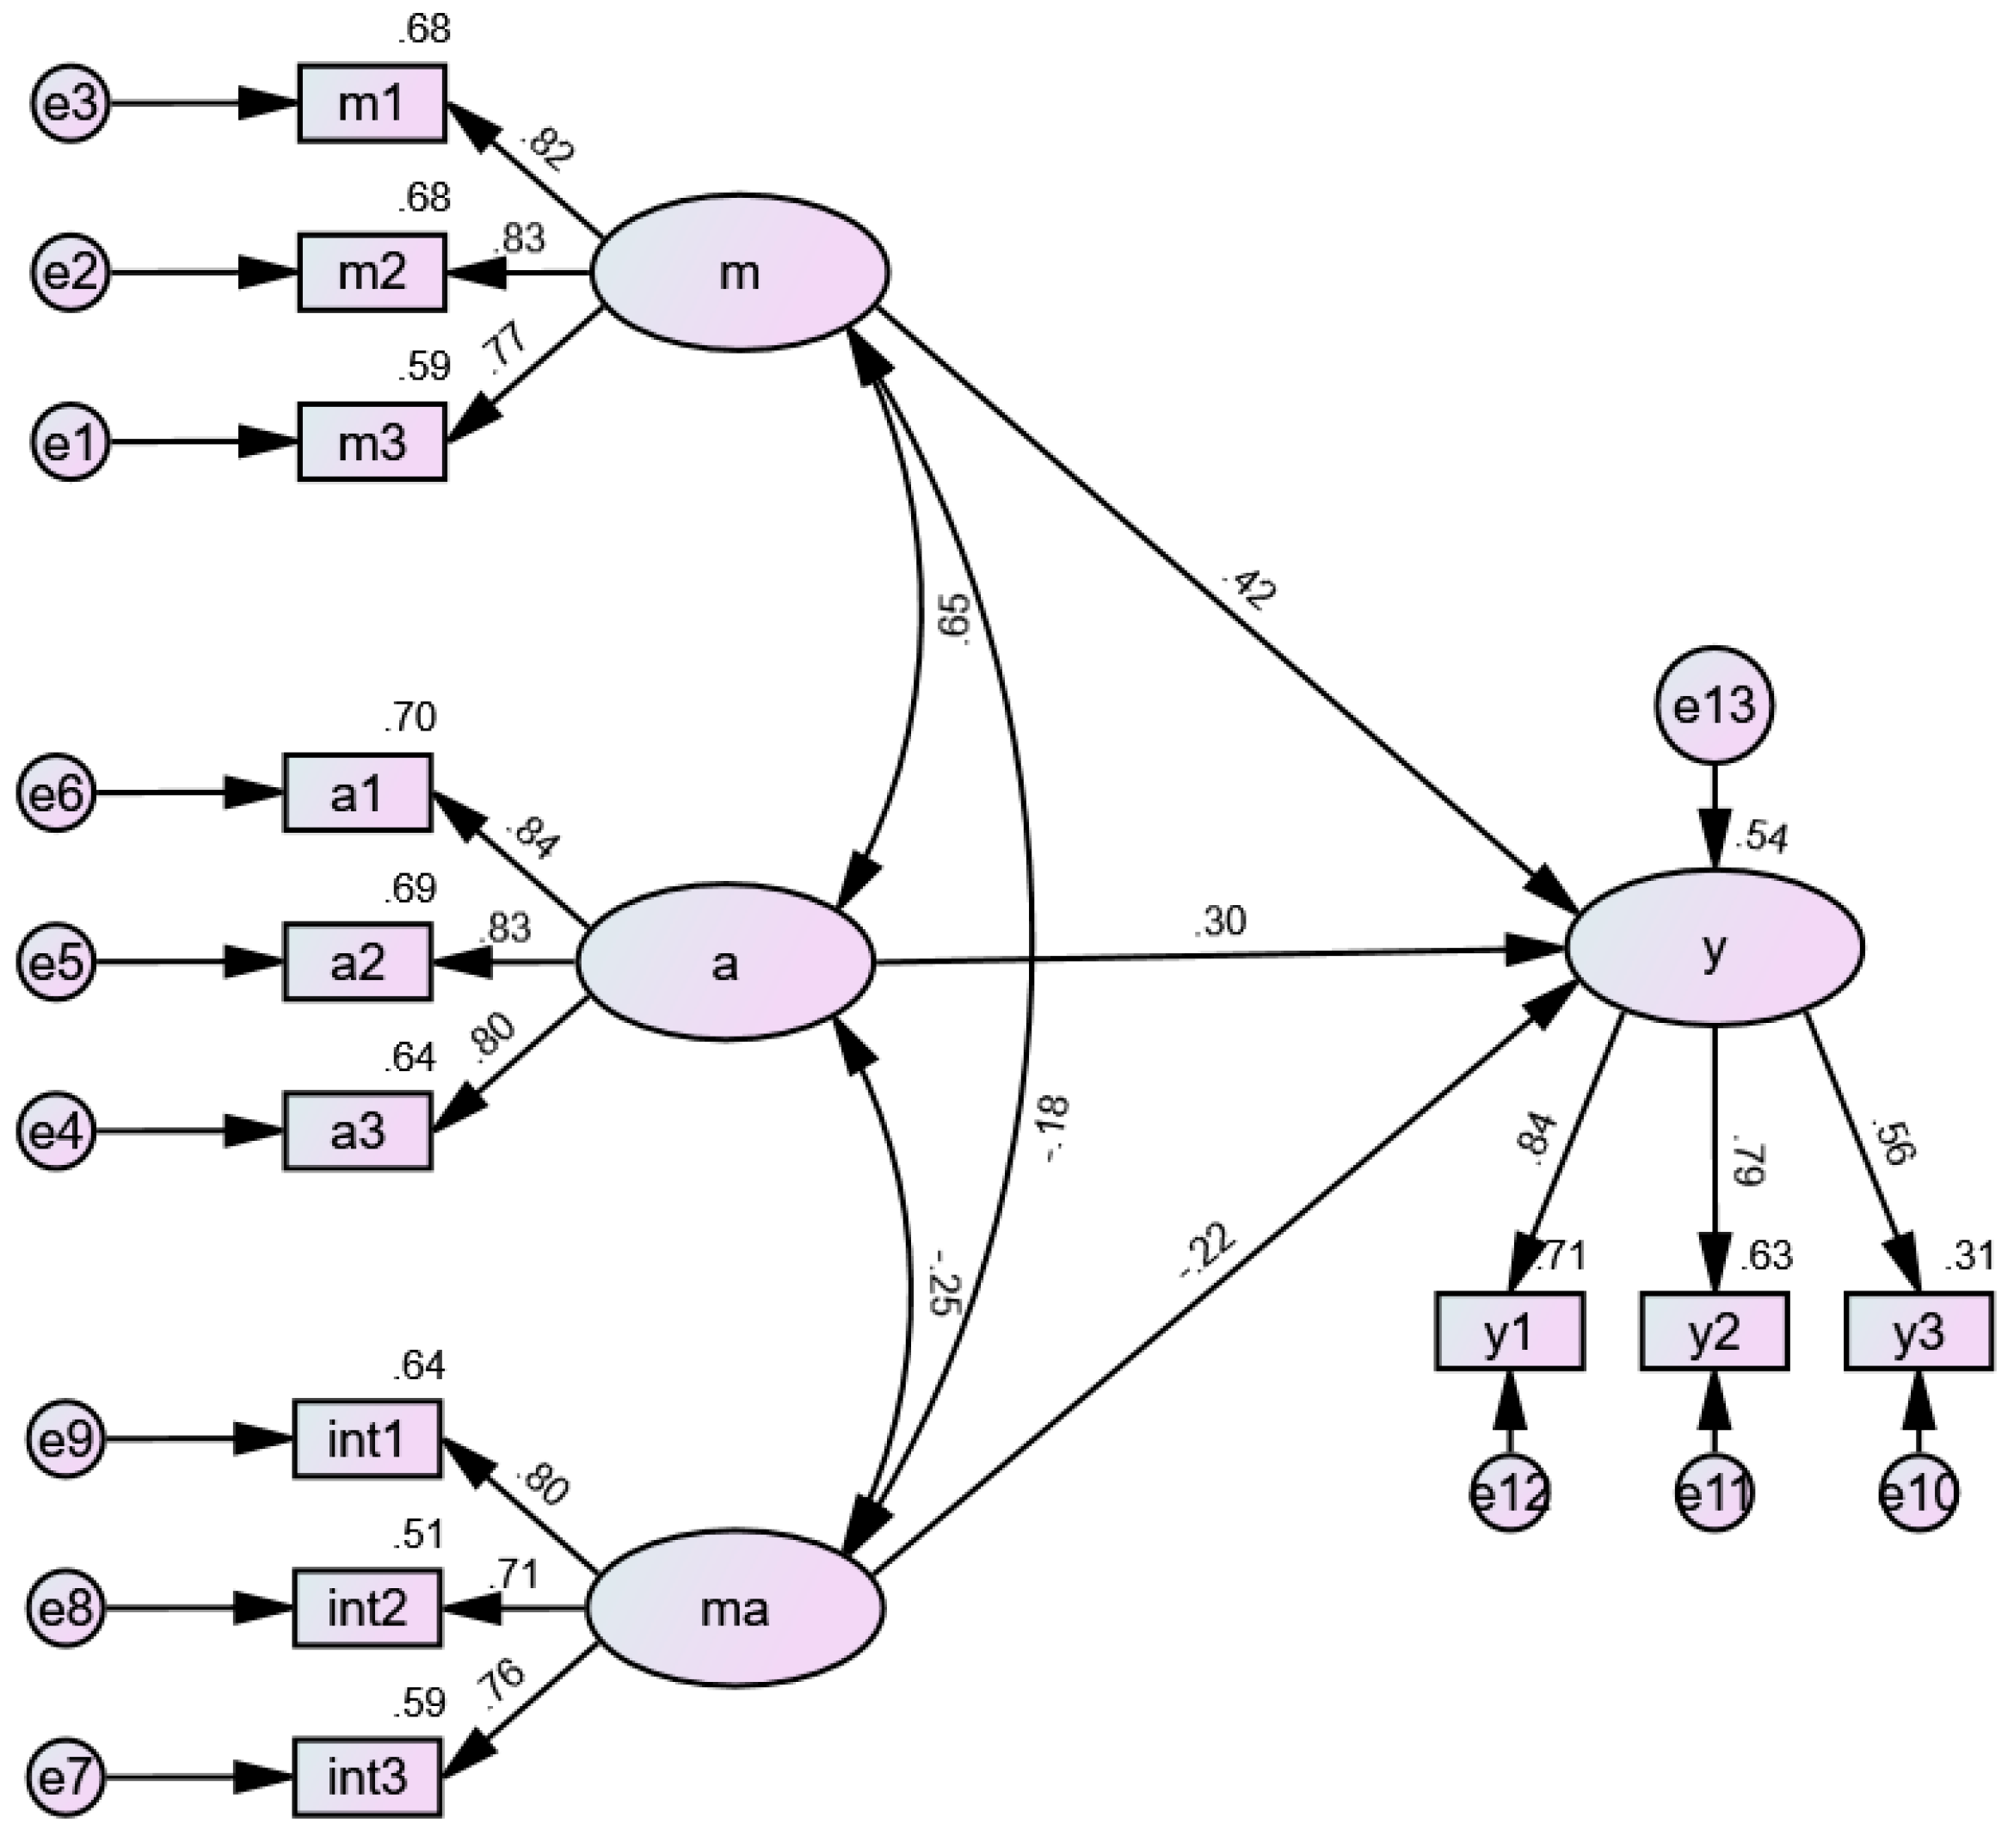
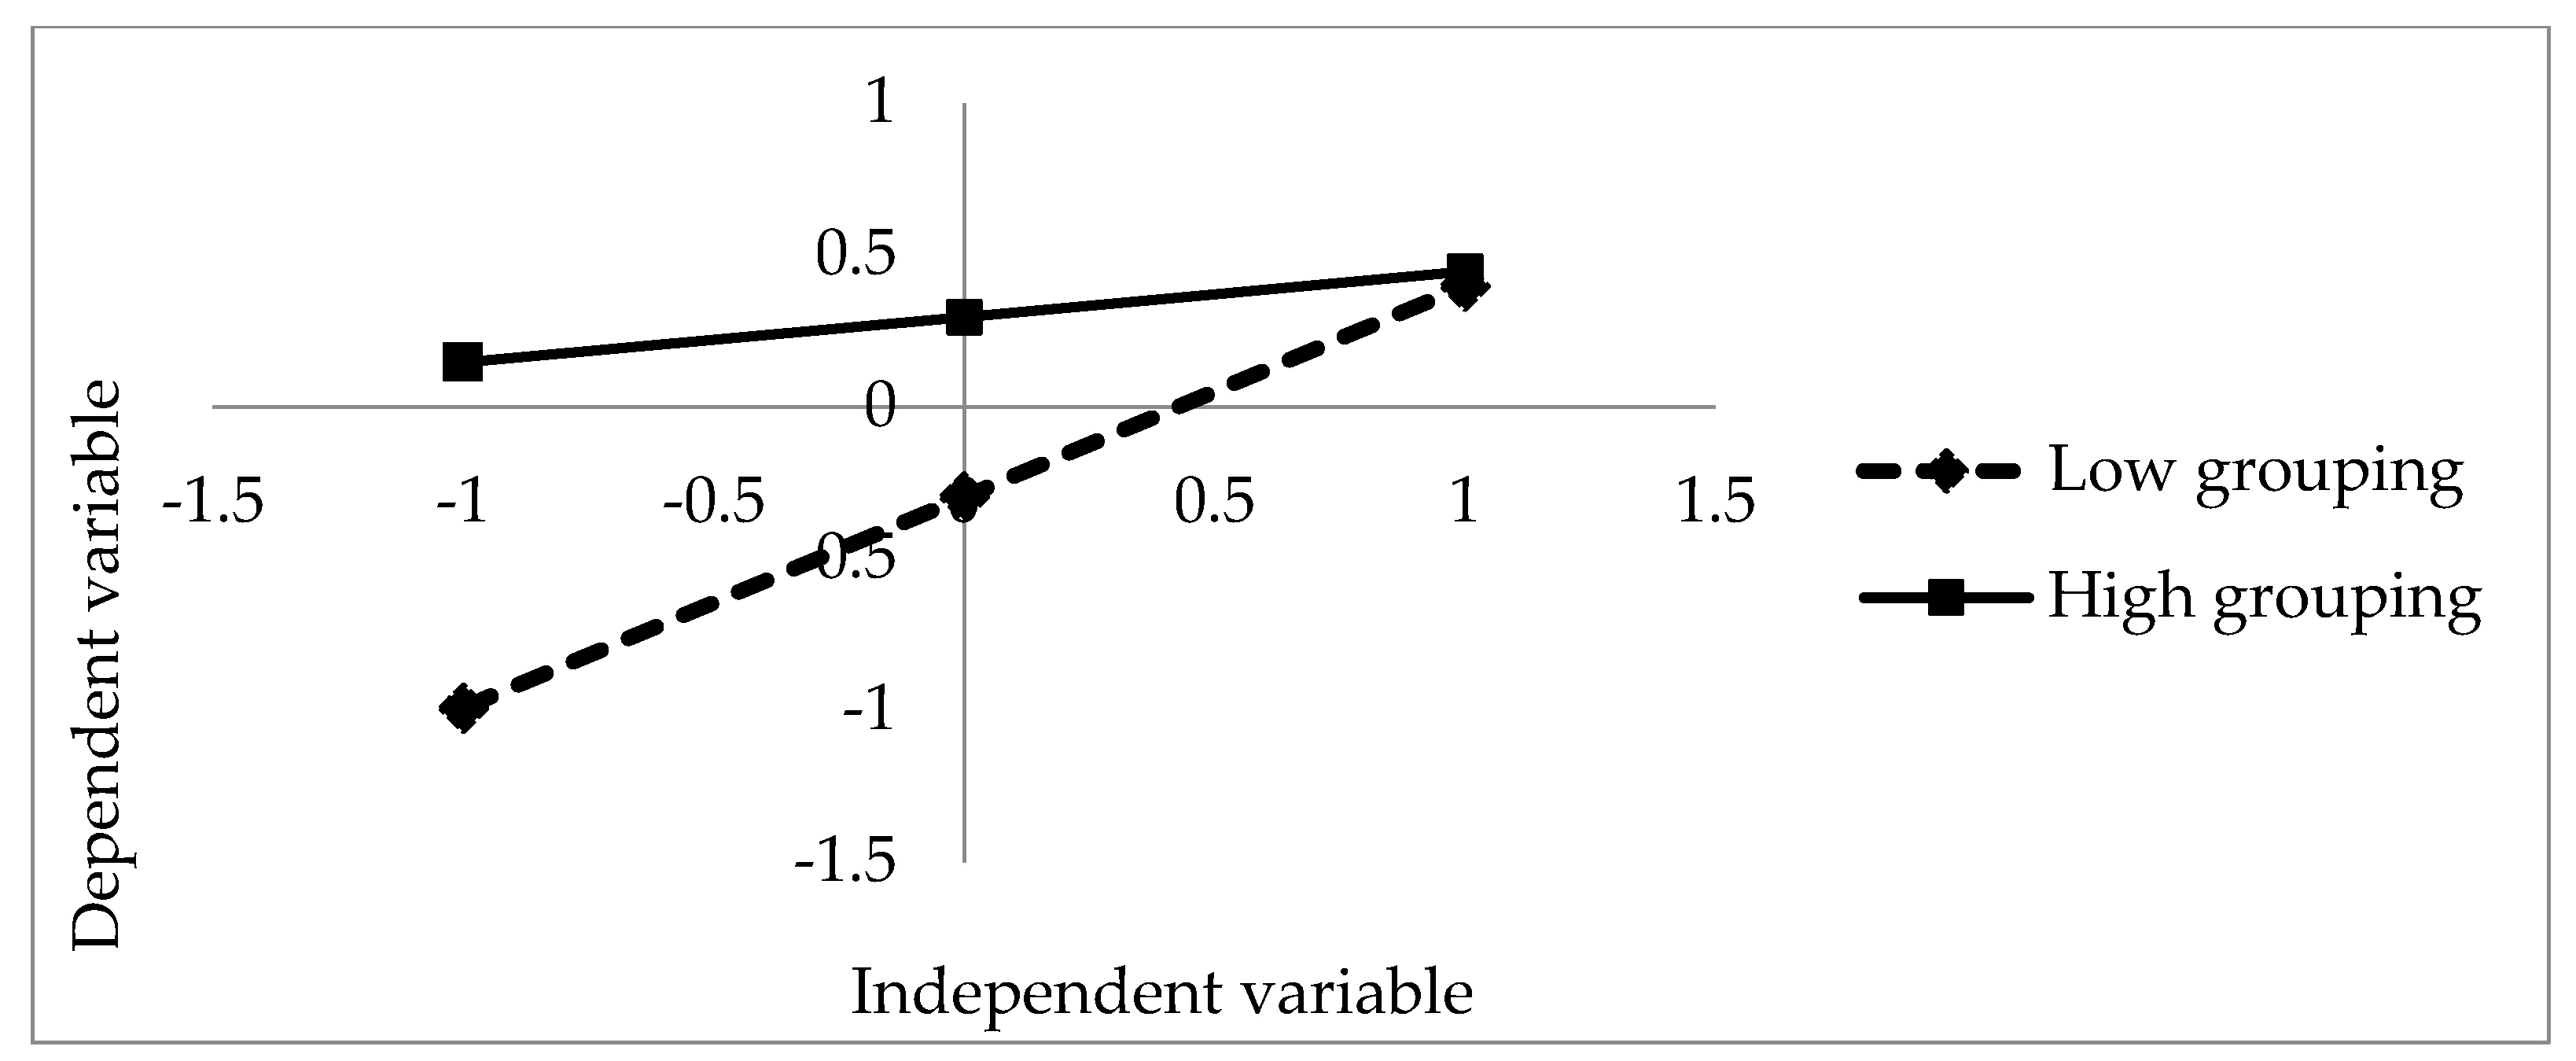
3.4. Comparing Results of Moderating Models

Aside from the direct impact of crop insurance motivation, opportunity, and ability on willingness to embrace EFAT, relevant research has demonstrated that the combination of variables can have a significant impact on behavior [36,37,38]. We argue that the motivation of crop insurance will be regulated by opportunity and ability. When crop insurance is conducive to creating opportunities for farmers or improving their ability to resist risk and developing the skill of technology application, the influence of the motivation of crop insurance on farmers’ willingness to adopt technology will be strengthened.
In order to verify the moderating effects of opportunity and ability of crop insurance on motivation, models are built for the moderating the effects of opportunity and capacity on motivation, respectively, utilizing the approach described by Kenny and Judd [39], that is, the cross-product term of variables. Specifically, model 1 and 2 of the moderating structural equations are built by motivation as the independent variable, adoption willingness as the dependent variable, and opportunity and ability of crop insurance as the moderating variables. Model 1 results of the moderating effect of opportunity on motivation are illustrated in Figure 2 and Table 8. It should be noted that residual terms in Figure 2, like e3, e8, e2, e4, are different from these terms of the unmoderated model in Figure 1; they denote the residuals of different factors.
As shown in Figure 2 and Table 8, both motivation and opportunity have a significant positive effect on adoption willingness, confirming the results in Figure 1. Nevertheless, the interaction term (mo) of motivation and opportunity has a standard coefficient of −0.047, which is not significant at the 0.1 confidence level. This finding demonstrates that the opportunity has no substantial influence on motivation to employ EFAT, which is also connected to the limited planting of the questioned farmers.
The moderating structural equation model 2 was established using motivation as the independent variable and ability as the moderating variable; the results are displayed in Figure 3 and Table 9. Similarly, it should be noted that the residual terms in Figure 3 are different from these terms in Figure 1 and Figure 2. Both motivation and ability have a significant positive effect on adoption willingness. The interaction term between motivation and ability, on the other hand, has a coefficient of −0.273, which is significant at 1%. This result suggests that the direction of capability regulation on motivation is reversed. In other words, the positive effect of motivation on farmers’ adoption of technology is weakened with the increase of capability terms in the insurance contract.
To demonstrate the inverse moderating impact of ability on motivation in a more visual way, consider Figure 4. The blue dashed line represents the relationship between the motivation and the group where crop insurance has a weaker effect on technological adoption capacity of farmers, and the red dashed line represents the relationship between the motivation and the group where crop insurance has a greater effect on technological adoption capacity. If there is no interaction effect, the two lines will usually create a parallel trend, but if there is, the two lines will form an intersecting trend. According to Figure 4, the two lines have a distinct crossing trend, showing a substantial interaction effect.
As shown in Figure 4, the dotted line has a higher slope than the solid line, demonstrating that, while crop insurance has a smaller effect on the technological application ability of farmers, motivation has a greater impact on adoption willingness, and, if crop insurance has a greater effect on the technological application ability, the influence of motivation on the willingness is lower. As a result, the high grouping may reduce the impact of motivation on technological adoption. The fundamental reason for this result is that the more visible the effect of crop insurance on technological capacity is, the more complex and difficult the technology becomes, so farmers are vehemently opposed to the sophisticated technology, and crop insurance is unable to successfully advocate its adoption.

4. Discussion

According to this study, farmers desire to embrace EFAT can be increased by the loss compensation function of crop insurance, owing to the risk aversion of them, which is a key issue that makes it difficult to successfully promote the technology. Risk-averse farmers are hesitant to adopt technology because of the danger of yield loss and price risk that comes with it, but crop insurance may effectively distribute this risk and preserve farmers income, increasing their desire to do so. Brick and Visser [40] used a series of laboratory experiments in a South African setting to examine whether the provision of a framed crop insurance product induces individuals to opt into riskier but potentially more profitable activities. They found that crop insurance can indeed improve farmers attitudes towards the adoption of new technologies; however, it does not completely remove production and consumption risk but rather reduces or minimizes the risk. Thus, in order to overcome risk aversion among farms and to facilitate the uptake of insurance products, basis risk and residual production risk not accounted for by the insurance product need to be targeted.
In terms of lowering the danger of technology misuse, the more technically competent farmers are, the more likely they are to lessen various uncertainties in their technology adoption processes [41]. On the one hand, Chinese farmers can self teach EFAT application skills through internet channels but more critically, organized skill training is required. After engaging in agricultural insurance, we propose that technical training services may improve farmers’ comprehension of technology, minimize inappropriate technology application, and lower the risk of technology adoption. In similar research, Manimozhi [42] found that agricultural technology training may assist farmers in adopting environmentally friendly agricultural methods, which helps to secure food security and the establishment of a healthy lifestyle. It is also worth noting that technical extension agents and farmer groups can have an impact on farmers’ adoption of water-saving irrigation systems [43].
Farmers are also concerned about the expense of adopting EFAT. The Chinese government has introduced a number of incentives to encourage farmers to use green technology, including low-interest loans and premium rebates for farmers who are insured. Abate et al. [44] found that increased government support to rural financial institutions contributed to farmers adopting EFAT. After learning about crop insurance in the United States, Zulauf et al. [45] believe that crop insurance premium subsidies will assist farmers to reduce risk, boost agricultural production inputs, and raise the likelihood of greater yields and incomes. However, owing to limited per capita arable land area and low demand for loans due to traditional beliefs, the combination of crop insurance and credit has little influence on Chinese farmers adopting EFAT.

5. Conclusions

The construction of resource-saving and environment-friendly agricultural production methods is an objective requirement in the stage of comprehensive rural revitalization in China, and the adoption of EFAT is essential for achieving ecological agriculture. With the MOA model, this research explored the impact of crop insurance on desire to embrace technology from three aspects, motivation, opportunity, and ability, and further examined the moderating effects of opportunity and ability on the motivation. Finally, we arrived at three conclusions and made the following recommendations.
(1)
Crop insurance can promote technology adoption through three paths: motivation, opportunity, and ability, among which motivation has the strongest effect on the adoption. In other words, farmers will be more eager to adopt technology if crop insurance is structured to incentivize them by offering price insurance, yield insurance, and honor incentives.
(2)
Crop insurance may boost desire through boosting skills, including catastrophe prevention and mitigation, as well as technological application assistance, but the moderating impact reveals that, as the role of ability develops, the beneficial effect of crop insurance motivation on readiness to use technology declines.
(3)
The opportunity of crop insurance has the weakest effect on farmers, probably because the farmers in the sample are small-scale and elderly; they are less eager to expand their production and have less clear demand for financing.
We propose the following to increase the inclination to adopt EFAT. On the one hand, in order to maximize the protection of production risks or market risks caused by the new technology, crop insurance must be developed with the risk of adopting EFAT as insurance obligations as soon as feasible; the government should actively encourage citizens to adjust their dietary behaviors to include more pollution-free foods and provide information services for farmers to connect to the market at the beginning of the promotion of technologies. On the other hand, insurance firms and agricultural technology departments can collaborate to promote certain basic technology and technical training for insured farmers while ensuring the production time of them.
This paper only performed a questionnaire survey on vegetable producers in select parts of Shandong Province due to time and capacity constraints. Despite the fact that the questionnaire survey followed the research content and model standards to the letter, the survey of vegetable producers in Shandong Province may not fully describe the willingness of vegetable growers throughout China. Thus, the generalizability of the research findings needs further verification. On the one hand, researchers can broaden the scope of the study and increase the sample size. Large-scale planting, on the other hand, is the future development direction of China’s agriculture. Small-scale and large-scale producers can be separated in future studies to further examine the influence of planting scale on technology uptake.

Author Contributions

Conceptualization, Y.L.; methodology, Y.L. and K.W.; software, Y.L.; validation, T.W. and K.W.; formal analysis, T.W. and K.W.; investigation, Y.L., T.W. and K.W.; resources, K.W. and Q.Z.; data curation, Y.L. and T.W.; writing—original draft preparation, T.W. and Y.L.; writing—review and editing, T.W. and Y.L.; visualization, T.W. and Y.L.; supervision, K.W.; project administration, K.W. and Q.Z.; funding acquisition, K.W. All authors have read and agreed to the published version of the manuscript.

Funding

This work was funded by the Program of National Natural Science Foundation of China, 72073132.

Institutional Review Board Statement

This research is not human or animal research, and no sensitive data was obtained or used. Therefore, it is not necessary to specify an Institutional Review Board Statement.

Informed Consent Statement

Informed consent was obtained from all respondents interviewed in the study.

Data Availability Statement

The data in this article is based on field visits. Further information and questionnaires are available from the authors upon reasonable request.

Acknowledgments

The authors would like to thank the Chinese Academy of Agricultural Science for providing support to conduct this research. Furthermore, we would like to thank our colleagues at the Agricultural Information Institute for their support in data collection and field visits for the preparation of this manuscript.

Conflicts of Interest

The authors declare no conflict of interest.

References

  1. He, K.; Zhang, J.; Zeng, Y.; Zhang, L. Households’ willingness to accept compensation for agricultural waste recycling: Taking biogas production from livestock manure waste in Hubei, P.R. China as an example. J. Clean. Prod. 2016, 13, 410–420. [Google Scholar] [CrossRef]
  2. Gao, Y.; Niu, Z.; Yang, H.; Yu, L. Impact of green control techniques on family farms’ welfare. Ecol. Econ. 2019, 161, 91–99. [Google Scholar] [CrossRef]
  3. Gao, Y.; Zhang, X.; Lu, J.; Wu, L.; Yin, S. Adoption behavior of green control techniques by family farms in China: Evidence from 676 family farms in Huang-Huai-Hai Plain. Crop. Prot. 2017, 99, 76–84. [Google Scholar] [CrossRef]
  4. Feder, G.; Just, R.E.; Zilberman, D. Adoption of agricultural innovation in development countries—A Survey. Econ. Dev. Cult. Chang. 1985, 33, 255–298. [Google Scholar] [CrossRef] [Green Version]
  5. Lambrecht, I. Understanding the process of agricultural technology adoption: Mineral fertilizer in eastern DR Congo. World Dev. 2014, 59, 132–146. [Google Scholar] [CrossRef]
  6. Lybbert, T.J.; Sumner, D.A. Agricultural technology for climate change in developing countries: Policy options for innovation and technology diffusion. Food Policy 2012, 37, 114–123. [Google Scholar] [CrossRef]
  7. Mazzeo, R.S.; Tanaka, H. Exercise prescription for the elderly. Sports Med. 2001, 31, 809–818. [Google Scholar] [CrossRef] [PubMed]
  8. Bosek, M.; Grzegorzewski, B.; Kowalczyk, A.; Lubiński, I. Degradation of postural control system as a consequence of Parkinson’s disease and ageing. Neurosci. Lett. 2005, 376, 215–220. [Google Scholar] [CrossRef]
  9. Verhaeghen, P.; Salthouse, T.A. Meta-analyses of age-cognition relations in adulthood: Estimates of linear and nonlinear age effects and structural models. Psychol. Bull. 1997, 122, 231. [Google Scholar] [CrossRef]
  10. Binswanger, H.P. Attitudes toward risk: Experimental measurement in rural India. Am. J. Agric. Econ. 1980, 62, 395–407. [Google Scholar] [CrossRef] [Green Version]
  11. Kabir, M.H.; Rainins, R. Adoption and intensity of integrated pest management (IPM) vegetable farming in Bangladesh: An approach to sustainable agricultural development. Environ. Dev. Sustain. 2015, 17, 1413–1429. [Google Scholar] [CrossRef]
  12. Korir, J.K.; Affognon, H.; Ritho, C.N.; Ekesi, S. Grower adoption of an integrated pest management package for management of mango-infesting fruit flies (Diptera: Tephritidae) in Embu, Kenya. Int. J. Trop. Insect Sci. 2015, 35, 80–89. [Google Scholar] [CrossRef]
  13. Bonabana-Wabbi, J.; Taylor, D.B.A. Limited dependent variable analysis of integrated pest management adoption in Uganda. J. Agric. Sci. Tech. A 2012, 2, 1162. [Google Scholar]
  14. Abebaw, D.; Haile, M.G. The impact of cooperatives on agricultural technology adoption: Empirical evidence from Ethiopia. Food Policy 2013, 38, 82–91. [Google Scholar] [CrossRef]
  15. Kremer, K.S.; Carolan, M.; Gasteyer, S.; Tirmizi, S.N.; Korsching, P.F.; Peter, G.; Tong, P. Evolution of an agricultural innovation: The N-Trak soil nitrogen test adopt and discontinue, or reject? Technol. Soc. 2001, 23, 93–108. [Google Scholar] [CrossRef]
  16. Carter, M.R.; Cheng, L.; Sarris, A. Where and how index insurance can boost the adoption of improved agricultural technologies. J. Dev. Econ. 2016, 118, 59–71. [Google Scholar] [CrossRef]
  17. Ning, M.; Miao, Q.; Xing, L.; Zhong, F. An empirical analysis of farmers’ willingness to pay for agricultural insurance—Taking Manas river basin in Xinjiang as an example. Chin. Rural Econ. 2006, 6, 43–51. [Google Scholar]
  18. Zhang, Z.; Mu, Y.; Hou, L. Does participation in agricultural insurance optimize factor allocation? An analysis of endogenous farmers’ insurance decision-making and its effect on production. Chin. Rural Econ. 2018, 10, 53–70. [Google Scholar]
  19. Zhang, C.; Lv, K.; Cheng, X. Does agricultural insurance affect farmers’ application of pesticides? Empirical evidence from grain farmers in 4 provinces. J. China Agric. Univ. 2019, 24, 184–194. [Google Scholar]
  20. Li, Q.; Chen, K.; Chen, L. Impact of crop insurance participation behavior on rural households’ input tendency of chemical elements: A comparative study based on different policy recognition scenarios. J. Agric.-For. Econ. Manag. 2020, 19, 280–287. [Google Scholar]
  21. MacInnis, D.J.; Jaworski, B.J. Information processing from advertisements: Toward an integrative framework. J. Mark. 1989, 53, 1–23. [Google Scholar] [CrossRef]
  22. Gruen, T.W.; Osmonbekov, T.; Czaplewski, A.J. How e-communities extend the concept of exchange in marketing: An application of the motivation, opportunity, ability (MOA) theory. Mark. Theory 2005, 5, 33–49. [Google Scholar] [CrossRef]
  23. Siemsen, E.; Roth, A.V.; Balasubramanian, S. How motivation, opportunity, and ability drive knowledge sharing: The constraining factor model. J. Oper. Manag. 2008, 26, 426–445. [Google Scholar] [CrossRef]
  24. Radaelli, G.; Lettieri, E.; Mura, M.; Nicola, S. Knowledge sharing and innovative work behaviour in healthcare: A micro-level investigation of direct and indirect effects. Creat. Innov. Manag. 2014, 23, 400–414. [Google Scholar] [CrossRef]
  25. Bagozzi, R.P.; Dholakia, U. Goal setting and goal striving in consumer behavior. J. Mark. 1999, 63, 19–32. [Google Scholar] [CrossRef]
  26. Larsson, R.; Bowen, D.E. Organization and customer: Managing design and coordination of services. Acad. Manag. Rev. 1989, 14, 213–233. [Google Scholar] [CrossRef]
  27. Blazy, J.; Carpentier, A.; Thomas, A. The willingness to adopt agroecological innovations: Application of choice modelling to Caribbean banana planters. Ecol. Econ. 2011, 72, 140–150. [Google Scholar] [CrossRef]
  28. Bollen, K.A. Structural Equations with Latent Variables; John Wiley & Sons: NewYork, NY, USA, 1989; Volume 210. [Google Scholar]
  29. Boomsma, J.J.; Van der Lee, G.A.; Van der Have, T.M. On the production ecology of Lasius niger (Hymenoptera: Formicidae) in successive coastal dune valleys. J. Anim. Ecol. 1982, 75–991. [Google Scholar] [CrossRef]
  30. Hair, J.F. Multivariate Data Analysis with Readings, 5th ed.; Prentice Hall: Upper Saddle River, NJ, USA, 1998. [Google Scholar]
  31. Alexandra, V.; Grissom, V.R. Predicting CQ development in the context of experiential cross-cultural training: The role of social dominance orientation and the propensity to change stereotypes. Acad. Manag. Learn. Educ. 2018, 17, 62–78. [Google Scholar] [CrossRef] [Green Version]
  32. Baer, M.D.; Van Der Werff, L.; Colquitt, J.A. Trusting the “look and feel”: Situational normality, situational aesthetics, and the perceived trustworthiness of organizations. J. Acad. Manag. 2018, 61, 1718–1740. [Google Scholar] [CrossRef] [Green Version]
  33. Chen, A.; Karahanna, E. Life interrupted: The effects of technology-mediated work interruptions on work and nonwork outcomes. MIS Q. 2018, 42, 1023–1042. [Google Scholar]
  34. Bagozzi, R.P.; Yi, Y. On the evaluation of structural equation models. J. Acad. Mark. Sci. 1988, 16, 74–94. [Google Scholar] [CrossRef]
  35. Hu, L.T.; Bentler, P.M.; Kano, Y. Can test statistics in covariance structure analysis be trusted? Psychol. Bull. 1992, 112, 351–362. [Google Scholar] [CrossRef] [PubMed]
  36. Devellis, R.F. Scale Development Theory and Application; Applied Social Research Methods Series; Sage Publication: London, UK, 1991; pp. 1–133. [Google Scholar]
  37. Thøgersen, J. Understanding of consumer behaviors as a prerequisite for environmental protection. J. Consum. Policy 1995, 18, 345–385. [Google Scholar]
  38. MacInnis, D.J.; Moorman, C.; Jaworski, B.J. Enhancing and measuring consumers’ motivation, opportunity, and ability to process brand information from ads. J. Mark. 1991, 55, 32–53. [Google Scholar] [CrossRef]
  39. Kenny, D.; Judd, C.M. Estimating the nonlinear and interactive effects of latent variables. Psychol. Bull. 1984, 96, 201. [Google Scholar] [CrossRef]
  40. Brick, K.; Visser, M. Risk preferences, technology adoption and insurance uptake: A framed experiment. J. Econ. Behav. Organ. 2015, 118, 383–396. [Google Scholar] [CrossRef]
  41. Ghadim, A.K.A.; Pannell, D.J.; Burton, M.P. Risk, uncertainty and learning in adoption of a crop innovation. Agric. Econ. 2005, 33, 1–9. [Google Scholar] [CrossRef]
  42. Manimozhi, K.; Vaishnavi, N. Eco-friendly fertilizers for sustainable agriculture. Int. J. Sci. Res. 2012, 2, 255–257. [Google Scholar]
  43. Abdulai, A.; Owusu, V.; Bakang, J. Adoption of safer irrigation technologies and cropping patterns: Evidence from Southern Ghana. Ecol. Econ. 2011, 70, 1415–1423. [Google Scholar] [CrossRef] [Green Version]
  44. Abate, G.; Rashid, S.; Borzaga, C. Rural finance and agricultural technology adoption in Ethiopia: Does the institutional design of lending organizations matter? World Dev. 2016, 84, 235–253. [Google Scholar] [CrossRef] [Green Version]
  45. Zulauf, C.; Orden, D.U.S. Crop Insurance Since 1996; Department of Agricultural and Consumer Economics, University of Illinois at Urbana-Champaign: Urbana, IL, USA, 2015. [Google Scholar]
Figure 1. Pathways of crop insurance influence on willingness.
Sustainability 13 13843 g001
Figure 2. Regulated structural equation model 1.
Sustainability 13 13843 g002
Figure 3. Regulated structural equation model 2.
Sustainability 13 13843 g003
Figure 4. The interaction effect between ability and motivation.
Sustainability 13 13843 g004
Table 1. Questionnaire.
VariablesObserved VariablesOptions
Motivation m 1 Crop insurance provides me with a greater level of price protection.Totally Disagree = 1;
Disagree = 2;
Average = 3;
Agree = 4;
Strongly Agree = 5
m 2 Crop insurance provides me with a greater level of yield protection.
m 3 Elected as a model farmer and enjoy premium discounts.
Opportunity o 1 Crop insurance that stimulates technology usage is an excellent alternative.
o 2 Crop insurance can facilitate the loan financing.
o 3 Crop insurance can assist minimize the cost of adopting technology by providing a portion of premium subsidies.
Ability a 1 Crop insurance will provide technical guidance.
a 2 Crop insurance will help reduce losses when technical risks occur.
a 3 Disaster prevention services provided by crop insurance help strengthen risk response skills.
Willingness y 1 Willing to pay for crop insurance that promotes technology utilization
y 2 Recommend crop insurance that encourages the use of technology to some relatives.
y 3 Would like to take the time to understand and try to pay for crop insurance that encourages the adoption of technology.
Table 2. Characteristics of the sample.
VariableSortProportionVariableSortProportion
Age25 years old and younger1%Number of Labors15%
26~35 years old8%263%
36~45 years old21%312%
46~55 years old39%412%
56 years old and over31%58%
GenderMale79%HouseholderYes22%
Female21%No78%
EducationPrimary school and lower21%Area0.16–0.8 acre 56%
Junior high school58%0.96–1.6 acre31%
High school19%1.76–2.4 acre2%
Undergraduate2%More than 2.4 acre11%
Household income (RMB)Less than 20 thousand2%Income from vegetable (RMB)Less than 10 thousand6%
20~40 thousand16%10~20 thousand6%
40~60 thousand18%20~30 thousand13%
60~80 thousand21%30~40 thousand11%
More than 80 thousand42%More than 40 thousand64%
Farming Years1~5 years10%Distance from the county (Km)0~1011%
6~15 years 39%10~2051%
16~30 years 43%20~3031%
More than 30 years 8%30~404%
More than 403%
Note: RMB is an abbreviation for Chinese currency. 1 USD = 6.4 RMB.
Table 3. Fitting coefficients.
Fitting Index χ 2 / df RMSEACFIIFITLI
Fitted Value1.7020.0540.9770.9770.966
Standard<3<0.08>0.9>0.9>0.9
Fitment QualityYesYesYesYesYes
Table 4. Test of combination reliability and convergent validity.
Observed VariablesEstimateAVECR
y30.5620.550.78
y20.794
y10.837
m30.7680.650.85
m20.829
m10.817
o30.7110.510.51
o20.778
o10.726
a30.8010.680.86
a20.829
a10.838
Table 5. Test of discriminant validity.
moay
m0.648
o0.3450.506
a0.4860.3230.677
y0.3390.2310.3320.549
Evolution of AVE0.8050.7110.8230.741
Table 6. Fitting index.
IndexStandardFitted ValueFitment Quality
Absolute Index χ 2 /df<31.901Yes
GFI>0.90.944Yes
RMSEA<0.080.061Yes
NFI>0.90.938Yes
IFI>0.90.97Yes
Relative IndexTLI>0.90.956Yes
CFI>0.90.969Yes
Information IndexPNFI>0.50.654Yes
PCFI>0.60.676Yes
Note: GFI stands for goodness of fit index; RMSEA stands for root mean square of error approximation; NFI stands for normative fit index; IFI stands for incremental fit index; TLI stands for Tucker-Lewis index; CFI stands for comparative fit index.
Table 7. Model results.
PathNon-Standard CoefficientStandard CoefficientStandard ErrorTest Statistics
MotivationWillingness0.2660.380 ***0.0713.755
OpportunityWillingness0.1120.143 *0.0641.758
AbilityWillingness0.2160.315 ***0.0663.297
Note: *** indicates significant correlation when the confidence level is 0.01, ** means significant correlation when the confidence level is 0.05, * means significant correlation when the confidence level is 0.1.
Table 8. Coefficients for model 1 of the regulated structure equation.
PathNon-Standard CoefficientStandard CoefficientStandard ErrorTest Statistics
MotivationWillingness0.3790.545 ***0.0705.390
OpportunityWillingness0.1470.197 **0.0662.240
Interaction (mo)Willingness−0.048−0.0470.084−0.567
Note: *** indicates significant correlation when the confidence level is 0.01, ** means significant correlation when the confidence level is 0.05, * means significant correlation when the confidence level is 0.1.
Table 9. Coefficients for model 2 of the regulated structural equation.
PathNon-Standard CoefficientStandard CoefficientStandard ErrorTest Statistics
MotivationWillingness0.2990.422 ***0.074.254
AbilityWillingness0.2030.296 ***0.0653.11
Interaction (ma)Willingness−0.119−0.273 **0.037−3.189
Note: *** indicates significant correlation when the confidence level is 0.01, ** means significant correlation when the confidence level is 0.05, * means significant correlation when the confidence level is 0.1.
Publisher’s Note: MDPI stays neutral with regard to jurisdictional claims in published maps and institutional affiliations.

