Article

Does the Agglomeration of Producer Services and the Market Entry of Enterprises Promote Carbon Reduction? An Empirical Analysis of the Yangtze River Economic Belt

1
School of Economics and Management, China University of Geosciences, 388 Lumo Road, Wuhan 430074, China
2
Hubei Institutes of Soft Science on Regional Innovation Capacity Monitoring and Analysis, Wuhan 430074, China
*
Author to whom correspondence should be addressed.
Sustainability 2021, 13(24), 13821; https://doi.org/10.3390/su132413821
Submission received: 9 November 2021 / Revised: 9 December 2021 / Accepted: 10 December 2021 / Published: 14 December 2021
(This article belongs to the Topic Climate Change and Environmental Sustainability)

Abstract

:
As the world’s largest carbon emitter, China has been committed to carbon emission reduction and green development. Under the goal of “double carbon”, adjusting the industrial structure and promoting the development of producer services are regarded as effective emission reduction paths. In this paper, from the perspective of market entry of enterprises, we firstly investigate the transmission mechanism between market entry of enterprises and industrial agglomeration and summarize the carbon emission reduction mechanism of producer services. Based on the panel data of 110 prefecture-level cities in China’s Yangtze River Economic Belt (YREB) from 2003 to 2017, we analyze the impact of producer services on carbon emission reduction by using the dynamic spatial panel model. The empirical results show that China’s urban carbon dioxide emissions have noticeable spatial spillover effects and high emission club clustering characteristics and exhibit a noticeable snowball effect and leakage effect in time and space dimensions. The development of the producer services can effectively reduce carbon emission levels, effectively solving the dilemma of “stabilizing growth and promoting emission reduction”. Furthermore, there is an apparent synergistic effect between enterprises’ market entry and industrial agglomeration. The agglomeration of producer services can effectively promote the entry of innovative new enterprises, thus increasing the carbon emission reduction effect. However, due to resource mismatch and isomorphic development, this carbon emission reduction effect has apparent industrial heterogeneity and regional heterogeneity. Finally, this paper makes suggestions for optimizing regional industrial structure, strengthening inter-regional linkage cooperation, and promoting the advanced development of the producer services.

1. Introduction

Since its reform and opening up, China has made remarkable achievements in economic development, and its international influence has increased, with it playing an increasingly important role in the global economy [1,2]. However, in conjunction to this, the high consumption of fossil energy has led to a parallel increase in CO2 emissions as China’s economy grows. As the world’s largest developing country and the largest carbon emitter, China has been committed to pursuing a green and sustainable development path while meeting its development needs and actively assuming its responsibility to reduce emissions. At the UN General Assembly in September 2020, China proposed the goals of “peak carbon” and “carbon neutral”.
As China’s most significant economic belt (Figure 1), the Yangtze River Economic Belt (YREB) occupies 21.4% of China’s geographical area and accounts for more than 40% of the population, GDP, and carbon emissions. The YREB is one of China’s three major strategies, the inland economic belt with global influence and the strongest and most active economic growth belt. As the first demonstration belt for constructing ecological civilization in China, the YREB has ecological advantages and a strong economic foundation. In the 14th Five-Year Period, it is significant for the YREB to take the lead in achieving regional “carbon peaking” and “carbon neutrality” and build a green development demonstration zone.
At present, China’s economic structure is service-oriented, and the carbon reduction role of the service industry has become a focus of governments and scholars in recent years. With the discovery of the relationship between the environment and economic structure by Crossman and Krueger [3], Panayotou further summarized the environmental Kuznets curve (EKC) [4], which has drawn the attention of scholars to the economic structure transformation and green industry development. Based on this, Adom et al. started their research on the impact of industrial structure transformation on carbon emissions. They analyzed the relationship between industrial structure and the emissions [5,6], and Lin and Du later constructed the framework of the impact of industrial structure factors on emissions [7]. With the depth of research, Zhang and Wang have further explored the path and mechanism of industrial structure adjustment to achieve carbon emission reduction. It was found that industrial structure adjustment, vigorously developing tertiary and high-tech industries, and reducing the reliance on the growth path of “factor inputs” are effective ways to reduce carbon emissions [8,9]. In the transition process, the role of producer service industries is becoming increasingly prominent. While developing traditional industries, China’s producer service sector is developing rapidly and showing great potential, able to enhance the position of Chinese cities among the world’s cities [10]. Producer services generally refer to sectors or industries that provide services to producers as intermediate inputs [11,12]. It has been pointed out that producer service industries have a more substantial agglomeration effect and technology intensity than industry and are characterized by knowledge intensity, low pollution, low consumption, high output, and high employment [13]. Some studies have explored the carbon emission reduction effect of producer service industries from the perspective of agglomeration, showing that the agglomeration of producer service industries can not only improve the regional energy consumption efficiency [14], but also reduce energy consumption through synergistic copolymerization with manufacturing industries, thus reducing the carbon emission level [15]. In addition, due to the producer service industry’s industrial characteristics, it can reduce carbon emissions through industrial agglomeration and thus promote industrial structure upgrading, accelerate the diffusion of innovative knowledge, and advance green technology research and development. However, Han found in his study that there is significant regional heterogeneity and industrial heterogeneity in this promotion effect [16].
It is noteworthy that the current discussion on the impact of carbon emissions is mainly focused on the macro impact, and not enough attention is paid to its micro-level impact and transmission mechanism. It is well known that both industrial restructuring and industrial agglomeration will affect the macro performance of the system by influencing the micro decision-making behavior of enterprises. Therefore, the regional enterprise entry dynamics reflect the effectiveness of government policy adjustment to a certain extent and reflect the latest industrial location pattern changes in the region. Analyzed from the perspective of new economic geography, the market entry behavior of micro-firms provides scholars with a new perspective to study the spatial distribution and changes in regional industrial activities [17]. It has been found that agglomeration economies and government policies have a non-negligible influence on firm entry [18,19,20,21,22]. Jofre-Monseny studied the effects of agglomeration economies, labor markets, and knowledge spillovers on firm location choices [23]. Hao incorporated the dynamic process of firm entry into agglomeration indicators and studied the synergistic effects of urban productivity under dynamic agglomeration [24]. Guo explored the impact of agglomeration on firm entry dynamics from the perspective of agglomeration [25]. Shao explored how industrial spatial agglomeration effects macroeconomics by influencing enterprise market entry through sorting out the preference model of firm entry dynamics selection and using enterprise market entry as an intermediate transmission mechanism [26]. It can be seen that external shocks influence firm entry dynamics, from industrial restructuring and government policy changes on the one hand, and the agglomeration economy on the preference of the firm’s decision side on the other hand. As an essential part of economic restructuring and the development of producer service industries, the entry of new enterprises in the industry can, to a certain extent, directly reflect the effectiveness of industrial policy adjustment.
By combing through the relevant literature, we make contributions to this area of research in the following aspects. Firstly, the current understanding of industrial agglomeration often stays at the level of “stock” of enterprises, and the description of the agglomeration effect is usually based on the non-linear characteristics of the agglomeration itself. In this paper, we construct dynamic composite agglomeration indicators to reflect the dynamic agglomeration process of industries by using the “incremental” data of new enterprises’ entry. This helps to extend further the theory of carbon emission reduction in the producer service industry. Secondly, most of the studies on the carbon emission reduction effect of producer service industries are in the form of empirical summaries or statistical descriptions, or discuss the carbon emission reduction effect from a macroscopic perspective, without adequate evidence at the microscopic level. Here, we introduce the examination of market entry behavior of micro-enterprises into the analysis framework of carbon emissions based on the theory of agglomeration economy and new economic geography, and explore the effect of the producer service industry on carbon emissions from the perspective of micro-enterprises. This is helpful for China to optimize its industrial structure, deploy market development orientation, reasonably formulate the 14th Five-Year Plan, and achieve carbon emission reduction targets. Finally, considering the influence of heterogeneity, this study discusses industry and regional heterogeneity separately using the spatial dynamic panel technique. This helps policymakers to formulate effective policies based on local realities and resource endowments.
The rest of this paper is organized as follows: Section 2 presents the theoretical mechanism and research hypothesis; Section 3 describes the model construction and indicator data; Section 4 focuses on the analysis of the empirical results to verify the carbon reduction effect of the producer service; Section 5 is the discussion; and Section 6 summarizes the conclusions and provides policy recommendations.

2. Theoretical Mechanism and Research Hypothesis

Based on the new economic geography theory, Marshall points out that the agglomeration of industries in a region can bring positive externalities, and the centralized distribution of industries and specialized division of labor help enterprises reduce costs and develop collaboratively [27]. As an essential part of the tertiary industry, the producer service industry is closely related to manufacturing production and runs through all aspects of enterprise production. On the one hand, with the increase in new enterprises in the regional producer service industry, spatial agglomeration will gradually take shape and the scale effect of industrial agglomeration will gradually be highlighted. It is easier for enterprises of the same type to form a perfectly competitive market, and through information sharing, reduce transaction costs, improve the efficiency of industrial development, control energy consumption, and achieve carbon emission reduction [28]. On the other hand, through the integration of manufacturing and producer services, the advantages of specialization and scale economy can be better exploited [15,29]. With the market’s refinement of the division of labor and specialization of services, the manufacturing industry outsources intermediate service links to the more specialized producer service industry enterprises. The producer service industry can reduce resource consumption and waste generation due to its high specialization and high technology, make the manufacturing industry more focused on its core business, improve energy use efficiency, and reduce carbon emissions [30]. Based on this, it can be hypothesized that:
Hypothesis 1 (H1).
The agglomeration development of the producer service industry could contribute to the economy of scale effect of service products, reduce production and transaction costs, and hence reduce carbon emissions.
In addition to this, firm entry occurs throughout the evolution of industrial agglomeration. As the agglomeration trend strengthens, through a circular and cumulative mechanism of action, the agglomeration environment influences new enterprise entry selection preferences, attracting more innovative enterprises to the market [28]. Compared with incumbent firms, new firms have stronger innovative ideas, innovation efficiency, and employment accommodation [31,32,33]. The entry of new enterprises brings more innovative power [34]. These producer service enterprises embed advanced production technologies and cutting-edge innovative ideas in the form of intermediate goods in the production and manufacturing process to promote technological innovation and competition as well as improve energy utilization and pollution control, and thus achieve carbon emission reduction effects. The entry of new enterprises frequently involves the replacement of incumbent enterprises [35]. Hopenhay constructed a basic model of the impact of enterprise entry and exit on total factor productivity, which is widely used in the fields of industrial organization and economy [36]. As new enterprises enter the market, competition forces inefficient enterprises to exit the market, generating an inter-firm resource allocation effect that affects total factor productivity and total output. In addition, as a knowledge-intensive and technology-intensive industry, the producer service industry brings together a high number of professional and technical talents and innovative companies. It can provide a positive environment for collective learning and innovation, generating new ideas and concepts [37]. Additionally, it can improve the level of technological progress and labor productivity of enterprises to reduce carbon emissions [38]. Therefore, the following hypothesis is proposed:
Hypothesis 2 (H2).
The entry of new enterprises can increase total factor productivity and thus reduce carbon emissions.
The development of the producer service industry has always been an essential element of industrial restructuring, and the optimization of industrial structure is crucial to reduce carbon intensity [7,39]. China’s economic development model has been dominated by investment and over-reliance on factor inputs. This has led to China’s economic growth accompanied by “high pollution and high energy consumption”. The producer service industry is a modern service industry with low pollution, high value added, and high employment characteristics, with great potential for carbon emission reduction. Developed producer services can also enhance the region’s position in the global divisions of labor [40]. Through deeper integration and more profound division of labor, it can reduce the production cost of the manufacturing industry, promote the production chain to the direction of low pollution and high value added [41,42], and improve the scale of the regional economy. Furthermore, promoting the development of the producer service industry and guiding market subjects to participate in its development can reasonably optimize the allocation of resources and effectively improve the industrial structure. It can improve the traditional production methods and energy consumption structure, reduce the proportion of heavy pollution industries, reduce the rigid demand for energy in production, and control energy consumption. Accordingly, the following hypothesis can be formulated:
Hypothesis 3 (H3).
The development of producer services is beneficial to optimizing industrial structure, enhancing the industrial value chain, and the realization of carbon emission reduction.
As shown in Figure 2, we summarize the theoretical analysis framework diagram based on the above analysis. The producer service industry can achieve carbon emission reduction through industrial structure optimization, industrial value chain climbing, and economies of scale.

3. Research Method and Data

3.1. Empirical Method

3.1.1. STIRPAT Model
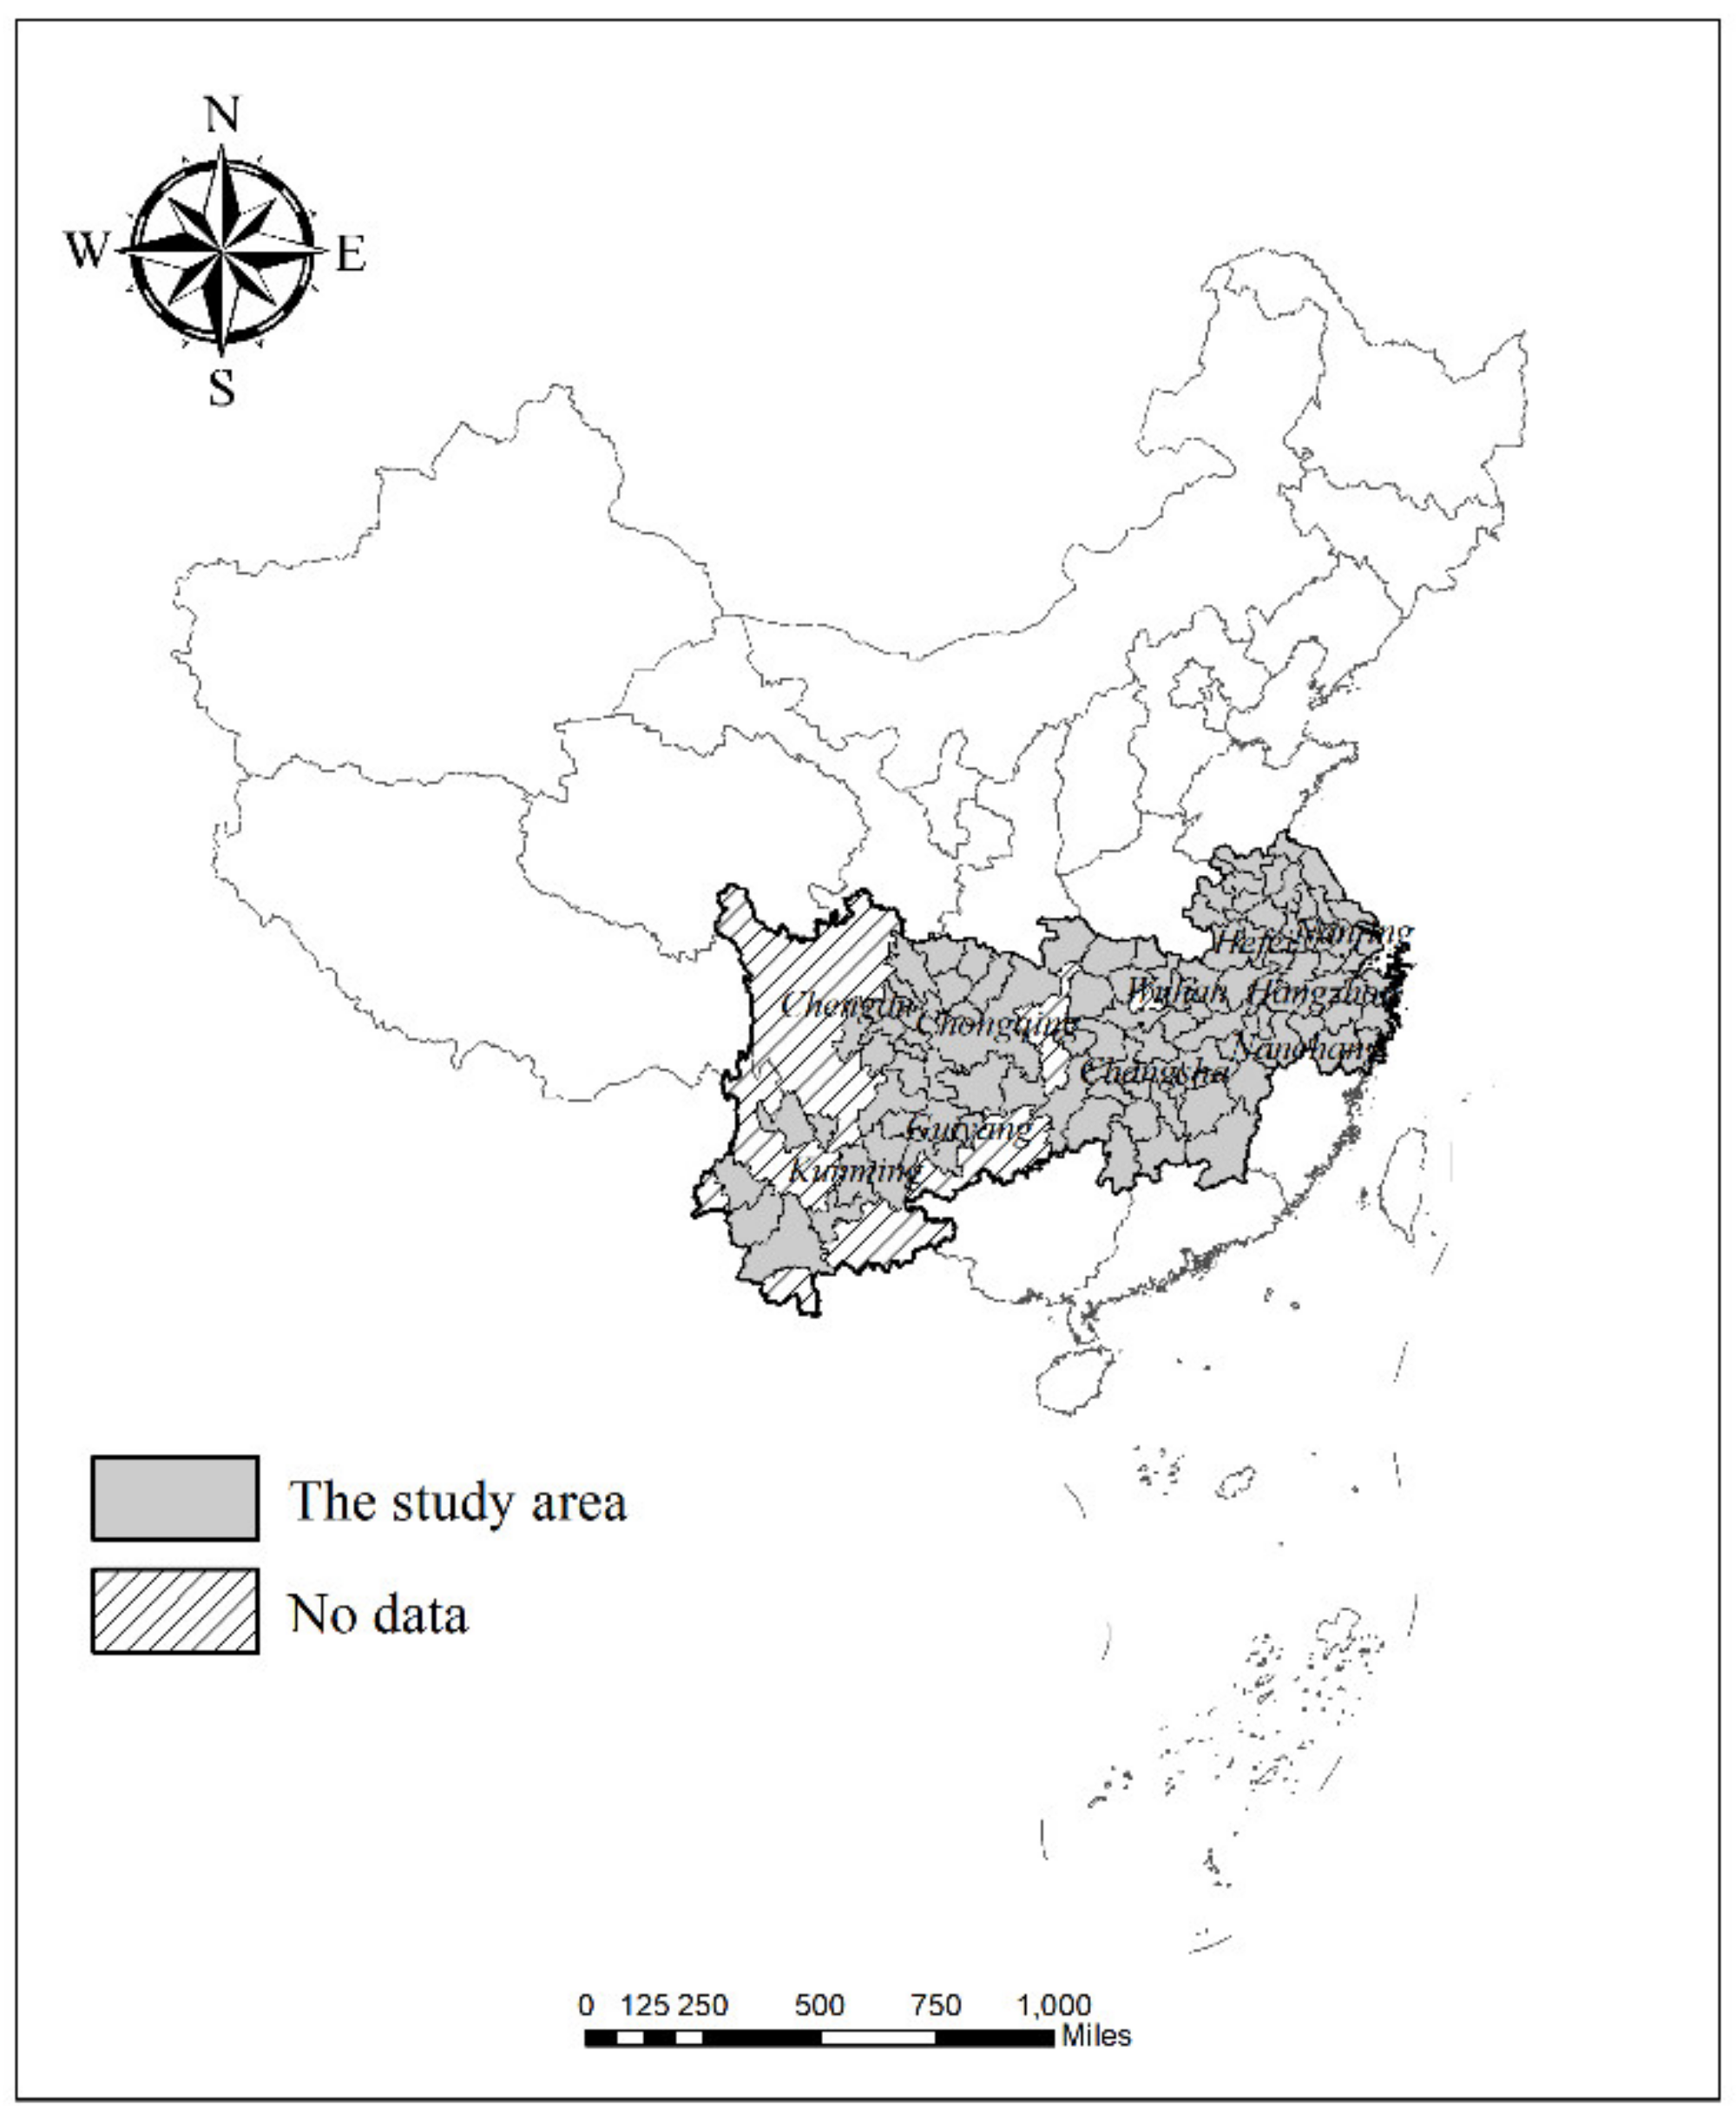
In recent years, the STIRPAT model has been widely used in the study of environmental pollution influencing factors, and many scholars have extended it for the analysis of urbanization, population, economy, industrial structure, and other factors on the environment [43,44,45]. This paper draws on Dietz and Rosa’s STIRPAT model of urban carbon emissions as the basis for constructing an econometric model [46,47]. The basic form of the model is as follows:
I = α P β 1 A β 2 T β 3 μ
where I is urban carbon emissions and α is a constant term; P is population size; A is wealth per capita; T is the level of technology in energy use and μ is a random error term. The model is a non-linear model with multiple variables, so the following equation can be obtained by taking the logarithm of both sides:
l n I = l n α + β 1 l n P + β 2 l n A + β 3 l n T + l n μ
where β 1 ,   β 2 ,   β 3 denote the elasticity coefficient, indicating that for every 1% change in lnP, lnA, and lnT, lnI changes by β 1 % ,   β 2 % ,   β 3 % .
The theoretical analysis of this paper shows that producer services can reduce carbon emissions through their own “green” characteristics, technology spillover effect, scale economy effect, and industrial structure upgrading. Therefore, we constructed a panel model based on the STIRPAT model to analyze the relationship between producer services agglomeration, enterprise market entry, and carbon emissions. The model is specified as follows:
l n C O 2 i , t = α + β 1 l n E N T R Y i , t + β 2 l n C S P i , t + β 3 l n P i , t + β 4 l n A i , t + β 5 l n T i , t + ε i , t
In addition to the above factors, according to relevant literature, human capital, government intervention, foreign investment, and industrial structure may also influence carbon emissions. Equation (4) can be obtained:
l n C O 2 i , t = α + β 1 l n E N T R Y i , t + β 2 l n C S P i , t + β 3 l n P i , t + β 4 l n A i , t + β 5 l n T i , t + β 6 l n E D U i , t + β 7 l n G O V i , t + β 9 l n FDI i , t + ε i , t
where cities are denoted by the subscript i ( i = 1 , , N ) and the subscript t ( t = 1 , , N ) denotes the time period. α is the intercept term. β 1 to β 9 are the elastic coefficients of the explanatory variable and ε i , t represents the random error term.

3.1.2. Data

(1) Carbon emissions (CO2). The current calculation of carbon emissions mainly adopts the IPCC (2006) standard to estimate CO2 emissions from energy consumption. However, it should be especially noted that since the statistics are primarily national or provincial level, municipal and smaller-scale statistics are more difficult to collect. The standard of carbon emission calculation is not uniform, and the results vary greatly. The corrected and merged lighting dataset of DMSP-OLS data and NPP-VIIRS data can be effectively applied to carbon emission estimation, which can be effectively applied to carbon emission estimation and help overcome the shortcomings of traditional methods and improve the accuracy of the study [48]. Data for YERB region carbon emission were obtained directly from the China Emission Accounts and Datasets (CEADs) [49].
(2) Enterprise market entry (ENTRY). Most of the current market entry of firms is reflected by the rate of firm entry or the number of entering firms. In conjunction with the research objectives of this paper, the market entry of firms can be reflected using the number of new firms per year in the optional space. The data come from the data of small and micro enterprises in the National Enterprise Credit Inquiry System on the enterprise search platform [50]. This database includes a total of 41.75 million enterprises, covering the unit’s name, industry code, time of establishment, and other pieces of information. From the data, we filter new enterprises’ information each year, summarize their statistics, and count them to each prefectural city level.
In this paper, we classify producer service industries according to the National Standard for Industry Classification (NSIC) and the Statistical Classification of Producer services (2019), and with reference to Gu’s research [42]. The producer service industry includes transportation, storage, and postal services (TSP); information transmission, computer services, and software (ICS); wholesale and retail trade (WRT); tenancy and business services (TBS); scientific research and technology services (SRT); environmental management and public facilities management services (EMP); and finance (FI).
(3) Two-dimensional composite agglomeration (CSP). Due to the limitation of data statistics, the existing data of the producer service industry only count the number of employment units, which does not reflect the overall agglomeration level of the producer service industry and the agglomeration of enterprise distribution dimension. The change in agglomeration effect is based on the non-linear characteristics of agglomeration itself, while the dynamic change characteristics of market players and industrial agglomeration in the time sequence are difficult to determine. In this paper, on the basis of Ezcurra and Han [16,51], we make appropriate improvements and draw on Chen’s approach [52], using weighting coefficients to weigh the two types of agglomeration indicators into a two-dimensional composite agglomeration degree (CSP). The specific calculation formula is as follows:
CSP = α S E i s E i E s E + β S C i s C i C s C
where E i s , C i s denote the number of units employed and the number of new enterprises in producer service industries in city i respectively. E i , C i denote the total number of units employed and the total number of new enterprises in city i respectively, and E s , C s denote the number of units employed and the number of new enterprises in producer service industry s other than city i respectively. E , C are the number of units employed and the number of new firms at the national level other than city i respectively. In this paper, α takes a value of 0.9 and β takes a value of 0.1.
(4) Control variables. Per capita wealth (A) is expressed using the per capita GDP (ECO), a commonly used indicator to measure regional economic development. The per capita GDP data are deflated to a base period of 2003 to remove the effect of inflation on the data. Population factor (POPU) indicates the population size. We use population density to indicate the impact of population on the environment. This can be divided into technological progress and industrial structure (INS). We use a broad industrialization indicator, the ratio of non-agricultural industries, to measure the change in industrial structure. Technological progress is the main manifestation of knowledge and competence, and human capital is used to reflect it [53]. We express human capital (EDU) in terms of the number of students enrolled in tertiary institutions per 10,000 people. For government intervention (GOV), we use the share of budget revenue in regional GDP to indicate the degree of regional government intervention in economic development. Regarding openness to foreign investment (FDI), the “pollution sanctuary” hypothesis suggests that FDI affects the environmental quality of host countries by transferring highly polluting industries to them through investment [54]. Some scholars argue that foreign investment can introduce environmentally friendly technologies and products to improve environmental quality [55], and that foreign investment can create higher agglomeration economies and thus promote green industries. Therefore, this paper uses the ratio of actual utilization of investment to GDP as the FDI index.
Data for the above control variables were obtained from the statistical database of the China Statistics Bureau, the statistical database of China Economic Network, the Yangtze River Economic Belt Big Data Platform, the China City Yearbook 2001–2018, and the China Regional Economic Statistical Yearbook. In order to eliminate problems such as heteroskedasticity, some of the data were logarithmically processed in this paper, and the logarithmically processed data were found to be stable through testing. Table 1 shows the descriptive statistics for all variables.

3.1.3. Dynamic Spatial Econometric Model

Carbon dioxide emissions are a dynamic adjustment process with path dependence. This means that carbon emissions in the previous period will have an impact on carbon emissions in the current period, so it is necessary to take into account the time lag effect of carbon emissions in the model. The specification can be seen in Equation (6).
l n C O 2 i , t = τ l n C O 2 i , t 1 + β 1 l n E N T R Y i , t + β 2 l n C S P i , t + β 3 l n E C O i , t + β 4 l n P O P U i , t + β 5 l n E C O i , t + β 6 l n I N S i , t + β 7 l n E D U i , t + β 8 l n G O V i , t + β 9 l n F D I i , t + ε i , t + ν t + μ i
Carbon emissions, as an externality in economic development, may have a more pronounced correlation effect in space, i.e., the carbon emission factors of the city i may have an impact on neighboring city j. The dynamic spatial panel model proposed by Elhorst is a good solution to this dependency [56]. The dynamic spatial regression model is set up as follows.
l n C O 2 i , t = τ l n C O 2 i , t 1 + σ j = 1 , j i N w i j l n C O 2 i , t + β 1 l n E N T R Y i , t + β 2 C l n S P i , t + β 3 l n E C O i , t + β 4 l n P O P U i , t + β 5 l n E C O i , t + β 6 l n I N S i , t + β 7 l n E D U i , t + β 8 l n G O V i , t + β 9 l n F D I i , t + ε i , t + ν t + μ i
where i i = 1 , , N denotes different cities and t ( t = 1 , , N ) denotes different times. w i j refers to the N N -dimensional spatial weight matrix, σ is the spatial autoregressive coefficient; β is the elasticity coefficient of the explanatory variable; φ represents the spatial autocorrelation coefficients; μ i and ν t are the individual effect and time effect, respectively;   ε i t is the error term that obeys the independent random distribution.
In addition, enterprise market entry may also be affected by agglomeration effects. In order to effectively investigate the interaction between producer service agglomeration and enterprise dynamics, the interaction terms are added into the dynamic space panel model and the model is obtained:
l n C O 2 i , t = τ l n C O 2 i , t 1 + σ j = 1 , j i N w i j l n C O 2 i , t + β 3 l n E C O i , t + β 4 l n P O P U i , t + β 5 l n I N S i , t + β 6 l n E D U i , t + β 7 l n G O V i , t + β 8 l n F D I i , t + β 1 l n E N T R Y i , t + β 2 l n C S P i , t + β 12 l n E N T R Y i , t × l n C S P i , t + ε i , t + ν t + μ i
where τ denotes the first-order lagged regression coefficient of CO2, σ denotes the spatial lag term regression coefficient, and ε i t denotes the error term.
In order to accurately measure the interaction effect of the independent variable on the dependent variable, the first-order partial derivatives are found for both sides of Equation (8), as shown in Equation (9).
l n C O 2 l n E N T R Y i , t = β 12 l n C S P i , t + β 1
The marginal effect of the variable ENTRY on CO2 depends on the variable CSP; if β 9 > 0 , then the marginal effect of ENTRY on CO2 increases with increasing CSP. Conversely, if β 9 < 0 , then the marginal effect of ENTRY on CO2 decreases with increasing CSP. Further derivation of the Equation (10):
l n C O 2 l n E N T R Y i , t × l n C S P i , t = l n C O 2 l n E N T R Y i , t l n C S P i , t = β 12
Therefore, the regression coefficient β 12 before the interaction term is also called “Interaction Effect”, or “Moderating Effect”; that is, the effect of ENTRY on CO2 is affected by C S P i , t . When C S P i , t is unchanged, the influence intensity of C S P i , t on CO2 is β 1 + β 12 .

3.2. Spatial Weighting Matrix

To accurately measure the spatial correlation between individuals, it is also necessary to construct appropriate spatial weighting matrices. Commonly used spatial matrices are the adjacency matrix, the geographical distance matrix, and the economic distance matrix. In reality, however, the spatial correlations between regions may not come from one aspect of geography or economy alone, but from both geographic distance and economic behavior. In order to systematically examine the spatial correlation characteristics of carbon emissions, three spatial weight matrices are constructed in this paper. Firstly, the spatial distance matrix Wd is constructed for geographical distance decay, and its expression is:
W d = 1 d i j 2 ,   i j 0 ,   i = j
Since the spatial agglomeration of industries may make the division of labor and collaboration between horizontal and vertical industries between two cities spatially related, only geographical factors do not reflect all the spatial influencing factors well, and they also may be subject to the spillover and radiation effects of economic and social motives in each region, so the spatial weight matrix W1 of geographic economic distance is constructed based on Wd:
W 1 = W d i j 1 E i ¯ E j ¯ , i j   0 ,   i = j
where E ¯ indicates the annual average value of GDP per capita in a region.
The second is a quadratic nested weight matrix (W2) for economic geography, which draws on the weight construction method of the expression:
W 2 = ψ W d ( ϕ ) + 1 ψ 1 E i ¯ E j ¯ = ψ ϕ W d + 1 ϕ 1 E i ¯ E j ¯ + 1 ψ W 1
where ψ and ϕ take values between 0 and 1. In this paper, ψ and ϕ are 0.5.
In addition to this, in the process of economic development, economically developed regions have a greater radiating influence on less developed regions, while less developed regions have a smaller influence on developed regions. Therefore, the spatial influence effectiveness of the two is not the same. The asymmetric influence nested weight matrix W3 is constructed on the basis of W1.
W 3 = E i E j × W d         i j 0                                         i = j

4. Results

4.1. Spatial Characteristics of CO2 Emissions

Figure 3 depicts the spatial evolution of the CO2 distribution, showing the CO2 concentrations in the study area in 2003, 2007, 2012, and 2017. Based on the natural breakpoint classification, five emission levels are identified from low to high: low emissions, medium-low emissions, medium emissions, medium-high emissions, and high emissions. The graph shows that from 2003 to 2007, the level of CO2 emissions in the YREB increased significantly, especially in the middle and upper reaches of the Yangtze River. Secondly, CO2 emissions show an apparent spatial clustering. Medium and high emissions are mainly concentrated in the lower reaches of the Yangtze River. In terms of emission levels, the trend of expanding high emission areas from 2007 to 2012 reached a peak in 2012, and the rate of emissions slowed significantly after that, curbing the expansion trend.

4.2. Spatial Autocorrelation

CO2 may be spatially correlated, and the spatial autocorrelation index is an indicator of whether it has a spatial effect and a basis for whether to include spatial features in the model. Moran’s I-index is generally chosen as a reference for the results. Moran’s index values under three spatial weights are shown in Table 2 and Figure 4.
The Moran index represents the degree of association of the object in space. p-values of the Moran index from 2003 to 2017 are all less than 0.01. The results are more significant and have certain reference significance. From the test results, the Moran index ranges from 0.038 to 0.279, indicating that the carbon emissions in the study area show significant spatial clustering characteristics, and the spatial dependence characteristics show a gradual increase with the continuous development of cities’ industrial changes.

4.3. Analysis of Full Sample Results

In this paper, the Equations (4) and (6), without considering spatial effects, are first estimated to test the impact of producer services on carbon emissions. Before estimating the panel data, the Hausman test was used to select a fixed-effects model or a random-effects model. The result shows that the chi2 statistic is 262.53 at a 1% significant level; therefore, the fixed effects model is adopted. Based on this model, it can be seen from column 1 of Table 3 that ENTRY and CSP significantly reduce carbon emissions. Turning our attention to the dynamic panel model Equation (6) (i.e., the system-GMM model), results are shown in columns 2 and 3 of Table 3. The system-GMM model considers endogeneity but ignores the spatial interactions of CO2 emissions in space. System-GMM results are usually more plausible than FE models. From the regression results in columns 2 and 3 of Table 3, the coefficient of the first-order lag term of carbon emissions is significantly positive, indicating a significant dynamic effect of carbon emissions, i.e., carbon emissions have an intense time lag. Moreover, ENTRY and CSP not only exhibit significant carbon reduction effects, but also there is a significant synergistic effect between ENTRY and CSP. However, due to the neglect of spatial spillover effects, the system-GMM estimates are subject to omitted variable bias.
The Moran values show that there is a positive spatial correlation of CO2 emissions between regions, and the spatial dynamic panel model (8) is estimated next. Before estimating the model, we first need to test the spatial model, and this task is usually performed by the LM test [57]. The criterion is that the model with more significant LM statistics is the suitable model. The test results show that both LM and LM-robust pass the significance test, so the spatial lag model is applicable. Due to the endogeneity problem, estimating dynamic spatial panel models using SGMM tends to be more effective than traditional great likelihood estimation [56,58], which is able to select the appropriate instrumental variables from the time trend terms of the variables, making the estimation more efficient. There are two important tests in the estimation of spatial dynamic panel models [59,60]. The Sargan statistic of the overidentification test was used to determine the validity and feasibility of the instrumental variables. The instrumental variables were considered valid when the Sargan statistic could not reject the original hypothesis at the 10% significance level earlier. The Arellano–Bond test was used to detect the first-order and second-order serial correlations of the error terms (i.e., AR(1) and AR(2)). When the p-value of AR(2) is higher than 0.05, it indicates that the instrumental variables used are exogenous. As shown in Table 3 and Table 4, the tests indicate that there is no misclassification problem with SGMM and the instrumental variables we used are reasonably valid.
The results are presented in Table 4 below. With the inclusion of spatial effects, the time-lagged term and the spatial lagged term in model (8) are significant. The applicability of the spatial econometric model is confirmed by comparing the decidable coefficients of the model as well as the LK values, and the estimated coefficients and reasonableness are greatly improved. The optimal model was determined by comparing the goodness-of-fit, LR statistics, and likelihood log values, and the spatial dynamic panel model under the economic-geographic matrix was selected as the explanatory model. The following section only reports and discusses the estimation results of the dynamic spatial panel model based on W1 weights.
It can be seen from Table 4 that the spatial lag of carbon emissions is significantly positive, which once again proves the spatial agglomeration characteristics of carbon emissions. Under the influence of the natural environment, atmospheric flow, and economic activities of human society, the carbon emission levels of this region and other regions present a kind of “one prosperity, one loss” relationship. In the time dimension, the time lag term of carbon emissions is also significantly positive, which proves that carbon emissions have prominent path-dependent characteristics. In other words, the carbon emission level in the current period is relatively high, and the carbon emission in the next period may continue to rise, which is a “snowball” effect. This is consistent with the conclusions drawn from the existing literature. Therefore, the carbon emission reduction work must be unremitting and cannot be expected to reduce carbon emissions in some regions.
From the parameter estimates of the control variables, for every 1% increase in ECO, the carbon emission level of the region is reduced by 0.042%. Moreover, in the Table 4, POPU has a significant positive effect on carbon emissions. The population size affects carbon emissions through the scale effect and agglomeration effect. The traffic congestion and excessive residential density brought by the population gathering aggravate carbon emissions [61]. In the table, EDU and INS lead to increased carbon emissions. The increase in the level of local human capital does not reduce the level of regional carbon emissions. At the same time, China’s economic development model is mainly driven by investment and industrial structure, and the development of the secondary industry is accompanied by excessive dependence on fossil energy, which inhibits the optimization of the energy structure. The optimization of the industrial structure will continue to be a priority for China [7,62]. Meanwhile, GOV in the table is significantly negative. Amid China’s rapid economic development, the government has effectively corrected the environmental pollution problem by utilizing adjustment and supervision. For example, China’s repeated policies, such as the “Guidance on Accelerating the Development of the Producer Service Industry to Promote the Adjustment and Upgrading of Industrial Structure”, have extensively promoted the development of the producer service industry. By guiding the market and formulating effective green industrial support policies, China has accelerated the “post-industrial” development and promoted the “green” industrial upgrading. Foreign investment (FDI) is beneficial to carbon emission reduction. The “pollution refuge” hypothesis for carbon emissions is not established in China [55]. FDI reduces carbon emission levels through the over-income effect, “pollution halo effect”, and technology spillover effect.
Secondly, from the estimation results of ENTRY and CSP, it can be found that the elasticity coefficients of both ENTRY and CSP are significantly negative, indicating that producer services can effectively reduce carbon emissions, which is consistent with the conclusion of Zhao’s research [63]. Due to its “green industry” characteristics, producer services are low-pollution and high-value-added industries. On the one hand, the entry of new producer service enterprises can promote mutual learning, in-depth exchanges, and sincere cooperation among similar enterprises, which improves producer services’ service capacity, stimulates innovation vitality, and reduces production energy consumption and transaction cost manufacturing. On the other hand, with the agglomeration of producer services, the rational allocation of resources is optimized, and the effects of economies of scale can be achieved through industrial association, specialized production, increasing returns to scale, knowledge spillover, and other mechanisms to promote the optimization and upgrading of regional industrial structure, adjust energy consumption structure and reduce carbon emissions. In addition, Table 4 shows a “synergistic effect” between the agglomeration of producer service industries and the market entry of new enterprises. The agglomeration of industries can influence the choice preference of the later entering enterprises [19], forming a positive cycle of cumulative effect and improving the productivity of enterprises [26], which ultimately improves the carbon emission reduction capacity of the producer service industry.

4.4. Heterogeneity Analysis of Carbon Emissions by Industry Sample

Due to the obvious differences in economic activities and industry characteristics among industries in the producer service industry, the impact on carbon emissions is influenced by the heterogeneity of producer service industry segments. Therefore, the producer service industry is divided into seven categories to further examine the impact of carbon emission reduction among different industries. The results are shown in Table 5.
According to the estimated results in Table 5, it is obvious that the entry of high-end producer service companies such as EMP, SRT, and FI can effectively reduce the level of carbon emissions, but this carbon reduction effect is negligible. Moreover, such low-end producer service companies as TSP and WRT do not exhibit carbon emission reduction effects. The results of the findings partially coincide with Han’s study [16]. As can be seen from the table, the agglomeration of TSP, LCS, SRT, and EMP can reduce carbon emission levels. One side of this comes from the externalities of agglomeration. Synergizing with the manufacturing industry promotes technological innovation [15], deepens the division of labor among industrial enterprises, and reduces the cost of green production. On the other side are the high-end producer service companies such as EMP and SRT; these enterprises can spontaneously form carbon emission reduction alliances and strengthen the sharing of information on low-carbon technologies and low-carbon products among enterprises [64].
Unfortunately, the clustering of FI and ICS did not show a significant carbon emission reduction effect. Furthermore, the carbon emission reduction effect of market entry of enterprises of high-end producer services shows inefficiency. This is the level of integration between information technology and industrialization in China is still low, resulting in low carbon emission reduction utility. The development of carbon finance in China is also limited by the low degree of marketization, poor innovation ability of derivative products, and regional differences in industries [65], which lead to the lack of a carbon emission reduction effect. More often, due to the industry’s entry barriers, price control, and natural monopoly phenomenon, the agglomeration development does not reduce the regional carbon emissions. With the expansion of the scale, the disorderly agglomeration of enterprises, while promoting economic development, will also increase the level of carbon emissions in the region.

4.5. Heterogeneity Analysis of Carbon Emissions in a Sub-Regional Sample

The YREB is a vast region affected by natural, social, and economic factors and limited by regional differences in industrial structure, resource endowment, economic activities, and other aspects, where producer services show obvious diversity in carbon emissions. Considering the long-standing existence of socio-economic development, regional development policy barriers, and watershed division among areas in the YREB, we split the sample according to upstream (33 cities), midstream (36 cities), and downstream (41 cities) areas to account for potential regional heterogeneities. The regional sample regression results are shown in Table 6.
As shown in Table 6, the results for each control variable vary across the sample estimates in different regions and differ significantly from the complete sample estimates. Government regulation of the market structure and economic development structure in the country’s upper, middle, and lower reaches have effectively improved carbon emission reduction. In Table 6, it can be seen that the increase in population density and the acceleration of industrialization both triggered a significant increase in carbon emissions. As the standard of living and industrialization in the downstream and midstream areas of the YREB are higher than those in the upstream areas, this has led to a large number of people moving from the upstream and midstream to the downstream areas [61]. As the population expands, employment density increases and urban sprawl is accompanied by an increase in building height and density, increasing carbon emissions.
Table 6 shows that ENTRY and CSP are conducive to reducing carbon emissions in the downstream region. Due to the specialization and market integration-oriented industrial development strategy implemented in China after the reform and opening up, the gap in economic development bases between regions has gradually widened, and the industrialization process and service industry development are not equal in scale. The economic development of downstream regions is superior to the middle and upper reaches, with extensive market size and a finer division of labor between and within industries. As the “polarization trickle-down” effect is constrained by distance and time. Although the producer service industry in the eastern region is more developed, the positive radiation effect is smaller than the negative inhibition effect in the central and western regions. Therefore, it is difficult to influence the development of the central and western regions through the trickle-down effect, so the change is minimal.
From the perspective of development, the downstream region has a tremendous carbon emission reduction potential than the upstream and midstream regions [66]. On the one hand, the upstream area is restricted by the regional economy. It must rely on the development of secondary industries to promote economic development, and, inevitably, some of the “high-emission” industrial enterprises in the downstream area will be undertaken. The economic development level of the upstream region is relatively backward, and the concentration of industries and the development of high-end producer services require a large amount of factor input, which is challenging to form economies of scale in a short period, so the effect of carbon emission reduction is not apparent. On the other hand, due to the relatively small industry scale in the upstream and midstream areas, the demand for producer services is low. At the same time, due to insufficient infrastructure construction, the influx of new enterprises into the producer service industry does not match effectively with the local industrial and economic development structure, which results in low-level duplicate construction and isomorphic development. It causes the high-end producer service industry to be constrained by the regional economy, which leads to increased local carbon emissions.

5. Discussion

Despite the growing interest in understanding the impact of producer service on carbon emissions, most of the current literature is in the form of experience summaries or statistical descriptions. Here, we empirically investigate the carbon emission reduction role of productive service industries from a microscopic perspective. Our full-sample estimation results are supported by Lin, Zhang et al. [5,7,43]. We find that the producer service industry can effectively reduce carbon emissions, which is consistent with the findings of Yang and Li [14,15]. In addition, we improve upon Zhao’s study using micro-firm data [63]. We find that CSP can influence ENTRY to enhance the carbon reduction effect of producer services. As far as we know, industrial agglomeration could affect the market entry preferences of new enterprises. Thus, industrial agglomeration encourages more innovative enterprises to enter the market and affects total output and total factor productivity through the “allocation effect” [26,36]. It enhances the carbon reduction effect of producer service. Based on this, we further analyze the heterogeneity of carbon emission reduction in producer service. In contrast to Han’s results [16], this paper considers the time dependence and spatial dependence of carbon emissions. We find that ENTRY of high-end producer services can significantly reduce carbon emissions, while low-end producer services have the opposite effect. Moreover, the producer service industry exhibits significant regional heterogeneity. The producer service in the downstream region of YREB exhibits significant carbon reduction potential compared to the middle and upstream regions, a result that corroborates Li’s findings [66]. This is mainly due to the differences in development level, industrial structure, and resource endowment between regions [5,62]. The mismatch between the producer service and regional infrastructure will lead to the inability of producer services to play their role in carbon emission reduction.

6. Conclusions

This aim of this study was to systematically discuss the impact of producer service industries on carbon emissions from the perspective of enterprise market entry within the framework of the new economic geography theory. We adopted a dynamic spatial econometric model based on the panel data of 110 cities in the YREB of China from 2003 to 2017. We further explored the industry heterogeneity and regional heterogeneity of the producer service industry separately. The main findings of this study are as follows.
(1)
The results of the dynamic spatial model research indicate that the producer service industry has a significant negative impact on carbon emissions in YREB; in other words, the development of producer services for the full sample can help mitigate carbon emissions. In addition, there is a significant synergistic effect between CSP and ENTRY. The intensity of the effect of ENTRY on carbon emissions increases with the enhancement of CSP, and CSP significantly enhances the relationship between ENTRY and carbon emission reduction.
(2)
Different sectors of the producer service industry exhibit different carbon reduction effects; this implies that there is industry heterogeneity in the carbon reduction effects of producer service. The high-end producer service industry (e.g., SRT, EMP) exhibits excellent ability to reduce carbon emissions. In contrast, the low-end productive service industry cannot reduce carbon emissions, and even increases them.
(3)
The impact of producer services on carbon emission reduction differs in different YREB regions; that is, significant regional heterogeneity is found in the upstream, midstream, and downstream of the Yangtze River. Due to problems such as resource mismatch and economic development differences, producer service does not contribute to carbon emission reduction in the upstream YREB.
Based on the above conclusions, in order to effectively promote the high-quality development of the producer services and facilitate carbon emission reduction, we propose the following recommendations.
First, at the COP26 conference in November 2021, China demonstrated its determination to promote green and low-carbon development and actively respond to global climate change. China will insist on the concept of a community of life between human beings and nature, adhere to ecological priorities, pursue green and low-carbon development, and accelerate the construction of a green, low-carbon, and circular economic system. To achieve the goal of “double carbon”, China must make constant efforts to jointly prevent and control and formulate effective inter-regional cooperation policies. China must continuously promote industrial restructuring, resolutely curb the blind development of high energy-consuming and high-emission projects, accelerate the green and low-carbon transformation of energy, and vigorously develop renewable energy.
Second, the optimization of the industrial structure can effectively reduce carbon emissions, but it is still necessary to promote the participation of market entities in the construction process. Furthermore, China should promote the upgrading of the producer service industry, accelerate the development scale and speed of high-end producer service industry, promote the effective embedding of the producer service industry in the manufacturing value chain, and realize the effective matching between the high-end manufacturing industry and the producer service industry. With market incentive policies to attract more market entities to enter the “green industry”, this guides enterprises to actively carry out green technological innovation activities to create a “special, precise, new” type of producer service industry.
Third, all regions should scientifically plan and develop producer services according to their natural endowments, industrial structure, and demand for development projects, so as to give full play to the carbon emission reduction of producer services. Furthermore, each region should comprehensively consider the development needs of the local manufacturing industry, potential strength, technical capacity, and transformation and upgrading, and promote the formation of a benign industrial chain with complementary advantages, reasonable proportions, and close cooperation between upstream and downstream regions.
This study details preliminary empirical evidence and a micro perspective on the impact of producer service on carbon emissions, but there are some limitations. Firms’ exit and incumbency times may have different effects on their emission reduction effects, which are not included in the research framework in this paper due to the limitations of regional data statistics and errors. Therefore, it will be useful to use other microdata (e.g., POI data containing enterprise dynamics) or methods in future studies to make more accurate policy recommendations for relevant regions and industries. Meanwhile, the high-end producer service industry and high-end manufacturing industry are the trends of research. Analyzing the impact of both on carbon emission reduction is of great value for exploring the future development trend of the producer service industry.

Author Contributions

Conceptualization, T.Z. and P.S.; methodology, T.Z.; software, T.Z.; validation, T.Z., P.S.; formal analysis, T.Z.; investigation, T.Z.; resources, H.D.; data curation, T.Z., P.S.; writing—original draft preparation, T.Z.; writing review and editing, T.Z.; visualization, T.Z.; supervision, H.D. All authors have read and agreed to the published version of the manuscript.

Funding

This research was funded by National Social Science Foundation 2020 Late Stage Funding Program (grant number 20FGLB017).

Institutional Review Board Statement

Not applicable.

Informed Consent Statement

Not applicable.

Data Availability Statement

The data presented in this study are available on request from the corresponding author. The data are not publicly available due to restrictions privacy.

Conflicts of Interest

The authors declare no conflict of interest.

References

  1. Raźniak, P.; Dorocki, S.; Winiarczyk-Raźniak, A. Spatial changes in the command and control function of cities based on the corporate centre of gravity model. Misc. Geogr. 2020, 24, 35–41. [Google Scholar] [CrossRef] [Green Version]
  2. Raźniak, P.; Csomós, G.; Dorocki, S.; Winiarczyk-Raźniak, A. Exploring the Shifting Geographical Pattern of the Global Command-and-Control Function of Cities. Sustainability 2021, 13, 12798. [Google Scholar] [CrossRef]
  3. Grossman, G.M.; Krueger, A.B. Environmental Impacts of a North American Free Trade Agreement. CEPR Discuss. Pap. 1992, 8, 223–250. [Google Scholar] [CrossRef]
  4. Panayotou, T. Empirical Tests and Policy Analysis of Environmental Degradation at Different Stages of Economic Development. Pac. Asian J. Energy 1993, 4, 13–36. [Google Scholar]
  5. Zhang, Y. The impact of economic development pattern change on Carbon emission intensity in China. Econ. Rese. J. 2010, 45, 120–133. [Google Scholar]
  6. Adom, P.K.; Bekoe, W.; Amuakwa-Mensah, F.; Mensah, J.T.; Botchway, E. Carbon dioxide emissions, economic growth, industrial structure, and technical efficiency: Empirical evidence from Ghana, Senegal, and Morocco on the causal dynamics. Energy 2012, 47, 314–325. [Google Scholar] [CrossRef]
  7. Lin, B.; Du, K. Understanding changes in Energy intensity in China: A comprehensive disaggregated Framework. J. World Econ. 2014, 37, 69–87. [Google Scholar]
  8. Zhang, H.; Zhang, X.; Yuan, J. Driving forces of carbon emissions in China: A provincial analysis. Environ. Sci. Pollut. Res. Int. 2021, 28, 21455–21470. [Google Scholar] [CrossRef] [PubMed]
  9. Wang, S.; Wang, J.; Zhou, Y. Estimating the effects of socioeconomic structure on CO2 emissions in China using an econometric analysis framework. Struct. Chang. Econ. Dynam. 2018, 47, 18–27. [Google Scholar] [CrossRef]
  10. Derudder, B.; Cao, Z.; Liu, X.; Shen, W.; Dai, L.; Zhang, W.; Caset, F.; Witlox, F.; Taylor, P.J. Changing Connectivities of Chinese Cities in the World City Network, 2010–2016. Chin. Geogr. Sci. 2018, 28, 183–201. [Google Scholar] [CrossRef] [Green Version]
  11. Beaverstock, J.V.; Smith, R.G.; Taylor, P.J. A roster of world cities. Cities 1999, 16, 445–458. [Google Scholar] [CrossRef]
  12. Coffey, W.J. The Geographies of Producer Services. Urban Geogr. 2000, 21, 170–183. [Google Scholar] [CrossRef]
  13. Taylor, P.J.; Derudder, B.; Faulconbridge, J.; Hoyler, M.; Ni, P. Advanced Producer Service Firms as Strategic Networks, Global Cities as Strategic Places. Econ. Geogr. 2014, 90, 267–291. [Google Scholar] [CrossRef] [Green Version]
  14. Yang, H.; Lu, F.; Zhang, F. Exploring the effect of producer services agglomeration on China’s energy efficiency under environmental constraints. J. Clean. Prod. 2020, 263, 121320. [Google Scholar] [CrossRef]
  15. Li, T.; Han, D.; Feng, S.; Liang, L. Can Industrial Co-Agglomeration between Producer Services and Manufacturing Reduce Carbon Intensity in China? Sustainability 2019, 11, 4024. [Google Scholar] [CrossRef] [Green Version]
  16. Han, F.; Xie, R. Does the agglomeration of producer services reduce carbon emissions? J. Quan. Tech. Econ. 2017, 34, 40–58. [Google Scholar]
  17. Fritsch, M.; Storey, D.J. Entrepreneurship in a Regional Context: Historical Roots, Recent Developments and Future Challenges. Reg. Stud. 2014, 48, 939–954. [Google Scholar] [CrossRef]
  18. Armington, C.; Acs, Z.J. The Determinants of Regional Variation in New Firm Formation. Reg. Stud. 2010, 36, 33–45. [Google Scholar] [CrossRef]
  19. Devereux, M.P.; Griffith, R.; Simpson, H. Firm location decisions, regional grants and agglomeration externalities. J. Public Econ. 2007, 91, 413–435. [Google Scholar] [CrossRef]
  20. Greenbaum, R.T.; Engberg, J.B. The impact of state enterprise zones on urban manufacturing establishments. J. Policy Anal. Manag. 2004, 23, 315–339. [Google Scholar] [CrossRef]
  21. Cheng, S.; Stough, R.R. Location decisions of Japanese new manufacturing plants in China: A discrete-choice analysis. Ann. Reg. Sci. 2006, 40, 369–387. [Google Scholar] [CrossRef]
  22. Antras, P. Firms, Contracts, and Trade Structure. Q. J. Econ. 2003, 118, 1375–1418. [Google Scholar] [CrossRef] [Green Version]
  23. Jofre-Monseny, J.; Marín-López, R.; Viladecans-Marsal, E. The Determinants of Localization and Urbanization Economies: Evidence from the Location of New Firms in Spain. J. Reg. Sci. 2014, 54, 313–337. [Google Scholar] [CrossRef]
  24. Hao, L.; Li, X.; Li, S. Firms’ entry-exit, dynamic industrial agglomeration and productivity coordination of cities—Based on the evidence of Chinese manufacturing firms. Sys. Engin. Theory Pract. 2021, 41, 1942–1960. [Google Scholar]
  25. Guo, Q.; He, C.; Li, D. Entrepreneurship in China: The role of localisation and urbanisation economies. Urban Stud. 2016, 53, 2584–2606. [Google Scholar] [CrossRef]
  26. Shao, Y.; Li, Z. Spatial Agglomeration, Firm Dynamics and Economic Growth: An Analysis Based on China’s Manufacturing Industries. China Ind. Econ. 2017, 2, 5–23. [Google Scholar]
  27. Marshall, A. Elements of Economics of Industry; Macmillan: London, UK, 1982. [Google Scholar]
  28. Zhang, H. How does agglomeration promote the product innovation of Chinese firms? China Econ. Rev. 2015, 35, 105–120. [Google Scholar] [CrossRef] [Green Version]
  29. Li, L.; Zhao, H. Study on the relationship between the integration of “two industries” and carbon emission efficiency. Econ. Survey 2021, 38, 71–79. [Google Scholar]
  30. Brondi, C.; Cornago, S.; Ballarino, A.; Avai, A.; Pietraroia, D.; Dellepiane, U.; Niero, M. Sustainability-based Optimization Criteria for Industrial Symbiosis: The Symbioptima Case. Procedia CIRP 2018, 69, 855–860. [Google Scholar] [CrossRef]
  31. Squicciarini, M. Entrepreneurship, innovation and enterprise dynamics. Small Bus. Econ. 2016, 48, 273–278. [Google Scholar] [CrossRef]
  32. Klette, T.J.; Kortum, S. Innovating Firms and Aggregate Innovation. J. Polit. Econ. 2004, 112, 986–1018. [Google Scholar] [CrossRef] [Green Version]
  33. Aghion, P.; Akcigit, U.; Cagé, J.; Kerr, W.R. Taxation, corruption, and growth. Eur. Econ. Rev. 2016, 86, 24–51. [Google Scholar] [CrossRef] [Green Version]
  34. Baptista, R.; Swann, P. Do firms in clusters innovate more? Res. Pol. 1998, 27, 525–540. [Google Scholar] [CrossRef]
  35. Doraszelski, U.; Pakes, A. A Framework for Applied Dynamic Analysis in IO. Hand. Indust. Organ. 2007, 3, 1887–1966. [Google Scholar] [CrossRef]
  36. Hopenhayn, H.A. Entry, Exit, and Firm Dynamics in Long Run Equilibrium. J. Econom. 1992, 60, 1127–1150. [Google Scholar] [CrossRef]
  37. Keeble, D.; Nachum, L. Why do business service firms cluster? Small consultancies, clustering and decentralization in London and southern England. T. I. Btit. Geogr. 2002, 27, 67–90. [Google Scholar] [CrossRef]
  38. Mitra, A. Agglomeration Economies as Manifested in Technical Efficiency at the Firm Level. J. Urban Econ. 1999, 45, 490–500. [Google Scholar] [CrossRef]
  39. Chang, N. Changing industrial structure to reduce carbon dioxide emissions: A Chinese application. J. Clean. Prod. 2015, 103, 40–48. [Google Scholar] [CrossRef]
  40. Taylor, P.J.; Ni, P.; Derudder, B. Measuring the World City Network: New Results and Developments. 2010. Available online: https://www.lboro.ac.uk/gawc/rb/rb300.html/ (accessed on 27 November 2021).
  41. Jiao, J.; Jiang, G.; Yang, R. Impact of R&D technology spillovers on carbon emissions between China’s regions. Struct. Change Econ. Dynam. 2018, 47, 35–45. [Google Scholar] [CrossRef]
  42. Liu, S.; Gu, N. Administrative monopoly, producer services agglomeration and urban industrial pollution: Empirical evidence from 260 prefecture-level and above cities. J. Fina. Econ. 2015, 41, 95–107. [Google Scholar]
  43. Li, H.; Mu, H.; Zhang, M.; Li, N. Analysis on influence factors of China’s CO2 emissions based on Path–STIRPAT model. Energy Policy 2011, 39, 6906–6911. [Google Scholar] [CrossRef]
  44. Wang, M.; Che, Y.; Yang, K.; Wang, M.; Xiong, L.; Huang, Y. A local-scale low-carbon plan based on the STIRPAT model and the scenario method: The case of Minhang District, Shanghai, China. Energy Policy 2011, 39, 6981–6990. [Google Scholar] [CrossRef]
  45. Diao, B.; Ding, L.; Su, P.; Cheng, J. The Spatial-Temporal Characteristics and Influential Factors of NOx Emissions in China: A Spatial Econometric Analysis. Int. J. Environ. Res. Public Health 2018, 15, 1405. [Google Scholar] [CrossRef] [PubMed] [Green Version]
  46. Dietz, T.; Rosa, E.A. Effects of population and affluence on CO2 emissions. Proc. Natl. Acad. Sci. USA 1997, 94, 175–179. [Google Scholar] [CrossRef] [Green Version]
  47. York, R.; Rosa, E.A.; Dietz, T. STIRPAT, IPAT and ImPACT: Analytic tools for unpacking the driving forces of environmental impacts. Ecol. Econ. 2003, 46, 351–365. [Google Scholar] [CrossRef]
  48. Shi, K.; Chen, Y.; Yu, B.; Xu, T.; Chen, Z.; Liu, R.; Li, L.; Wu, J. Modeling spatiotemporal CO2 (carbon dioxide) emission dynamics in China from DMSP-OLS nighttime stable light data using panel data analysis. Appl. Energy 2016, 168, 523–533. [Google Scholar] [CrossRef]
  49. China Emission Accounts and Datasets (CEADs). Available online: https://www.ceads.net/data/county/ (accessed on 15 May 2021).
  50. National Enterprise Credit Inquiry System. Available online: https://www.qcc.com/ (accessed on 20 December 2020).
  51. Ezcurra, R.; Pascual, P.; Rapún, M. Regional Specialization in the European Union. Reg. Stud. 2006, 40, 601–616. [Google Scholar] [CrossRef]
  52. Chen, L.; Yan, L. Indentification of Industrial Clusters of Oil and Gas in China Based on Composite Location Quotient. Chin. J. Popul. Resour. 2012, 22, 152–158. [Google Scholar]
  53. Shao, S.; Yang, L.; Gan, C.; Cao, J.; Geng, Y.; Guan, D. Using an extended LMDI model to explore techno-economic drivers of energy-related industrial CO2 emission changes: A case study for Shanghai (China). Renew. Sust. Energ. Rev. 2016, 55, 516–536. [Google Scholar] [CrossRef] [Green Version]
  54. List, J.A.; Co, C.Y. The Effects of Environmental Regulations on Foreign Direct Investment. J. Environ. Econ. Manag. 2000, 40, 1–20. [Google Scholar] [CrossRef] [Green Version]
  55. Xu, H.; Deng, Y. Does foreign direct investment cause Pollution in China?—Spatial econometric study based on Chinese provincial panel data. Manag. World 2012, 2, 30–43. [Google Scholar]
  56. Elhorst, J.P. Dynamic spatial panels: Models, methods, and inferences. J. Geograph. Syst. 2011, 14, 5–28. [Google Scholar] [CrossRef]
  57. Anselin, L.; Bera, A.K.; Florax, R.; Yoon, M.J. Simple diagnostic tests for spatial dependence. Reg. Sci. Urban Econ. 1996, 26, 77–104. [Google Scholar] [CrossRef]
  58. Kukenova, M.; Monteiro, J.-A. Spatial Dynamic Panel Model and System GMM: A Monte Carlo Investigation. SSRN Electron. J. 2008. [Google Scholar] [CrossRef] [Green Version]
  59. Arellano, M.; Bover, O. Another look at the instrumental variable estimation of error-components models. J. Econom. 1995, 68, 29–51. [Google Scholar] [CrossRef] [Green Version]
  60. Blundell, R.; Bond, S. Initial conditions and moment restrictions in dynamic panel data models. J. Econom. 1998, 87, 115–143. [Google Scholar] [CrossRef] [Green Version]
  61. Xu, S.; He, Z.; Long, R.; Shen, W.; Ji, S.; Chen, Q. Impacts of economic growth and urbanization on CO2 emissions: Regional differences in China based on panel estimation. Region. Environ. Chang. 2015, 16, 777–787. [Google Scholar] [CrossRef]
  62. Cheng, Z.; Li, L.; Liu, J. Industrial structure, technical progress and carbon intensity in China’s provinces. Renew. Sustain. Energy Rev. 2018, 81, 2935–2946. [Google Scholar] [CrossRef]
  63. Zhao, J.; Dong, X.; Dong, K. How does producer services’ agglomeration promote carbon reduction?: The case of China. Econ. Model. 2021, 104, 105624. [Google Scholar] [CrossRef]
  64. Ashraf, N.; Meschi, P.-X.; Spencer, R. Alliance Network Position, Embeddedness and Effects on the Carbon Performance of Firms in Emerging Economies. Organ. Environ. 2014, 27, 65–84. [Google Scholar] [CrossRef]
  65. Fan, Z.; Hui, Y.; Qin, Y. Thinking on the development of “Carbon Finance” in Commercial Banks of China. Energy Procedia 2011, 5, 1885–1892. [Google Scholar] [CrossRef] [Green Version]
  66. Li, Z.; Zhang, C.; Zhou, Y. Spatio-temporal evolution characteristics and influencing factors of carbon emission reduction potential in China. Environ. Sci. Pollut. Res. Int. 2021, 28, 59925–59944. [Google Scholar] [CrossRef] [PubMed]
Figure 1. Research area.
Sustainability 13 13821 g001
Figure 2. Analytical framework for the mechanisms of impacting carbon reduction by the producer service industry.
Sustainability 13 13821 g002
Figure 3. Spatial evolution of carbon dioxide in the Yangtze River Economic Belt (YREB).
Sustainability 13 13821 g003
Figure 4. Trend of Moran’s I-index.
Sustainability 13 13821 g004
Table 1. Summary statistics.
Var TypesVarUnitObsMeanStd. Dev.MinMax
Explained variableCO2Million tons165023.34726.5731.633230.712
Control variablesECOYuan165022,247.617,379.6502097.784102,300
POPUPerson/km21650481.896291.31352.732285
EDUStudents/10,000 person1650154.625211.9710.5881270.424
INS%1650858.942.399.6
GOV%16507.13222.7
FDI%16500.3270.29702.429
Core explanatory
variable
ENTRYhome165050,895.66120,093.72751,964,005
CSP/16500.1040.0420.0270.32
Table 2. Moran index of carbon emissions in the YREB, 2003–2017.
YearMoran’s I-Index
W1W2W3
20030.1870.1060.038
20040.1960.110.041
20050.2130.120.047
20060.2270.1280.053
20070.2460.1410.06
20080.260.1490.064
20090.2490.1430.06
20100.2540.1450.061
20110.2750.1530.065
20120.2710.1510.064
20130.2750.1490.061
20140.270.1470.06
20150.2790.1540.064
20160.2770.1530.063
20170.260.1410.055
Note: The Moran index passed the 1% significance test for all three spatial weights.
Table 3. Regression results of full sample.
VariablesFESYS-GMM
CO2t−1 0.703 ***
(0.0360)
0.700 ***
(0.0348)
ECO0.452 ***
(0.0173)
0.174 ***
(0.0346)
0.177 ***
(0.0336)
POPU0.0821 ***
(0.0222)
0.0273
(0.0269)
0.0259
(0.0249)
EDU0.0840 ***
(0.0101)
0.0319 **
(0.0135)
0.0321 **
(0.0138)
INS0.426 ***
(0.1246)
0.450
(0.3553)
0.399
(0.3305)
GOV2.080 ***
(0.2162)
−1.189 ***
(0.3595)
−1.156 ***
(0.3383)
FDI−0.0280
(0.0181)
−0.0456 *
(0.0270)
−0.0433 *
(0.0250)
ENTRY−0.0560 ***
(0.0099)
−0.0831 ***
(0.0116)
−0.105 ***
(0.0116)
CSP−1.033 ***
(0.1059)
−0.594 ***
(0.1688)
−2.285 ***
(0.6387)
ENTRY × CSP 0.204 **
(0.0799)
Cons−2.432 ***
(0.1567)
−0.671 ***
(0.2384)
−0.468 **
(0.2052)
Sargan 0.25830.2659
AR(2) 0.35900.2183
Observations165015401540
Note: *, **, and *** represent significant differences at the 10%, 5%, and 1% levels, respectively. Columns 2 and 3 pass the AR(2) test for serial correlation and the Sargan test for overidentification.
Table 4. Regression results of full sample.
Dynamic Spatial Model
MatrixW1W2W3
CO2t−10.472 ***
0.0059
0.471 ***
0.0096
0.504 ***
0.0076
0.56 ***
0.006
WCO20.505 ***
0.0059
0.533 ***
0.0109
0.462 ***
0.0088
0.363 ***
0.0074
ECO−0.042 ***
0.0025
−0.043 ***
0.0028
−0.035 ***
0.0031
−0.0007
0.0036
POPU0.061 ***
0.0029
0.057 ***
0.0022
0.071 ***
0.0033
0.083 **
0.003
EDU0.019 ***
0.0014
0.013 ***
0.0018
0.026 ***
0.0015
0.031 ***
0.001
INS0.538 ***
0.0214
0.444 ***
0.0186
0.555 ***
0.0275
0.587 ***
0.0247
GOV−0.844 ***
0.0329
−0.799 ***
0.0269
−0.963 ***
0.0288
−1.11 ***
0.0484
FDI−0.04 ***
0.0031
−0.041 ***
0.0014
−0.033 ***
0.003
−0.021 ***
0.0027
ENTRY−0.003**
0.0011
−0.012 ***
0.0014
−0.009 ***
0.0012
−0.019 ***
0.0012
CSP−0.128 ***
0.0165
−1.399 ***
0.0818
−0.142 ***
0.0119
−0.158 ***
0.0117
ENTRY × CSP 0.148 ***
0.0098
Sargan0.59330.71530.63140.5862
AR(2)0.6790.2070.9210.483
Note: ** and *** represent significant differences at the 5% and 1% levels, respectively. All pass the AR(2) test for serial correlation and the Sargan test for overidentification.
Table 5. Regression results by industry sample.
VariablesTransport, Storage, and Postal Services (TSP)Information Transmission, Computer Services, and Software Industry (ICS)Wholesale and Retail Trade (WRT)Finance (FI)Tenancy and Business Services (TBS)Scientific Research and Technology Services (SRT)Environmental Management and Public Facilities Management (EMP)
ENTRY−0.008
0.0012
−0.01 ***
0.0006
0.009 ***
0.0008
−0.011 **
0.0012
0.007 ***
0.0006
−0.01 **
0.0013
−0.004 ***
0.0005
CSP−4.349 ***
0.3331
0.759 **
0.0.2403
−0.142
0.1159
1.143 ***
0.1999
−2.402 ***
0.2578
−3.729 ***
0.9205
−0.3716 ***
0.1008
Note: The parameter estimation of each control variable is consistent with Table 4, and it is not listed completely due to space reasons. ** and *** represent significant differences at the 5% and 1% levels, respectively. All pass the AR(2) test for serial correlation and the Sargan test for overidentification.
Table 6. Regression results for sub-regional samples.
VariablesRegional Heterogeneity
UpstreamMidstreamDownstream
CO2t−10.622 ***
0.0431
0.443 ***
0.0264
0.543 ***
0.0175
WCO20.407 ***
0.0343
0.652 ***
0.0244
0.494 ***
0.0257
ECO−0.113 ***
0.016
−0.163 ***
0.0158
−0.089 ***
0.0104
POPU0.156 **
0.062
0.033 ***
0.0079
0.027 ***
0.0041
EDU0.04 ***
0.0076
0.033 ***
0.0079
−0.026 ***
0.0049
INS0.37 ***
0.0786
0.6 ***
0.072
0.916 ***
0.1403
GOV−0.785 **
0.2529
−0.274 ***
0.161
−0.694 ***
0.1031
FDI−0.0362 **
0.0148
0.067 **
0.028
−0.009
0.0067
ENTRY0.016 ***
0.4379
0.017 **
0.009
−0.0132 *
0.0074
CSP−0.048
0.4379
−1.492 *
0.7727
−1.178 **
0.4804
ENTRY × CSP−0.049
0.0516
0.163 *
0.091
0.137 **
0.0538
Sargan1.00001.00001.0000
AR(2)0.7390.3610.338
Observation462504574
Note: *, **, and *** represent significant differences at the 10%, 5%, and 1%, levels respectively.
Publisher’s Note: MDPI stays neutral with regard to jurisdictional claims in published maps and institutional affiliations.

