Article

Greening Factor Framework Integrating Sustainability, Green Supply Chain Management, and Circular Economy: The Chilean Case

by
Francisco J. Tapia-Ubeda
1,*,
José A. Isbej Muga
2 and
Diego A. Polanco-Lahoz
2
1
Department of Industrial Engineering, Universidad Católica del Norte, Antofagasta 1270709, Chile
2
School of Industrial Engineering, Pontificia Universidad Católica de Valparaíso, Valparaíso 2362807, Chile
*
Author to whom correspondence should be addressed.
Sustainability 2021, 13(24), 13575; https://doi.org/10.3390/su132413575
Submission received: 27 October 2021 / Revised: 30 November 2021 / Accepted: 6 December 2021 / Published: 8 December 2021
(This article belongs to the Special Issue Cost-Benefit Analysis for Economic Sustainability in Supply Chains)

Abstract

:
This paper focuses on two main topics: presenting a novel framework for assessing the sustainability of a productive process and the application of the framework to the specific case of Chile. The proposed framework integrates green supply chain management and circular economy within the sustainability perspective as drivers for improvements in sustainable development. Within the framework, the greening factor is introduced as a new concept that measures the required effort for a productive process to become sustainable. On one hand, the framework aims at computing the greening factor based on the impacts of resources exploitation and products generation. Additionally, the greening factor computation was designed based on qualitative and quantitative analysis of economic, social, and environmental mainstays. On the other hand, this paper presents a general application of the framework on the five biggest Chilean industries, i.e., mining, wine, forest, agriculture, and aquaculture. Based on the presented generalized application, it is possible to foresee the potentiality of Chile becoming a green country in spite of its productive matrix being mainly based on primary industries.

1. Introduction

Nowadays, the climate emergency is arising as a pressing issue due to crucial real-world problems, forcing us to reassess our practice in every aspect of our lives, where one of the most relevant factors is the impact of several industries all over the world. In general, industries significantly worsen the current emergency by the emanations and consumptions of their productive processes: particularly, emanations regarding green-house gases and pollutants and the exploitation of water, lands, and other natural resources. Therefore, sustainability has become a key concept as a guide for enhancing our behaviors as consumers, practitioners, and most importantly, as people.
In 2015, the Sustainable Development Agenda was drawn up by United Nations (UN) defining the 17 Sustainable Development Goals (SDG). These SDGs encompass different perspectives required for sustainability, such as education, health, the end of poverty, and economic growth [1]. Among them, SDG 12 (Responsible Consumption and Production) became a relevant mainstay for supporting our research. However, different SDGs are closely related to this proposal, e.g., SDG 8 Decent Work and Economic Growth, and SDG 9 Industries, Innovation, and Infrastructure. Particularly, this research aims at identifying room for improving the sustainability of productive processes in different industries.
Despite the concept of sustainability being multidisciplinary, it is not widely used in different fields. For instance, in economics, the most used term is Circular Economy (CE), whereas, for supply chain managers, the most common term is Green Supply Chain Management (GSCM); CE and GSCM can be considered as applications of sustainability in specific fields of knowledge [2,3,4,5,6,7,8,9]. On one hand, CE is a new economic paradigm that encourages both the use of recycled raw materials and the reduction of waste generation in productive processes [10]. According to [11], this research may be considered as a new path of CE research. On the other hand, GSCM is the process of incorporating environmental concerns into the traditional Supply Chain Management (SCM), considering aspects such as material sourcing and selection, manufacturing processes, delivery, and the management of a product’s end-of-life [12]. This paper integrates aspects from CE and GSCM to critically assess both resources and products, of a specific productive process.
The current research employs Systems Theory (ST) principles as a frame to analyze data. In general terms, ST is an interdisciplinary approach for studying either natural or human-made systems. Particularly, a system can be defined as a group of interrelated elements that interact that is influenced by any given environment and that is described by its boundaries. The proposed framework is based on the Black-Box Model, Boundaries, System and Sub-Systems, System Analysis, and Open System. These concepts are employed at different stages of the framework and allow the proposed design to be intuitive.
Thus, an effective strategy for addressing the current climate emergency is improving the sustainability of the productive processes of all industries around the world to significantly reduce the negative impacts of the current emergency. This may be crucial for allowing mankind to survive this crisis and achieve sustainability in the long term. Consequently, this paper focuses on (1) presenting a framework for assessing the sustainability of productive processes and (2) applying this framework in the particular case of Chile. Through this research, the Greening Factor (GF) is integrated as a novel concept representing the required effort for making a productive process sustainable.
The remaining document is organized as follows. Section 2 is focused on presenting the literature review performed through this research. Section 3 aims at detailed presenting the proposed framework considering its objectives, methodology, and procedures for computing the GF. The case of application is presented in Section 4. The application is based on the five biggest Chilean industries (i.e., mining, wine, aquaculture, agriculture, forest) by analyzing its more representative products (i.e., copper, wine, salmon, fruits and nuts, and cellulose). Section 5 is devoted to presenting the application of the proposed framework, the results analysis, and the managerial insights. Finally, Section 6 focuses on the presentation of the conclusions obtained and directions for future research.

2. Literature Review

Green Supply Chain Management has been developed in the last decades based on the integration of environmental concerns into traditional Supply Chain Management [13,14,15]. GSCM has become a key concept mainly based on the growing responsiveness of industries and countries for environmental and social issues [15,16]. Thus, each country faces an intrinsic conflict between growing its economy and the potential impacts on the environment and society [17,18]. Naturally, countries must discuss and decide how to balance the potential positive and negative effects of growing their economies. Among several other factors, the composition of the productive matrix becomes one of the most relevant factors conditioning the achievements of a green country. Considering the current climate emergency, becoming a green country is crucial for human survival. Consequently, this ultimate goal requires that all of a country’s productive matrix and related productive processes be sustainable. This must be done considering relevant issues regarding for instance sustainability, GSCM, and CE concepts and concerns.
Within the 2030 Agenda for Sustainable Development, in 2015, the United Nations adopted the 17 Sustainable Development Goals [1]. These SDGs may be considered as a novel approach to global governance, representing a novel and unique perspective for defining a set of goals to align to policies [19,20]. Particularly, ref [21] highlights it as a key to achieve sustainable development. Despite the global objective of the SDGs being seen as promoting prosperity while protecting the planet [1], a wide range of other actions can be taken to contribute at different levels with this main objective. Hence, different authors have conducted several pieces of research from different perspectives striving main goal [22,23,24,25]. The authors of [26] perform a systematic literature review to gather information regarding how companies integrate and implement environmental improvements aligned with the SDG and the global value chain. The authors of [27] analyze different methods and applications of analytics in developing countries, considering their specific limitations for achieving SDG. Particularly, this paper is particularly devoted to analyzing productive processes in order to improve sustainability.
It should come as commonplace to consider that the composition of the productive matrix may be different in each country. In any case, the productive matrices can be compared based on their dependency on natural resources [28]. Latin American countries typically base their productive matrices on exploiting and exporting natural resources. However, primary-production-based economy countries (e.g., South African, Latin American, and Oceania Countries) are geographically distributed around the globe. Moreover, primary production-based economies typically export their products without adding considerable value. Over the years, authors have discussed if natural resources abundance is a blessing or a curse for these countries [29,30,31,32,33,34]. Indeed, this discussion is still open considering the dissimilar degree of development of different countries rich in natural resources [33,34,35]. Although most of the authors agree that basing the exports on primary products increases the volatility of the economy, this effect may generate negative implications on the human capital and the investment decisions [36,37]. Additionally, this effect tends to increase the concentration of the wealth in some elites negatively affecting the democratic systems.
Particularly, this paper is set to analyze the specific case of Chile and its economy. This economy is mainly based on primary-production-based industries. Chile is considered as an emerging economy mainly basing its productive matrix on mining, wine, agriculture, aquaculture, and forest [38]. Nevertheless, Chile stands out from the other Latin American countries because of the growth of its economy in the last decades [33,35,37,39]. This rapid growth was encouraged, from 2000 until 2014, by the “commodity supercycle” [40]. Nonetheless, the question that arises is how economic growth can be sustainable in the long term. This question applies to all countries, especially those such as the Chilean economy: It should be clear that it should be based on sustainable development. Based on this, natural-resource-based economies may generate comparative advantages considering their competitors [36,40]. On the contrary, if countries are not aware of sustainability, their respective economies, environments, and societies may fall into catastrophic scenarios [31,37,41,42].
Nowadays, one of the main concerns for countries is economic growth and social development, while being sustainable paired with sustainable development. Therefore, this last development involves addressing the current requirements without compromising the fulfillment of future generations’ needs [29,30,31,33,35,40,43,44]. Countries, as a result, require the alignment of the requirements of all the stakeholders, i.e., governments, policymakers, companies/practitioners, institutions, and society [37,40].
Consequently, natural-resource-intensive companies must manage their wastes and assets considering the potential negative impacts [45]. In this context, CE has become a key concept to guide changes for the prevailing paradigm (i.e., linear economy). It is worth mentioning that CE and GSCM in several aspects aim at a common target from different perspectives. Indeed, CE highlights the relevance of five key elements that require balancing: environmental, economic, logistical, organizational, and marketing performance [8]. Integrating these elements from a traditional GSCM perspective should generate a sustainable interaction among the environment, society, and companies [6].
Based on the literature reviewed, it is possible to state that there is a lack of proposals that integrate these three fields, i.e., sustainability, CE, and GSCM. Moreover, the complexity of the problems requires multidisciplinary approaches for properly addressing them. In addition, each of these three fields aims to significantly contribute from its particular domain, and several authors reflect on the need for the integration of these fields [2,8,9,46,47,48,49]. The integration of these fields may be crucial in order to create synergy among them, their perspectives, and their contributions. Consequently, through integration, it is possible to create interactions among these fields normally addressed separately.
Accordingly, this paper aims at proposing a framework for the assessment of the sustainability of productive processes by computing its GF. The GF is introduced as a new concept that represents the required effort to make a productive process sustainable. Through the application of the framework, it is possible to identify those areas which need improvement in a productive process GF (i.e., reducing the current GF value). The GF is computed considering the criticality of their entries and exits considering three mainstays, i.e., social, economic, and environmental. Additionally, a second objective is the application of this framework to the Chilean case This analysis is performed based on their biggest industries (i.e., mining, wine, agriculture, aquaculture, forest). Even considering that the framework is mainly focused on the analysis of well-defined and specific Macro-Productive Process, the application was applied considering a standard productive process for each industry by considering the production of its more representative product, (i.e., copper, wine, salmon, cellulose, fruits and nuts). After the analysis, it was possible to identify strengths, weaknesses, challenges, and threats for Chile to become a green country. The proposed framework aids to focus on the room for improvements in the sustainability and the global impact of the Chilean economy.

3. Greening Factor Framework Development

This section focuses on presenting in detail the proposed framework. Therefore, the general scope, objectives, procedure, and results are introduced in the following Subsections.

3.1. Objectives

The general objective of the proposed framework is the assessment of how sustainable the productive process (from now on, the Macro-Productive Process) is. For this purpose, the Greening Factor is computed as a measure of the required effort for making the productive process sustainable. After the application of the framework, it was possible to foresee how sustainability in a productive process could be improved, i.e., reducing the GF value. Furthermore, the framework is applicable at different levels of aggregation in the productive processes. Consequently, it can be sequentially applied for identifying the root cause of the current GF performance.
The Macro-Productive Process is defined considering the need of analyzing how sustainable is a specific productive process. Then, the viewer (i.e., modeler or analyst) defines the border of the system considering that all transformation processes are contained in the system.
To achieve the general objective, the proposed framework considers the identification of all the entries (resources), exits (products and emissions), and all the Sub-Productive Processes. These sub-processes are defined as productive processes considered as sub-systems of the Macro-Productive Process (i.e., the system under analysis). Based on the criticality of all entries and exits, the GF for all the Sub-Productive Processes is computed. Finally, based on these GF values, the GF for the Macro-Productive Process is obtained.

3.2. Methodology

The proposed framework considers a four-step methodology, as shown in Figure 1.
  • Step 1 is focused on identifying and analyzing the context of the Macro-Productive Process. During this context analysis, the Macro-Productive Process is considered as a black-box and is focused on identifying all its entries (resources) and exits (products and emissions).
  • Step 2 focuses on identifying and analyzing the Sub-Productive Processes and distinguishing their corresponding entries (resources) and exits (products and emissions). Additionally in this step, the products or emissions that directly exit the system limits (from now on, final products) and the products or emissions that are used as inputs for the other Sub-Productive Processes (from now on, intermediate products) are differentiated.
  • Step 3 aims at determining the criticality of using each entry (resources) and generating each exit (final products). The criticality analysis is made considering a qualitative or quantitative analysis depending on their economic, environmental, and social impact.
  • Step 4 is aimed at obtaining the GF for each Sub-Productive Process and the Macro-Productive Process. The GF for each Sub-Productive Process is computed based on the criticalities determined in the previous step. Finally, the GF for the Macro-Productive Process is obtained based on GFs values of all the Sub-Productive Processes.
The following Sub-Sections are aimed at presenting in detail each of the four steps considered in the methodology.

3.2.1. Macro-Productive Process Context Analysis

Once the Macro-Productive Process is defined, considering the viewer’s perspective and scopes, the first step of the framework is to identify and analyze its context. This analysis is made considering the Macro-Productive Process as a black-box, while mainly focusing on understanding its relationships (i.e., entries and exits flows) with the environment. The black-box approach only allows to aim at the identification of the entries and exits of the Macro-Productive Process without focusing on the details of the considered process. Figure 2 illustrates a generic example for this step.
Initially, the analysis requires a clear definition of the system that will be analyzed, i.e., the Macro-Productive Process. This analysis considers the system as a black-box. Afterward, the analysis aims at identifying all its entries and exits. First of all, to define whether an entry must be considered, the next hypothesis must be true: “Without it, the Macro-Productive Process cannot be done”. Then, to define whether an exit must be considered, the next hypothesis must be true: “It is obtained through performing the Macro-Productive Process”. Once all the entries and exits have been identified, it is possible to understand not only how the entries are processed but also how the exits are obtained. This analysis is performed in Step 2. Additionally, the criticality for each of the entries and exits is computed in Step 3.

3.2.2. Sub-Productive Process with Lanes Analysis

The framework’s second step is “looking inside” or “opening” the black-box defined in the Macro-Productive Process, which has been explicitly shown at this point. As stated before, the Sub-Productive Processes are defined as productive processes considered as sub-systems of the Macro-Productive Process itself. Henceforth, the effort focuses on the identification of all the entries and exist for each one of the Sub-Productive Processes. To continue, the products of these Sub-Productive Processes are classified into two separated sets: final products and intermediate products. On one hand, the final products are those obtained from a Sub-Productive Process that exit the system. On the other hand, the intermediate products are those which are obtained from a Sub-Productive Process that serves as an entry of another Sub-Productive Process. It is important to mention that the set of final products are those in the set of exits identified at Step 1. Additionally, this step considers defining four contextual lanes: entries (i.e., resources), process (i.e., Sub-Productive Processes), intermediate products, and final products. Figure 3 shows a generic example of this step.
It is of paramount importance to point out that identifying entries and exits for each of the Sub-Productive Processes may serve for further application of the framework. As stated before, the proposed framework is focused on identifying areas subject to improvement and achieving the sustainability of the selected Macro-Productive Process. Therefore, it is possible to identify which Sub-Productive Processes are eligible to be boosted (e.g., greater GF value). Consequently, the framework may be applied considering this Sub-Productive Process as the Macro-Productive Process. Hence, the analysis made in Step 2 facilitates applying the proposed framework considering a Sub-Productive Process.

3.2.3. Criticality Analysis

This third step focuses on analyzing the sustainability of the required entries and the resulting exits relying on the three well-known mainstays, i.e., economic, environmental, and social. Each of these three mainstays may be addressed based on a set of variables regarding different relevant aspects. Consequently, a set of variables is considered for each of the three mainstays. However, for further applications of the framework, these sets may be modified in order to incorporate specific issues. The analysis of both the entries and exits is required focusing on social-variables, procurement costs, and the importation and exportation goods. Additionally, it is necessary to signal that the set of variables related to a specific mainstay varies for the evaluation of resources and final products. The impact of consuming a scarce resource indeed is completely different from the impact of generating the same scarce resource. Table 1 presents the set of variables proposed for evaluating the entries and exits for each of the three mainstays. Additionally, the type of each variable is specified, where B represents that the variable is considered as a binary variable, and N represents that the variable is considered taking values in some numeric range.
Economic mainstay:
  • I/E factor: It is a numeric variable based on the resulting ratio between the imports and exports of the country for the specific entry. This variable aims at representing if a specific entry is locally produced or if it is required to be imported.
  • E/I factor: It is a numeric variable based on the resulting ratio between the exports and imports of the country for the specific exit. This variable aims at representing if a specific exit is mainly focused on satisfying the internal demand or external demand.
  • Importer: It is a binary variable taking the value of 1 if the country is a net importer for the specific entry. Otherwise, it takes a value of 0.
  • Exporter: It is a binary variable taking the value of 1 if the country is a net exporter for the specific exit. Otherwise, it takes a value of 0.
Social mainstay:
  • Pollutant: It is a binary variable taking the value of 1 if the specific entry, by itself, generates pollution affecting the society. Otherwise, it takes a value of 0.
  • Vital: It is a numeric variable measuring if the specific entry is required for ensuring the human life and, consequently, society as well.
  • Vitality impact: It is a binary variable representing if generating the specific exits negatively impacts the vitality of society.
  • Pollution degree: It is a numeric variable measuring the pollution generated due to the production of the specific exit.
Environmental mainstay:
  • Renewable: It is a binary variable representing if the specific entry is considered as renewable.
  • Limited: It is a numeric variable measuring the environmental availability of the specific entry.
  • Not-reusable: It is a binary variable representing if the specific exit cannot be reused.
  • Loss degree: It is a numeric variable measuring the degree of loss for the specific exit in terms of reusability.
It is worth mentioning that this step must be performed for all the entries and exits. Therefore, having all the variable values, it is possible to compute the factor that allows determining the criticality of each of them. This factor is computed considering the average of the average values of each mainstay.

3.2.4. Greening Factor (GF) Computation

As stated before, the GF of the Macro-Productive Process is one of the main goals of applying the proposed framework. To achieve this goal, it is required to compute the GF for each of the Sub-Productive Processes. The detailed process is described as follows.
The parameters and set required are:
  • K→: Set of Sub-Productive Processes;
  • Nk→: Set of entries of the Sub-Productive Process k;
  • Mk→: Set of exits of the Sub-Productive Process k;
  • CNk→: Criticality of entry of the Sub-Productive Process k;
  • CMk→: Criticality of exit of the Sub-Productive Process k;
  • FNik→: Impact factor of entry i of the Sub-Productive Process k;
  • FMjk→: Impact factor of exit j of the Sub-Productive Process k;
  • RNik→: Relative factor of entry i of the Sub-Productive Process k;
  • RMjk→: Relative factor of exit j of the Sub-Productive Process k;
  • ARNk→: Average relative entry factor Sub-Productive Process k;
  • ARMk→: Average relative exit factor Sub-Productive Process k;
  • GFk→: Greening factor of sub-productive process k;
  • GF→: Greening factor of the macro-productive process.
The detailed process for computing the GF of the Macro-Productive Process is as follows:
1.
For each Sub-Productive Process k K , compute the relative factor for each entry and exit by multiplying the corresponding criticality and impact factor, as shown in Equations (1) and (2):
R N i k = C N i k F N i k , i N k
R M j k = C M j k F M j k , j M k
2.
For each Sub-Productive Process k K , compute the average relative impact entry and relative impact exit as shown in Equations (3) and (4):
R N k ¯ = i N k R N i k | N k |
R M k ¯ = j M k R M j k | M k |  
3.
Compute the GF for each Sub-Productive Process k K by multiplying its respective average relative entry factor and average relative exit factor as shown in Equation (5):
G F S k = R N k ¯ R M k ¯
4.
Compute the GF of the Macro-Productive Process as the average of the GF values of each of the Sub-Productive Processes, as shown in Equation (6):
G F = k K G F S k | K |

3.3. Framework Limitations

This Subsection is focused on discussing two specific aspects regarding the framework development before moving forward in the case of application:
  • User dependency: There are some qualitative aspects that would be biased by the user criterion. In fact, there are some aspects that are hard to be measured directly in a quantitative manner. Consequently, these aspects may introduce some errors in the results and discussion obtained. However, this source of error may be minimized by relying on either qualitative criteria or several experts.
  • Mainstays variables selection: This proposal is made considering two variables for each mainstay. It should be natural that further development and applications may introduce additional variables considering different aspects related to each mainstay. The current proposal may be suitable for being applied in the considered case of application. However, more specific applications may require adding variables allowing to capture critical aspects in the case considered. Nevertheless, proposing a framework that can be modified depending on the integration of more specific aspects is an advantage of the proposed framework.

4. Chilean Industries and Products Description

This section is focused on describing the case of application considered for the proposed framework. The considered case is based on the Chilean economy. Particularly, the application is made considering the five biggest Chilean industries, i.e., mining, wine, agriculture, aquaculture, and forest. Furthermore, the more representative product is considered for applying the framework, i.e., copper, wine, fruits and nuts, salmon, and cellulose. These industries were selected based on the information available on the Atlas of Economic Complexity [50]. However, service industries such as tourism and travel, transportation, insurance and finance, and information, communication, and technology were excluded from the analysis.
The following Subsections present in detail each of the five biggest Chilean industries and their most representative products. It is important to emphasize that the industry’s descriptions consider a general perspective of each industry. Therefore, specific issues were intentionally excluded so as to represent common aspects of the analyzed productive processes.

4.1. Mining Industry—Copper

The mining industry is one of the most successful industries in Latin America. Specifically, in Chile it represents approximately 9% of direct and indirect works force throughout the country [51], also it has contributed to a 547% increase in the gross domestic product from 1990 to 2017. Within its variety of products, copper is the most exported considering its relevance for several productive processes belonging to different industries through all the world. Furthermore, copper represents 50% of Chilean mining industry exports, and this production is equivalent to 34% of world consumption approximately [51]. Considering all the related products, more than 470 thousand metric tons are produced in a year. All this production represents USD 31,831.2 million Free On Board (FOB) as the transaction price. Chile bases almost 50% of its productive matrix on exporting copper and related products and sub-products [52]. Consequently, mining copper is the most significant Chilean industry.
The copper production process typically consists of four sub-processes, i.e., extraction, processing, foundry, and refinement. There are, of course, differences among the implementation of these processes in different companies within this industry. For instance, CODELCO, the biggest company in the Chilean mining industry, specifies operations related to each process, such as prospection and exploration, planning and construction, and concentrate extraction [53]. In order to analyze common aspects among all the companies, these specific aspects were excluded from the analysis.
Considering the relevance of the mining industry, the Chilean government introduced the National Mining Policy 2050, or Política Nacional Minera 2050 (PNM2050) for its name in Spanish [54]. This policy aims at planning short-, medium-, and long-term actions for enhancing the mining industry as an engine for Chile’s expected sustainable development. This policy is based on the participation of several stakeholders, such as policymakers, communities, practitioners, experts in several related aspects, and entrepreneurs. Specifically, from a sustainability perspective, CODELCO—the biggest company in the Chilean mining industry—invested USD 644 MM in order to observe environmental constraints. Regarding the social mainstay, the company has implemented strategies for improving the communication with communities for managing different related risks. It is valuable highlighting that different companies in the Chilean mining industry have implemented several actions in the same lines above described. Additionally, this industry offers most of the highest salaries and the biggest sources of income in Chile.

4.2. Wine Industry—Wine

Chilean wine is one of the most acclaimed and awarded wines worldwide. The wine industry represents 2.25% of total exports for Chile [50]. Additionally, wine companies also have a relevant positive impact on the tourism industry. Chile is the fourth-largest exporter worldwide, producing around 1.200 million liters yearly [55]. Furthermore, in 2019, around 869 million liters were exported approximately [56]. Chilean wine, due to its characteristics and processes, is labeled in different wine strains. The most exported varieties are Cabernet Sauvignon with 28.7% and Sauvignon Blanc with 13.9% of total exports [57].
Chile allocates nearly 141 thousand hectares of land for wine production [58] and the development of different production and cultivation areas. This decision has enhanced the working levels positively impacting the Chilean economy with a high sustainable impact in all processes. Nowadays, there are close to 60 certified vineyards with sustainability code certification [57]. This sustainability certification code specifies that vineyards have enough potential to preserve ecosystems and biodiversity in their respective zones. Chile has approximately 401 vineyards that export wine, where the Concha y Toro business has the biggest percentage of participation with nearly 19% [59].
The wine industry employs almost 55.000 skilled workers. This training and specialization are part of the curriculum in 12 high schools across Chile. Indeed, wine companies normally maintain communication channels with local communities [58].
Wine production considers different processes, such as vineyard preparation and growth, harvesting grapes, destemming, squeeze, and wine post-processes. Depending on wine color or wine variety, detailed sub-processes are different, e.g., reception, grinding and weighting, selection, and wort squeeze, then it continues with fermentation or maceration for winemaking and packing [59]. In other cases, the processes are vineyard preparation, grapes production, wine production, distribution, and at last marketing and sales [60,61].

4.3. Aquaculture Industry—Salmon

Aquaculture is one of the industries with more ocean exports and imports, connecting a number of countries worldwide. Particularly, Chile exports 4.075% of this world consumption during the first trimester of 2020, with USD 645.520 MM FOB [38]. Chile has become the second biggest salmon producer in the world, after Norway, and it supplies to more than 100 international markets [62]. Consequently, salmon is the most significant product of the Chilean aquaculture industry, which represents almost USD 4.688 MM in transactions, and 84.3% of Chilean aquaculture industry exports in 2019 [38].
Sustainability related to fish production is not only regulated by governmental programs and entities but also by international regulations and agreements in this area. These internal regulations are linked to social issues since they specify a safety distance between communities and producing fish locations. The aquaculture industry exports represent 6.2% of the total Chilean exports [52].
Salmon production goes through a range of processes, such as spawning, fertilization, incubation and hatching, breeding and smoltification, sea cultivation, and finally harvest. The process begins by obtaining the breed so these can produce eggs and sperm. Then, eggs are fertilized, incubated, until they hatch. The process continues with freshwater breeding until fishes are ready to be moved into a seawater habitat to continue the breeding process. Finally, when the growing process is complete, breeds are harvested and fishes are divided for sold and reproduction processes [63].

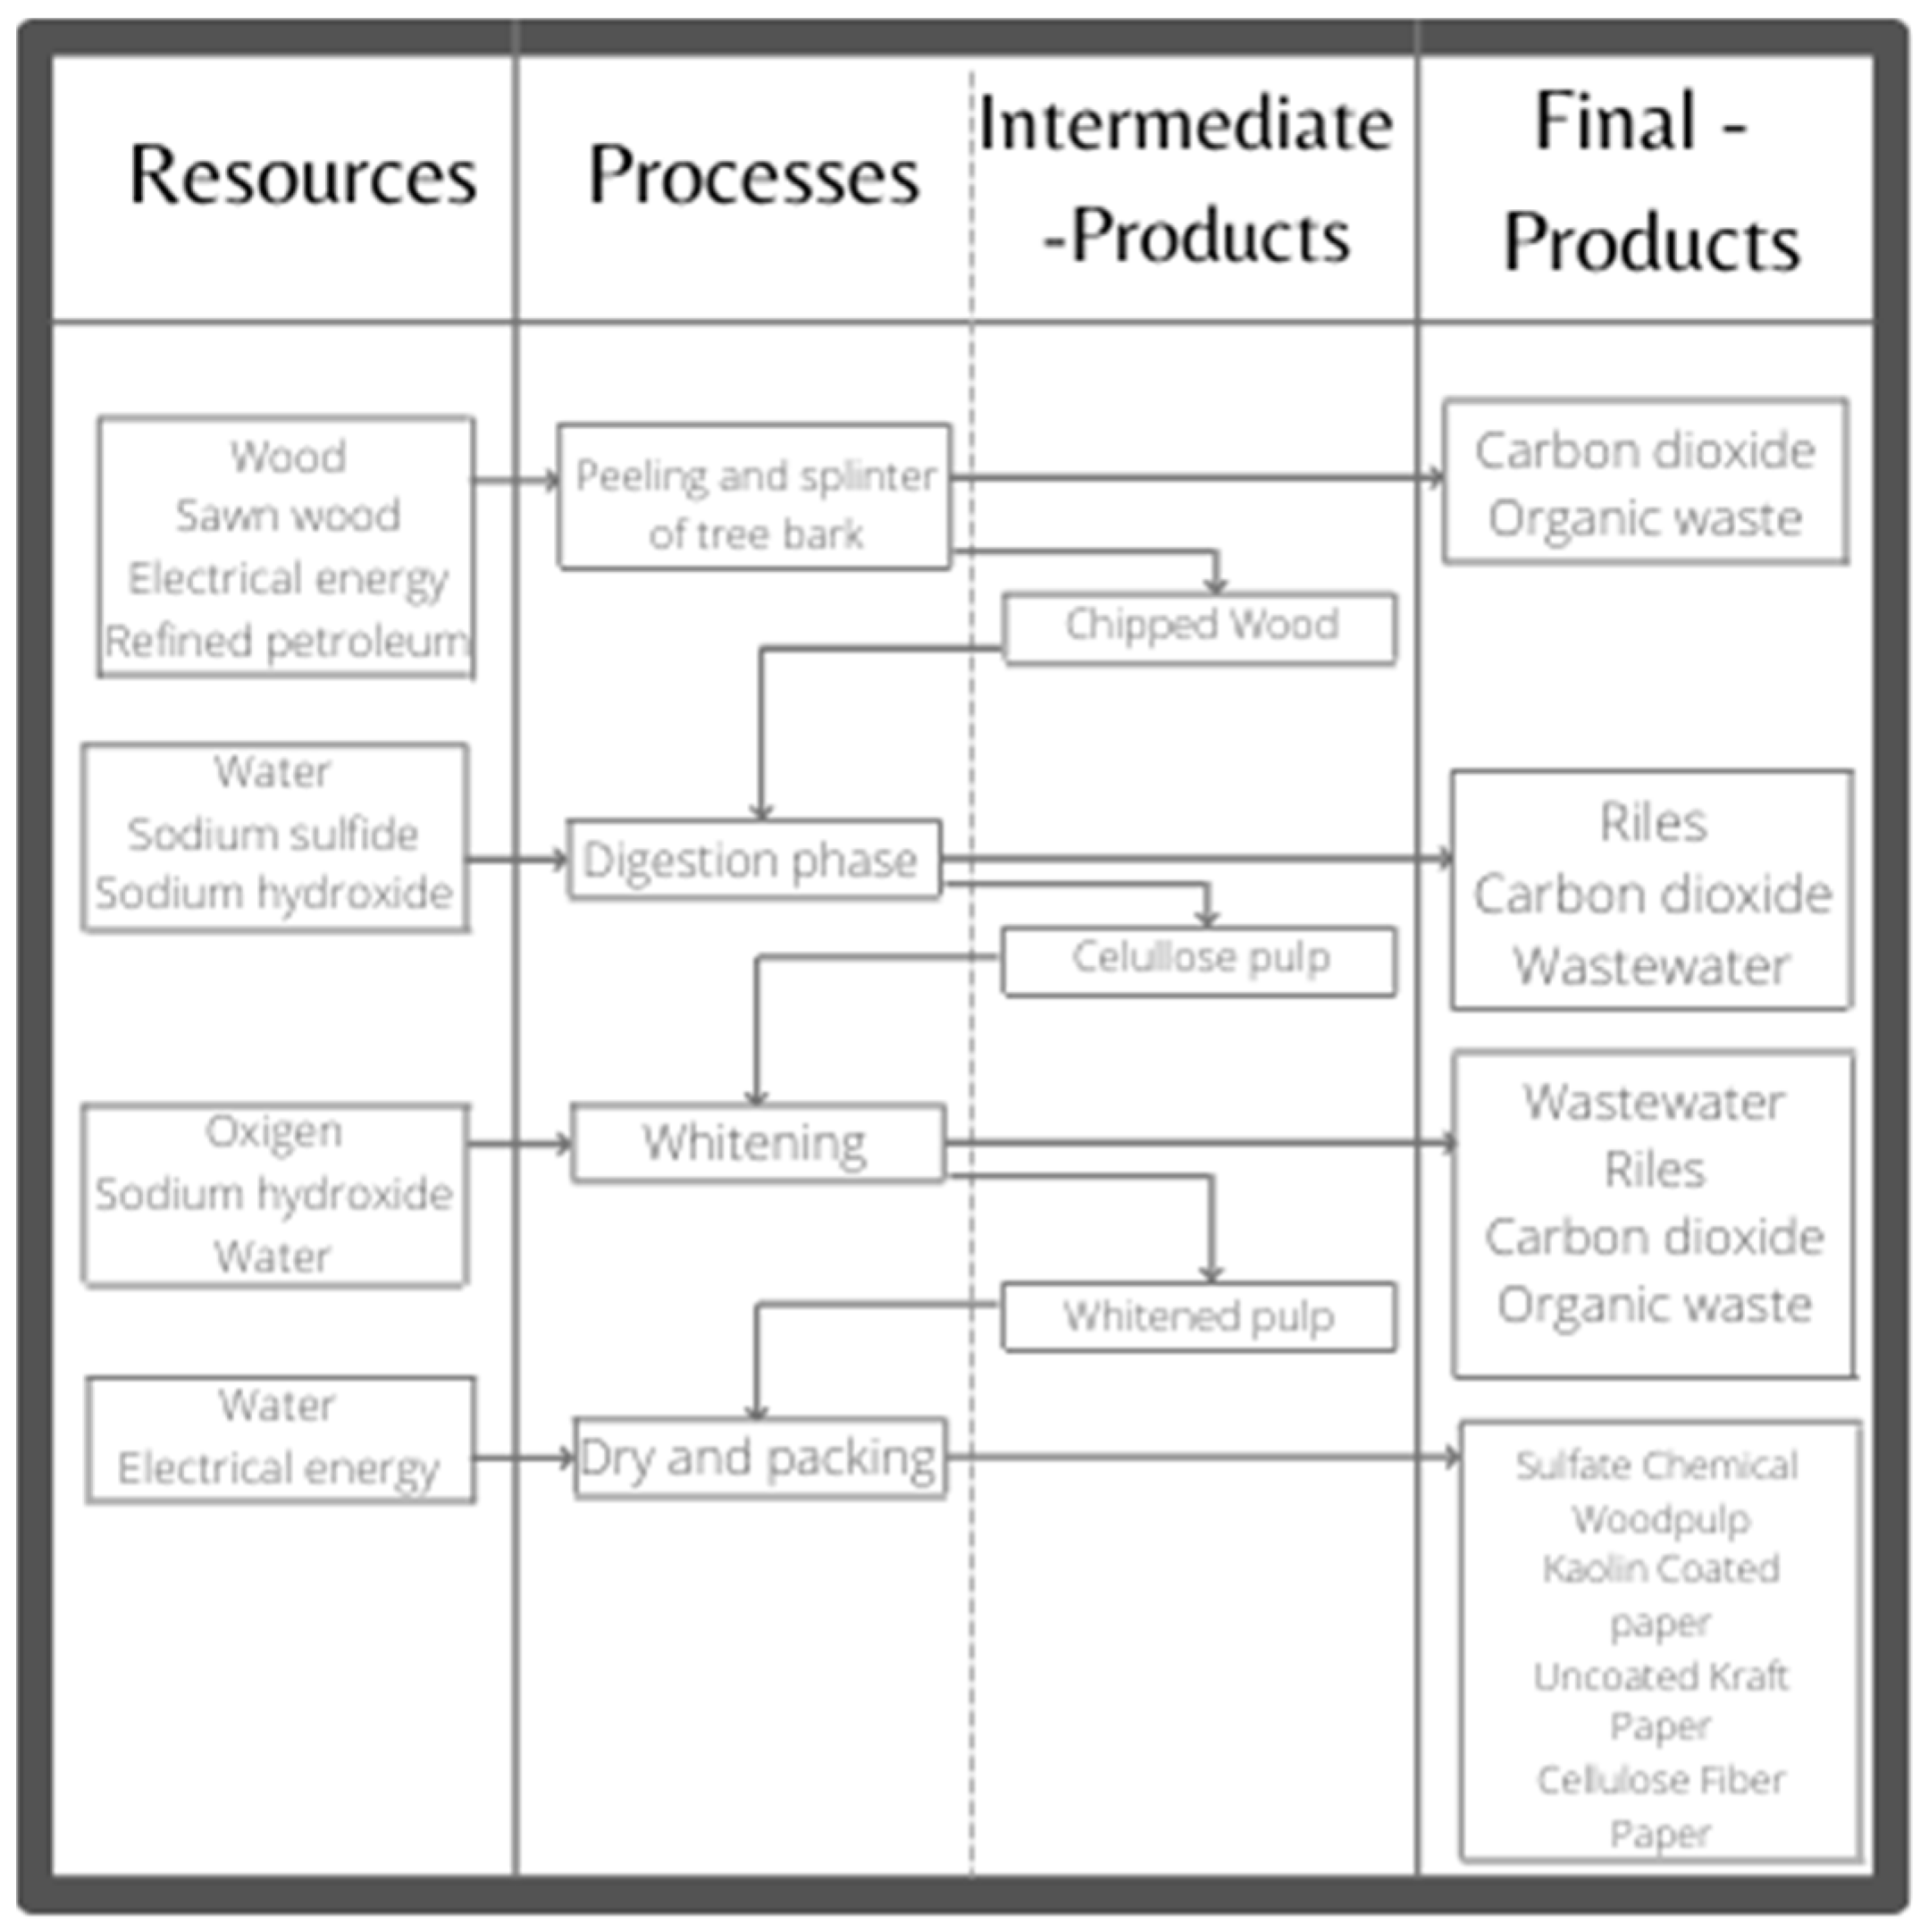
4.4. Forest Industry—Cellulose

All products in the forest industry have a great demand worldwide. In Chile, this industry uses around 48 million solid cubic meters of wood [64]. The main product that stands out for the country is Sulfate Chemical Woodpulp (SCW) due to the high levels of national exports (USD 3.71 B). Chile has become the third-largest exporter country worldwide [52]; in fact, SCW represents nearly 5% of total Chilean exports.
Deforestation and sustainability may be typically considered the opposite. Consequently, policies and strategies have been discussed and implemented through the years. Some of these policies and strategies are green bonds, forest certification for sustainable management of crops, and sustainable handling of endemic forest species [65].
Among the types of wood pulp, we can find Bleached Softwood Kraft Pulp (BSKP), Bleached Hardwood Kraft Pulp (BEKP), Unbleached Radiata Pine Pulp (UKP), and thermodynamic cellulose with higher production. The productive process to obtain these products are typical peeling and splinter of tree bark, digestion phase, whitening, and dry and packing. Specifically, there is special care for large species from their cultivation until the wood is chopped. These processes have different alternatives, such as a splint, sawmill, pulp, boards and veneers, poles, and idlers for primary industry.

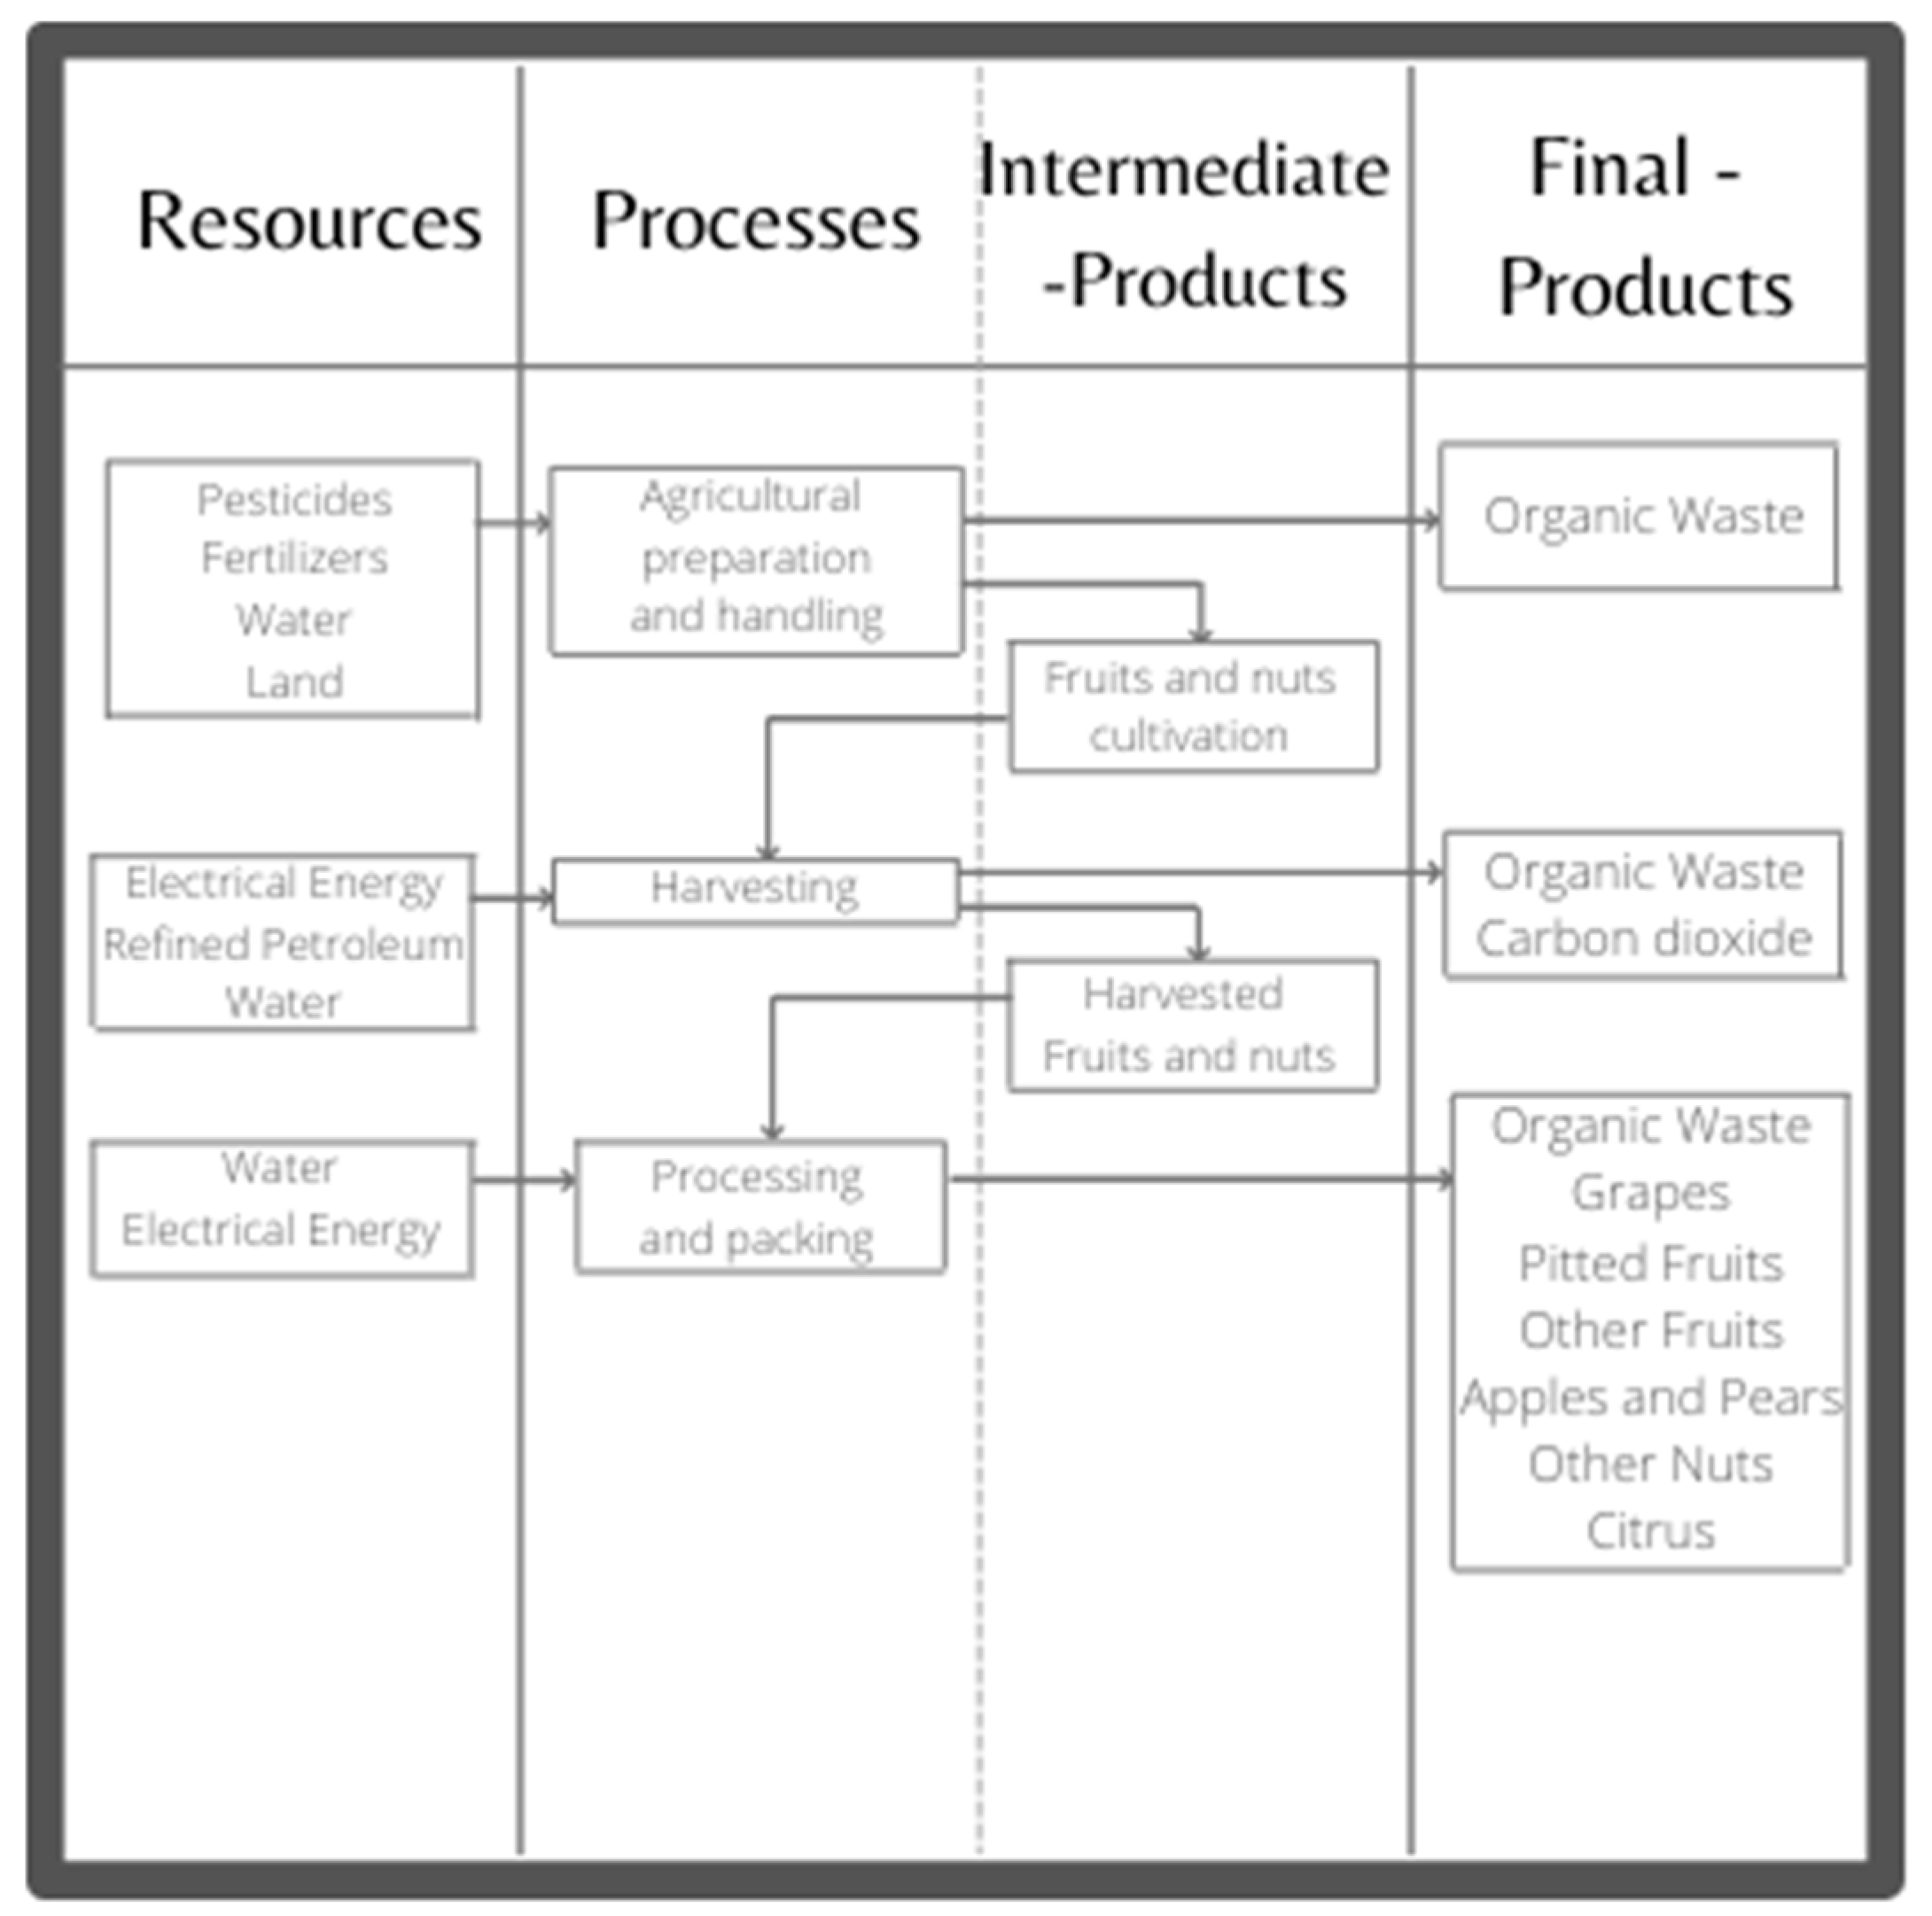
4.5. Agriculture Industry—Fruits and Nuts

The fruit and nuts industry represents nearly USD 125 B yearly [52]. Specifically, Chile has become a relevant producer and exporter of fruit and nuts industry products. These exports are close to USD 6 B FOB [38]. Exports related to this industry represent almost 8% of total Chilean exports [52].
Within this industry, grapes are the most important product in Chile. The main importer countries are the ones from the northern hemisphere, importing products such as dry grapes, white and black raisins, natural grapes, and also wort from these [38]. This is because grapes are easier to grow in template climates with Mediterranean characteristics, such as warmer summers or colder and rainier winters, such as the central regions of Chile.
Sustainability is a relevant problem within this industry. For instance, the land recovery program of the Chilean Agriculture Minister is aimed at recovering agricultural lands degraded [58]. Regarding social mainstay, the Sustainable Agriculture Plan was signed by different organizations focusing on recognizing human rights, working conditions, social protection, trackability, and continuous relationships with local communities [55].
Considering the variety of products of this industry, there are differences in the implementation of the productive processes. Nevertheless, it is possible to find congruities among productive processes in this industry, such as agricultural preparation and handling, harvesting, and processing and packing. To illustrate this, the process to obtain grapes is simple. First, there is a schedule in crop areas and there is a clear protocol in the process, considering, for example, irrigation cycles. When the growing process is complete, including pruning and branch cares, the grapes are harvested. The next step is to select the fruit, while the selection is prepared for direct export, the non-selected fruit continues the productive process, for specific treatments. The process is complete once derived products such as jelly, wort to export, raisins, and canned products are ready [66].

5. Framework Applications: Chilean Case

This section is aimed at presenting the applications considering the aforementioned five biggest Chilean industries. However, before going into detail with each application, some general considerations are necessary.

5.1. General Considerations

This Subsection focuses on presenting some general considerations for each of the five applications carried out. These general considerations may allow us to better understand some assumptions and limitations of the applications.
  • It is important to remind the reader that the proposed framework is focused on its applications to analyze a specific Macro-Productive Process. In this case, the application focuses on analyzing Chile’s potential of becoming a green country. This analysis is conducted by analyzing the five biggest Chilean industries. Based on the obtained results, it is possible to estimate how much effort is required for Chile to become a green country.
  • Further applications of the framework may be applied by analyzing productive processes of a specific organization within each of the industries. These applications may include more specific problems excluded from the presented analysis considering only common aspects of each industry.
  • As it has been mentioned, the applications shown in the following Subsections focus on analyzing the five biggest Chilean industries. Consequently, the information used to define the Macro-Productive Processes and its respective Sub-Productive Processes is based on the commonalities among the different companies within each industry.
  • Following the previous consideration, applications do not take into account specific aspects regarding the inbound logistics processes of the resources (import processes) and the outbound logistic processes of the products (export processes). These aspects (and other specific ones) should be considered in further applications of the framework analyzing specific Macro-Productive Processes.
  • The criticalities for each entry and exit are the same regardless of the industry where either it is consumed (resources) or produced (emissions and products). For instance, water has the same criticality, even when consumed in different industries, as shown in the following Subsections.
  • Intermediate products are not considered as exits or final products for the analysis made for each industry. This assumption should be easily understood considering that intermediate products do not cross the system (Macro-Productive Process) border. This assumes that all the intermediate products generated are consumed by another Sub-Productive Process.
  • The data used for computing both the I/E and E/I factors were obtained from [52] as shown in Appendix A and Appendix B, respectively;
  • As mentioned in Section 3.3, the proposed framework is user-dependent in determining some qualitative scales and their respective values. The applications shown in the following Subsections are:
    1.
    Both I/E and E/I factors are classified based on the following ranges:
    E / I   or   I / E = { not   applicable , 0 [ 0 ; 1.5 ] , 1 [ 1.5 ; 5 ] , 2 [ 5 ; ] , 3
    It is considered as not applicable when the specific entry or exit is not internationally tradable (total imports and exports are zero);
    2.
    As described, the criticality factor is computed based on the variables for each of the three mainstays. Based on these values, the criticality factor takes values in [0;2], and it is classified as low, medium, or high, assigning 1, 2, and 3, respectively. The classifying criteria are:
    C N   or   C M = { [ 0 ; 2 / 3 ] , 1 [ 2 / 3 ; 4 / 3 ] , 2 [ 4 / 3 ; 2 ] , 3
    3.
    For the sub-productive processes and the macro-productive process, the GF takes values in [1;81], and it is classified as low, medium, and high as follows:
    G F = { [ 0 ; 27 ] , low [ 27 ; 54 ] , medium [ 54 ; 81 ] , high

5.2. Copper’s GF Computation

In this case, the Macro-Productive Process is the process for obtaining the main products derived from copper. The considered Macro-Productive Process has four Sub-Productive Processes, i.e., extraction, processing, foundry, and refinement. This application is presented following each step of the proposed framework.
  • Step 1: Macro-Productive Process context analysis
The context analysis for the copper Macro-Productive Process shows that the set of entries is composed of water, electrical energy, air pump, refined petroleum, salt and others, cyanides and others, polyvinyl chloride, and sulfuric acid. The set of exits is composed of blasting, ballast, carbon dioxide, dust in air, gravel and crushed stone, tailings, raw copper, slag and others, copper ore, wastewater, and refined copper.
The copper production process is intensive in using machines that require petroleum and electric energy. Moreover, this process is also intensive in using water throughout the entire process. Additionally, the analyzed Macro-Productive Process tends to generate undesirable products such as carbon dioxide and wastewater, negatively impacting the environment and society.
  • Step 2: Sub-Productive Process with lanes analysis
The sub-productive process with lanes analysis for copper is shown in Figure 4.
In addition to desirable products, these processes generate a range of undesirable products, such as “slag and others”, that are exported and sold mainly to China and Japan [52]. Considering the current state of development of the industry, a range of products are not processed in Chile and are sold as waste. However, with appropriate technology, it is possible to process the slag for obtaining copper and other relevant minerals.
  • Step 3: Criticality analysis
A criticality analysis was performed on all the considered entries and exits of the copper productive process. The criticality for each entry and exit is shown in Table 2.
The detailed data and results for the criticality of the entries and exits are shown in Appendix A and Appendix B. All the entries and exits are classified with medium (2) and high (3) criticalities.
  • Step 4: GF computation
The GF for the copper Macro-Productive Process is shown in Table 3.
Based on the information shown in Table 3, the GF value for the Copper Macro-Productive Process is 56.46. Only the foundry sub-process performs a medium GF (49.00). Based on the results, the copper productive process performed a high GF value. Consequently, high efforts for the copper production process to become sustainable are needed. Moreover, based on the results, the extraction sub-process requires the greatest effort among all the four Sub-Productive Processes to improve (reduce) the GF value.

5.3. Wine’s GF

In this case, the Macro-Productive Process represents the process to obtain wine, which considers three Sub-Productive Processes, i.e., vineyard preparation and growth, harvesting grapes, destemming and squeezing, and wine post-processes. This application is presented following each step of the proposed framework.
  • Step 1: Macro-Productive Process context analysis
The context analysis for the wine Macro-Productive Process shows that the set of entries is composed of pesticides, fertilizers, water, land, electrical energy, and refined petroleum, and the set of exits is composed of wine and organic waste.
For this kind of agricultural productive process, water is a critical resource. Additionally, depending on the specific context where the wine is produced, land may be considered a critical resource.
  • Step 2: Sub-Productive Process with lane analysis
The Sub-Productive Process with lanes analysis for wine is shown in Figure 5.
The sub-productive processes, in addition to wine, generate organic wastes, which may be easily treated for disposal but also for their reuse. The main concern is the use of water through these processes.
  • Step 3: Criticality analysis
A criticality analysis was performed for all the considered entries and exits of the wine production process, as shown in Table 4.
The detailed data and results for the criticality of the entries and exits are shown in Appendix A and Appendix B. Almost all the criticalities obtained were medium (2). However, the use of water and refined petroleum showed a high criticality (3).
  • Step 4: GF computation
The GF for the wine macro-productive process is shown in Table 5.
Two of the three Sub-Productive Processes perform a medium GF (vineyard preparation and growth and harvesting grapes, destemming, and squeezing). Additionally, the wine post-processes performed a low GF, and the wine Macro-Productive Process showed a medium GF value (30.17). In this vein, improving water, lands, and refined petroleum usage may be the key to improve (reduce) the GF value obtained.

5.4. Salmon’s GF

In this case, the Macro-Productive Process represents the process to obtain the main products derived from salmon. This Macro-Productive Process considers four Sub-Productive Processes, i.e., spawning, fertilization, incubation and hatching, breeding and smoltification, sea cultivation, and harvest. This application is presented following each step of the proposed framework.
  • Step 1: Macro-Productive Process context analysis
The context analysis for the salmon Macro-Productive Process shows that the set of entries is composed of iodine, antibiotics, electrical energy, refined petroleum, water, and animal meal and pellets, and the set of exits is composed of organic waste, carbon dioxide, wastewater, fish fillets, non-fillet frozen fish, and non-fillet fresh fish.
This kind of process mainly depends on the growth for obtaining adult fishes. However, this context analysis allows the identification of antibiotics as an entry for the process. Chilean salmon products have been criticized for the level of antibiotics present in salmon products. Most of this criticism considers more strict standards of specific markets and legislations, as it is hard to evaluate the contamination and the negative impact that this process may generate in the locations where salmon products are produced. Moreover, it is difficult to assess the potential negative impacts of the accumulation of food leftover in the sea bottom. This may be impacted by changing the water quality and the life of plants and animals.
  • Step 2: Sub-Productive Processes with lanes analysis
The sub-productive process with lanes analysis for salmon is shown in Figure 6.
Considering the level of details shown in Figure 6, it is possible to confirm that antibiotics are used in three out of the four sub-productive processes. Additionally, it is possible to notice that carbon dioxide, organic waste, and wastewater are generated in all four Sub-Productive Processes.
  • Step 3: Criticality analysis
A criticality analysis was performed for all the considered entries and exits of salmon production process. The criticality for each entry and exit is shown in Table 6.
The detailed data and results for the criticality of the entries and exits are shown in Appendix A and Appendix B. The criticality analysis confirms that antibiotics perform a high criticality (3) and that almost all exits perform a high criticality (3).
  • Step 4: GF computation
The GF for the salmon macro-productive process is shown in Table 7.
All the four Sub-Productive Processes perform a high GF. Consequently, the Macro-Productive Process showed a high GF value (54.06). In this case, harvest is the sub-process that requires more effort to improve (reduce) its GF value.

5.5. Cellulose’s GF

The macro-productive represents the productive process for obtaining main products derived from cellulose. This Macro-Productive Process considers four Sub-Productive Processes, i.e., peeling and splintering of tree bark, digestion phase, whitening, drying, and packing. This application is presented following each step of the proposed framework.
  • Step 1: Macro-Productive Process context analysis
The context analysis for the cellulose Macro-Productive Process shows that the set of entries is composed by wood, sawed wood, electrical energy, refined petroleum, sodium sulfide, sodium hydroxide, and oxygen, and the set of exits is composed by organic waste, riles, carbon dioxide, wastewater, sulfate chemical woodpulp, kaolin coated paper, uncoated kraft paper, and cellulose fiber paper.
This Macro-Productive Process is intensive in wood, water, and chemical products usage. For this, land is essential to plant trees to later produce wood. This process is also intensive in water usage. Additionally, due to the nature of the specific processes for cellulose production, this process is intensive in using chemical products. Using these chemical products also generates undesirable products, such as riles, that are hard for processing for enabling its reuse.
  • Step 2: Sub-Productive Processes with lanes analysis
The Sub-Productive Process with lanes analysis for cellulose is shown in Figure 7.
As mentioned above, the cellulose productive process is intensive in using water. At this level of detail, it is possible to notice that Sub-Productive Processes generate loss of organic matter, especially in the first three Sub-Productive Processes. Additionally, the fourth Sub-Productive Process mainly focuses on producing the main products derived from cellulose.
  • Step 3: Criticality analysis
A criticality analysis was performed for all the considered entries and exits of cellulose Macro-Productive Process, as shown in Table 8.
The detailed data and results for the criticality of the entries and exits are shown in Appendix A and Appendix B. Among all the entries, petroleum and water perform high criticalities (3). Among the exits, carbon dioxide, riles, and wastewater are undesirable products which showed high criticalities (3).
  • Step 4: GF computation
The GF for the cellulose Macro-Productive Process is shown in Table 9.
Water is an entry which is present in almost all the Sub-Productive Processes. Additionally, two of these processes generate riles and wastewater that may negatively affect the environment and the society. With these factors, the cellulose GF value is 46.45 (medium).

5.6. Fruits and Nuts’ GF

In this case the Macro-Productive Process represents the productive process for obtaining the main products derived from fruits and nuts. This Macro-Productive Process considers three Sub-Productive Processes, i.e., agricultural preparation and handling, harvesting, and processing and packing. This application is presented following each step of the proposed framework.
  • Step 1: Macro-Productive Process
The context analysis for the fruits and nuts Macro-Productive Process shows that the set of entries is composed of pesticides, fertilizers, water, land, electrical energy, and refined petroleum; the set of exits is composed of organic waste, carbon dioxide, grapes, pitted fruits, other fruits, apples and pears, other nuts, and citrus.
In addition to land and water, the fruits and nuts production process uses pesticides. The use of pesticides may negatively affect the environment and human health and may in turn affect the acceptance of generated products in markets with stricter criteria for accepting products. This Macro-Productive Process generates a great variety of products.
  • Step 2: Sub-Productive Processes with lanes analysis
The Sub-Productive Process with lanes analysis for fruits and nuts is shown in Figure 8.
At the beginning of these processes, land and water resources are critical entries for production. Later, water remains as a critical entry in the following Sub-Productive Processes. Among exits, only carbon dioxide is a clear negative effect for the environment.
  • Step 3: Criticality analysis
The criticality for each entry and exit is shown in Table 10.
Among all entries and exits, only water, refined petroleum, and carbon dioxide showed high criticality (3).
  • Step 4: GF computation
The GF for the fruits and nuts Macro-Productive Process is shown in Table 11.
Among all the Sub-Productive Processes, agricultural preparation and handling demonstrated a medium GF (34.50). The other two Sub-Productive Processes showed a low GF. Additionally, Macro-Productive Process performed a low GF value (26.67).

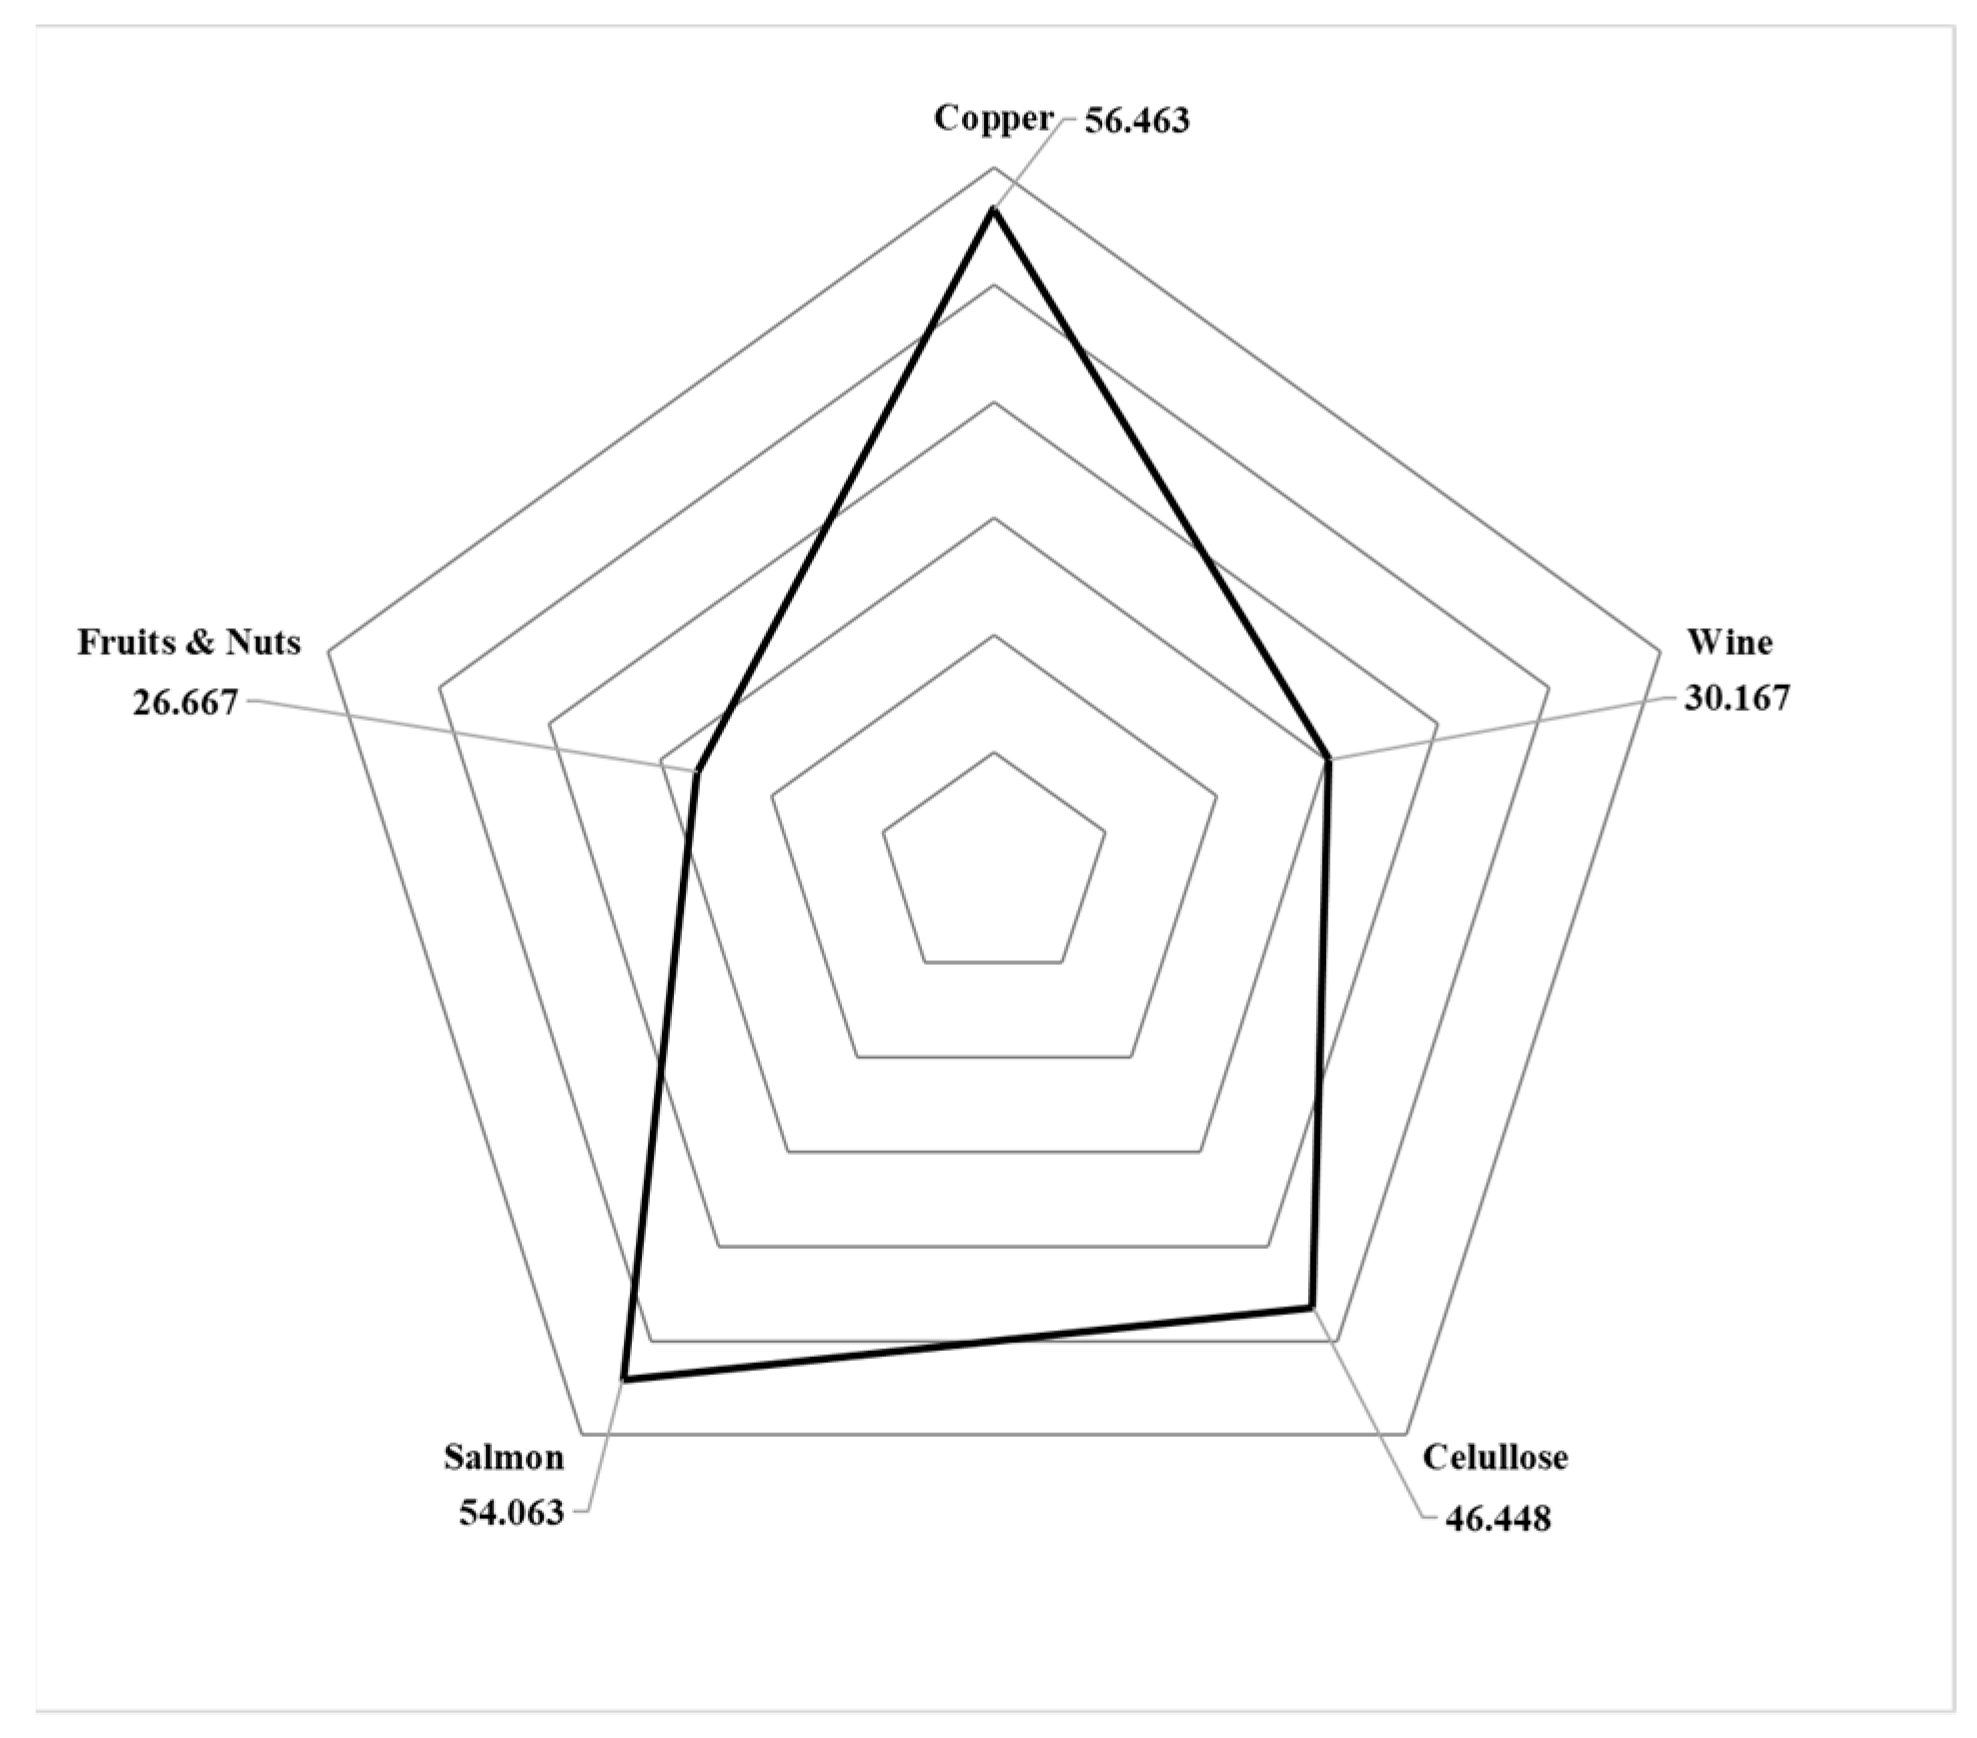
6. Results Analysis and Managerial Insights

This Section is focused on analyzing the results obtained in all five cases shown in the previous Section. Table 12 presents a summary of the results obtained for all the five industries analyzed; the column Weights represents the relative sizes of each industry in the Chilean economy based on the exportations of each product [52]. The Average country represents the average among all the GF values of each of the five industries. The Sum of weights represents the sum of the weights of the five industries analyzed. Finally, the Normalized weighted average country represents the weighted average after normalizing the weights of the five industries (i.e., dividing the weights of each industry by the Sum of weights). In the light of this, it is assumed that the Chilean economy is only composed of the five industries under analysis. This assumption can be made without loss of generality considering that the originally proposed analysis assumes that these five industries represent the Chilean economy and its productive matrix.
It is important to clarify that the average GF value of Chile (42.76) is not the best way for estimating the efforts required for considering Chile as a green country. Instead, the weighted average is a better estimation of the effort that Chile required for becoming a green country (51.34). It should be noted that this result is mainly determined by the relative weight of copper (0.474) and its GF value (56.46).
A high GF value represents high efforts to consider the Macro-Productive Process as a sustainable one. Figure 9 shows how much effort is required for each Macro-Productive Process. The distance from the center can be understood as the required effort to become sustainable. Thus, if an industry is close to the center, the effort required for becoming sustainable will be low. In this line, the copper productive process performs the highest GF value followed in decreasing order by salmon, cellulose, wine, and fruits and nuts.
Even though the GF of the Macro-Productive Process directly depends on the GF values of its Sub-Productive Processes, the dispersion among them may help to determine a strategy to improve its sustainability. This potential improvement depends on improving the GF values of its sub-processes. The box and whisker graph considering the results of all the Sub-Productive Processes for each industry is shown in Figure 10 as follows.
Fruits and nuts and salmon have a higher dispersion among the GFs values of their Sub-Productive Processes, while copper, wine, and cellulose have a lower dispersion. Consequently, different strategies may be implemented in order to improve the GF of the productive process. On one hand, the salmon productive process considers four sub-processes where the greater GF value was 64.00 (harvest), while the GF of the Macro-Productive Process was 54.06. Thus, focusing on improving the harvest GF may lead to a marked improvement in the GF of its Macro-Productive Process. On the other hand, productive processes showing a lower dispersion may require improving all the Sub-Productive Processes in parallel. Nevertheless, considering the mode through which GF is computed, by only improving one of the Sub-Productive Processes’ GF, it could be possible to achieve a significant improvement on the GF value.
Additionally, based on the application of the proposed framework, it is possible to identify which of the Sub-Productive Processes can have the greatest improvement. As discussed earlier, one of the attributes that should be brought to attention is that this framework can be applied taking into account the Sub-Productive Process as a Macro-Productive Process. This in-depth and sequential application of the framework may allow to identify critical aspects of the productive process that may have not been identified in previous applications of the framework. This application may be applied in parallel to each of the Sub-Productive Processes in order to identify all the critical aspects within the original Macro-Productive Process.
Based on the applications, it is possible to identify some dependency of most of the Macro-Productive Processes on lands, water, and refined petroleum. In other words, the dependence on these resources may translate into increasing GF values. On one hand, using water should be critical not only in the Chilean context as this resource is considered to be scarce, and it will be a critical asset in the future. On the other hand, using refined petroleum generates an external dependency for Chile on other countries producing and selling this resource. Additionally, there are clear negative environmental effects of dependence on fossil fuels and the production of several gases. It is not easy to replace these resources for less critical and contaminating ones. However, all efforts should be made to reduce their use and negative impacts on the environment and society. In this line, several initiatives for using desalinated water instead of water have increased in numerous industries and countries. The increasing efforts for incrementing the dependency on clean and renewable energies is another significant illustration of alternatives that must be encouraged. These should serve as examples of the enterprise to improve the sustainability of several production processes in different industries all around the world.
In this vein, an interesting analysis is to measure the impact of a single (relevant) factor in the GF value of the Macro-Productive Process. As mentioned before, water is a critical resource for almost all the analyzed Macro-Productive Processes. Thus, in the analyzed case, this specific resource performed a high criticality (3). Among all the analyzed industries, the copper productive process showed the highest GF value. Consequently, it is relevant to measure the impact of water on this productive process. This analysis was made by varying the criticality level of water and maintaining all the other values fixed. Table 13 shows the sensitivity analysis for copper GF value for different potential values of water criticality.
It is remarkable that varying the criticality from high (3) to medium (2) criticality, the greening factor value varies by 8.43%. By varying the criticality from high (3) to low (1) criticality, the greening factor value varies by 16.88%. Although it is evident how difficult it is to change the criticality for a specific resource or product in a fixed context, this analysis may represent alternative resources that can replace the use of water performing lower criticalities. For instance, using desalinated water in the copper production process. Nevertheless, it is imperative that these alternatives be evaluated not only from an economic perspective.

7. Conclusions and Future Research

This paper presented a novel framework to evaluate the sustainability of productive processes in different industries. The proposed framework integrates aspects regarding CE and GSCM. The GF is proposed for measuring the required efforts for making sustainable the productive process. Consequently, a high GF value implies that greater efforts are required to become sustainable. The proposed framework is aimed at supporting sustainable development by identifying critical aspects that should be improved (GF value reduction) to become sustainable. Integrating CE and GSCM enables the inclusion of traditionally excluded elements from a classical sustainable perspective.
However, based on the considered application case, more detailed applications of the framework may allow to include more specific issues regarding GSCM and CE. Further developments and specific applications of the framework may give special attention to defining all the qualitative and quantitative criteria in the methodology of the framework. The applications shown consider qualitative classification based on three classes, i.e., high, medium, and low. This classification leads to the categorization of a wide range of values in the same class. Adding more classes, e.g., very low, low, medium, high, and very high, may help to avoid this problem, but it might make this harder to implement.
Improving the GF for a Macro-Productive Process requires efforts to reduce the GF values of each Sub-Productive Process. Additionally, this potential improvement must be based on a continuous review and enhancement of aspects regarding the three considered mainstays, i.e., social, environmental, and economic. Consequently, to improve the greening factor value, a systemic scheme was systematically implemented. A depth and sequential application of the framework may allow the identification of critical aspects of the productive process that may not have been identified on the previous applications of the framework. Naturally, this sequential application of the framework may be conducted in parallel for each of the Sub-Productive Processes to identify all the critical aspects within the original Macro-Productive Process.
From the System Theory’s perspective, this scheme of sequentially applying the framework allows one to systemically understanding the productive process under analysis and to generate a systemic indicator of how sustainable the system is. This systemic understanding allows linking the macro and micro of the different critical features within the Macro-Productive Process. This is clearly reflected on the GF as a systemic indicator of the required effort to make a specific productive process as sustainable as possible.
On one hand, relevant improvements may be achieved by paying careful attention to CE aspects. These aspects are relevant in different contexts, but especially in the Chilean case. Particularly, conceiving a solid CE perspective at all levels allows identifying possibilities to improve by rethinking how sub-products and even nondesirable products may be handled to reduce loss and enhance reuse schemes. On the other hand, GSCM aspects may generate improvements related to the implementation of inbound (import) and outbound (export) logistics. Traditionally, implementing the GSCM allows for focusing on reducing negative impacts on the society and the environment of transport operations. However, the GSCM requires fulfilling economic goals defined by organizations. Consequently, integrating CE and GSCM aspects into the traditional sustainability perspective generates synergic relationships, empowering the positive impacts of each of these topics being implemented in an isolated manner.
It should be clear that managers may use the proposed framework for identifying room for the improvements of the analyzed productive processes. In this context, these improvements imply a systematic reduction in the GFs. However, some questions may arise regarding the reduction of the analyzed GFs, such as:
  • Which is the optimal value for the GFs?
  • Is it possible to completely reduce all the GFs?
  • Does the optimal value for the GFs depend on the specific case analyzed?
These questions do not have a unique answer. Nevertheless, they must be addressed in each application case, considering relevant aspects related to the specific context where the framework is being applied, and which is the group of people that will answer these questions. For instance, it is difficult to compare the greening factors of copper and wine, as part of the results obtained in the applications shown above, major differences arise related to the nature of the products. On one hand, copper is a mineral that is not renewable and thus shows a finite horizon for its extraction. On the other hand, wine may have an infinite horizon for its production, and we may assume that it is possible to conserve the main resources required in the obtention process. Consequently, there may be several differences in critical aspects conditioning the potential GF reduction.
Further research and application of this framework may be conducted, for instance, in Chile in relation to lithium, green hydrogen, and avocado production processes. On one hand, lithium represents a significant opportunity for Chilean development. Despite the political discussions regarding who should exploit this resource, lithium is a clear opportunity for economic growth for sustainable industrialization of the country. On the other hand, avocado is a much-appreciated product in different places around the world. Nonetheless, the production process has been the focus of several critics for its negative impacts on the environment and society, especially in places where avocado is produced. In this sense, applying the framework for this specific productive process will allow identifying opportunities for improvements regarding water consumption, use of lands, and impacts on local communities.
Another relevant domain for applying the proposed framework is supporting the design (and redesign) of the productive processes allowing to identify potential improvements even before implementing these processes. This domain of application may support the sustainable development of economies and the sustainable industrialization of countries as in the Chilean case.
At this point, it should be natural to realize that the proposed framework may be used for analyzing any productive process. For instance, this framework may be used for analyzing social-productive processes, e.g., education processes and public health systems. These potential applications may be focused on identifying how to make these kind of essential (non-optional to stop producing) processes greener for the continuous development of societies. Moreover, the GF framework is not focused on determining how the productive processes are improved but on identifying the root causes. In this line, it is possible to link and chain the identification of room for improvement with potential solutions extant in literature. For instance, it is possible to identify critical aspects regarding the fashion industry for improving several aspects such as the current level of waste and the consumption of water in their productive processes. This may even yield scientific research to improve how to handle and benefit with its products and emissions.
Finally, this application may serve as a base for being applied considering the specific industries of all countries around the world. These applications may depict the required effort for becoming a green country. Naturally, these applications may be applied at several level of detail for identifying the key aspects that negatively affect by increasing its respective GF.

Author Contributions

Conceptualization, F.J.T.-U., J.A.I.M. and D.A.P.-L.; methodology, F.J.T.-U., J.A.I.M. and D.A.P.-L.; validation, F.J.T.-U., J.A.I.M. and D.A.P.-L.; formal analysis, J.A.I.M. and D.A.P.-L.; investigation, F.J.T.-U., J.A.I.M. and D.A.P.-L.; writing—original draft preparation, F.J.T.-U., J.A.I.M. and D.A.P.-L.; writing—review and editing, F.J.T.-U.; visualization, D.A.P.-L. and J.A.I.M.; supervision, F.J.T.-U.; project administration, F.J.T.-U. All authors have read and agreed to the published version of the manuscript.

Funding

This research received no external funding.

Institutional Review Board Statement

Not applicable.

Informed Consent Statement

Not applicable.

Data Availability Statement

Not applicable.

Acknowledgments

The authors want to thank the relevant contribution of Rocío Rivera Cid and Ronald Dotte Zuñiga on improving the manuscript writing.

Conflicts of Interest

The authors declare no conflict of interest.

Appendix A

Table A1. Information for Computing Entries Criticalities.
EconomicSocialEnvironmental
NameTotal
Exports
Total
Imports
National
Net
Ratio
(I/E)
I/E FactorImporterT.ECOPollutantVitalT.SOCRenewableLimitedT.ENVTotalCriticality
Water344,0003,040,000−2,696,0008.84312.0031.5121.51.673
Electrical energy10,900,00052,20010,847,8000.00100.5121.5111.01.002
Refined petroleum255,000,0004,680,000,000−4,425,000,00018.35312.0121.5031.51.673
Air pump20,400,000227,000,000−206,600,00011.13312.0010.5111.01.172
Salt and others216,000,000243,000,000−27,000,0001.13111.0010.5010.50.672
Cyanides and others325012,400,000−12,396,7503815.38312.0010.5010.51.002
Polyvinyl chloride89,20075,100,000−75,010,800841.93312.0111.0010.51.172
Sulfuric acid1,680,000174,000,000−172,320,000103.57312.0111.0021.01.333
Pesticides73,700,000314,000,000−240,300,0004.26211.5111.0010.51.002
Fertilizers544,000,000424,000,000120,000,0000.78100.5021.0010.50.672
Land0000.00000.0031.5101.01.252
Wood26,900,000,000302,000,00026,598,000,0000.01100.5021.0111.00.832
Sawed wood965,000,00012,400,000952,600,0000.01100.5021.0111.00.832
Sodium sulfide248,00030,400,000−30,152,000122.58312.0111.0010.51.172
Sodium hydroxide 939,000101,000,000−100,061,000107.56312.0111.0010.51.172
Iodine464,000,00011,800463,988,2000.00100.5021.0111.00.832
Antibiotics1,710,00035,400,000−33,690,00020.70312.0021.0111.01.333
Animal meal and pellets380,000,000145,000,000235,000,0000.38100.5121.5021.01.002
Oxygen0000.00000.0121.5111.01.252

Appendix B

Table A2. Information for Computing Exits Criticalities.
EconomicSocialEnvironmental
Name Total
Exports
Total
Imports
National
Net
Ratio
(I/E)
I/E FactorImporterT.ECOPollutantVitalT.SOCRenewableLimitedT.ENVTotalCriticality
Copper ore 18,600,000,00051,900,00018,548,100,000358312.0010.5010.51.02.0
Refined copper 15,500,000,0001,430,00015,498,570,00010,839312.0010.5010.51.02.0
Raw copper 2,160,000,000198,0002,159,802,00010,909312.0010.5010.51.02.0
Wine 2,010,000,00011,600,0001,998,400,000173312.0010.5010.51.02.0
Sulfate chemical Woodpulp 3,710,000,00014,800,0003,695,200,000251312.0021.0111.01.33.0
Kaolin coated paper 323,000,000110,000,000213,000,0003211.5021.0111.01.22.0
Uncoated Kraft paper 66,100,000185,000,000−118,900,0000100.5021.0111.00.82.0
Cellulose fiber paper 32,100,000164,000,000−131,900,0000100.5021.0111.00.82.0
Fish fillets2,780,000,00031,200,0002,748,800,00089312.0021.0121.51.53.0
Non-fillet frozen fish 1,840,000,0007,230,0001,832,770,000254312.0021.0121.51.53.0
Non-fillet fresh fish 872,000,000381,000871,619,0002289312.0021.0121.51.53.0
Grapes 1,430,000,0004,040,0001,425,960,000354312.0010.5010.51.02.0
Pitted fruits 1,420,000,000775,0001,419,225,0001832312.0010.5010.51.02.0
Other fruits921,000,0001,000,000920,000,000921312.0010.5010.51.02.0
Apples and pears 859,000,0004,950,000854,050,000174312.0010.5010.51.02.0
Other nuts 576,000,00020,700,000555,300,00028312.0010.5010.51.02.0
Citrus 395,000,00017,700,000377,300,00022312.0010.5010.51.02.0
Blasting0000000.0132.0132.02.03.0
Ballast0000000.0132.0132.02.03.0
Carbon dioxide0000000.0132.0111.01.53.0
Gravel and crushed stone72,2008,060,000−7,987,8000100.5132.0132.01.53.0
Slag and others21,000,000,000389,000,00020,611,000,00054312.0111.0010.51.22.0
Dust in air0000000.0132.0132.02.03.0
Tailings0000000.0132.0132.02.03.0
Wastewater0000000.0121.5121.51.53.0
Organic waste0000000.0010.5111.00.82.0
Riles0000000.0132.0132.02.03.0

References

  1. United Nations Sustainable Development Goals. Available online: https://www.un.org/sustainabledevelopment/ (accessed on 7 September 2021).
  2. Xu, J. Model of cluster green supply chain performance evaluation based on circular economy. In Proceedings of the 2009 Second International Conference on Intelligent Computation Technology and Automation, Changsha, China, 10–11 October 2009; pp. 941–944. [Google Scholar] [CrossRef]
  3. Yang, Z.K.; Li, J. Assessment of green supply chain risk based on circular economy. In Proceedings of the 2010 IEEE 17th International Conference on Industrial Engineering and Engineering Management, Xiamen, China, 29–31 October 2010; pp. 1276–1280. [Google Scholar] [CrossRef]
  4. Yang, H. Research on the construction and management of green supply chain based on circular economy. In Proceedings of the 2011 International Conference on Business Management and Electronic Information, Guangzhou, China, 13–15 May 2011; pp. 171–174. [Google Scholar] [CrossRef]
  5. Zhou, L.; Li, H. Study on green supply chain management based on circular economy. Appl. Mech. Mater. 2011, 84–85, 761–764. [Google Scholar] [CrossRef]
  6. Ying, J.; Li-jun, Z. Study on Green Supply Chain Management Based on Circular Economy. Phys. Procedia 2012, 25, 1682–1688. [Google Scholar] [CrossRef] [Green Version]
  7. Cai, N.; Wu, M.H. The green supply chain management: A perspective on circular economy. Adv. Mater. Res. 2014, 933, 1004–1007. [Google Scholar] [CrossRef]
  8. Kazancoglu, Y.; Kazancoglu, I.; Sagnak, M. A new holistic conceptual framework for green supply chain management performance assessment based on circular economy. J. Clean. Prod. 2018, 195, 1282–1299. [Google Scholar] [CrossRef]
  9. Liu, J.; Feng, Y.; Zhu, Q.; Sarkis, J. Green supply chain management and the circular economy: Reviewing theory for advancement of both fields. Int. J. Phys. Distrib. Logist. Manag. 2018, 48, 794–817. [Google Scholar] [CrossRef]
  10. Haas, W.; Krausmann, F.; Wiedenhofer, D.; Heinz, M. How Circular is the Global Economy? An Assessment of Material Flows, Waste Production, and Recycling in the European Union and the World in 2005. J. Ind. Ecol. 2015, 19, 765–777. [Google Scholar] [CrossRef]
  11. Alhawari, O.; Awan, U.; Bhutta, M.K.S.; Ülkü, M.A. Insights from Circular Economy Literature: A Review of Extant Definitions and Unravelling Paths to Future Research. Sustainability 2021, 13, 859. [Google Scholar] [CrossRef]
  12. Srivastava, S.K. Green supply-chain management: A state-of-the-art literature review. Int. J. Manag. Rev. 2007, 9, 53–80. [Google Scholar] [CrossRef]
  13. Chin, T.A.; Tat, H.H.; Sulaiman, Z. Green supply chain management, environmental collaboration and sustainability performance. Procedia CIRP 2015, 26, 695–699. [Google Scholar] [CrossRef] [Green Version]
  14. Islam, S.; Karia, N.; Fauzi, F.B.A.; Soliman, M.S.M. A review on green supply chain aspects and practices. Manag. Mark. 2017, 12, 12–36. [Google Scholar] [CrossRef] [Green Version]
  15. Kaur, J.; Awasthi, A. A systematic literature review on barriers in green supply chain management. Int. J. Logist. Syst. Manag. 2018, 30, 330–348. [Google Scholar] [CrossRef]
  16. Amol Singh; Ashish Trivedi Sustainable green supply chain management: Trends and current practices. Compet. Rev. 2016, 26, 265–288.
  17. Tseng, M.L.; Islam, M.S.; Karia, N.; Fauzi, F.A.; Afrin, S. A literature review on green supply chain management: Trends and future challenges. Resour. Conserv. Recycl. 2019, 141, 145–162. [Google Scholar] [CrossRef]
  18. De Carvalho, L.S.; Stefanelli, N.O.; Viana, L.C.; Vasconcelos, D.D.S.C.; Oliveira, B.G. Green supply chain management and innovation: A modern review. Manag. Environ. Qual. Int. J. 2020, 31, 470–482. [Google Scholar] [CrossRef]
  19. Biermann, F.; Kanie, N.; Kim, R.E. Global governance by goal-setting: The novel approach of the UN Sustainable Development Goals. Curr. Opin. Environ. Sustain. 2017, 26–27, 26–31. [Google Scholar] [CrossRef]
  20. Mondejar, M.E.; Avtar, R.; Diaz, H.L.B.; Dubey, R.K.; Esteban, J.; Gómez-Morales, A.; Hallam, B.; Mbungu, N.T.; Okolo, C.C.; Prasad, K.A.; et al. Digitalization to achieve sustainable development goals: Steps towards a Smart Green Planet. Sci. Total Environ. 2021, 794, 148539. [Google Scholar] [CrossRef]
  21. Giannetti, B.F.; Agostinho, F.; Eras, J.J.C.; Yang, Z.; Almeida, C.M.V.B. Cleaner production for achieving the sustainable development goals. J. Clean. Prod. 2020, 271, 122127. [Google Scholar] [CrossRef]
  22. Nicholls, E.; Ely, A.; Birkin, L.; Basu, P.; Goulson, D. The contribution of small-scale food production in urban areas to the sustainable development goals: A review and case study. Sustain. Sci. 2020, 15, 1585–1599. [Google Scholar] [CrossRef] [Green Version]
  23. Dantas, T.E.T.; De-Souza, E.D.; Destro, I.R.; Hammes, G.; Rodriguez, C.M.T.; Soares, S.R. How the combination of Circular Economy and Industry 4.0 can contribute towards achieving the Sustainable Development Goals. Sustain. Prod. Consum. 2021, 26, 213–227. [Google Scholar] [CrossRef]
  24. Falcone, P.M.; Hiete, M.; Sapio, A. Hydrogen economy and sustainable development goals: Review and policy insights. Curr. Opin. Green Sustain. Chem. 2021, 31, 100506. [Google Scholar] [CrossRef]
  25. Kumar, R.; Verma, A.; Shome, A.; Sinha, R.; Sinha, S.; Jha, P.K.; Kumar, R.; Kumar, P.; Das, S.; Sharma, P.; et al. Impacts of Plastic Pollution on Ecosystem Services, Sustainable Development Goals, and Need to Focus on Circular Economy and Policy Interventions. Sustainability 2021, 13, 9963. [Google Scholar] [CrossRef]
  26. Navarrete, S.D.S.; Borini, F.M.; Avrichir, I. Environmental upgrading and the United Nations Sustainable Development Goals. J. Clean. Prod. 2020, 264, 121563. [Google Scholar] [CrossRef]
  27. Orhan, C.C.; Guajardo, M. Analytics in developing countries: Methods, applications, and the impact on the UN Sustainable Development Goals. Int. Trans. Oper. Res. 2021, itor.13018. [Google Scholar] [CrossRef]
  28. Scur, G.; Barbosa, M.E. Green supply chain management practices: Multiple case studies in the Brazilian home appliance industry. J. Clean. Prod. 2017, 141, 1293–1302. [Google Scholar] [CrossRef]
  29. Auty, R.; Warhurst, A. Sustainable development in mineral exporting economies. Resour. Policy 1993, 19, 14–29. [Google Scholar] [CrossRef]
  30. Sachs, J.; Warner, A. Natural Resource Abundance and Economic Growth. Natl. Bur. Econ. Res. 1995. [Google Scholar] [CrossRef]
  31. Sachs, J.D.; Warner, A.M. The curse of natural resources. Eur. Econ. Rev. 2001, 45, 827–838. [Google Scholar] [CrossRef]
  32. Deacon, R.T. The political economy of the natural resource curse: A survey of theory and evidence. Found. Trends Microecon. 2012, 7, 111–208. [Google Scholar] [CrossRef] [Green Version]
  33. Ducoing, C.; Peres-Cajías, J.; Badia-Miró, M.; Bergquist, A.K.; Contreras, C.; Ranestad, K.; Torregrosa, S. Natural resources curse in the long run? Bolivia, Chile and Peru in the Nordic countries’ mirror. Sustainability 2018, 10, 965. [Google Scholar] [CrossRef] [Green Version]
  34. Gorenstein, S.; Ortiz, R. Natural resources and primary sector-dependent territories in Latin America. Area Dev. Policy 2018, 3, 42–59. [Google Scholar] [CrossRef]
  35. Ranestad, K. The mining sectors in Chile and Norway, ca. 1870–1940: The development of a knowledge gap. Innov. Dev. 2017, 8, 147–165. [Google Scholar] [CrossRef]
  36. Blattman, C.; Hwang, J.; Williamson, J.G. Winners and losers in the commodity lottery: The impact of terms of trade growth and volatility in the Periphery 1870–1939. J. Dev. Econ. 2007, 82, 156–179. [Google Scholar] [CrossRef]
  37. Miró, M.B.; Ducoing, C.A. Natural Resources and Economic Growth; Badia-Miró, M., Pinilla, V., Willebald, H., Eds.; Routledge: London, UK, 2015; ISBN 9781315769356. [Google Scholar]
  38. Banco Central de Chile Indicadores de Comercio Exterior. Available online: https://www.bcentral.cl/documents/33528/133362/ICE_I_2020.pdf/31993c4e-edc0-265a-6944-6b375e2292e1?t=1590177112987 (accessed on 1 December 2020).
  39. Figueroa, E.B.; Calfucura, E.T. Sustainable development in a natural resource rich economy: The case of Chile in 1985–2004. Environ. Dev. Sustain. 2010, 12, 647–667. [Google Scholar] [CrossRef]
  40. Faundez, J. The governance of natural resources in Latin America: The commodities consensus and the policy space conundrum. In Natural Resources and Sustainable Development; Edward Elgar Publishing: Cheltenham, UK, 2017; pp. 117–141. [Google Scholar] [CrossRef]
  41. Sinha, A.; Sengupta, T. Impact of natural resource rents on human development: What is the role of globalization in Asia Pacific countries? Resour. Policy 2019, 63, 101413. [Google Scholar] [CrossRef]
  42. Wei, H.; Rizvi, S.K.A.; Ahmad, F.; Zhang, Y. Resource cursed or resource blessed? The role of investment and energy prices in G7 countries. Resour. Policy 2020, 67, 101663. [Google Scholar] [CrossRef]
  43. Blanco, L.; Grier, R. Natural resource dependence and the accumulation of physical and human capital in Latin America. Resour. Policy 2012, 37, 281–295. [Google Scholar] [CrossRef]
  44. Venables, A.J. Using natural resources for development: Why has it proven so difficult? J. Econ. Perspect. 2016, 30, 161–184. [Google Scholar] [CrossRef] [Green Version]
  45. Coenen, T.B.J.; Haanstra, W.; Jan Braaksma, A.J.J.; Santos, J. CEIMA: A framework for identifying critical interfaces between the Circular Economy and stakeholders in the lifecycle of infrastructure assets. Resour. Conserv. Recycl. 2020, 155, 104552. [Google Scholar] [CrossRef]
  46. Darnall, N.; Jolley, G.J.; Handfield, R. Environmental management systems and green supply chain management: Complements for sustainability? Bus. Strateg. Environ. 2008, 17, 30–45. [Google Scholar] [CrossRef]
  47. Omar, H.A.M.B.B.; Ali, M.A.M.; Jaharadak, A.A. Bin Green supply chain integrations and corporate sustainability. Uncertain Supply Chain Manag. 2019, 7, 713–726. [Google Scholar] [CrossRef]
  48. Yang, Z.; Sun, J.; Zhang, Y.; Wang, Y. Synergy between green supply chain management and green information systems on corporate sustainability: An informal alignment perspective. Environ. Dev. Sustain. 2020, 22, 1165–1186. [Google Scholar] [CrossRef] [Green Version]
  49. Phawitpiriyakliti, C.; Keawkunti, B.; Saisama, C.; Sangma, W. Towards Environmental Sustainability: A Case Study of Green Supply Chain Management Practice. J. Secur. Sustain. Issues 2020, 9, 747–763. [Google Scholar] [CrossRef]
  50. ATLAS Atlas Economic Complexity. Available online: https://atlas.cid.harvard.edu/ (accessed on 1 December 2020).
  51. Thomas, B.G.P. Oman: Mining, Minerals and Fuel Resources. Available online: http://www.azomining.com/Article.aspx?ArticleID=152 (accessed on 15 December 2020).
  52. Observatory of Economic Complexity Observatory of Economic Complexity. Available online: https://oec.world/ (accessed on 17 October 2021).
  53. CODELCO. Reporte de Sustentabilidad. Available online: https://www.codelco.com/memoria2018/site/docs/20190408/20190408123941/codelco_reporte_sustentabilidad_2018.pdf (accessed on 13 December 2020).
  54. Política Nacional Minera. Política Nacional Minera 2050. Available online: https://www.politicanacionalminera.cl/ (accessed on 14 December 2020).
  55. Oficina de Estudios y Políticas Agrarias. Oficina de Estudios y Políticas Agrarias. Available online: https://www.odepa.gob.cl (accessed on 17 October 2020).
  56. Wine Independent Press. Wine Independent Press. Available online: https://wip.cl/cifras-exportaciones-2019/ (accessed on 17 November 2020).
  57. Oficina de Estudios y Políticas Agrarias. Oficina de Estudios y Políticas Agrarias—Sustentabilidad en Vino de Chile. Available online: https://www.odepa.gob.cl/wp-content/uploads/2019/07/SustentabilidadVinosDeChile2015.pdf (accessed on 17 October 2020).
  58. Oficina de Estudios y Políticas Agrarias. Oficina de Estudios y Políticas Agrarias—Sustentabilidad en Sistemas Productivos. Available online: https://www.odepa.gob.cl/temas-transversales/agricultura-sustentable/sustentabilidad-en-sistemas-productivos (accessed on 17 October 2020).
  59. Centro para la Innovación y Fomento de Energías Sustentables. Centro para la Innovación y Fomento de Energía Sustentables. Available online: https://www.agrificiente.cl/wp-content/uploads/2017/05/Vitivinicola-Informe-Final-editado-1.pdf (accessed on 17 November 2020).
  60. Campos-Andaur, P.; Araya-Castillo, L. Global Value Chain in the Wine Industry of the Maule Region and its Effects on the Generation of Employment. Multidiscip. Bus. Rev. 2018, 11, 1–23. [Google Scholar]
  61. Fernandez-Stark, K.; Bamber, P. Wine Industry in Chile. In Services in Global Value Chains; World Scientific: Singapore, 2016; pp. 559–592. [Google Scholar]
  62. Salmón de Chile. Salmón de Chile. Available online: https://www.salmondechile.com.br/en/global/ (accessed on 17 October 2020).
  63. Fernández, J.; Briones, L. Estudio de la cadena productiva del salmón, a través de un análisis estratégico de costos. Capic Rev. 2005, 3, 1–37. [Google Scholar]
  64. Forestry Institute. Chilean Statistical Yearbook of Forestry. Available online: https://wef.infor.cl/publicaciones/anuario/2019/Anuario2019.pdf (accessed on 12 December 2020).
  65. CMPC. Available online: https://www.cmpc.com/wp-content/uploads/2019/04/Reporte-Cmpc-2018.pdf (accessed on 17 October 2020).
  66. Torres, E.; Rivera, S.; Muena, V.; Corradini, F.; Sepúlveda, P.; Abarca, P.; Defilippi, B.; Muñoz, I.; Selles Van Sch, G.; Rodriguez, F.; et al. Manual del Cultivo de Uva de Mesa; Ministerio de Agriculture: Santiago, Chile, 2017. [Google Scholar]
Figure 1. Framework methodology.
Sustainability 13 13575 g001
Figure 2. Macro-Productive Process context analysis.
Sustainability 13 13575 g002
Figure 3. Generic example of Step 2.
Sustainability 13 13575 g003
Figure 4. Copper Sub-Productive Processes with lanes.
Sustainability 13 13575 g004
Figure 5. Wine Sub-Productive Processes with lanes.
Sustainability 13 13575 g005
Figure 6. Salmon Sub-Productive Processes with lanes.
Sustainability 13 13575 g006
Figure 7. Cellulose Sub-Productive Processes with lanes.
Sustainability 13 13575 g007
Figure 8. Sub-Productive Processes with lanes.
Sustainability 13 13575 g008
Figure 9. Greening factors of the five analyzed industries main products.
Sustainability 13 13575 g009
Figure 10. Box and whisker graph of greening factors.
Sustainability 13 13575 g010
Table 1. Mainstays variable for evaluation entries and exits.
Variables
MainstayEntriesExits
EconomicI/E Factor (N)
Importer (B)
E/I Factor (N)
Exporter (B)
SocialPollutant (B)
Vital (N)
Vitality Impact (B)
Pollution degree (N)
EnvironmentalRenewable (B)
Limited (N)
Not-reusable (B)
Loss degree (N)
Table 2. Criticality analysis for copper entries and exits.
EntriesResultCNik
Water1.673
Electrical energy1.002
Refined petroleum1.673
Air pump1.172
Salt and others0.672
Cyanides and others1.002
Polyvinyl chloride1.172
Sulfuric acid1.333
ExitsResultCMjk
Blasting2.003
Ballast2.003
Carbon dioxide1.503
Dust in air2.003
Gravel and crushed stone1.503
Tailings2.003
Raw copper 1.002
Slag and others1.172
Copper ore 1.002
Wastewater1.503
Refined copper 1.002
Table 3. Greening Factor for copper production process.
ProcessEntriesFNikCNikRNikExitsFMjkCMjkRMjkGFSk
ExtractionWater236Blasting33960.75
Electrical energy326Ballast339
Air pump326Carbon dioxide339
Refined petroleum339Dust in air339
ProcessingWater339Gravel and Crushed stone33957.60
Salt and others224Tailings339
Cyanides and others224----
Refined petroleum339----
Electrical energy326----
FoundryElectrical energy326Carbon dioxide33949.00
Water236Raw copper 326
Refined petroleum339Slag and others326
RefinementPolyvinyl chloride326Copper ore 32658.50
Electrical energy326Wastewater339
Water339Carbon dioxide339
Refined petroleum339Refined Copper 326
Sulfuric acid339----
Table 4. Criticality analysis for wine entries and exits.
EntriesResultCNik
Water1.673
Electrical energy1.002
Refined petroleum1.673
Pesticides1.002
Fertilizers0.672
Land1.252
ExitsResultCMjk
Wine 1.002
Organic waste0.752
Table 5. Greening Factor for wine productive process.
ProcessEntriesFNikCNikRinkeExitsFMjkCMjkRMjkGFSk
Vineyard preparation and growthPesticides224Organic waste32634.50
Fertilizers224----
Water339----
Land326----
Harvesting grapes, destemming, squeezingElectrical energy224Organic waste32630.00
Refined petroleum236----
Wine post-processesWater339Wine 12226.00
Electrical energy224Organic waste326
Table 6. Criticality analysis for entries and exits.
EntriesResultCNik
Animal meal and pellets1.002
Antibiotics1.333
Electrical energy1.002
Iodine0.832
Refined petroleum1.673
Water1.673
ExitsResultCMjk
Carbon dioxide1.503
Fish Fillets1.503
Non-Fillet fresh fish 1.503
Non-Fillet frozen fish 1.503
Organic waste0.752
Wastewater1.503
Table 7. Greening Factor for salmon productive process.
ProcessEntriesFNikCNikRNikExitsFMjkCMjkRMjkGFSk
Spawning, fertilization, incubation and hatchingIodine224Carbon dioxide23649.00
Antibiotics339Wastewater339
Electrical energy224Organic waste326
Refined petroleum339----
Water339----
Breeding and smoltificationAntibiotics339Carbon dioxide23654.25
Electrical energy224Wastewater339
Refined petroleum339Organic waste326
Water339----
Sea cultivationAntibiotics339Carbon dioxide23649.00
Electrical energy224Wastewater339
Water339Organic waste326
Animal meal and pellets326----
HarvestWater339Wastewater33964.00
Refined petroleum339Organic waste326
Electrical energy326Carbon dioxide236
----Fish Fillets339
----Non-Fillet frozen fish 339
----Non-Fillet fresh fish 339
Table 8. Criticality analysis for cellulose entries and exits.
EntriesResultCNik
Electrical energy1.002
Oxygen1.252
Refined petroleum1.673
Sawed wood0.832
Sodium hydroxide 1.172
Sodium sulfide1.172
ExitsResultCMjk
Carbon dioxide1.503
Cellulose fiber paper 0.832
Kaolin coated paper 1.172
Organic waste0.752
Riles2.003
Sulfate chemical woodpulp 1.333
Uncoated Kraft paper 0.832
Wastewater1.503
Table 9. Greening Factor for cellulose productive process.
ProcessEntriesFNikCNikRNikExitsFMjkCMjkRMjkGFSk
Peeling and splinter of tree barkWood326Carbon dioxide33945.00
Sawed wood326Organic waste326
Electrical energy326----
Refined petroleum236----
Digestion phaseWater236Riles33942.67
Sodium sulfide326Carbon dioxide339
Sodium hydroxide 224Wastewater236
WhiteningOxygen326Wastewater23647.50
Sodium hydroxide 224Riles339
Water339Carbon dioxide339
----Organic waste326
Dry and packingWater339Sulfate chemical Woodpulp 33950.63
Electrical energy326Kaolin coated paper 326
----Uncoated Kraft paper 326
----Cellulose fiber paper326
Table 10. Criticality analysis for Fruits and Nuts entries and exits.
EntriesResultCNik
Electrical energy1.002
Fertilizers0.672
Land1.252
Pesticides1.002
Refined petroleum1.673
Water1.673
ExitsResultCMjk
Apples and pears 1.002
Carbon dioxide1.503
Citrus 1.002
Grapes 1.002
Organic waste0.752
Other fruits1.002
Other nuts 1.002
Pitted fruits 1.002
Table 11. Greening Factor for fruits and nuts productive process.
ProcessEntriesFNikCNikRNikExitsFMjkCMjkRMjkGFSk
Agricultural preparation and handlingPesticides224Organic waste32634.50
Fertilizers224----
Water339----
Land326----
HarvestingElectrical energy224Organic waste32619.50
Refined petroleum236Carbon dioxide133
Water133----
Processing and PackingWater339Organic waste22426.00
Electrical energy224Grapes 224
----Pitted fruits 224
----Other fruits224
----Apples and pears 224
----Other nuts 224
----Citrus 224
Table 12. Summarize of resulting GF values.
ProductSub-Productive Processes GF ValuesTotalWeights
Copper60.7557.6049.0058.5056.460.474
Wine34.5030.0026.00-30.170.026
Cellulose45.0042.6747.5050.6346.450.054
Salmon49.0054.2549.0064.0054.060.072
Fruits and nuts34.5019.5026.00-26.670.073
Average Country|Sum of weights42.76 0.699
Normalized weighted average country51.34
Table 13. Sensitivity analysis for water over copper GF value.
Water CriticalityExtractionProcessingFoundryRefinementProductive Process
High (3)60.7557.6049.0058.5056.46
Medium (2)56.2552.2044.3354.0051.70
Low (1)51.7546.8039.6749.5046.93
Publisher’s Note: MDPI stays neutral with regard to jurisdictional claims in published maps and institutional affiliations.

