Article

The Impact of Design Interventions on Occupant Satisfaction: A Workplace Pre-and Post-Occupancy Evaluation Analysis

1
College of Design, University of Minnesota, Minneapolis, MN 55455, USA
2
College of the Arts, Georgia State University, Atlanta, GA 30303, USA
3
College of Human Ecology, Kyung Hee University, Seoul 02447, Korea
*
Author to whom correspondence should be addressed.
Sustainability 2021, 13(24), 13571; https://doi.org/10.3390/su132413571
Submission received: 25 September 2021 / Revised: 24 November 2021 / Accepted: 2 December 2021 / Published: 8 December 2021

Abstract

:
Understanding how occupants perceive the built environment is a growing interest in sustainability research. This article looks into how design interventions in a workplace renovation project impact occupants’ satisfaction through a pre-and post-occupancy survey. In two years (from 2016 to 2018), an interdisciplinary research team from the University of Minnesota administered online occupancy surveys at the headquarters of the Cuningham Group, a national renowned design firm in Minnesota. The surveys included 12 indoor environmental quality categories (with 26 criteria on a 7-point Likert scale) that measured how occupants perceived their existing workplace and the renovated environment. Mann–Whitney U tests and Chi-square tests were conducted for 12 indoor environmental quality categories between the pre-and post-surveys. Results showed that occupants’ satisfaction significantly increased with the design interventions in the renovated workplace. Perceived work performance and health also improved in the post-survey. Among 12 indoor environmental quality categories, occupants perceived the biggest improvements in lighting such as adjustability and quality of task lighting. Design interventions in electric lighting, especially improved ease of control, effectiveness of automatic systems, plus visual and acoustic comfort, contributed to occupants’ satisfaction. Overall, the pre-and post-occupancy evaluation survey analysis confirmed the positive impact of the renovated Cuningham Group facility. The article presents a comprehensive measure of the impact of the data-driven design interventions derived from pre-and post-occupancy evaluation surveys on occupant satisfaction.

1. Introduction

Sustainable design researchers have shown a growing interest in understanding and measuring how occupants perceive the built environment [1,2]. One prominent approach is using the indoor environmental quality (IEQ) categories to evaluate whether occupants are satisfied with the building and if it supports their health and well-being [3]. IEQ can range from 12 to 18 categories focusing on indoor air, privacy, acoustic, thermal, layout, and so on [4,5]. These categories indicate the impact of the built environment on occupants and dominate multiple sustainability rating systems such as Leadership in Energy and Environmental Design (LEED) in North America, Building Research Establishment Environmental Assessment Method (BREEAM) in the United Kingdom, German Sustainable Building Council (DGNB) in Germany, Comprehensive Assessment System for Built Environment Efficiency (CASBEE) in Japan, and GREENMARK in Singapore [6,7]. In the United States of America, however, different states have their guidelines and rating systems for sustainability and occupant satisfaction [8]. In Minnesota, the B3 Guidelines are mandatory to all state-funded buildings and optional for facilities in private sectors [9]. Based on the B3 Guidelines, a University of Minnesota interdisciplinary team developed a measure for occupant satisfaction in the built environment, the Sustainable Post-Occupancy Evaluation Survey (SPOES). From 2009 to 2017, the team collected data in 43 buildings from workplaces to classrooms and resident halls [10]. While these buildings are state-funded, the team also applied SPOES to facilities in private sectors such as architecture and design firms in Minnesota The general finding was that impacts on occupant satisfaction varied between different indoor environmental quality (IEQ) factors [5,11]. Acoustics, privacy, and furnishings, for instance, were most likely to result in occupant dissatisfaction [11]. Thus, the team acknowledged the importance of data-driven design interventions to improve occupant satisfaction in the built environment. Conducting pre-and post-occupancy evaluations in the same building is necessary to collect timely feedback on indoor environmental quality (IEQ) factors and examine their impacts on occupant satisfaction.
The aim of this paper is to illustrate a comprehensive measure of occupant satisfaction in the built environment via the pre-and post-occupancy analysis of the Cuningham Group headquarters. Therefore, two corresponding objectives are (1) explaining the data collection process which informed the design interventions and (2) examining the impact evaluation of these interventions on occupant satisfaction. The national renowned Cuningham Group asked the team to conduct pre-and post-occupancy analysis in 2016 and 2018 for their headquarters in Minneapolis, Minnesota. The facility (Figure 1) is located at St. Anthony Main, 201 Main Street SE, Suite 325, Minneapolis, Minnesota. Featuring three stories above ground, the building includes a basement level and has a total square footage of 36,189. The Cuningham Group, however, leases 27,983 square feet of the building. The rest is dedicated to a workplace with open offices for employees, employee support, and technology maintenance areas [12]. The SPOES evaluations covered the overall facility and primary workplace.
In November 2016, a pre-occupancy evaluation survey was initiated to collect data on the existing conditions prior to a renovation. The findings, including occupant satisfaction on 12 indoor environmental quality (IEQ) categories and open-ended recommendations, informed the design interventions in the spaces from 2017 to 2019. After three years of moving into the spaces, a post-occupancy evaluation survey was conducted in January 2019. Occupant satisfaction significantly increased in the categories of aesthetic, daylighting, electric lighting, furnishing, thermal, and many more. This article addresses two primary research questions: first, how pre-and post-occupancy evaluation surveys play a role in the design process and inform design interventions; second, whether design interventions impact occupant satisfaction. We tackle the questions using the findings from both the pre-and post-occupancy evaluation surveys and the design interventions. The conclusion expands on the importance of pre-and post-occupancy evaluation in every step of designing the built environment.

2. Literature Review

2.1. Workplace Occupancy Evaluation Research

Occupant satisfaction surveys are used to assess the indoor environmental quality by documenting feedback from corresponding occupants [13]. Post-occupancy evaluation (POE) is a typical example with surveys conducted nine months to one year after occupants move in to ensure that the spaces meet occupants’ needs, facilitate health and well-being, and supports occupants’ satisfaction [14]. POE includes two components: subjective methods (how occupants perceive the built environment) and physical measurements (specific characteristics of the built environment) [15]. The two components are closely related as building management relies on physical measurements for effective energy usage and reduction of material waste. Architects/interior designers, likewise, seek occupant feedback from subjective methods to improve/optimize their buildings/spaces [16]. For subjective methods, POE takes the form of an occupant survey questionnaire (81.51%), a focus-group/structured interview (45.89%), and a walkthrough (37.67%). For physical measurements, POE includes energy and water assessment (26.03% and 9.59%, respectively), and IEQ categories such as thermal (42.4%), lighting (24.66%), indoor air quality (22.60%), and acoustics (13.70%). Visual records, technical inputs of building structure/service/system, window opening sensors, and GPS-enabled mobility tracking are recent additions to POE [15,17].
To assess occupant comfort in 167 office buildings (n = 7441), OFFICAIR (a research initiative of the European Union) adopted a self-report questionnaire with multiple IEQ categories [18]. Occupants rated their comfort on temperature, air movement, air quality, light, noise, privacy, space layout, decoration, cleanliness, and view. Odds Ratios (ORs) analysis revealed that among those IEQ categories, noise (OR = 2.50), air quality (OR = 1.56), light (OR = 1.49), and thermal (OR = 1.44) had greatest influences on occupants’ overall comfort (p ≤ 0.001). In 1999, Center for the Built Environment (CBE) at University of California, Berkeley developed a POE questionnaire including occupant demographics (e.g., age, gender), general usage of the spaces (e.g., time spent), building location and space type (e.g., private/share/cubic), and IEQ categories (e.g., lighting) with 7-point scale ratings and open-ended clarifications [19]. The CBE database of 897 buildings (n = 93,662) around the United States and other European and Asian countries indicated sufficient correlations (0.5–0.8) between the IEQ categories. For example, light amount with visual comfort, cleaning with maintenance, and noise level with acoustic privacy. Hence, it is reliable and recommended to assess the same variable (i.e., occupant satisfaction) with multiple measurements (i.e., IEQ categories) [19,20].
The Building Use Studies (BUS) methodology, likewise, contains 45 with 7-point ratings scales for 11 IEQ categories such as temperature, noise, lighting, and appearance [21,22,23]. One study used BUS to assess 47 buildings (from offices to healthcare facilitates) in the United Kingdom and found this methodology highly reliable, with Cronbach’s alpha values over 0.9 for all IEQ criteria [21]. Furthermore, Pearson correlations indicated that noise and lighting correlated with occupant satisfaction (r = 0.19, r = 0.30, respectively), with p < 0.0001. BUS findings highlight that hours of using visual display units (i.e., monitors) left negative impacts on occupant satisfaction (r = –0.050 to r = –0.117, across buildings), with p < 0.0001. Another BUS study conducted in two office buildings (n = 138) in New Zealand revealed that light, ventilation, and open spaces (79%) enhance occupant satisfaction, while temperature (76%) and noise (50%) hindered occupant performance [22]. Across different post-occupancy evaluations, the overall protocol contains a Likert-scale rating system (e.g., 7 points) which ties to multiple IEQ criteria for accurate and reliable assessments of occupant satisfaction/performance. Researchers also continue to expand the IEQ criteria to better capture variances in satisfaction/performance (e.g., visual display units, desk space, storage) [20,21]. The Sustainable Post-Occupancy Evaluation Survey (SPOES) discussed in the next section is an exemplar.

2.2. Sustainable Post-Occupancy Survey (SPOES)

The Sustainable Post-Occupancy Evaluation Survey (SPOES) helps evaluate the occupants’ satisfaction, perceived health, and well-being in the workplace, classroom, and residence hall settings in compliance with the Minnesota B3 Guidelines. With funding from the Minnesota Departments of Commerce and Administration, the Interior Design program in the Department of Design, Housing, and Apparel and the Center for Sustainable Building Research developed SPOES in 2009. The team frequently revises the tool to reflect sustainable guidelines and the state’s legislative requirement for occupancy evaluations in state-funded buildings with new designs and major renovations [5]. SPOES is a self-administered, Internet-based questionnaire administered to and completed by occupants in the buildings. The questionnaire has been tested for validity (whether the survey can measure occupants’ satisfaction, perceived health, and well-being) and reliability (whether findings are consistent when replicating the surveys).
Occupants rate their level of satisfaction on a Likert-type scale from 1 (very dissatisfied) to 7 (very satisfied) with 12 IEQ categories (including 26 criteria). They also rate the influence of the built environment on their perception of work performance and health on a scale from 1 (hinders) to 7 (enhances). The mean for a 7-point scale is 4.00. Lower or higher means reflect stronger tendencies towards dissatisfaction/satisfaction and hinders/enhances. Means that are close to the center of the scale (4) are considered to be neither dissatisfied/hinders or satisfied/enhances. Descriptive statistics from the IEQ ratings indicate occupants’ perceptions of how the built environment impacts their satisfaction, health, and well-being. The means are interpreted as follow: 1.00–3.50, dissatisfied (or hinders); 3.51–4.50, neither dissatisfied (or hinders) nor satisfied (or enhances); 4.51–7.00, satisfied (or enhances). Cumulative mean ratings from 12 IEQ categories make up the 7-point IEQ Satisfaction Score for all occupants in a specific environment.
Overall, the criteria include acoustic, aesthetic/appearance, cleaning and maintenance, daylight, electric lighting, furnishing, indoor air quality, privacy, technology, thermal conditions, vibration and movement, and view conditions. The criteria ratings reflect occupants’ satisfaction with the site, building, and interior, and how the built environment impacts their perceptions of work performance and health. Open-ended questions are available for each IEQ category so occupants can elaborate on their experiences in the built environment, explain their ratings, and even give recommendations for relevant interventions. Self-reported questions on occupants’ demographic, commuting, and physical activities within the building also provide contexts for the IEQ ratings and open-ended answers [5,10].

2.3. Indoor Environment Quality and Occupant Satisfaction

Empirical evidence for the relationship between IEQ categories and occupant satisfaction with the built environment is abundant in the literature of occupancy evaluation [24,25,26,27]. Analyses of the occupancy evaluation database from Center for the Built Environment (CBE) revealed specific IEQ categories that affect occupant satisfaction [24]. Thermal conditions, acoustic, space, aesthetic/appearance, furnishing, indoor air quality, privacy, lighting, view, cleaning, and maintenance have a prominent impact on occupant satisfaction with the buildings/facilities. For instance, when occupants are satisfied with thermal conditions, the overall satisfaction (with the buildings/facilities) increased by 0.12 unit. When they are dissatisfied with thermal conditions, the overall satisfaction decreased by 0.21 unit. Moreover, occupant satisfaction with thermal conditions explained 76% of the variation in their productivity [25]. Lighting, air quality, and appearance/aesthetic accounted for 58% of the variation in occupant satisfaction, with appearance/aesthetic as the most influential factor (r = 0.405, p = 0.01) [28]. A study (n = 232) examined a campus in Jaipur, and Heating Refrigeration and Air Conditioning Engineers (ASHRAE), Illuminating Engineering Society of North America (IESNA), World Health Organization (WHO) standards revealed that poor performance in IEQ categories such as acoustic and lighting exerted negative impacts on students’ satisfaction [29]. Results showed 43.54% of students accounted insufficient amount of lighting for a sense of stuffiness. Likewise, 56% of students reported being disturbed by high noise levels, both outdoor and indoor.
Another study (n = 160) in a BREEAM office building in Sweden also showed that IEQ categories such as acoustic and thermal condition contributed to perceived stress such as fatigue and difficulty in concentration [2]. Occupants deemed high noise level and unpleasant odor as the main contributors to their declined concentration (r ≈ 0.5, r ≈ 0.4, p < 0.05, respectively). Results from a study of 35 buildings (n = 300) indicated that visual comfort, acoustic comfort, building design/appearance, thermal comfort, and indoor air quality were prominent in predicting occupant satisfaction (α = 0.933, α = 0.893, α = 0.875, α = 0.874, α = 0.869, p < 0.05, respectively) [30]. Green buildings are believed to have better IEQ and (subsequently) higher occupant satisfaction due to their compliance with sustainable design guidelines [26]. However, a study on 93 LEED-rated buildings from the CBE database found discrepancies in occupant perceptions of IEQ categories and their satisfaction [27]. For instance, indoor air satisfaction showed a marginal change between low-and high-LEED-rating buildings (p < 0.001). Thermal comfort, meanwhile, differed among occupants in the same indoor conditions. Additionally, metrics such as heart rate, electrodermal activity, and skin surface temperature were prominent in predicting thermal comfort [31]. Therefore, how IEQ categories translate into occupant satisfaction remains a challenging question [32,33]. Thus, researchers continue to use subjective votes/ratings of occupants to better understand objective measurements of IEQ categories [13,34].

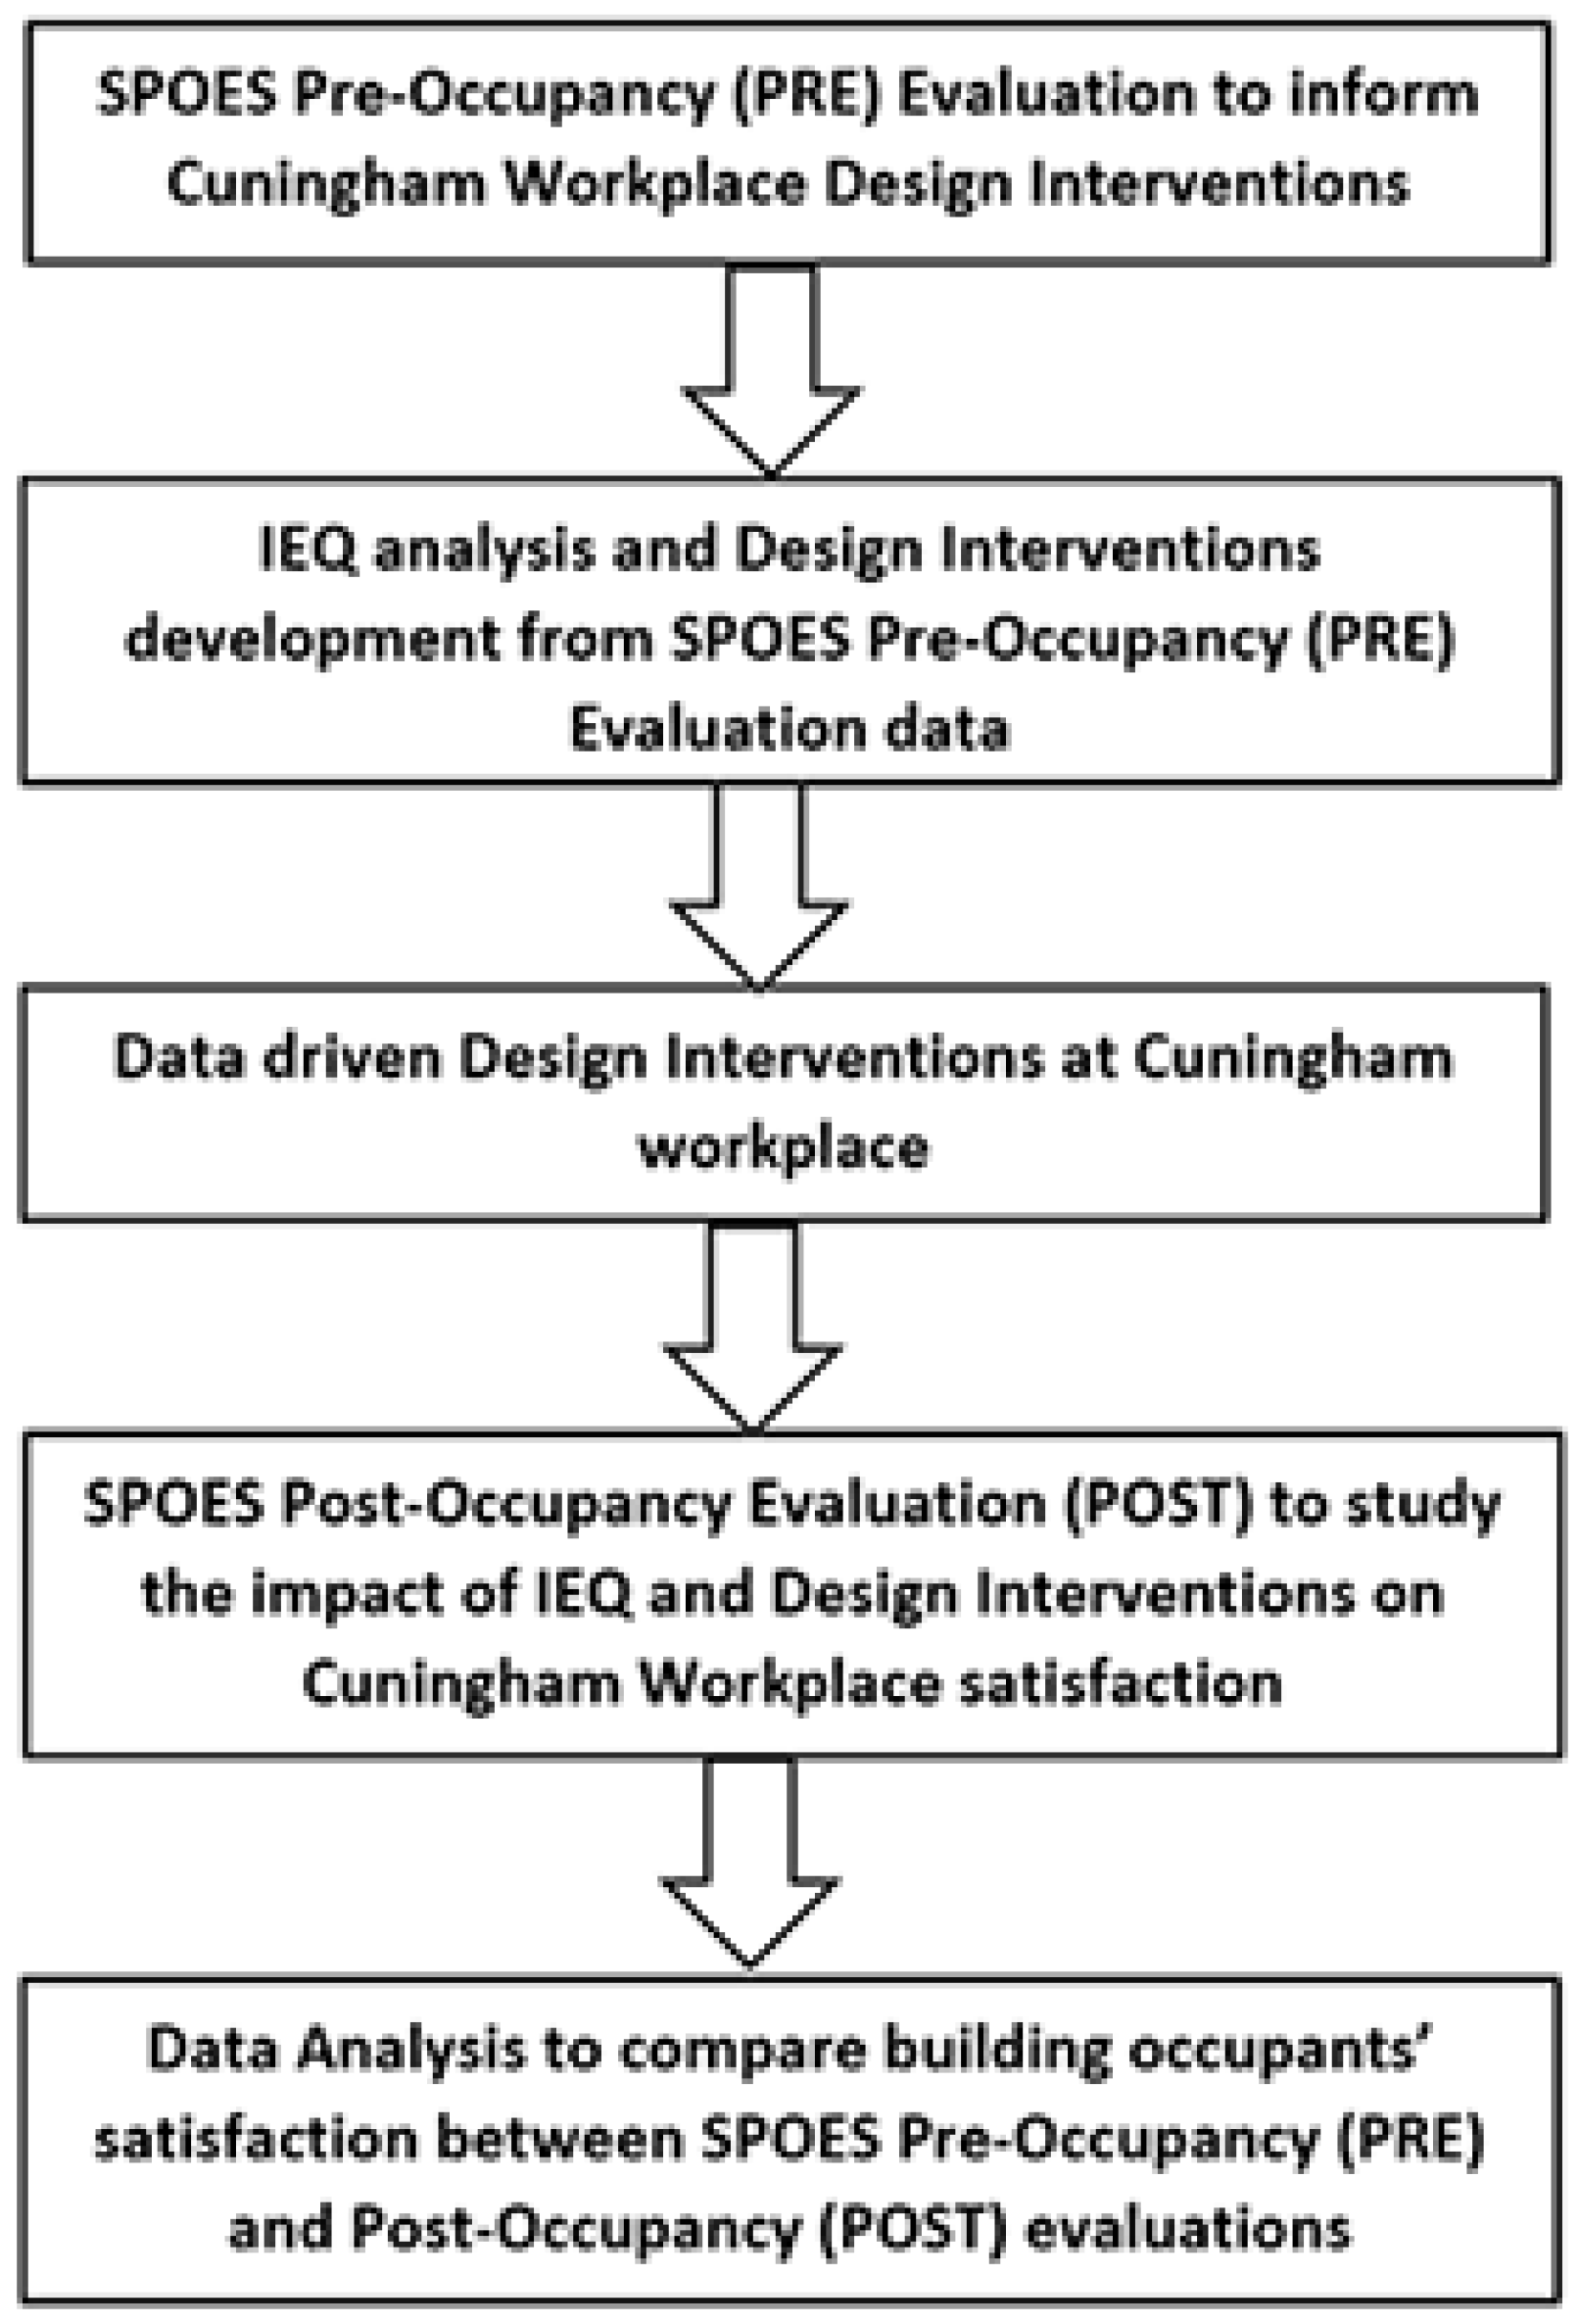
3. Materials and Methods

3.1. Instrument and Procedure

This study was designed to learn how building occupants’ satisfaction with IEQ changed after a major renovation at a design office (Figure 2). Between 2016 and 2019, the University of Minnesota interdisciplinary team conducted two SPOES at Cuningham Group facility as pre-and post-occupancy satisfaction evaluations. Two online surveys were administered via Qualtrics and sent to employees who work in the facility as invitation emails with embedded links. After an 8-day period, to sustain response rate, the team initiated the first reminder email. After one more week, a second reminder email followed to enhance response rate. They reported their satisfaction on 7-Likert scale from 1 (very dissatisfied) to 7 (very satisfied) and the results from pre-design survey (PRE) (n = 130) were compared to the results from post-design survey (POST) (n = 102). The team standardized the language used in the Qualtrics surveys, the invitation and reminder emails to ensure consistency and minimize potential biases (e.g., variances in responses due to differences in survey language). The pre-occupancy evaluation informed the design team at Cuningham Group to create design interventions for their existing workplace. The post-occupancy evaluation indicated the impacts of these interventions on the satisfaction of the employees in the facility. Each evaluation resulted in a SPOES report including the facility information, occupant characteristics, descriptive statistics (categories scores, IEQ Score, standard deviations, and number of responses), and open-ended explanations of IEQ ratings. The SPOES survey tool was approved by the university Institutional Review Board (IRB).

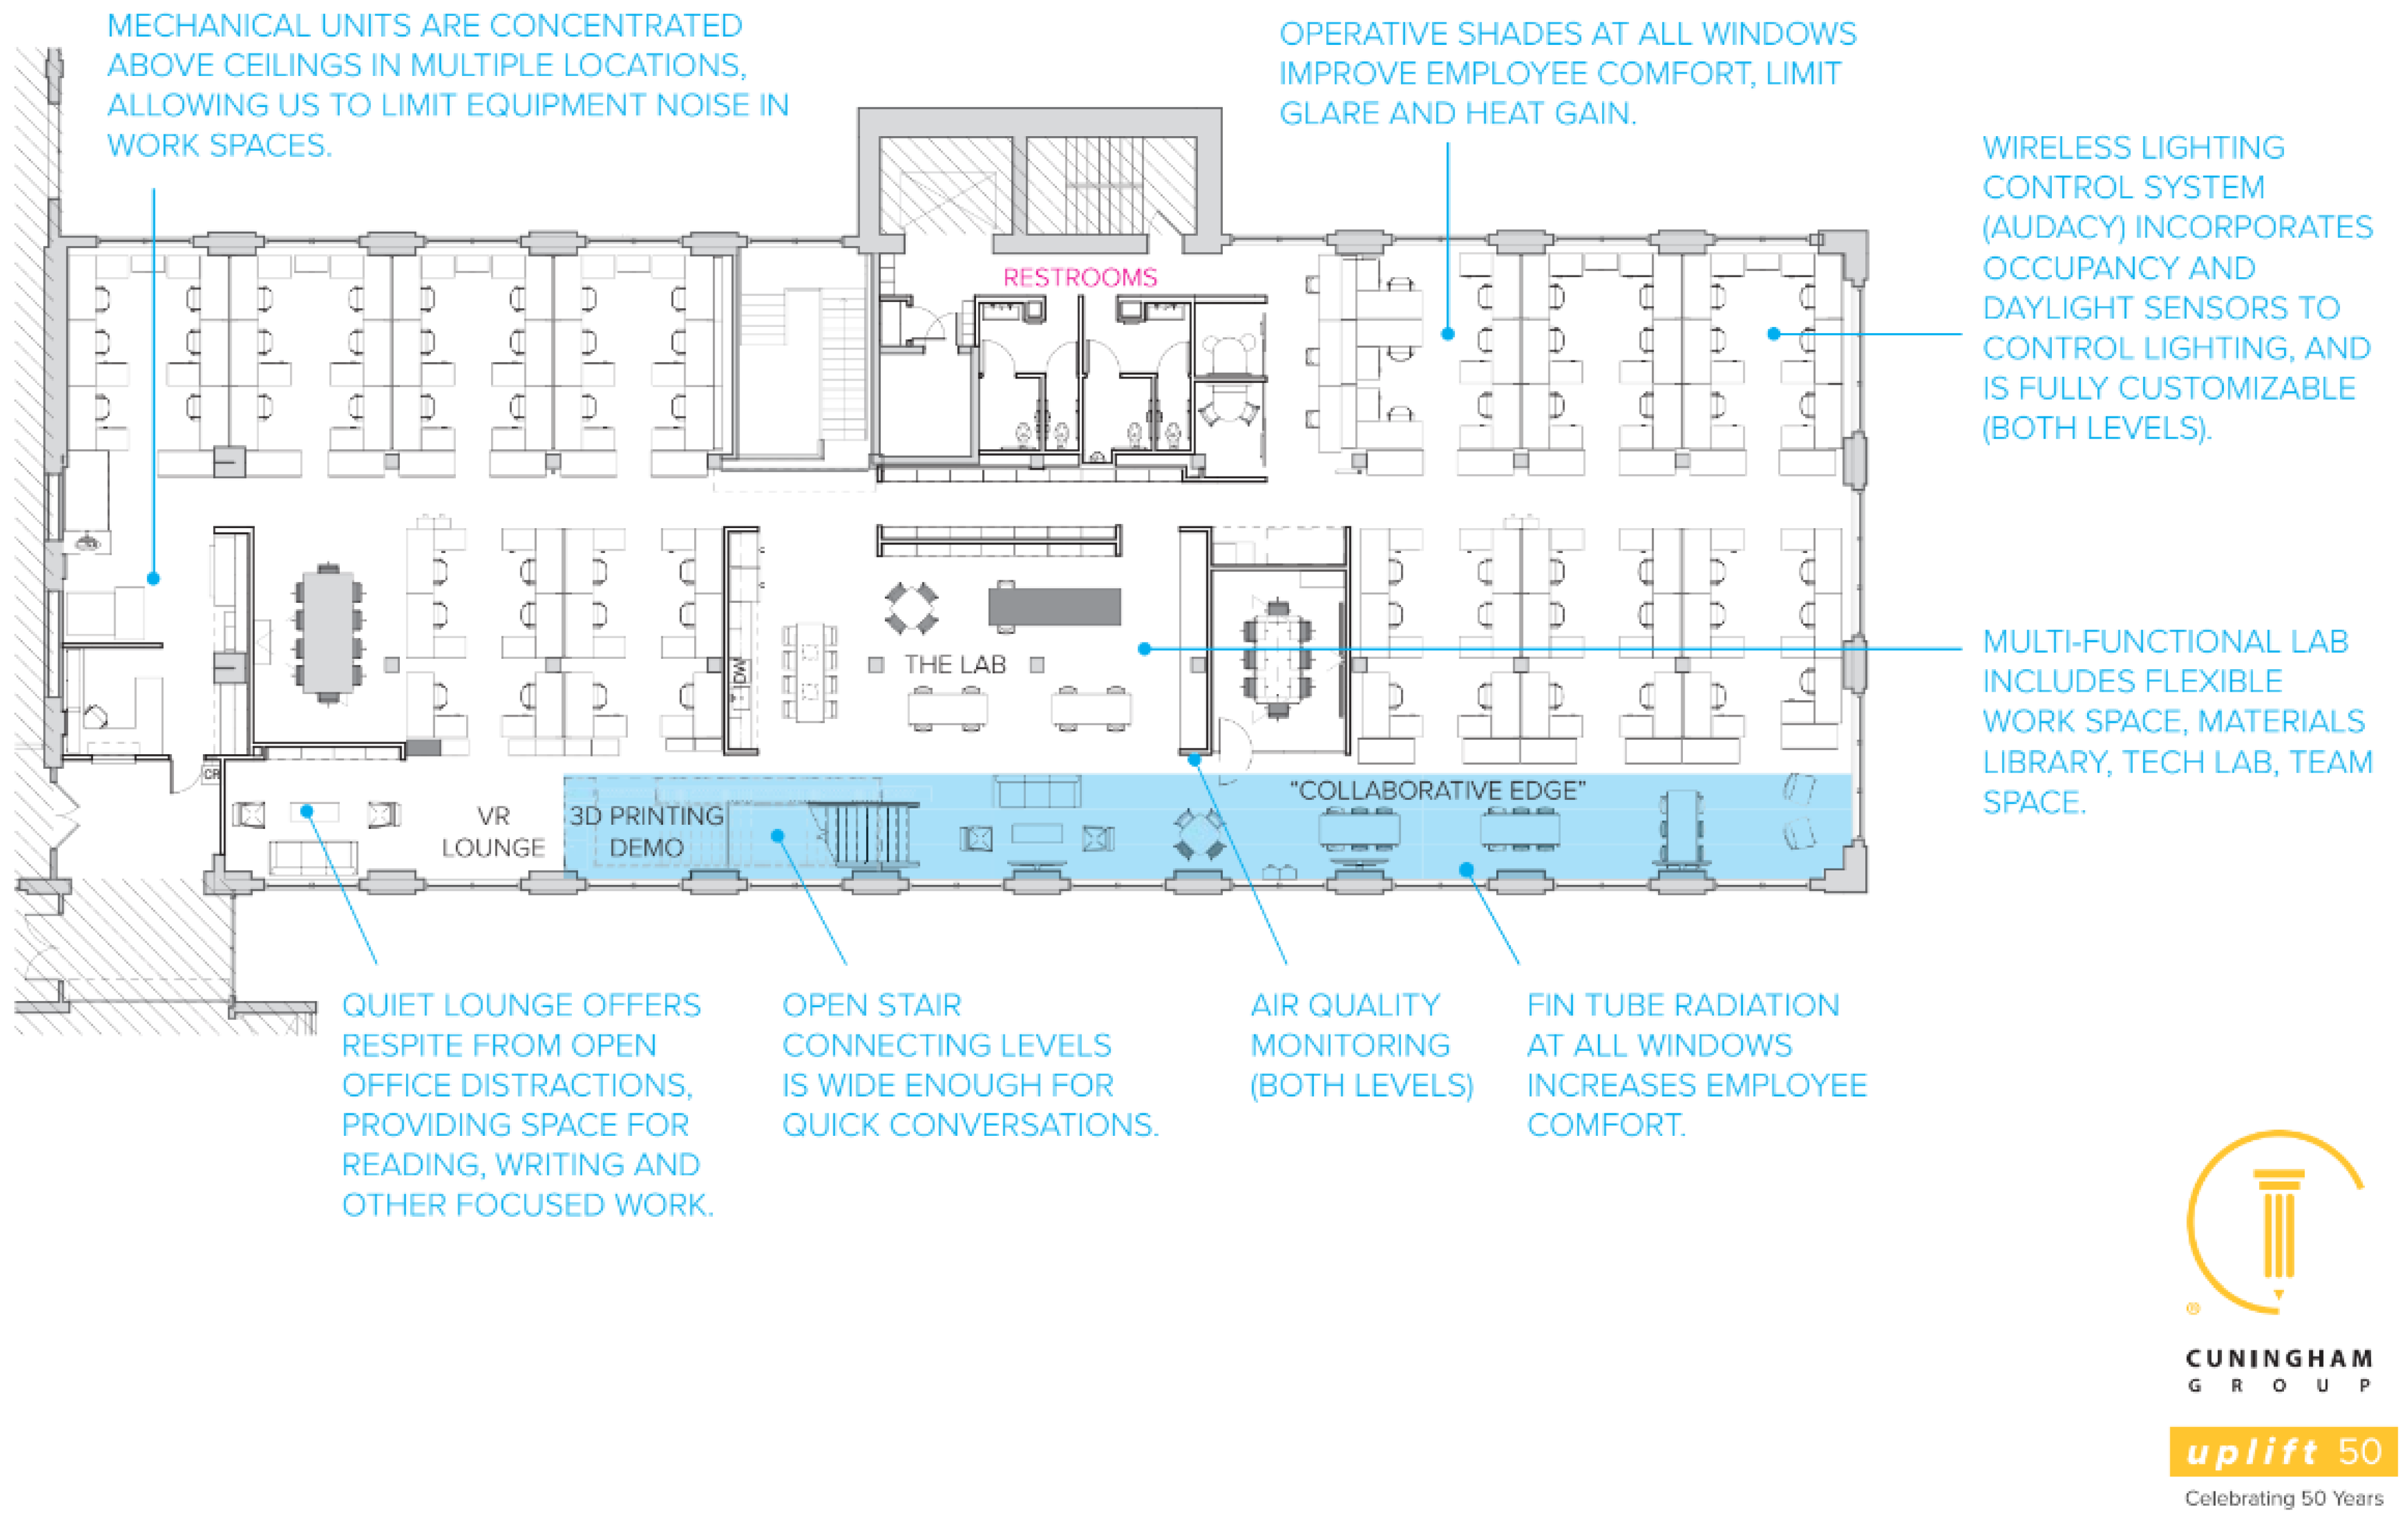
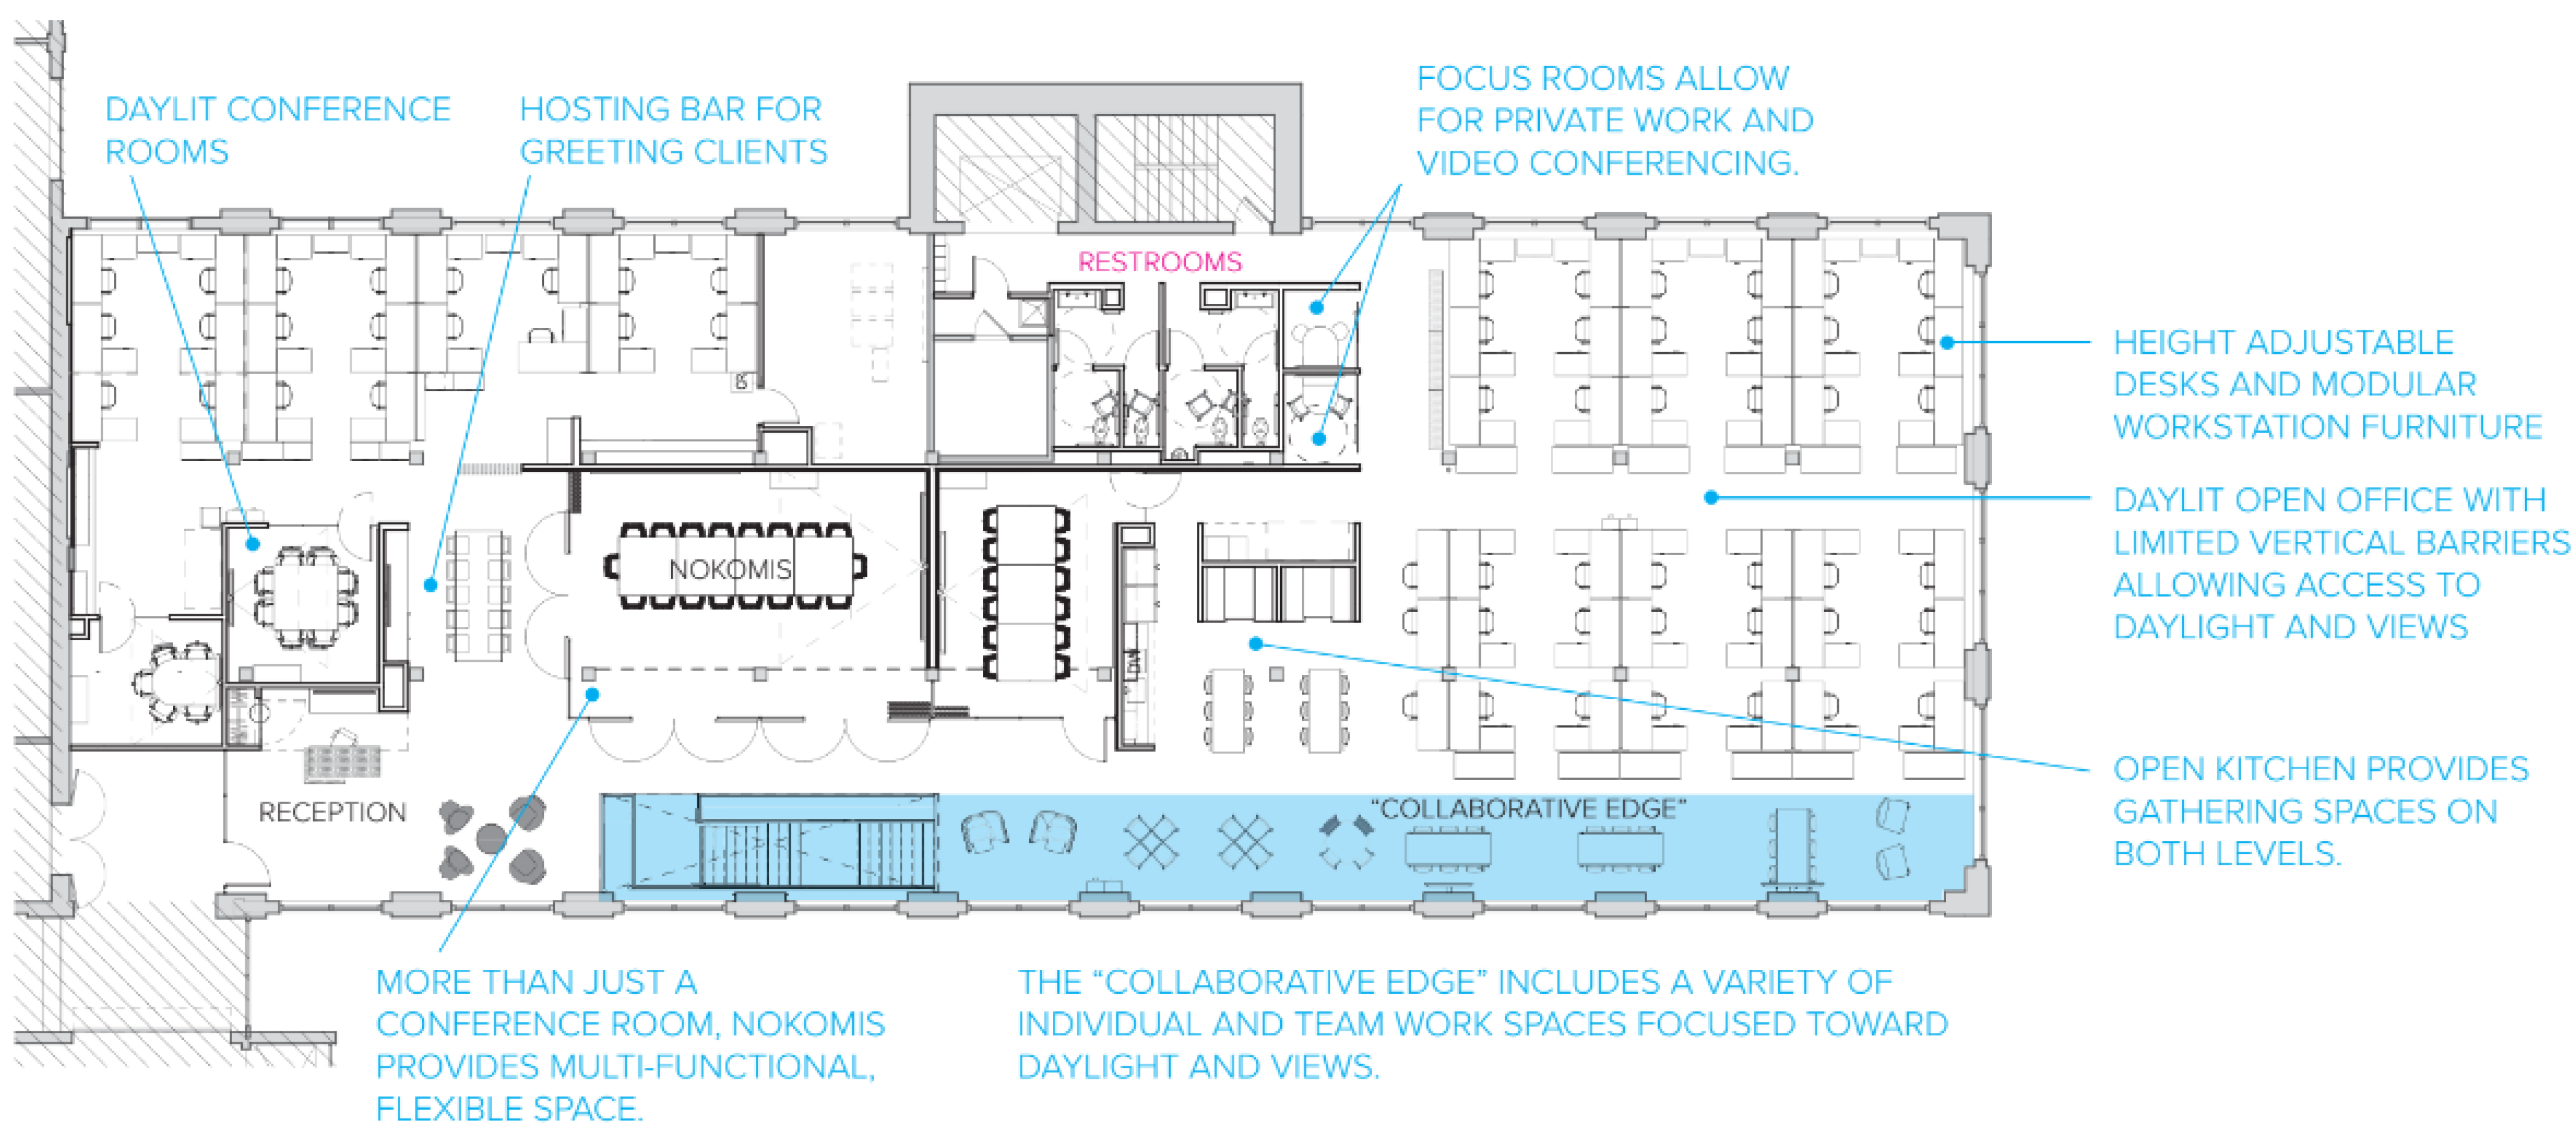
3.2. Participants and Design Interventions

One of the major goals of the Cuningham Group for the proposed design intervention was to improve the indoor environment quality for their office staff using data collected from the pre-occupancy evaluation survey. The SPOES pre-occupancy survey findings provided the Cuningham Group design team with data about primary workspace satisfaction, impact of the indoor environment on work performance and health, and satisfaction with IEQ factors (acoustics, aesthetics, daylighting, electric lighting, furnishings, technology, thermal, view conditions, etc.). The old layout of the Cuningham Group office space was primarily an open office layout with conference rooms, a materials library, and other tech support spaces (Figure 3). The findings from the pre-survey impacted the design interventions that were proposed for the newly renovated office. The design interventions included height-adjustable desks, daylight collaborative spaces, daylight open offices and conference rooms, flexible multifunctional conference rooms, and an open kitchen providing a gathering space and a hosting bar for greeting clients (Figure 4).

3.3. Pre-Occupancy Evaluation

In December 2016, the pre-occupancy evaluation was sent to 192 employees/occupants of the facility. The response rate was approximately 70% (n = 130) including 56% male, 43% female, and 1% other. The mean age of occupants was 41 years, ranging from 21 to 77 years old. Among those, 69% of the occupants reported that they worked at the Cuningham facility for over 2 years, 15% reported working there for 1–2 years, and only 16% spent less than one year at this building. For typical working hours, 75% of the occupants reported more than 40 h per week in the facility; 15% reported 30–40 h per week; 3% reported 20–29 h, and 7% less than 20 h. Furthermore, 65% of the occupants reported spending more than 75% of their weekly working hours in their primary workplace; for 21%, the percentage was 51–75%; 11% spent 25–50%; and 3% spent less than 25% of their total hours. These percentages indicate the amount of time employees/occupants were exposed to IEQ conditions in their primary workplace. The Cuningham facility, overall, includes open office areas (Figure 5) with 75% of the occupants having their primary workplace within 15 feet of an exterior window while another 24% did not have their spaces within 15 feet of an exterior window, and the remaining 1% were unable to identify the distance.
The occupants reported that their workplace neither hindered nor enhanced their satisfaction, work performance, and perceived health with the means of 4.20, 3.86, and 3.86 on a 7-point scale, respectively. Lighting (amount and adjustability), humidity, view conditions, and technology were among the IEQ criteria that earned the highest ratings. Thermal (adjustability and temperature), furnishing, privacy (acoustical and visual), and appearance had the lowest ones. The overall scorecard resulted in a value of 3.57 over 7 and represented a neutral perception of the occupants of the built environment. For the open-ended responses, the occupants suggested improvements in (1) acoustical/visual privacy, (2) thermal conditions, and (3) task lighting. With (1) acoustical/visual privacy, having measures to identify the source of noise and delegate task-based acoustical/visual treatments in the primary workplace were important. For instance, one recommendation from the survey was to “develop specialized acoustical performance requirements to support functional programming employees’ tasks (e.g., sources of recurrent noise that need to be controlled, special user populations that may have distinct auditory performance limitations, or multiple uses of building spaces that may have different acoustic criteria)”. Another was to “identify and apply appropriate acoustics modeling software for the project”. Another recommendation proposed was to “identify employees’ privacy concerns via focus groups or log complaints relative to privacy to determine if visual or audio privacy is most affected”.
For (2) thermal conditions, temperature needed to respond to specific activities (e.g., sitting, standing) and the space layout/configuration. For example: “Determine special thermal comfort requirements or problems that may be encountered in the building due to the work activities, duration of sitting, or design/layout considerations. Focus groups can be useful in identifying problem locations”. For (3) task lighting, while occupants were satisfied with the current amount and adjustability, they also called for attention to how lighting quality would change with prospective interior design interventions (e.g., the reconfiguration of the spaces). For instance, with the same skylights, the lighting requirements for a closed meeting room (Figure 6) differed from an open, shared workplace (Figure 7). A sample suggestion is as follows: “Determine if any task areas differ now from original intent to be sure lighting quality and quantity are not impeded by physical changes to the space (i.e., walls, ceilings, furnishings, fixtures, or equipment)”. Another example included quantifiable approaches for lighting interventions: “Identify employees’ lighting performance criteria that are to be met to achieve goals by conducting onsite measurements of existing illuminance (foot-candles) levels and compare them to standards for employees’ tasks as identified by the Illuminating Engineering Society (IES)”.
The design interventions that resulted from the pre-occupancy evaluation are discussed in the next section via a comparison of the existing layout (Figure 6) and new reconfiguration (Figure 4). The facility structures remained the same while interior spaces changed to reflect the new needs of Cuningham Group and address the above concerns of the occupants.

3.4. Post-Occupancy Evaluation

In December 2018, the post-occupancy evaluation was sent to 111 employees with their new workplace (Figure 7, Figure 8 and Figure 9) in the facility. The approximate response rate was 92% (n = 102) including 57% male, 42% female, and 1% other. The mean age of employees/occupants was 43 years, ranging from 22–79 years of age. Among them, 79% of the occupants reported working at the Cuningham facility for over 2 years, 14% working there for 1–2 years, and only 7% spent less than one year at this site. Regarding the weekly working hours, 78% of the occupants reported spending more than 40 h per week in the facility, 18% reported around 30–40 h per week, 2% reported 20–29 h per week, and 2% less than 20 h per week. For weekly time spent in their primary workplace, 64% of the occupants reported more than 75% of their weekly working hours, 21% spent 51–75%, 8% spent 25–50%, and 6% spent less than 25% of their time. These responses indicated the amount of time occupants were exposed to IEQ conditions in their workplace. The new interior of the Cuningham facility still includes open office areas as primary workplaces for employees/occupants (Figure 7). Moreover, 68% of occupants have their primary workplace within 15 feet of an exterior window, 31% were not within 15 feet, and 1% did not know the distance.
Overall, the occupants reported that the new interior of their workplace enhanced their workplace satisfaction and work performance with the increased means of 4.64 and 4.62 on a 7-point scale. Their rating for perceived health also increased to a mean of 4.43. Occupants indicated satisfaction in almost every IEQ criterion with the lowest rating of 4.55 and the highest rating of 5.93. While their concerns of (3) task lighting were addressed, occupants still desired some improvements in (1) acoustical/visual privacy and (2) thermal conditions (temperature adjustability). For instance, occupants felt neither satisfied nor dissatisfied with overall thermal conditions and temperature and the ratings for them were 4.06 and 3.72, respectively. Regarding temperature adjustability, occupants suggested adopting new design interventions.

3.5. Data Analysis

To compare building occupants’ satisfaction between pre-occupancy (PRE) and post-occupancy (POST) evaluations, Mann–Whitney U tests were conducted due to the non-normality of the data distributions. The normality of data distribution was tested through Shapiro–Wilk tests in SPSS because of the size of data. As log-transformation was not able to normalize the data, Mann–Whitney U tests were conducted to see differences between two independent samples (e.g., PRE and POST). For the data analyses, SPSS 25 was used to compare the means from the two independent samples and summarize the results.

4. Results

Table 1 describes the demographic characteristics (e.g., age, gender, tenure, weekly work hours, and time in the primary workspace) for both PRE and POST evaluations. None of demographic characteristics had been statistically changed from PRE to POST stages. Overall, the occupants were highly satisfied with the primary workspace as well as IEQ (see Table 2). The average satisfaction score was statistically improved from PRE (M = 3.86) to POST (M = 4.62). Specifically, they were neither satisfied nor dissatisfied with their primary workspace at PRE, but they became satisfied at POST, after renovation. Similarly, the occupants perceived better work performance (ΔM = 0.57) and health (ΔM = 0.59) at POST.
All IEQ satisfaction scores were improved from PRE to POST. However, the improvement in the satisfaction scores of the IEQ factor regarding acoustic qualities (ΔM = 0.25−0.36), amount of daylighting (ΔM = 0.38), and temperature (ΔM = 0.33) were not statistically significant. Acoustic qualities, especially, were not significantly improved as the office had an open plan with workstations before and after renovation, even though the satisfaction scores in acoustic qualities slightly increased.
The biggest improvement in IEQ factor was the adjustability of task lighting (ΔM = 2.47) followed by overall appearance/aesthetics (ΔM = 2.25) and adjustability of furnishings (ΔM = 1.98). Prior to the renovation, only selected workstations had task lighting, whereas all desks had task lighting post-renovation. This study further investigated how the occupants were differently satisfied with electric lighting conditions (see Table 3). Satisfaction scores in all electric lighting conditions showed statistically significant improvements. As the most significant improvement in adjustability of task lighting, quality of task lighting (ΔM = 2.14) was the most improved feature. Not only function of electric lighting (e.g., ease of turning and effectiveness of automatic systems) but also visual and acoustic comfort of lighting were significantly improved. In addition, satisfaction with IEQ factors related to electric lighting (ΔM = 1.27−1.77), cleaning and maintenance (ΔM = 1.32), and function of furnishings (ΔM = 1.77) were significantly improved. Although the occupants were not satisfied nor dissatisfied with privacy at POST (M = 3.22), the score was statistically improved from PRE, indicating dissatisfaction (M = 2.71).

5. Discussion

The pre-and post-occupancy analyses of the Cuningham Group headquarters discussed in this article provide a comprehensive measure of design interventions on occupant satisfaction. With regards to the first research question, how pre-and post-occupancy evaluation surveys play a role in the design process and inform design interventions, the findings align with other studies that demonstrate the critical role of IEQ categories on occupant satisfaction in the built environment [19,35,36] The pre-and post-occupancy evaluation analyses conducted for the Cuningham Group were instrumental in assessing occupant satisfaction with IEQ metrics for comfort, satisfaction, and performance [19,20]. Specifically, the pre-occupancy evaluation provided feedback from occupants on elements of the built environment that were harder to quantify, such as environmental satisfaction, comfort, health, and performance, which informed the design interventions in the renovated space.
As shown in Table 2, the pre-occupancy evaluation highlighted Cuningham Group occupants’ dissatisfaction with ten IEQ criteria (adjustability of task lighting, adjustability of thermal conditions, adjustability of furnishings, temperature, overall furnishings, overall thermal conditions, overall appearance/aesthetics, overall acoustic quality, overall privacy, and ability to limit undesired sounds). The pre-occupancy evaluation also highlighted that occupants were neither satisfied or dissatisfied with ten more IEQ criteria (access to electric outlets, overall vibration and movement, amount of electric light, air velocity, adjustability of daylighting, overall electric lighting conditions, overall indoor air quality, overall indoor air quality, overall cleaning and maintenance, ability to hear desired sounds, and function of furnishings). These survey findings informed the design strategies such as including height adjustable desks, daylight collaborative spaces, daylight open offices and conference rooms, and focus rooms with acoustical control in the newly renovated space. Their impacts were consequently measured in the post-occupancy evaluation to study their impact on occupant satisfaction.
With regards to the second research question, whether design interventions impact occupant satisfaction, the biggest improvement in IEQ factor was the adjustability of task lighting (ΔM = 2.47), followed by overall appearance (aesthetics) (ΔM = 2.25) and adjustability of furnishings (ΔM = 1.98). Satisfaction with electric lighting, cleaning and maintenance, and function of the furnishings were also significantly improved. These findings align with previous studies that building occupants are considered the best source of information about their needs and comfort requirements, particularly when studying office environment [18]. Furthermore, the findings align with previous literature that occupants’ perceptions of IEQ (thermal comfort, noise, light, and air quality) and environmental parameters (air movement, privacy, office layout, office decoration, cleanliness, and the view from windows) affect their comfort and consequently their health, well-being, and productivity [2,5,16,17]. The study approach aligns with previous research methods of using pre-and post-occupancy evaluations to improve the built environment for end users [17,35]. The study results highlight how design improvements enhance employees’ satisfaction with the environmental features and how pre-and post-occupancy evaluation can inform design practitioners in developing better design solutions that impact occupants’ workplace satisfaction.

6. Conclusions

In this article, we discussed a comprehensive measure of the impact of the data-driven design interventions which were derived from using pre-and post-occupancy evaluation survey methodology on occupant satisfaction. The results of the pre-and post-occupancy evaluation surveys indicated positive impacts of design interventions on occupant satisfaction at the Cuningham Group facility. The average satisfaction score of occupants improved from neither satisfied nor dissatisfied satisfied to satisfied with the primary workspace. In terms of Indoor Environment Quality criteria, the pre-occupancy evaluation survey showed high occupant satisfaction in the amount and adjustability of lighting, humidity, view conditions, and technology. Design interventions, as shown in the post-occupancy survey, improved these criteria even more. In the pre-occupancy survey, on the other hand, thermal adjustability and temperature, furnishing, acoustical plus visual privacy, and appearance resulted in the lowest satisfaction. Design interventions, again, significantly enhanced occupant satisfaction with temperature, furnishing, and appearance. Although improved after the renovation, occupants were neither satisfied nor dissatisfied with acoustic and visual privacy. Above all, the design interventions addressed three out of the four concerns that occupants were dissatisfied with before the renovation in the pre-occupancy survey. The pre-and post-occupancy evaluation analysis confirmed the effectiveness of design interventions at the Cuningham Group facility. One limitation of this study, however, is that the pre-and post-occupancy analysis was limited to one case, the Cuningham Group headquarters. Future research can focus on replicating the same analysis in other workplace buildings/renovation projects to gather data and create a database of which design interventions are effective and which are not.

Author Contributions

Conceptualization, A.A. and H.V.; methodology, A.A., H.V. and S.B.; software, S.B.; validation, A.A., H.V. and S.B.; formal analysis, S.B. and H.V.; investigation, A.A. and S.B.; resources, A.A.; data curation, H.V. and S.B.; writing—original draft preparation, H.V.; writing—review and editing, A.A., H.V. and S.B.; visualization, Cuningham Group; supervision, A.A.; project administration, A.A.; funding acquisition, A.A. All authors have read and agreed to the published version of the manuscript.

Funding

This work was supported by the United States Department of Agriculture (USDA) National Institute of Food and Agriculture (NIFA) grant and University of Minnesota Agriculture Research and Extension (AES) program. Accession no. 1006661, project no. MIN-53-032.

Institutional Review Board Statement

University of Minnesota, Institutional Review Board (IRB) reviewed and determined the study to be exempt from IRB review in one of the following categories 45 CFR 46.101(b): #1 Instructional Strategies in Educational Settings. #2 Surveys/Interviews; Standardized Educational Tests; Observation of Public Behavior. #3 Public Officials; Surveys/Interviews; Observation of Public Behavior. #4 Existing Data; Records Review; Pathological Specimens. #6 Taste Testing and Food Quality Evaluation.

Informed Consent Statement

Informed consent was obtained from all subjects involved in the study.

Data Availability Statement

The data presented in this study are not available to maintain privacy of participants. Any questions about data can be addressed directly the corresponding author.

Acknowledgments

The authors would like to acknowledge the Cuningham Group Minneapolis, Minnesota, USA Office for their collaboration on this project.

Conflicts of Interest

The authors declare no conflict of interest. The funders had no role in the design of the study; in the collection, analyses, or interpretation of data; in the writing of the manuscript, or in the decision to publish the results.

References

  1. Darby, A.; Natarajan, S.; Coley, D.; Maskell, D.; Walker, I.; Brownjohn, J. Impact of Sustainable Building Design on Occupant Experience: A Human Centered Approach. In Proceedings of the Fifth International Conference on Sustainable Construction Materials and Technologies, Kingston University, London, UK, 14–17 July 2019; pp. 1–12. [Google Scholar]
  2. Jin, Q.; Wallbaum, H. Improving Indoor Environmental Quality (IEQ) for Occupant Health and Well-Being: A Case Study of Swedish Office Building. In Proceedings of the IOP Conference Series: Earth and Environmental Science, Gothenburg, Sweden, 2–4 November 2020; Volume 588, p. 32072. [Google Scholar]
  3. Choi, J.-H.; Loftness, V.; Aziz, A. Post-Occupancy Evaluation of 20 Office Buildings as Basis for Future IEQ Standards and Guidelines. Energy Build. 2012, 46, 167–175. [Google Scholar] [CrossRef]
  4. Cheung, T.; Schiavon, S.; Graham, L.T.; Tham, K.W. Occupant Satisfaction with the Indoor Environment in Seven Commercial Buildings in Singapore. Build. Environ. 2021, 188, 107443. [Google Scholar] [CrossRef]
  5. Asojo, A.O.; Vo, H.; Bae, S. Sustainable Post-Occupancy Evaluation Survey (SPOES): An Approach to Human Factors in Minnesota State-Funded Buildings. In Proceedings of the 2020 HFES 64th International Annual Meeting, Chicago, IL, USA, 5–9 October 2020; pp. 1120–1124. [Google Scholar]
  6. Parkinson, T.; Parkinson, A.; de Dear, R. Continuous IEQ Monitoring System: Performance Specifications and Thermal Comfort Classification. Build. Environ. 2019, 149, 241–252. [Google Scholar] [CrossRef] [Green Version]
  7. Gui, X.; Gou, Z. Association between Green Building Certification Level and Post-Occupancy Performance: Database Analysis of the National Australian Built Environment Rating System. Build. Environ. 2020, 179, 106971. [Google Scholar] [CrossRef]
  8. Keeler, M.; Vaidya, P. Fundamentals of Integrated Design for Sustainable Building; John Wiley & Sons: New York, NY, USA, 2016. [Google Scholar]
  9. B3 Minnesota Indoor Environmental Quality. Available online: https://www.b3mn.org/guidelines/3-0/ieq/ (accessed on 2 February 2020).
  10. Asojo, A.O.; Vo, H.; Bae, S. A Human-Centric Qualitative Analysis of Electric and Daylighting Interventions in Workplace Buildings; Gültekin, A.B., Ed.; IntechOpen: Dallas, TX, USA, 2019; pp. 3–12. [Google Scholar]
  11. Bae, S.; Martin, C.S.; Asojo, A.O. Indoor Environmental Quality Factors That Matter to Workplace Occupants: An 11-Year-Benchmark Study. Build. Res. Inf. 2021, 49, 445–459. [Google Scholar] [CrossRef]
  12. Asojo, A. Indoor Environmental Quality + Workplace Environment: Cuningham Group Office Facility; College of Design, University of Minnesota: Saint Paul, MN, USA, 2016. [Google Scholar]
  13. Roa, C.D.; Schiavon, S.; Parkinson, T. Targeted Occupant Surveys: A Novel Method to Effectively Relate Occupant Feedback with Environmental Conditions. Build. Environ. 2020, 184, 107129. [Google Scholar]
  14. Mustafa, F.A. Performance Assessment of Buildings via Post-Occupancy Evaluation: A Case Study of the Building of the Architecture and Software Engineering Departments in Salahaddin University-Erbil, Iraq. Front. Archit. Res. 2017, 6, 412–429. [Google Scholar] [CrossRef]
  15. Li, P.; Froese, T.M.; Brager, G. Post-Occupancy Evaluation: State-of-the-Art Analysis and State-of-the-Practice Review. Build. Environ. 2018, 133, 187–202. [Google Scholar] [CrossRef] [Green Version]
  16. Roberts, C.J.; Edwards, D.J.; Hosseini, M.R.; Mateo-Garcia, M.; Owusu-Manu, D.-G. Post-Occupancy Evaluation: A Review of Literature. Eng. Constr. Archit. Manag. 2019, 26, 2084–2106. [Google Scholar] [CrossRef]
  17. Sanchez Leitner, D.; Christine Sotsek, N.; de Paula Lacerda Santos, A. Postoccupancy Evaluation in Buildings: Systematic Literature Review. J. Perform. Constr. Facil. 2020, 34, 3119002. [Google Scholar] [CrossRef]
  18. Sakellaris, I.A.; Saraga, D.E.; Mandin, C.; Roda, C.; Fossati, S.; De Kluizenaar, Y.; Carrer, P.; Dimitroulopoulou, S.; Mihucz, V.G.; Szigeti, T.; et al. Perceived Indoor Environment and Occupants’ Comfort in European “Modern” Office Buildings: The OFFICAIR Study. Int. J. Environ. Res. Public Health 2016, 13, 444. [Google Scholar] [CrossRef] [Green Version]
  19. Graham, L.T.; Parkinson, T.; Schiavon, S. Where Do We Go Now? Lessons Learned from 20 Years of CBE’s Occupant Survey. Build. Cities 2021, 2, 166–184. [Google Scholar] [CrossRef]
  20. Altomonte, S.; Saadouni, S.; Schiavon, S. Occupant Satisfaction in LEED and BREEAM-Certified Office Buildings. In Proceedings of the PLEA 2016-36th International Conference on Passive and Low Energy Architecture: Cities, Buildings, People: Towards Regenerative Environments, Los Angeles, CA, USA, 10–13 July 2016. [Google Scholar]
  21. Parkinson, A.T.; Reid, R.; McKerrow, H.; Wright, D. Evaluating Positivist Theories of Occupant Satisfaction: A Statistical Analysis. Build. Res. Inf. 2018, 46, 430–443. [Google Scholar] [CrossRef]
  22. Rasheed, E.O.; Byrd, H. Can a Naturally Ventilated Office Outperform a Mixed Mode Office? Pilot Study on Occupants’ Comfort. Build. Environ. 2018, 137, 34–40. [Google Scholar] [CrossRef]
  23. Arup BUS Methodology. Available online: https://busmethodology.org.uk/ (accessed on 5 October 2021).
  24. Kim, J.; De Dear, R. Nonlinear Relationships between Individual IEQ Factors and Overall Workspace Satisfaction. Build. Environ. 2012, 49, 33–40. [Google Scholar] [CrossRef] [Green Version]
  25. Geng, Y.; Ji, W.; Wang, Z.; Lin, B.; Zhu, Y. A Review of Operating Performance in Green Buildings: Energy Use, Indoor Environmental Quality and Occupant Satisfaction. Energy Build. 2019, 183, 500–514. [Google Scholar] [CrossRef]
  26. Geng, Y.; Ji, W.; Lin, B.; Zhu, Y. The Impact of Thermal Environment on Occupant IEQ Perception and Productivity. Build. Environ. 2017, 121, 158–167. [Google Scholar] [CrossRef]
  27. Altomonte, S.; Schiavon, S.; Kent, M.G.; Brager, G. Indoor Environmental Quality and Occupant Satisfaction in Green-Certified Buildings. Build. Res. Inf. 2019, 47, 255–274. [Google Scholar] [CrossRef] [Green Version]
  28. Kamaruzzaman, S.N.; Egbu, C.O.; Mahyuddin, N.; Ahmad Zawawi, E.M.; Chua, S.J.L.; Azmi, N.F. The Impact of IEQ on Occupants’ Satisfaction in Malaysian Buildings. Indoor Built Environ. 2018, 27, 715–725. [Google Scholar] [CrossRef]
  29. Kaul, N.; Parik, K. Assessment of Indoor Environmental Quality and Impacts on Occupants: Case Study of MNIT Jaipur. In Indoor Environmental Quality; Springer: Berlin/Heidelberg, Germany, 2020; pp. 119–123. [Google Scholar]
  30. Tekce, I.; Ergen, E.; Artan, D. Structural Equation Model of Occupant Satisfaction for Evaluating the Performance of Office Buildings. Arab. J. Sci. Eng. 2020, 45, 8759–8784. [Google Scholar] [CrossRef]
  31. Salamone, F.; Belussi, L.; Currò, C.; Danza, L.; Ghellere, M.; Guazzi, G.; Lenzi, B.; Megale, V.; Meroni, I. Integrated Method for Personal Thermal Comfort Assessment and Optimization through Users’ Feedback, IoT and Machine Learning: A Case Study. Sensors 2018, 18, 1602. [Google Scholar] [CrossRef] [Green Version]
  32. Bavaresco, M.V.; D’Oca, S.; Ghisi, E.; Lamberts, R. Methods Used in Social Sciences That Suit Energy Research: A Literature Review on Qualitative Methods to Assess the Human Dimension of Energy Use in Buildings. Energy Build. 2019, 209, 109702. [Google Scholar] [CrossRef]
  33. Coleman, S.; Robinson, J.B. Introducing the Qualitative Performance Gap: Stories about a Sustainable Building. Build. Res. Inf. 2018, 46, 485–500. [Google Scholar] [CrossRef]
  34. Jayathissa, P.; Quintana, M.; Abdelrahman, M.; Miller, C. Humans-as-a-Sensor for Buildings—Intensive Longitudinal Indoor Comfort Models. Buildings 2020, 10, 174. [Google Scholar] [CrossRef]
  35. El Asmar, M.; Chokor, A.; Srour, I. Are Building Occupants Satisfied with Indoor Environmental Quality of Higher Education Facilities? Energy Procedia 2014, 50, 751–760. [Google Scholar] [CrossRef] [Green Version]
  36. Lee, M.C.; Mui, K.W.; Wong, L.T.; Chan, W.Y.; Lee, E.W.M.; Cheung, C.T. Student Learning Performance and Indoor Environmental Quality (IEQ) in Air-Conditioned University Teaching Rooms. Build. Environ. 2012, 49, 238–244. [Google Scholar] [CrossRef]
Figure 1. Cuningham Group facility.
Sustainability 13 13571 g001
Figure 2. Cuningham pre-and post-occupancy workplace evaluation process describing the steps applied in the study.
Sustainability 13 13571 g002
Figure 3. Existing workplace layout prior to design intervention. Image courtesy of Cuningham Group, Minneapolis.
Sustainability 13 13571 g003
Figure 4. New configuration. Image courtesy of Cuningham Group, Minneapolis.
Sustainability 13 13571 g004
Figure 5. Open office spaces. Image courtesy of Cuningham Group, Minneapolis.
Sustainability 13 13571 g005
Figure 6. Meeting room with skylights. Image courtesy of Cuningham Group, Minneapolis.
Sustainability 13 13571 g006
Figure 7. Open, shared workplace. Image courtesy of Cuningham Group, Minneapolis.
Sustainability 13 13571 g007
Figure 8. Reception and lounge. Image courtesy of Cuningham Group, Minneapolis.
Sustainability 13 13571 g008
Figure 9. Open meeting room. Image courtesy of Cuningham Group, Minneapolis.
Sustainability 13 13571 g009
Table 1. Participants’ demographic information at PRE and POST evaluations.
Characteristic PRE (n = 130)POST (n = 102)
M (SD)M (SD)
Age 40.85 (12.42)42.77 (12.34)
n (%)n (%)
GenderMale72 (56.7)56 (56.6)
Female54 (42.5)42 (42.4)
Other1 (0.8)1 (1.0)
Tenure (i.e., number of years in the workplace building)<1 year20 (15.7)7 (7.1)
1–2 years19 (15.0)14 (14.3)
>2 years88 (69.3)77 (78.6)
Weekly working hours<20 h8 (6.4)2 (2.0)
20–29 h4 (3.2)2 (2.0)
30–39 h19 (15.2)18 (18.4)
>40 h94 (75.2)76 (77.6)
Percentage of time in the primary workplace<25%4 (3.1)6 (6.1)
25–50%14 (11.0)8 (8.2)
50–75%27 (21.3)21 (21.4)
>75%82 (64.6)63 (64.3)
Table 2. Satisfaction scores at PRE and POST evaluations.
PREPOST
M (SD)M (SD)ΔMZ
Satisfaction3.86 (1.59)4.62 (1.64)0.763.73 ***
Work performance3.86 (1.48)4.43 (1.49)0.572.92 **
Perceived health4.05 (1.31)4.64 (1.30)0.593.40 **
Acoustic quality—Overall2.85 (1.61)3.21 (1.71)0.361.62
   Ability to hear desired sound3.52 (1.72)3.83 (1.69)0.311.48
   Ability to limit undesired sound2.45 (1.36)2.70 (1.61)0.250.91
Appearance (aesthetics)—Overall3.04 (1.74)5.29 (1.82)2.257.98 ***
Cleaning and maintenance—Overall3.58 (1.72)4.90 (1.75)1.325.43 ***
Daylighting conditions—Overall4.48 (1.94)5.00 (2.14)0.522.27 *
   Amount of daylighting4.67 (2.04)5.05 (2.24)0.381.72
   Adjustability of the daylighting3.72 (1.89)4.55 (2.09)0.843.14 **
Electric lighting conditions—Overall3.90 (1.65)5.17 (1.74)1.275.46 ***
   Amount of electric lighting4.09 (1.67)5.45 (1.60)1.366.00 ***
   Adjustability of the electric lighting3.13 (1.53)4.91 (1.78)1.776.99 ***
   Adjustability of the task lighting3.46 (1.98)5.93 (1.50)2.478.11 ***
Furnishings—Overall3.23 (1.74)4.95 (1.77)1.726.60 ***
   Adjustability of the furnishings3.30 (1.99)5.28 (1.78)1.986.85 ***
   Function of the furnishings3.43 (1.79)5.19 (1.74)1.776.79 ***
IAQ—Overall3.85 (1.63)5.00 (1.68)1.154.96 ***
Privacy—Overall2.71 (1.54)3.22 (1.62)0.512.41 *
Technology—Overall5.54 (1.30)5.88 (1.26)0.342.10 *
   Access to electric outlets4.25 (1.96)5.16 (1.74)0.913.47 **
Thermal conditions—Overall3.33 (1.71)4.06 (1.69)0.733.25 ***
   Temperature (hot or cold)3.39 (1.70)3.72 (1.71)0.331.56
   Air velocity (drafty or stagnant)3.83 (1.70)4.73 (1.71)0.93.87 ***
   Humidity (dry or moist)4.47 (1.54)4.95 (1.71)0.482.47 *
   Adjustability of the thermal conditions2.89 (1.58)3.38 (1.68)0.492.27 *
Vibration and movement—Overall3.91 (1.77)5.01 (1.73)1.14.48 ***
View conditions—Overall4.22 (1.98)4.95 (2.22)0.732.67 **
*** p < 0.001, ** p < 0.01, * p < 0.05.
Table 3. Lighting satisfaction at PRE and POST evaluations.
PREPOST
M (SD)M (SD)ΔMZ
Visual comfort of electric lighting4.15 (1.72)5.23 (1.62)1.094.74 ***
Amount of noise produced by electric lighting4.75 (1.55)5.72 (1.59)0.974.96 ***
Ease of controlling electric lighting3.90 (1.81)5.54 (1.54)1.746.85 ***
Effectiveness of automatic lighting sensors3.70 (1.86)5.35 (1.70)1.644.91 ***
Quality of task lighting3.46 (1.78)5.60 (1.53)2.147.53 ***
*** p < 0.001.
Publisher’s Note: MDPI stays neutral with regard to jurisdictional claims in published maps and institutional affiliations.

