Article

Sustainable Mountain-Based Health and Wellness Tourist Destinations: The Interrelationships between Tourists’ Satisfaction, Behavioral Intentions, and Competitiveness

1
Rattanakosin International College of Creative Entrepreneurship, Rajamangala University of Technology Rattanakosin, Bangkok 10700, Thailand
2
Civil and Architectural Engineering Institute, Panzhihua University, Panzhihua 617000, China
3
Sustainable Real Estate Research Center, Hong Kong Shue Yan University, Hong Kong 999077, China
*
Author to whom correspondence should be addressed.
Sustainability 2021, 13(23), 13314; https://doi.org/10.3390/su132313314
Submission received: 12 October 2021 / Revised: 15 November 2021 / Accepted: 21 November 2021 / Published: 1 December 2021
(This article belongs to the Special Issue Sustainable Entrepreneurship in Tourism and Sport)

Abstract

:
As mountain-based health and wellness tourism increases, destination competitiveness becomes ever fiercer. The pre-visit expectations and post-visit perceptions of tourists and the tourists’ behavioral intentions are related to the competitiveness of mountain-based health and wellness tourist destinations. Using structural equation modeling (SEM), we explored the factors that affect destination competitiveness and its relationships with tourism satisfaction and tourists’ behavioral intentions to return to and to recommend the location to others. We used a questionnaire for data collection from 550 tourists who visited a mountain-based health and wellness tourist destination in Panzhihua, China. The results suggested that there is an indirect positive correlation between tourists’ satisfaction and destination competitiveness, as well as a direct positive correlation between behavioral intentions and destination competitiveness, illustrating that tourist behavioral intentions can be an important factor in destination competitiveness. In the case of Panzhihua, the tourist source market in China has provided a competitive edge to this city. In addition, considering the environment’s capacity, developing an intention to return in tourists is important for tourism marketing in view of the increasing mountain-based health and wellness tourism competitiveness and concerns about sustainability.

1. Introduction

1.1. Fierce Competition in Tourist Destinations

In recent years, tourism has made significant contributions to local economies and has become vital to economic activity worldwide [1]. However, the tourism market is filled with numerous challenges [2], such as new client demands, tourist-saturated destinations, tourism phobia, infrastructure modernization, and the increasingly fierce competition between tourist destinations [3]. However, competitiveness between tourist destinations has been considered to be a prerequisite for its sustainability [4]. An increasing number of studies examining the impact of competitiveness on the tourism industry have been published on topics related to “tourism competitiveness”, for example, also known as “tourist destination competitiveness” and “destination competitiveness” [5], which are highly relevant in the academic field and have been studied for more than 30 years [6]. As the industry expands, competitive attractions and new tourist sources have become mainstream concerns in the international tourism market. Facing fierce competition from tourist locales, tourist agencies often highlight a destination’s sustainable management strategies as a way to encourage tourists’ interest in visiting and recommending it to others [7]. While the tourist source market is a prerequisite for the development and survival of any tourist destination, the source market and sustainable development is crucial for destinations in less developed areas, including those in mountain-based regions.

1.2. Sustainability in Health and Wellness Tourism Development after COVID-19

According to the United Nations World Tourism Organization (UNWTO in 2019, tourism has continued to expand and diversify over the last seven decades, becoming one of the world’s largest growing economic sectors. Emerging and even developed economies have benefited from the growth in tourism revenue. UNWTO (2020) reported that the total revenue for global tourism in 2019 had increased, reaching USD 5.8 trillion, which was an increase of 8.6% from the previous year and equivalent to 6.7% of the global GDP. The Report on the World Tourism Economy Trends (2021) by the World Tourism Cities Federation (WTCF) pointed out that due to the impact of COVID-19, the total number of global tourist arrivals (including domestic and international tourist arrivals) in 2020 decreased by 40.8%. The total global tourism income decreased to USD 2.92 trillion, which is the equivalent of this portion of the global GDP plummeting to 3.6%, which would be the lowest level since World War II.
According to the declarations made by the UNWTO on its website (https://www.unwto.org/news, 10 October 2021) in 5 July 2021, 42% of worldwide destinations had imposed travel restrictions. Due to the social-distancing protocols resulting from COVID-19, Beatriz et al. (2021) examined the fight against overcrowding in tourist destinations [8]. Thus, the market source is a vital factor in this study. Sustainable tourism maintains a manageable tourist population at popular destinations and limits the associated risks [9]. Considering the increased concerns and risks that are inherent in post-pandemic travel, global travel restrictions are necessary to both prevent overcrowding at popular destinations and to assuage travelers’ worries [8].
However, the pandemic has resulted in a collective heightened awareness surrounding human health and mitigating the risks of COVID-19. As vaccination rollouts continue, the pandemic will eventually be controlled. It has been estimated that the total number of global tourists will reach 9.545 billion in 2021, and global tourism may recover to approximately 70% of the pre-pandemic level (https://en.wtcf.org.cn, 10 October 2021). UNWTO (2021) also reported that once the tourism industry recovers after the pandemic, the demand for health-focused and well-being-centered experiences is expected to be strong.

1.3. Heath Tourism Emerging in Chinese Mountainous Areas

The COVID-19 pandemic has raised consumer concerns about health [10]. The number of tourists that are interested in enhancing their mental, physical, or spiritual well-being, or even in obtaining specific healing treatments, is increasing, causing the health and wellness tourism sector to thrive [11,12]. Popular destinations for such tourists often include attractions such as mountains, lakes, rivers, beaches, and forests, all of which are natural resources that promote the improvement of wellness and are, therefore, ideal for the development and sustainability of health and wellness tourism [13]. Though many people may not have time for long trips, relaxation and a change of scenery are often all that are needed [14]. For example, Dunets et al. (2020) reported that the resort town of Belokurikha, Russia, which is located in the foothills of the Altai mountains, has excellent opportunities for development as a health and wellness destination, as indicated by tourists’ overall satisfaction and desire to visit [14]. Kling et al. (2020) found that spending time in mountainous areas was linked to better health and well-being [15]. Health and wellness tourism with a focus on resort destinations located in mountainous regions, particularly those that have not been overtaken by mass tourism, are much more likely to satisfy tourists in that sector [6]. Therefore, tourism agencies and industry professionals should consider new and perhaps previously neglected locations and experiences near these natural resources in an effort to promote sustainable tourism, as well as to stimulate and support the regional economies.
With the advancement of society and the increase in living standards in many countries, mountain-based health and wellness tourism has risen in popularity among those living in both urban and rural environments. Among the more than 200 national-level scenic spots in China, more than 90% are located in mountainous areas. Zeng et al. (2021) suggested that future studies concerning health and wellness tourism should focus on mountain-based opportunities because specific locations and traditional customs that are characterized by a particular microclimate may contribute to longevity and health according to Chinese culture [16]. Similar to rural tourism, mountain-based tourism has been impacted by low efficiency, overdevelopment, and homogeneous environments, which has, in turn, affected the competitiveness of mountain-based health and wellness tourism [17]. The vicious competition and homogeneous development of mountain-based health and wellness tourism should be avoided in the same manner as it is in other tourism segments, such as rural tourism, leisure tourism, and cultural tourism. For example, the two neighboring provinces of Sichuan and Yunnan, where mountain-based resources are abundant, compete for the coveted title, “Shangri-La”, as they have both developed their appeal based on their local natural and cultural characteristics that attract numerous tourists every year. Therefore, in order to develop mountain-based health and wellness tourism, we must first understand the factual status quo and the basic features of the mountain-based health and wellness tourism market in order to meet consumer demands.

1.4. Research Questions

At present, tourism market competitiveness is determined by the relationship between cost, product, and brand to that of tourism, tourists’ satisfaction, and behavioral intentions. However, the resource utilization efficiency of mountain-based health and wellness tourism is insufficient, internal management and external marketing have failed to embrace market changes. Although more people are traveling with a health and wellness focus, the sector still knows little about tourists’ satisfaction, behavioral intentions, and destination competitiveness. This needs to be improved to meet market demands.
The research questions that were used for this study were as follows:
Q1
What is the relationship between tourists’ satisfaction and destination competitiveness in mountain-based health and wellness tourism?
Q2
What is the relationship between behavioral intentions and destination competitiveness in mountain-based health and wellness tourism?
Q3
What are the relationships between tourists’ satisfaction, behavioral intentions, and mountain-based health and wellness tourism competitiveness?
Q4
Based on the relationship between tourists’ satisfaction, behavioral intentions, and mountain-based health and wellness tourism competitiveness, how can sustainable mountain-based health and wellness tourism be developed to meet the needs we determined based on this study?

1.5. Research Purpose and Structure

This article studied the relationship between tourism competitiveness, tourists’ satisfaction, and behavioral intentions by building a structural equation model to enrich the research of tourist destination competitiveness and to provide a theoretical and practical basis for improving mountain-based health and wellness tourism competitiveness so that tourism professionals and agencies, as well as policymakers, can formulate better plans. While this research was completed within the context of destination competitiveness, the main purpose of this study was to determine the major factors that influence destination competitiveness from the perspective of tourists [18]. Because there is no universal set of factors to determine a destination’s competitiveness that is applicable to all destinations at all times [19], it was vital to explore these factors, especially with new and emerging tourist destinations and market demands [18]. This may be the first time that the interrelationship between tourists’ satisfaction, behavioral intentions, and competitiveness within the context of mountain-based health and wellness tourism has been studied. The practical implications will be to guide tourism professionals and local governments when they consider competitive strategies for mountain-based health and wellness tourism to increase destination competitiveness and improve long-term sustainability.
Following this introduction, Section 2 of this article provides a literature review and the theoretical framework; Section 3 contains the variable definitions; Section 4 details the research cases and methods; Section 5 describes the model construction and the data analysis; Section 6 covers the results and discussion; Section 7 examines the validity and reliability of the material and the study; and Section 8 offers our conclusions, including theoretical and practical applications, research limitations, and suggested directions for future research.

2. Literature Review and Theoretical Framework

2.1. Conceptions and Definitions

2.1.1. Destination Competitiveness

The term “competitiveness” is derived from the Latin word “competere”, which refers to the rivalry that is found between entities in markets and industries [20]. Competitiveness is also used extensively in management discourse concerning national and international economic performance comparisons [21]. Destination competitiveness is a multidimensional concept that is widely studied in the academic literature, but multiple factors make it difficult to measure [22]. Ritchie et al. (1993) defined tourist destination competitiveness as the ability to increase tourism expenditure and continuously attract visitors while providing them with memorable experiences and satisfaction, as well as improving the lives and local economy of the destination’s residents and preserving the natural resources for the benefit of future generations [17].. Traditionally, studies regarded destination competitiveness as a static concept, but recent studies have adopted a dynamic view of destination competitiveness that examines tourist expectations alongside the variables that are determined by each tourism niche [23].
Cvelbar et al. (2016) defined destination competitiveness as the total tourism contribution to GDP per tourism employee [24]. Destination competitiveness has quantifiable, easily measurable variables, such as the growth of tourism expenditure and price differentials, as well as qualitative features that can be more challenging to measure, such as enhancing the well-being of destination residents [25]. Cimbaljevic et al. (2019) stated that the destination that would stand apart from the competition was the one that provides the most tremendous success and well-being to its residents based on the principle of sustainability [26]. Hanafiah et al. (2019) summarized that assessing a destination’s competitiveness should not be exclusively based on its competitive advantages, but should also include the actual performance (e.g., tourist arrivals, receipts, tourism contribution to the local economy; tourism contribution to the GDP; and quality of life) of the tourist destination [21]. Tourist destination competitiveness is likely to remain a popular research topic in an effort to enable travel destinations to maintain and expand their market share [27]. Competitiveness in the marketplace has become essential as tourism stimulates economic growth and job creation, and travel destinations must learn how to think more like a business and develop new products, markets, and customers [28]. Thus, it is imperative to gather more information concerning tourists’ opinions on what makes a destination competitive [27].

2.1.2. Mountain-Based Health Tourist Destination

Initial research on tourist destinations focused on the geographical characteristics that define a tourist destination, and destinations were treated as spatial units that were the objective of tourists’ visits [29]. Jovicic (2019) reviewed the evolution of key tourist destination concepts. With the development of information and communication technologies (ICTs), tourist destinations have become not only geographic dimensions but also a collaboration between public and private consumers with both participatory governance and creative and knowledgeable people that value co-creation and personalized services, all of which must be interwoven into digital and real realms [29]. Lusticky et al. (2021) indicated that tourist destinations are a highly competitive and complex market [30], especially those that are found in nature-based tourism [31].
Globally, mountainous regions account for approximately 27% of the total land area, 54% of which are in developing countries [32]. With their spectacular scenery, majestic beauty, and unique amenities, mountains are some of the most popular destinations for tourists [33]. Their natural environment, social and cultural backgrounds [34], the abundance of negative oxygen ions and their invigorating effects [35], complex terrain, and diverse landscapes meet the needs of tourists who want to experience nature [36]. Mountain-based tourism combines sightseeing, leisure activities, fitness, entertainment, education, and sports into one product or experience in which tourists can immerse themselves [37]. In recent research, tourism that is concerned with health and wellness was shown to be a broad concept that encompasses curing ills and maintaining health [38]. Pan et al. (2019) indicated that studies on mountain-based tourism have gradually focused on its positive effects on health and other specialized, differentiated products with the emergence of “alpine wellness”, and that health and wellness tourism in mountainous areas has become a popular topic in tourism research [33]; thus, mountain-based health and wellness tourism has become a niche of mountain-based tourism.
In this article, “mountain-based health and wellness tourist destination” refers to a mountain-based destination with health and wellness activities, a suitable climate in which to complete these activities, a natural environment with unique landscape appeal and attractions, and customized wellness products and opportunities that attract health and wellness tourists. Panzhihua is a mountainous, resource-based city with abundant natural and cultural attractions that may be advantageous for the development of health and wellness tourism in China. An article titled “Panzhihua, China: Building a New Benchmark in the Health Care Industry”, which was edited by Xinhua News Agency in 2021, was published in Japan, South Korea, and the United States, and it attracted broad attention from these country’s mainstream media, information portals, and key information websites. According to the official website of the Panzhihua government (http://www.panzhihua.gov.cn, 11 October 2021), natural conditions such as altitude, temperature, humidity, cleanliness, and harmony are perfectly integrated here: (1) Panzhihua is located in the 26° north latitude zone with Hawaii, Miami, Okinawa, and other world-famous locations; (2) the annual amount of sunshine is approximately 2700 h, and the annual average temperature is 20.3 °C; and (3) the unique climate and topographical conditions allow Panzhihua to have favorable sunlight most of the year.
Above all, with its multifarious natural resources and ethnic culture, the city of Panzhihua may be a competitive destination to assist in the development of mountain-based health and wellness tourism in China. This research used the city of Panzhihua as a case study to analyze the aforementioned research questions.

2.2. Theoretical Framework

2.2.1. Satisfaction–Behavioral Intentions

Satisfaction has been defined as the relationship between expectations and experiences [39]. The measurement of customers’ behavioral intentions, such as the likelihood of converting a one-time purchaser into a long-time customer or of a customer recommending their experience to others, and customer satisfaction has a long history in the fields of marketing, management, and tourism [40]. Regarding tourist destination research, satisfaction with travel destinations is directly linked to tourists’ behavioral intentions [16]. Chang et al. (2016) examined the satisfaction (e.g., overall satisfaction, satisfaction compared to travelers’ own time and efforts, and satisfaction compared to other ports of call) of cruise travelers using a sample population’s pre-visit expectations and post-visit experiences, demonstrating the impact of overall satisfaction on the likelihood of revisiting and recommending the visit to others [41]. Kim et al. (2020) reinforced tourists’ likelihood of revisiting and recommending a destination by enhancing the satisfaction level of wellness tourist attractions in Korea’s tourism industry [42]. Han et al. (2018) showed that the link between quality and satisfaction strongly influenced behavioral intentions by conducting a structural model comparison, which provided insight into medical travelers’ post-purchase behaviors [43]. Using structural equation modeling, Yen et al. (2020) demonstrated that satisfaction positively affects behavioral intentions [44]. Bayih et al. (2020) concluded that satisfaction directly influences behavioral intentions (intention to revisit and to recommend) [45]. In the context of health and wellness tourism, Kim (2020) concluded that satisfaction has a significant effect on behavioral intentions after studying investment tourists in Suncheon Bay National Garden Wetland and Jeongnamjin Cypress Forest Woodland [46]. Cotter et al. (2021) determined that visitors’ intentions to provide a positive recommendation correlated with visit satisfaction via pre- and post-visit surveys at an art museum [47]. Chen et al. (2021) confirmed that coffee tourists’ behavioral intentions are strongly influenced by satisfaction [48].
To verify the relationship between satisfaction and behavioral intentions in a competitive mountain-based health and wellness tourism environment, the following hypothesis was offered:
Hypothesis 1 (H1). 
The satisfaction of health and wellness tourists in pursuit of mountain-based health and wellness tourism directly affects their behavioral intentions.

2.2.2. Satisfaction–Destination Competitiveness

Tourism management is a competitive environment [40] in which tourists’ satisfaction should be the priority. Nazmfar et al. (2019) showed that competition causes an increase in economic performance and efficiency in all dimensions. The two vital drivers of tourism competitiveness were shown to be an increase in tourists to destinations and the increase in industry-wide business [49]. Destination competitiveness refers to businesses and entities who make up the destination economy to compete for the source market (tourists) and participate in market competition [50]. In this article, “destination competitiveness” refers to the benefits that are reaped by the destination, including the number of tourists and its growth rate, the growth rate of tourism income, the proportion of overnight tourists, and the percentage of total tourism revenue in the local GDP [21,49]. From the perspective of tourists, the tourist number and economic benefits may need to be evaluated per destination. Generally speaking, both overcrowded destinations and tourism professionals and agencies that are only interested in economic benefit negatively contribute to destination competitiveness. For example, suppose a destination is too crowded. In that case, it reduces a tourist’s likelihood of participating in and enjoying the local attractions and, post pandemic, may put their health at risk [8]. In addition, unreasonable prices that are set for accommodation, products, tickets, etc., can have a negative impact on destination competitiveness [51].
Zhou et al. (2010) examined the attention that was focused on tourists’ satisfaction with the rapid changes and fierce competition in the industry [52]. Chen et al. (2011) suggested that there is no correlation between tourists’ satisfaction and destination competitiveness based on their investigation of tourists’ attitudes and perceptions about destinations in foreign countries, such as Kinmen [53]. Ross (2013) analyzed the influence of competitiveness on visitor satisfaction using visitor survey results from a metropolitan zoo [40]. Using Shanghai as a case study, Zheng et al. (2017) concluded that improving customer satisfaction is conducive to meeting customers’ demands and enhancing the competitiveness in marine culture tourism [54]. He et al. (2017) proposed that improving tourists’ satisfaction is crucial for ensuring destination competitiveness in the market [55]. Teixeira et al. (2019) showed that satisfaction contributes directly and indirectly to the regional tourist competitiveness in Madeira [56]. Perles-Ribes et al. (2021) found that recent tourism researchers incorporated tourists’ satisfaction as a determinant of competitiveness in destinations [57]. Focusing on rural tourism, Ye et al. (2021) proposed that satisfaction is the essence of the tourism industry and is regarded as a core aspect of competitiveness for destinations under the experiential marketing paradigm [58]. Many researchers concluded that tourists’ satisfaction plays a vital role in destination competitiveness; however, some researchers have found evidence to the contrary, and research on the influence mechanism is limited. For this reason, this article proposed the following hypothesis:
Hypothesis 2 (H2). 
Tourists’ satisfaction directly affects the destination competitiveness of mountain-based health and wellness tourism.

2.2.3. Behavioral Intention–Destination Competitiveness

Chen et al. (2016) developed an integrated structural path model of the determinants of cruise competitiveness based on the behavioral intentions of cruise tourists in Asia [59]. Teixeira et al. (2019) concluded that improvements in satisfaction and probability of return, regardless of positive word-of-mouth, contribute to the competitiveness of a destination [56]. Heesup et al. (2020) pointed out that increasing destination competitiveness through intentional behavior (i.e., the intention to revisit a destination and to recommend it to others) has become essential for the success of Thailand’s wellness spa tourism [60]. Pai et al. (2021) found that smart tourism technology has been widely used in various aspects of tourism, evolving the traditional travel experience while enhancing destination competitiveness based on visitors’ intentions to revisit [61]. Researchers found that tourists’ behavioral intentions also have a direct impact on destination competitiveness.
Therefore, the following hypothesis was put forward:
Hypothesis 3 (H3). 
Tourists’ behavioral intentions to travel directly affect the destination competitiveness of mountain-based health and wellness tourism.

3. Latent and Observed Variables

This article contains three latent variables and ten observed variables. Tourists’ satisfaction, behavioral intentions, and destination competitiveness were used as latent variables. The observed variables of tourists’ satisfaction were travel expectations (TS1) and post-trip travel perception (TS2). In addition, following the guidelines of Garver and Mentzer (1999), the question “Overall, how satisfied were you with your visit to this mountain-based health and wellness tourist destination?” was removed from the measurement model because the factor loading was lower than the benchmark of 0.5 [62,63] Therefore, the latent variable of satisfaction had a two-item scale in this study. Eisinga et al. (2013) pointed out that poor-quality items should be removed from a limited item pool, which can result in scales with a small number of items, occasionally only two, though they recommend using more than two items [64].
The observed variables of behavioral intentions were the willingness to revisit a location and the willingness to recommend it to others (RI1 and RI2, respectively) [41,47,65,66]. The observed variables of destination competitiveness were tourist reception (RC1), tourist arrival growth rate (RC2), tourism revenue (RC3), tourism revenue growth rate (RC4), the proportion of overnight tourist reception out of the total number of tourists (RC5), and the proportion of total tourism revenue in local GDP (RC6) (Table 1).

4. Research Area and Methods
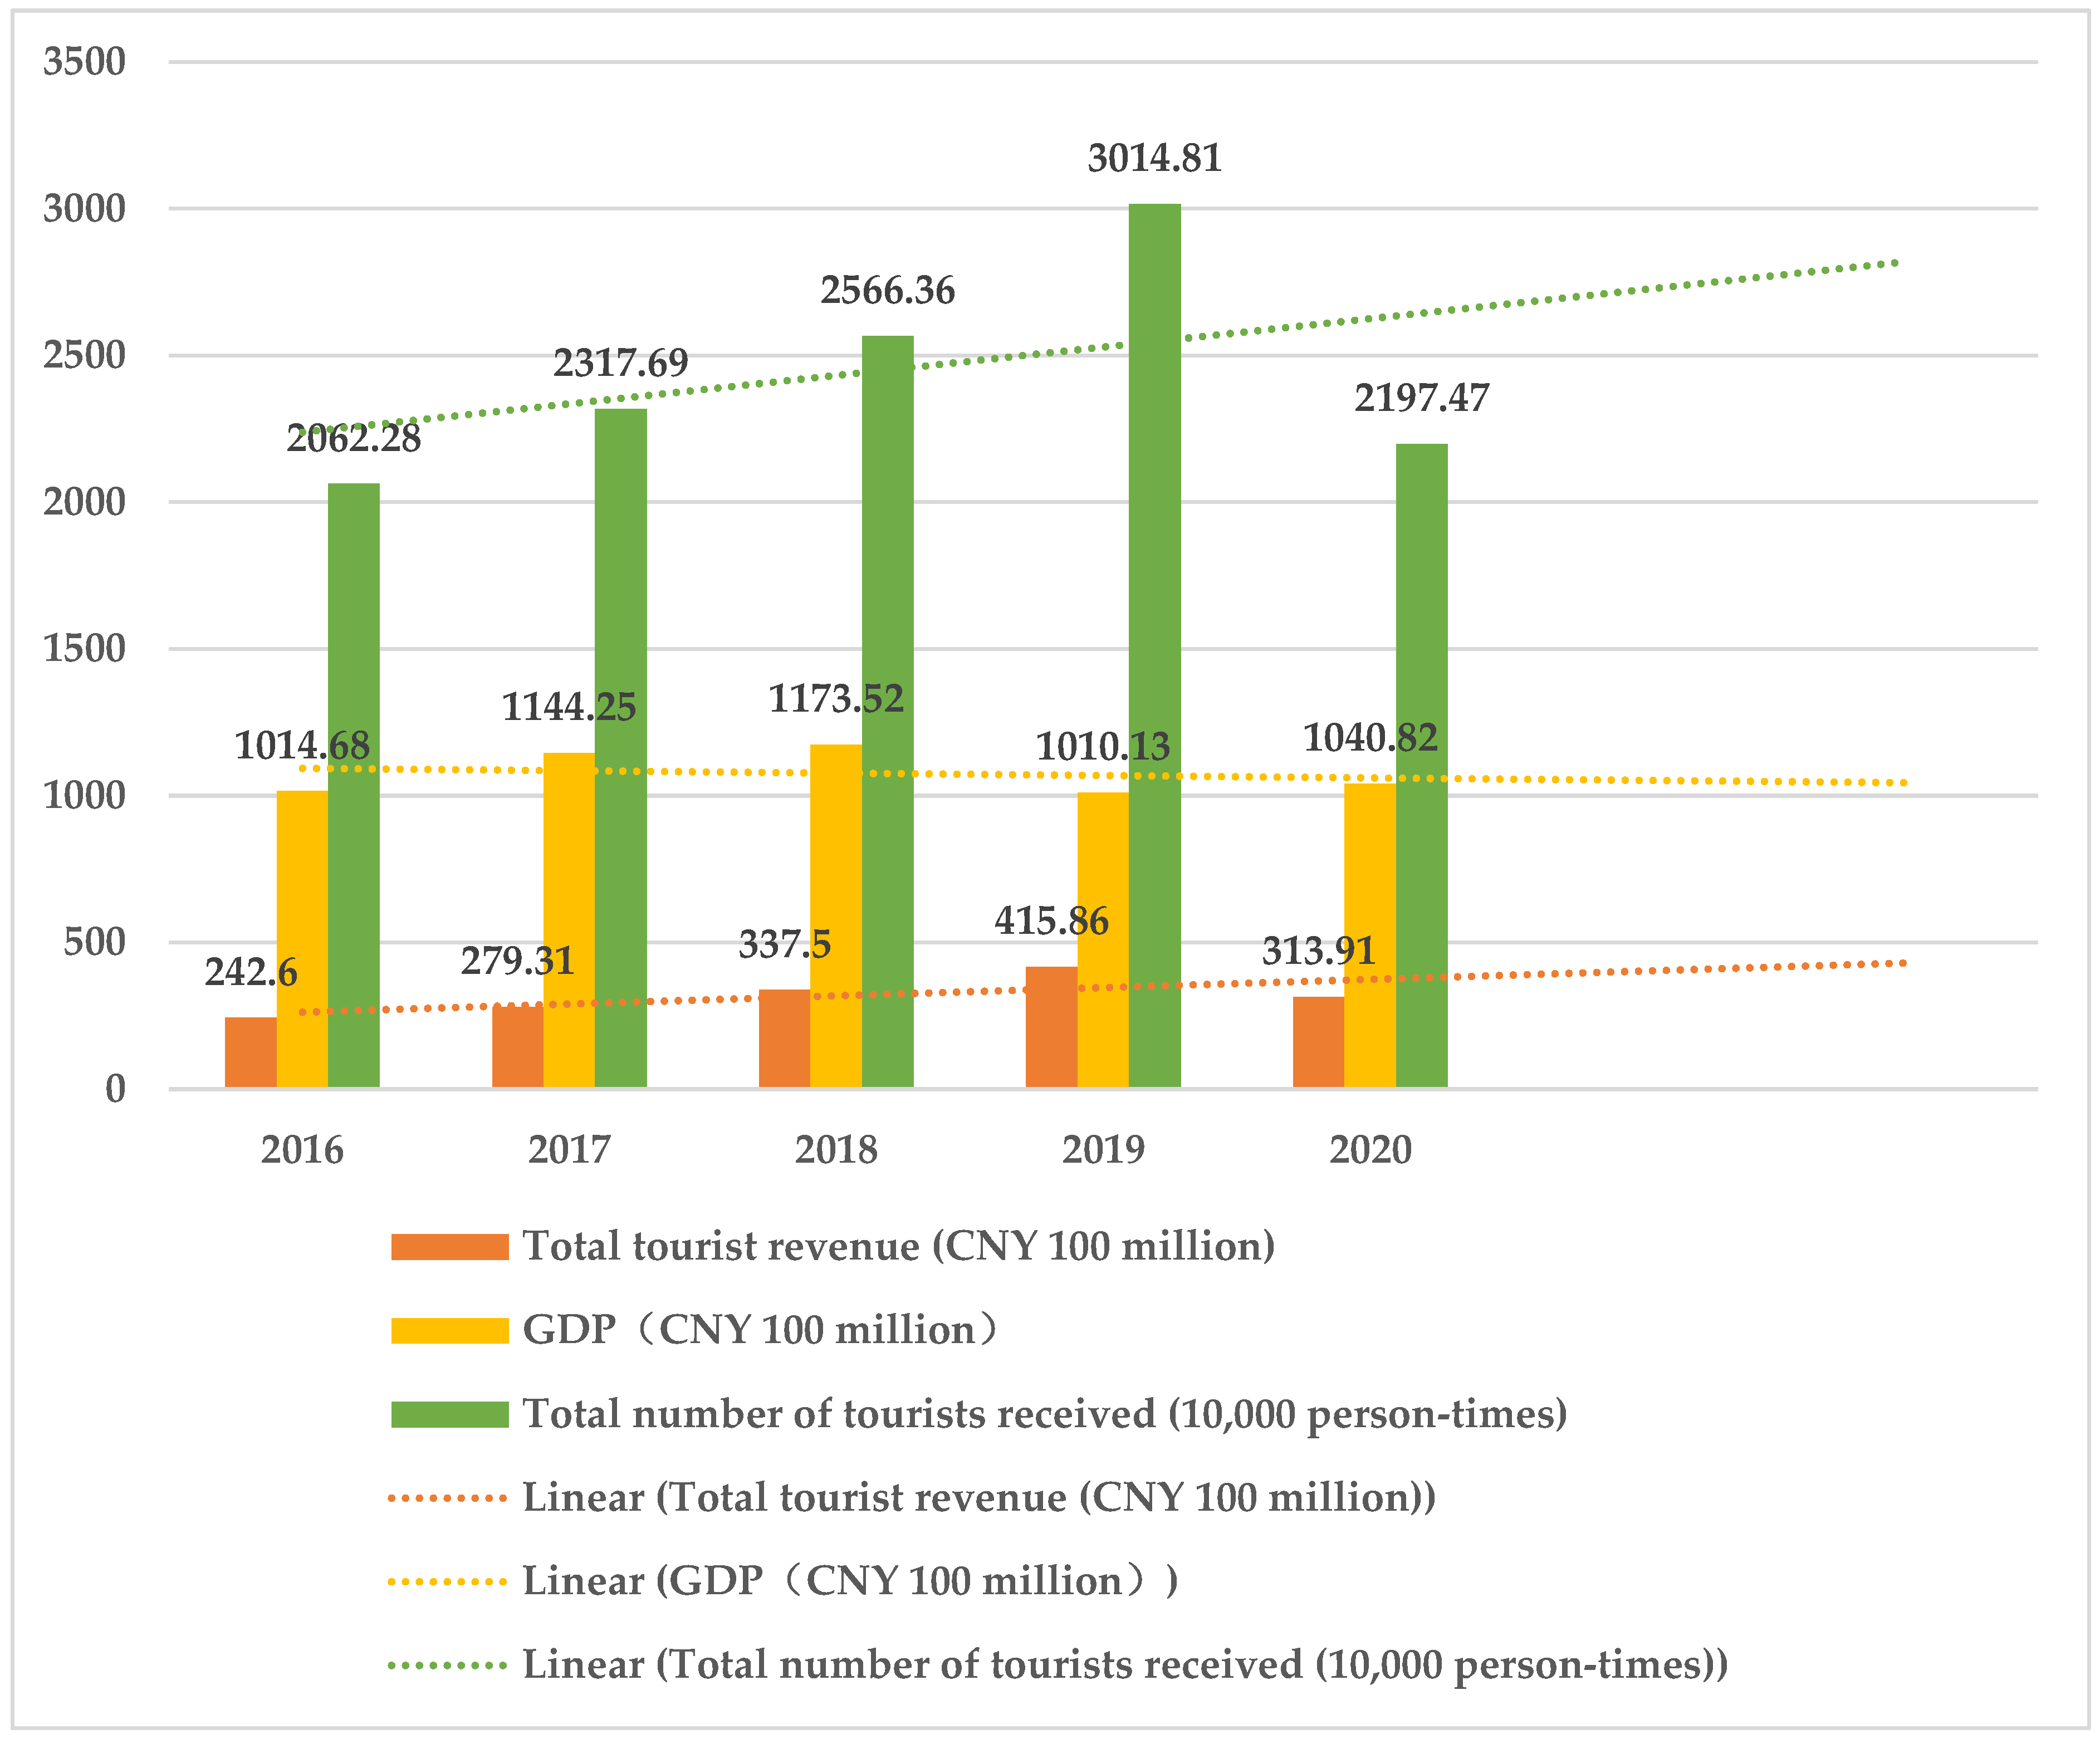
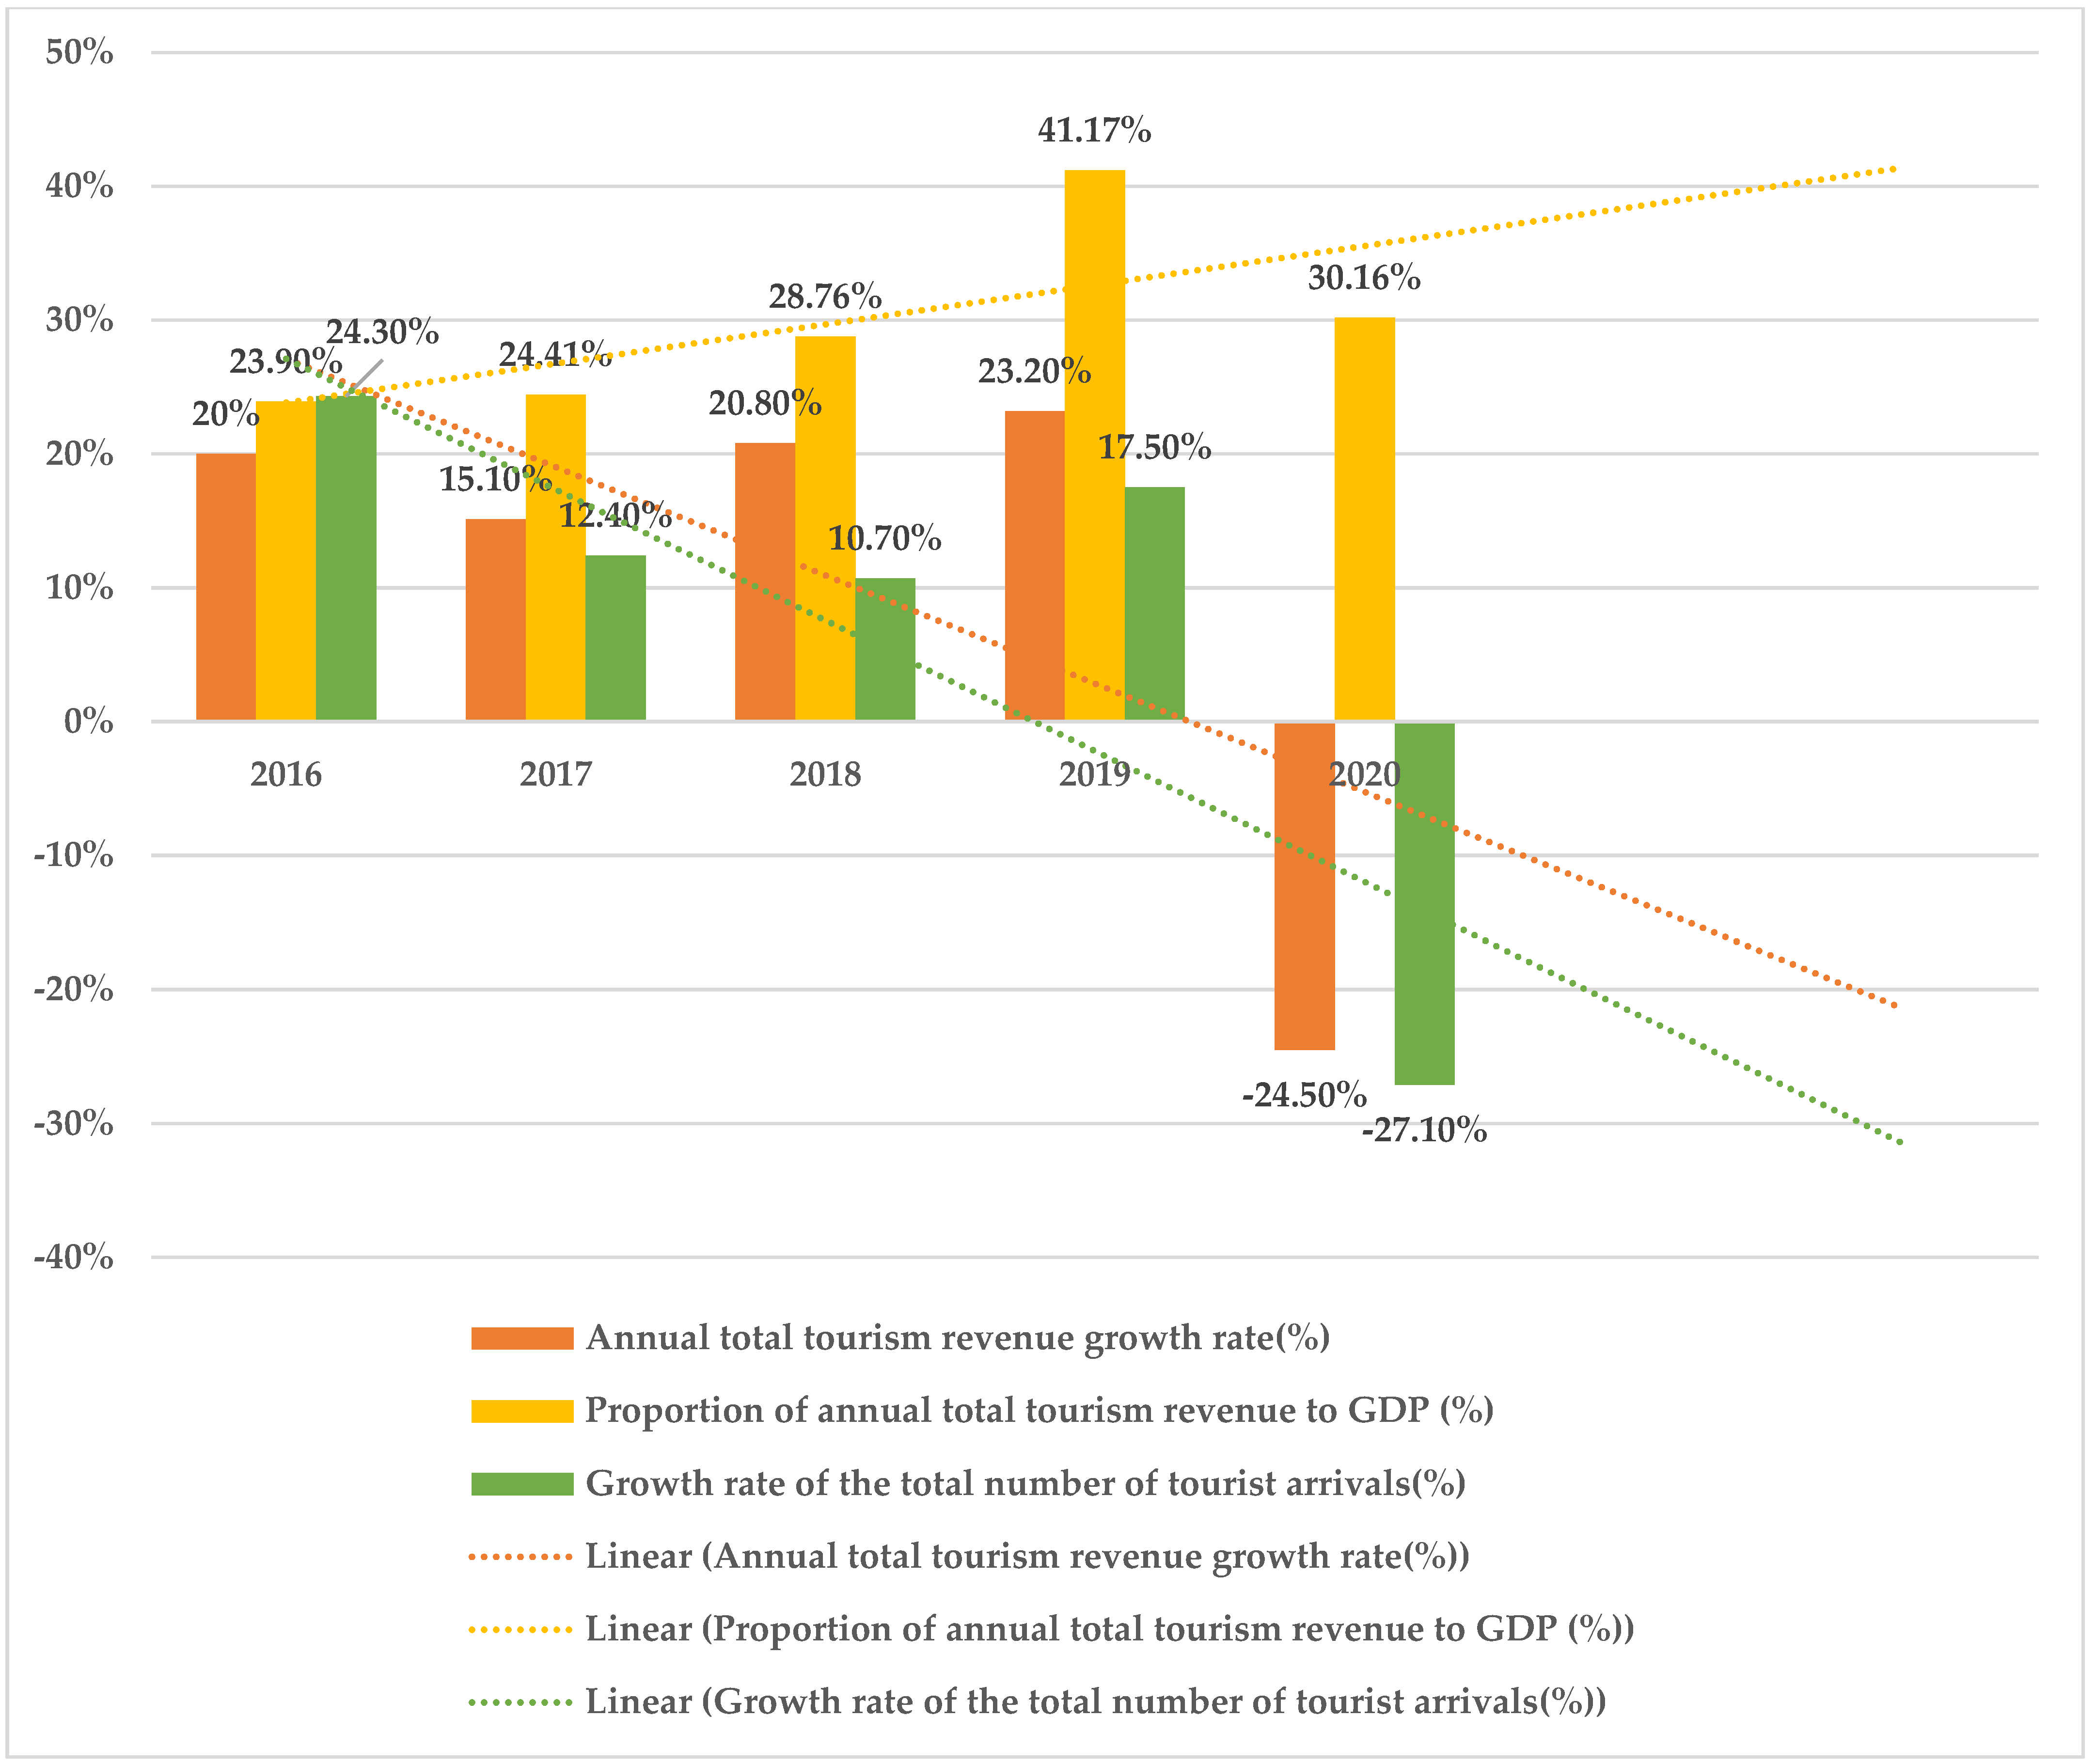
4.1. Research Area

Panzhihua, which is a well-known city in China, was selected as a research case study. According to the Sichuan News Network (http://scnews.newssc.org, 17 December 2020), Panzhihua has developed its appeal in the health and wellness industry in recent years and is actively advertising itself as an international tourist destination for health and wellness tourists, as well as those interested in beautiful, sunny weather. As early as 2017, Panzhihua took the lead in issuing local standards for the healthcare industry in China and established the first Chinese healthcare college. At present, Panzhihua is among the first of China’s national pilot cities for the integration of medical and elderly care, the national smart healthcare demonstration base, the top 50 health tourism cities, and the top 50 livable cities in China. According to the official data analysis of Panzhihua, as its healthcare industry has developed, so have the number of tourists. In 2019, the total annual tourism revenue was CNY 41.586 billion, an increase of 23.2% compared to the previous year. The total number of tourists was 30.148 million, an increase of 17.5% compared to last year (Figure 1 and Figure 2).
However, during the global COVID-19 pandemic of 2020, the total annual tourism revenue was CNY 31.391 billion, a notable decrease of 24.5% compared to the previous year, while the total number of tourists was 21.9747 million, a significant drop of 27.1% compared to the previous year, which is representative of the massive impact the pandemic had on the local tourism industry (Figure 1 and Figure 2). Compared to other cities in China, the cure rate of COVID-19 in Panzhihua reached 76% within 16 days. After the pandemic, many middle-aged and older adults in Beijing, Chengdu, Xi’an, and other locales continued to buy real estate in Panzhihua. Like migratory birds, they stay in Panzhihua during the winter. The 2021 Panzhihua Cultural Tourism Development Conference stated that accelerated construction had begun for 5 international mountain-based health and wellness tourism resorts, 10 health and wellness villages, 100 health and wellness residences, and 50 medical and healthcare centers. The Panzhihua authorities plan to reach the goal of CNY 50 billion in total tourism revenue and 50 million visitors by 2025. As a result, the competitiveness of mountain-based health and wellness tourism in Panzhihua has been increasing.

4.2. Research Methods

Questionnaires were used for the data collection in this study. The formal questionnaire was evaluated by experts and tested for validity and reliability. In this article, five mountain-based health and wellness tourist destinations were selected in Panzhihua to conduct a questionnaire survey with their tourists, namely, Hongge, Ashuda, Wuben, Zhuanxu Cave, and the National Mountain Fitness Park. A purposive sampling technique was applied to the selection of respondents for this study. The respondents had to be at least 18 years old and planned on visiting the five selected mountain-based health and wellness tourist destinations in Panzhihua city. The respondents were asked to respond to the statements by stating their level of agreement via a five-point Likert scale [69], ranging from 1 = strongly unimportant to 5 = strongly important or 1 = much worse to 5 = much better. A total of 550 questionnaires were distributed by 10 research investigators from 20 March to 20 May 2021. A total of 510 questionnaires were returned, with 500 questionnaires determined to be valid. SPSS 26.0 was used to analyze the reliability and validity of the questionnaire. Then, a structural equation model (SEM) was used to test and construct the model of satisfaction–tourist behavioral intentions–destination competitiveness.

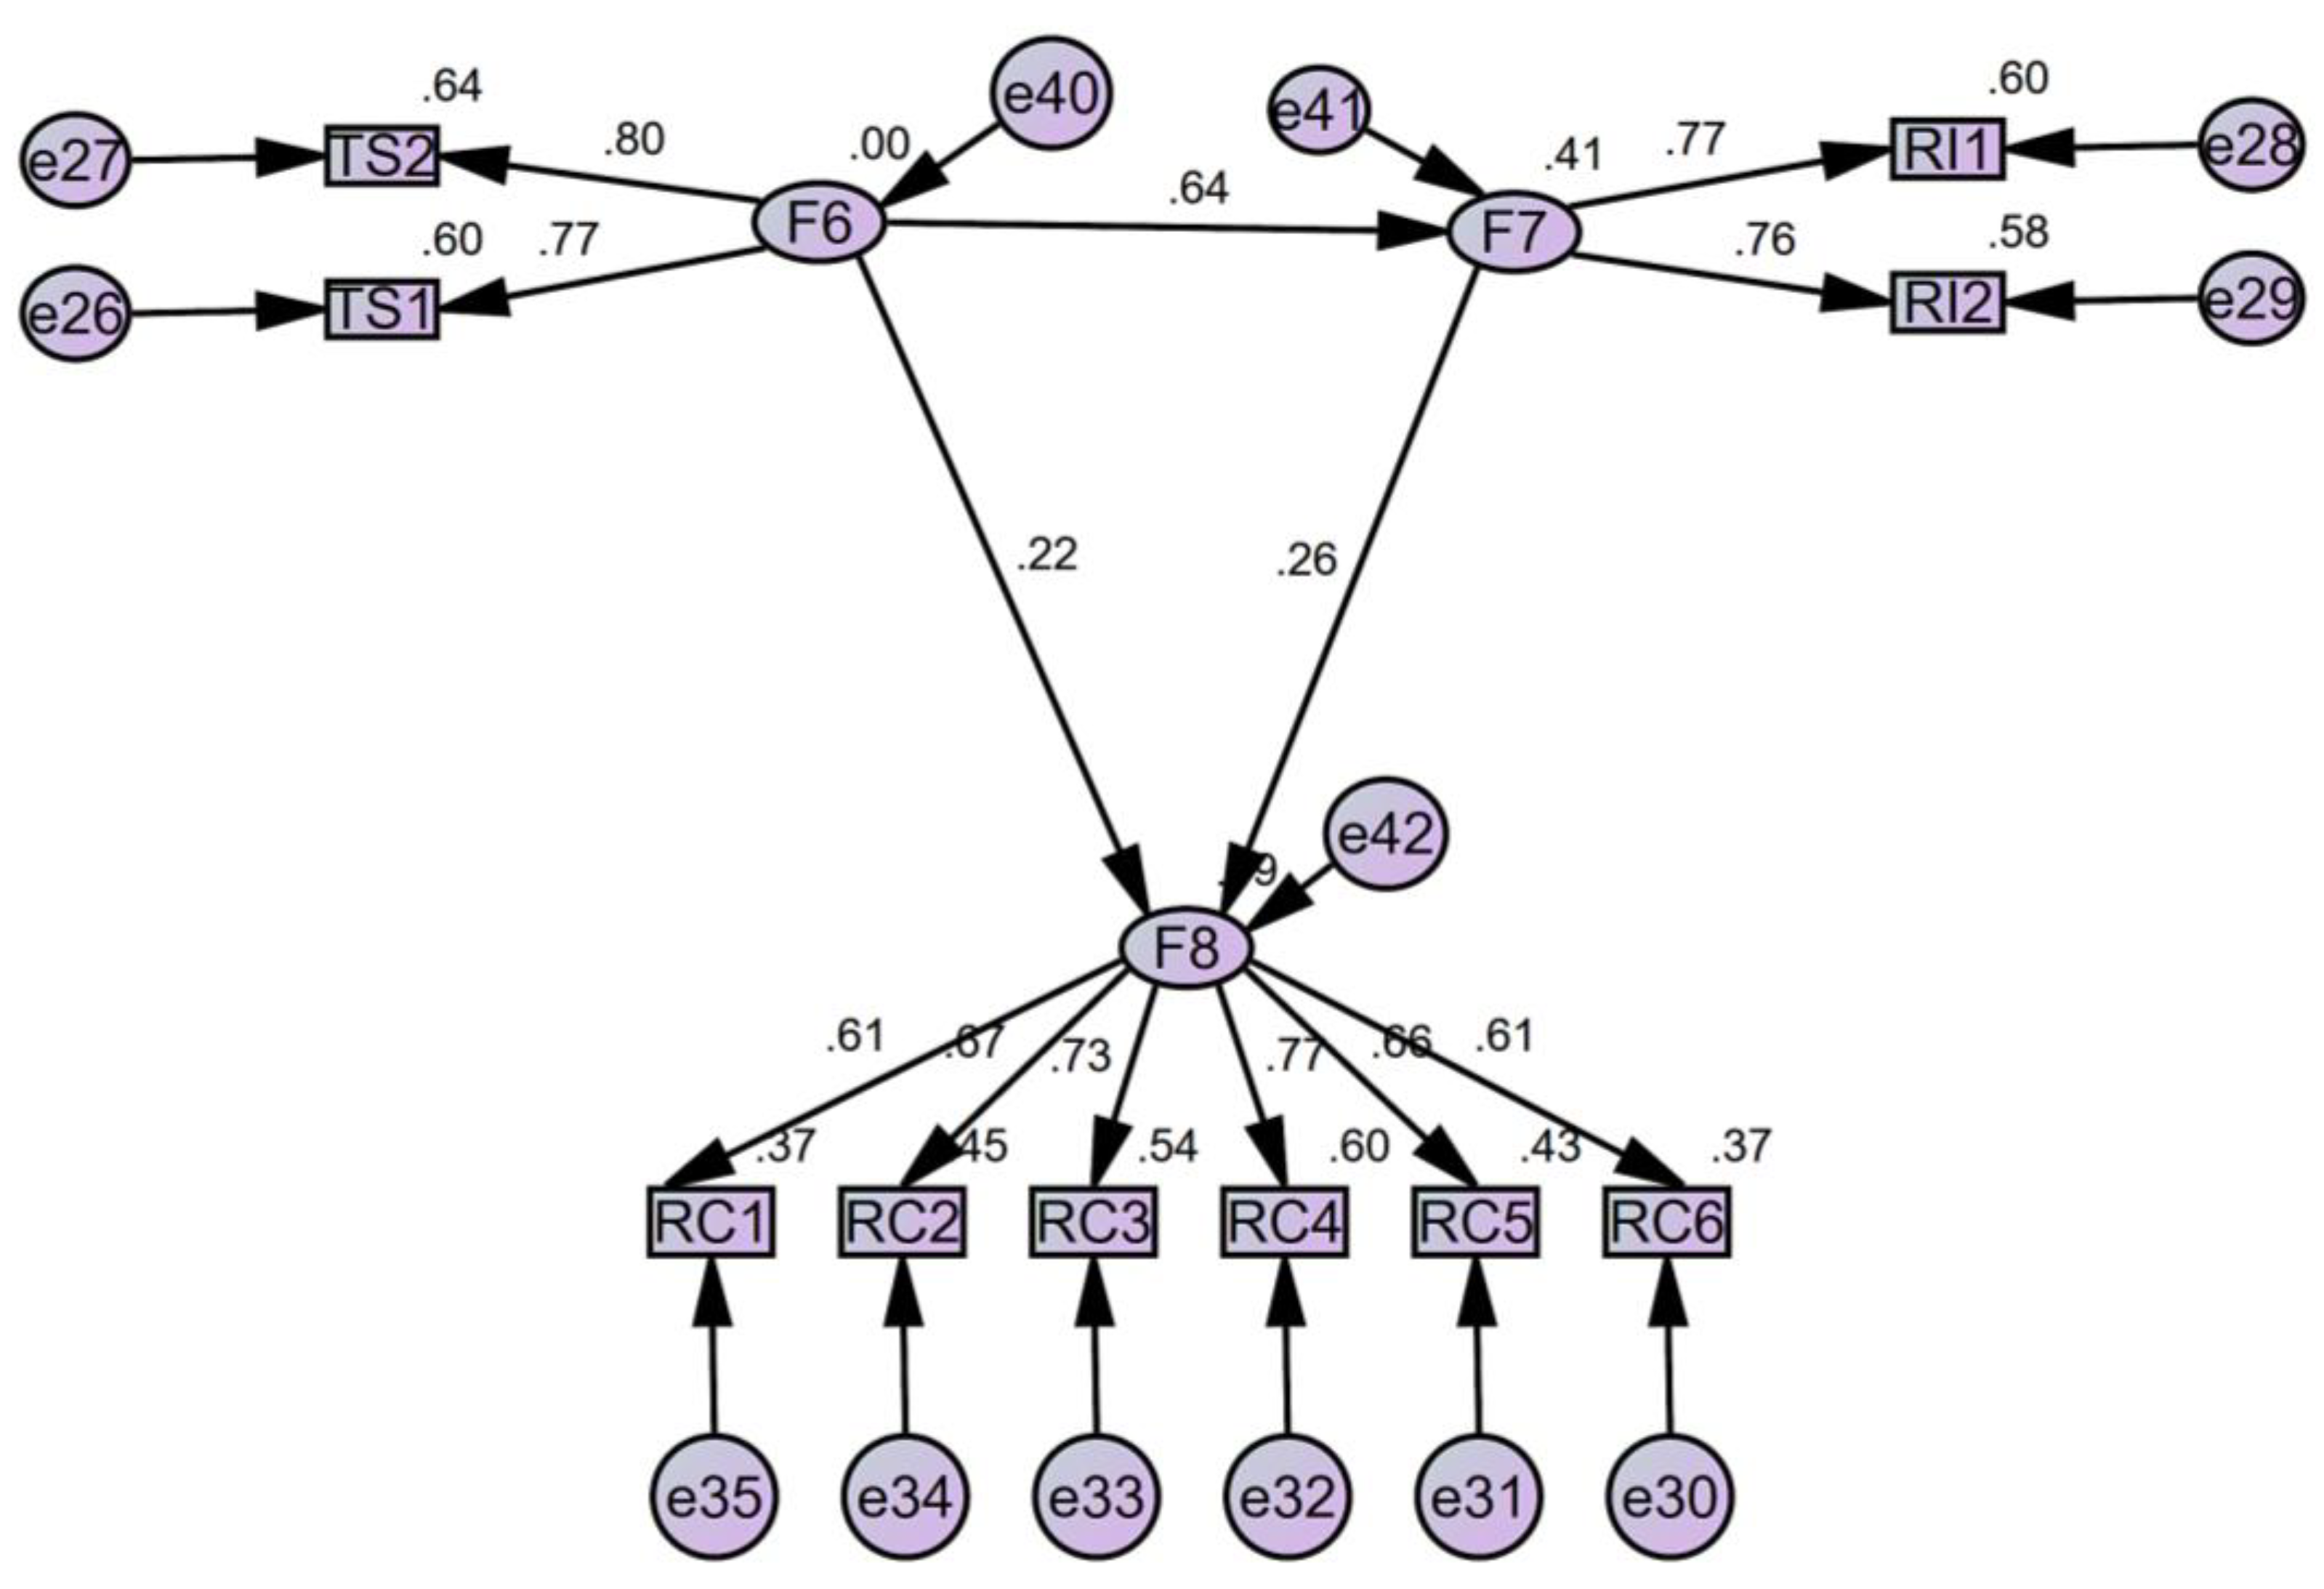
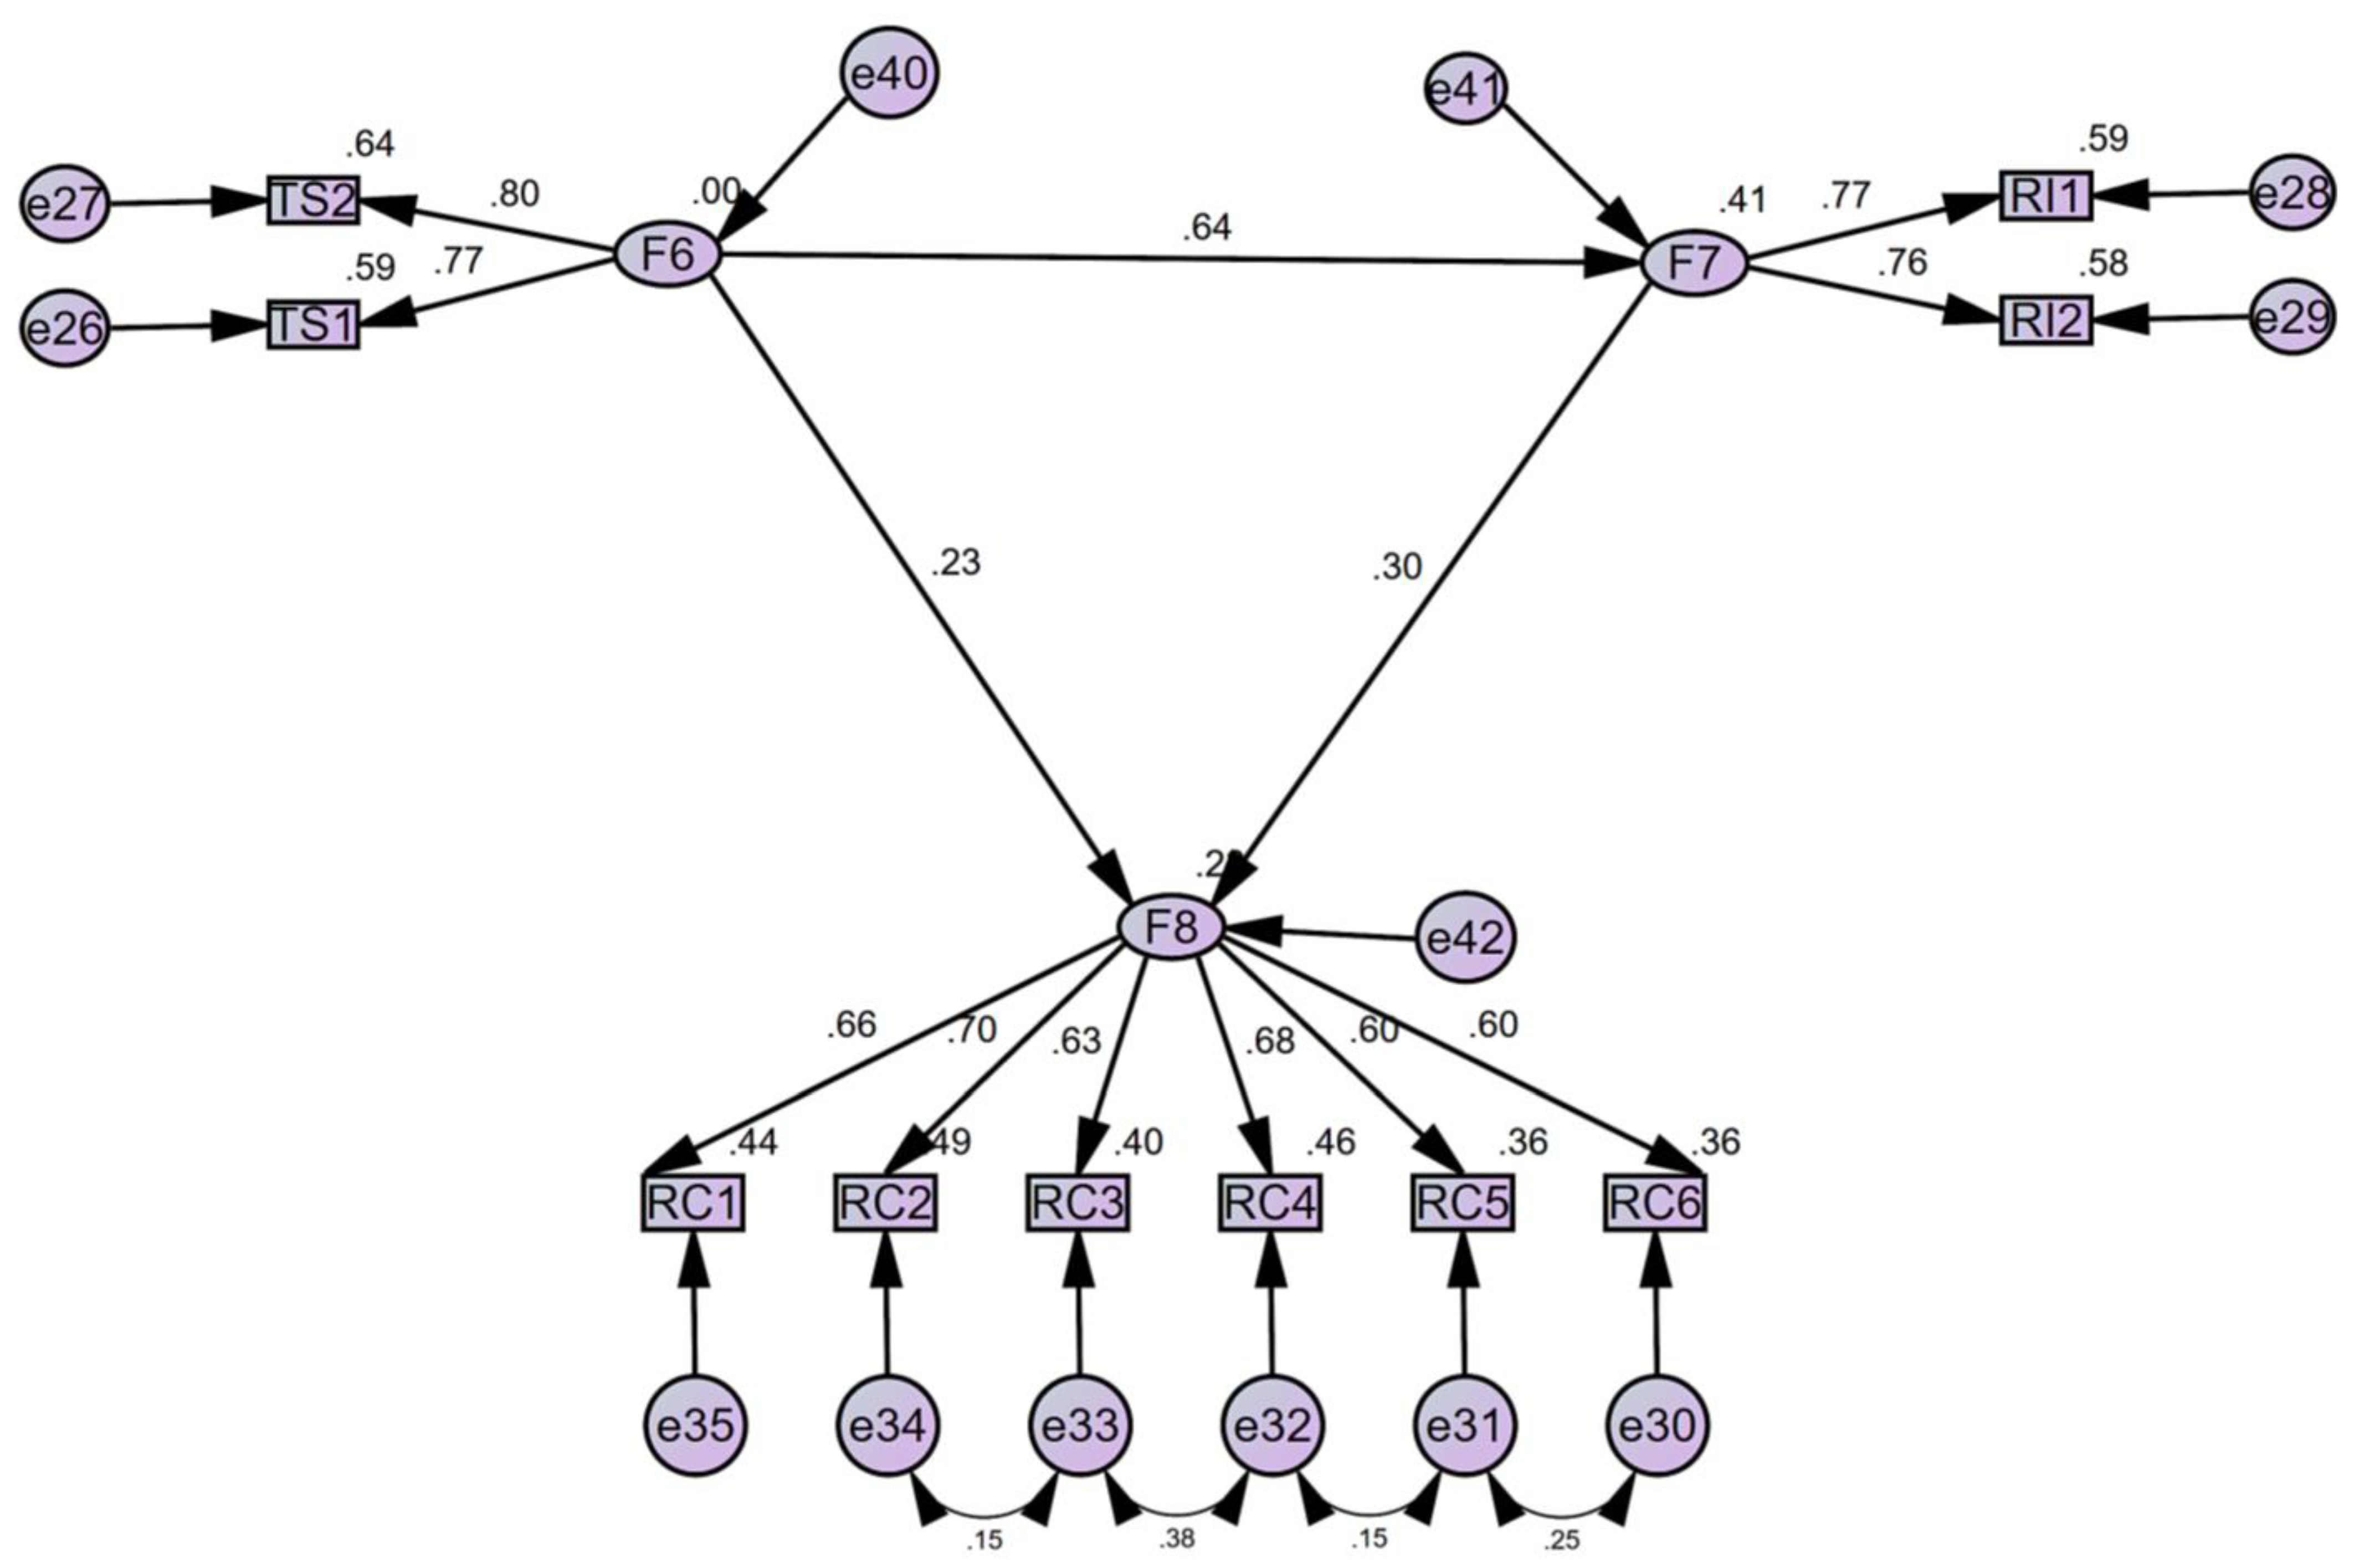
5. Model Construction and Data Analysis

5.1. Preliminary Model Construction and Goodness-of-Fit Statistics

The model was preliminarily built according to the questionnaire data (Table S1 in Supplementary Material) and analyzed via the Amos 24.0 program, as shown in Figure 3. The goodness of fit of the optimized model that was suggested by the software is shown in Table 2.
Given the sample size of 500, all indicators were acceptable, as was the goodness-of-fit of the model. In the model index results, the chi-squared degree of freedom (CMIN/df) value was 1.561, which is less than the upper limit requirement of 3. The value of the fit index (GFI) was 0.983, which is higher than the required 0.90. The root-mean-square residual (RMR) value was 0.020, which is less than the upper limit of the index value requirement of 0.05 (good). The root-mean-square error of approximation (RMSEA) value was 0.034, which is less than the index upper reference limit of 0.05 (good). The parsimonious benchmark goodness-of-fit index (PNFI) value was 0.607, with the former being more than 0.500 (the lower limit of the index reference value). The value of the normed fit index (NFI) was 0.975, the incremental fit index (TLI) value was 0.985, and the comparative fit index (CFI) value was 0.991, which were more than the ideal value index of 0.95 and, therefore, within an acceptable range.

5.2. Hypothesis Testing

In the results (Table 3), p = *** means that the hypothesis was verified. In Table 3, satisfaction had a direct impact on tourists’ behavioral intentions (H1), and the latter had a direct impact on destination competitiveness (H3). The assumptions were established, and the path values were 0.629 and 0.299, respectively. Therefore, tourists’ satisfaction had a direct and positive effect on tourists’ behavioral intentions. Meanwhile, tourists’ behavioral intentions also had a positive and direct effect on destination competitiveness.
The hypothesis that satisfaction had a direct impact on competitiveness (H2) was not supported (p = 0.006).

6. Results

6.1. Satisfaction

The path values of pre-trip expectations (TS1) and post-trip perceptions (TS2) to satisfaction (F6) were 0.771 and 0.802, respectively. Therefore, pre-trip expectations (TS1) and post-trip perceptions (TS2) had an important impact on satisfaction, and tourism resource investment in post-trip perceptions (TS2; 0.802) should be greater than that of pre-trip expectations (TS1; 0.771). The higher the tourists’ perceptions of their on-site experience, the higher their overall satisfaction. Therefore, tourism professionals and agencies should not exaggerate or inflate the appeal of travel destinations, because if their customers are not satisfied with their experience, it could have a negative impact on their behavioral intentions. The promoted mountain-based health and wellness destination and its attractions and appeal should match what the tourists will actually experience (Table 3 and Figure 4).

6.2. Behavioral Intentions

As shown in Table 3 and Figure 4, the path values of willingness to revisit (RI1) and willingness to recommend (RI2) to behavioral intentions (F7) were 0.770 and 0.761, respectively, which were relatively close. Willingness to revisit (RI1) and willingness to recommend (RI2) were of greater importance to behavioral intentions (F7). When tourism professionals decide where to invest their resources, they should first consider tourists’ willingness to revisit and the likelihood of converting them into repeat customers. For example, tourists may be more likely to return to mountain-based health and wellness tourist destinations that offer high-quality wellness services, discounts on accommodation fees or attractions, and diverse activities. If a visitor is delighted with their travel destination, they may be more likely to become a repeat customer than to recommend it to others.

6.3. Destination Competitiveness

Regarding destination competitiveness (F8), tourist reception (RC1), tourist arrival growth rate (RC2), tourism revenue (RC3), tourism revenue growth rate (RC4), overnight tourist reception as a percentage of total tourists (RC5), and the total tourism revenue as a proportion of local GDP (RC6), the path values were 0.665, 0.701, 0.629, 0.677, 0.602, and 0.604, respectively (Table 3 and Figure 4). Among them, the tourist population growth rate (RC2; 0.701) was relatively large. Therefore, more resources should be allocated to the tourist population growth rate (RC2) to increase destination competitiveness.
The path values followed the order of tourism revenue growth rate (RC4; 0.677) > tourist reception (RC1; 0.665) > tourism revenue (RC3; 0.629) > the proportion of tourism revenue to local GDP (RC6; 0.604). The importance of tourism revenue growth rate (RC4; 0.677) was second only to the growth rate of tourist arrivals (RC2; 0.701). When the growth rate of tourism income increases, the local economic income may increase, the income of residents and staff may improve, local economic development may also be improved, and, therefore, the mountain-based health and wellness tourist destination competitiveness may increase. However, given the importance of sustainability, especially post pandemic, the total number of tourists should be controlled by governments and destinations to avoid overcrowding and increased health risks.
In addition, overnight tourist reception accounted for the smallest proportion of tourists in our study (RC5; 0.602), meaning that most travelers were there on day trips. However, as an important indicator of destination competitiveness and appeal, the length of stay may play an increasingly important role as overnight travel packages grow in popularity. As more people embrace traveling post pandemic and are willing to travel farther from home and stay away longer, overnight stays may become an increasingly important indicator of destination competitiveness.

6.4. Satisfaction, Behavioral Intentions, and Competitiveness

As can be seen in Table 4, the value of the total effect of satisfaction (F6) to travel intentions (F7) was 0.639, the value of the total effect of travel intentions (F7) to competitiveness (F8) was 0.299, and the value of the indirect influence value of satisfaction (F6) to competitiveness (F8) was 0.191. This suggests that satisfaction (F6) impacted competitiveness (F8) through behavioral intentions (F7). Therefore, behavioral intentions (F7) were the intermediate variable. The direct factor that affected competitiveness (F8) was behavioral intentions (F7). Improving tourists’ behavioral intentions (F7) could directly enhance the competitiveness of tourist destinations (F8). Through word-of-mouth advertising and return visitors, the source market of tourist destinations can be expanded (Table 4).

7. Validity and Reliability

SPSS 26.0 software was used to perform KMO and Bartlett’s sphericity tests on the data, and the specific results are shown in Table 4. The KMO sampling appropriateness of factors F6–F8 was 0.5–0.834, respectively, and the comprehensive validity was 0.836 or higher. Bartlett’s sphericity test resulted in p = 0000; therefore, all factors were significant. The validity between the factors was fair; therefore, the data could be analyzed using the factor method.
The convergent validity was assessed by computing the average variance extracted (AVE) scores. As can also be seen in Table 4, the convergent validity was assessed by computing AVE scores. AVE should exceed 0.5 under ideal conditions; Chin (1988), Purnomo (2017) and Yin (2018) suggested that an AVE score of 0.36–0.5 is the acceptable threshold/range for convergent validity [70,71,72]. The AVE scores ranged upward from 0.42, as shown in Table 4, meaning that all constructs had convergent validity. According to Fornell and Larcker’s (1981) approach, discriminant validity could be assumed if the square root of pairs of the constructs’ AVE scores is greater than their correlation [73]. All of the construct pairs met this requirement in this case, and discriminant validity was initially assessed. (Table 5 and Table 6)
According to the literature review, many factors affect mountain-based health and wellness tourist activities. Internal consistency was assessed by computing composite reliability (CR) and Cronbach’s alpha coefficients. As per Table 4, all constructs were reliable, with both the alpha and CR coefficients ranging upward from 0.74. As all were greater than the suggested minimum of 0.70 [70], all were considered reliable. Moreover, three latent variables and ten observed variables were included, and the reliability test was analyzed using SPSS 26.0. The reliability for F6–F8 ranged from 0.738–0.833, respectively, and the comprehensive reliability α value was 0.830. Therefore, the reliability was better, as shown in Table 4.

8. Discussion and Conclusions

8.1. Discussion

8.1.1. Satisfaction Had a Direct Positive Impact on Behavioral Intentions and an Indirect Positive Impact on Competitiveness

The path value of satisfaction (F6) to behavioral intentions (F7) was 0.629. According to the literature review, similar conclusion was drawn in other tourism segments, such as in health tourism research by Kim (2020) and coffee tourism research by Wang et al. (2021). The indirect path value of satisfaction (F6) to competitiveness (F8) was 0.191. The effect of tourists’ satisfaction on destination competitiveness was indirect through tourists’ behavioral intentions. It is vital to emphasize that tourists’ satisfaction played an important role in destination competitiveness, which was also confirmed by Ross (2013), Zheng et al. (2017), He et al. (2017), and Perles-Ribes et al. (2021). However, Chen et al. (2011) suggested that there is no correlation between tourists’ satisfaction and destination competitiveness. Therefore, in this study, behavioral intentions were used as a mediator variable to adjust for the effect of satisfaction on competitiveness.
When faced with competition from two destinations A and B, tourists who are less satisfied with A and more satisfied with B are less likely to revisit and recommend A. Thus, the competitiveness and perception of B will be further enhanced. Therefore, to manage tourists’ behavioral intentions, tourism professionals need to focus on tourists’ satisfaction when planning and designing travel packages and consider how they are shaping tourists’ expectations and perceptions, from the purchase of the package to the return home. Perceptions play a notable role in tourists’ satisfaction and behavioral intentions. Creating realistic, sustainable, and natural-resource-friendly health and wellness packages for mountain-based destinations could lessen the difference between tourists’ expectations and perceptions, regardless of unknown uncontrollable variables (e.g., outside marketing and advertising and online reviews, as well as unobserved intrinsic motivators including fear and pressure [74]).

8.1.2. Tourists’ Behavioral Intentions Had a Direct Positive Effect on Competitiveness

The path value of tourists’ behavioral intentions (F7) to competitiveness (F8) was 0.299, indicating that behavioral intentions had a direct positive effect on destination competitiveness. A similar correlation was demonstrated and confirmed by Chen et al. (2016), Heesup, Kiattipoom et al. (2020), and Pai et al. (2021), among others. Stronger behavioral intentions of tourists mean a higher likelihood of revisiting and recommending mountain-based health and wellness tourist destinations, which will increase the number of tourists to the destination, thus enhancing the popularity and visibility of the destination. In addition, increasing the number of returning visitors will bring more incredible economic benefits. Though the tourist population growth rate is an important factor in destination competitiveness, overcrowding at a destination should be avoided. In the wake of COVID-19, locales and governments need to restrict the number of tourists and take other measures to ensure tourists’ health and safety, and assist in maintaining the competitiveness of mountain-based health and wellness destinations.

8.2. Conclusions

8.2.1. Theoretical Implications

It was necessary to understand the objective status quo and the basic characteristics of the mountain-based health and wellness tourism market to meet real demands. In this paper, the correlations between mountain-based health and wellness destination competitiveness, tourists’ satisfaction, and tourists’ behavioral intentions were first proposed and verified. The analysis results were mainly based on structural equation modeling. The findings provide tourism professionals and destination governments with theoretical evidence to support their competitive strategies and offer suggestions concerning how to strengthen the tourists’ satisfaction–behavioral intentions–competitiveness relationship for mountain-based health and wellness tourist destinations. (1) The conclusion was that tourists’ satisfaction with mountain-based health and wellness tourism had a direct positive effect on post-trip behavioral intentions, post-trip behavioral intentions had a direct and positive effect on competitiveness, and satisfaction had an indirect positive effect on competitiveness. (2) Satisfying the return visitors and developing an intention to return is important for tourism marketing given the increasingly fierce mountain-based health and wellness destination competitiveness. (3) Destination overcrowding reduces tourists’ satisfaction and affects their choice of their next destination, as well as the sustainable development of mountain-based health and wellness tourism. (4) The competitiveness of tourist destinations is expressed in the form of a market between tourist destinations with a common target market, share size, and tourism income. The competitiveness of tourist destinations is affected by tourists’ satisfaction and behavioral intentions, which can continuously improve the quality of life of destination residents and benefit other stakeholders that are involved in tourist destinations.

8.2.2. Managerial Implications

Our study provides references and suggestions for tourism professionals, governments, and others related to the development of tourist destinations as they formulate strategies to manage market competition, thereby enhancing destination competitiveness. (1) Based on the local culture and natural resources, tourism professionals can improve the behavioral intentions of tourists to revisit and recommend to others to enhance the competitiveness of mountain-based health and wellness tourist destinations by offering high-quality wellness services, discounts on accommodation fees and attractions, and diverse activities. (2) At the same time, managing tourists’ satisfaction includes not exaggerating or raising unrealistic expectations for tourists that will be vastly different from their on-site experience and post-trip perceptions. Mountain-based health and wellness tourist destination authorities and service providers should prepare more suitable advertising programs and tourist-tailored programs for travelers. (3) Through policies and regulations, the local or national government can raise awareness about the sustainable development of travel destinations, and considerations should be made to preserve fragile ecological environments. More research pertaining to the environmental capacity of each tourist destination’s natural and social environment should be conducted, with a focus on avoiding overcrowding. However, the tourist source market is a prerequisite for the survival and development of mountain-based health and wellness tourist destinations. (4) Economic outcomes should not be the only goal when developing and maintaining mountain-based health and wellness tourist destinations. While developing the local economy is important, tourist destination development and management should also emphasize protecting the ecological environment and local culture, as well as improving the quality of life of the residents. Therefore, in addition to the capacity in an economic sense, the competitiveness of tourist destinations should also reflect the capacity in social significance and environmental protection.

8.2.3. Limitations of the Research

As with any research, this study had some limitations. (1) The results of this study were obtained from the analysis of mountain-based health and wellness tourism only. Whether they are meaningful for other types of tourist destinations, as well as for the relationship between tourists’ satisfaction, behavioral intentions, and destination competitiveness, will need to be studied further. (2) Though the measurement was developed through a comprehensive literature review, evaluations by experts, and extensive reliability and validity tests, including SEM, this scale may be applicable only to the city of Panzhihua due to the rather unique cultural and natural environment. Therefore, before using this measurement for other contexts or cities, it may need to be tested again for generalizability. (3) The two-item scale of measuring variables was limited in this study. Whether it can be applied in other research contexts will need to be studied further. We do not recommend using a two-item scale unless necessary, and determination should be based on the actual research demands.

8.2.4. Directions for Future Research

If the present research model is applied to other mountain-based health and wellness tourist destinations, whether in China or other countries, a different outcome could be reached or the result could be congruent with this study. Additional research that examines this model is suggested. Tourist destinations are often the main attraction in terms of competitiveness, but they are not the only factor. The residents in mountain-based health and wellness tourist destinations could be added as a variable or sample in future research.

Supplementary Materials

The following are available online at https://www.mdpi.com/article/10.3390/su132313314/s1, Table S1: The 500 participants’ data records from mountain health tourism in Panzhihua city.

Author Contributions

Conceptualization, L.Z.; methodology, L.Z. and R.Y.M.L.; software, L.Z. and X.H.; validation, L.Z., R.Y.M.L. and X.H.; formal analysis, L.Z.; investigation, L.Z. and X.H.; resources, L.Z.; data curation, L.Z. and X.H.; writing—original draft preparation, L.Z.; writing—review and editing, L.Z. and R.Y.M.L.; visualization, L.Z.; project administration, L.Z. and R.Y.M.L.; funding acquisition, L.Z. All authors have read and agreed to the published version of the manuscript.

Funding

This research was funded by the Ph.D. Starting Research Fund from the Panzhihua University (no. 035200153).

Institutional Review Board Statement

The study was conducted according to the guidelines of the Declaration of Helsinki, and approved by the Ethics Committee (HREC), HongKong Shue Yan University (Approval Code: No. HREC 21-02 (4) and Approval Date: 11 March 2021).

Informed Consent Statement

Informed consent was obtained from all subjects involved in the study.

Data Availability Statement

The data presented in this study with 500 participants are available in the Supplementary Material. At the same time, publicly available datasets were also analyzed in this study, and this data can be found here: http://www.panzhihua.gov.cn (10 October 2021).

Acknowledgments

The authors thank Huang Y.X., Tao S.J., Zhou Y.J., and Tian K.X. (Panzhihua University) for their useful contribution to the field questionnaire surveys. The authors also wish to thank Mao Y.Y. (Panzhihua University) for his helpful suggestions regarding mountain health tourism.

Conflicts of Interest

The authors declare no conflict of interest.

References

  1. Mondo, T.S.; Fiates, G.; Gon, G. Tourqual: Proposal of a Protocol for Quality Evaluation on Services at Tourist Attractions. Braz. Bus. Rev. 2017, 14, 448–465. [Google Scholar] [CrossRef]
  2. Zainuddin, Z.; Radzi, M.S.; Zahari, M.S.M. Perceived destination competitiveness of Langkawi Island, Malaysia: A preliminary finding. Procedia-Soc. Behav. Sci. 2013, 105, 801–810. [Google Scholar] [CrossRef] [Green Version]
  3. Durán-Román, J.L.; Cárdenas-García, P.J.; Pulido-Fernández, J.I. Tourists’ willingness to pay to improve sustainability and experience at destination. J. Destin. Mark. Manag. 2021, 19, 100540. [Google Scholar] [CrossRef]
  4. Costa, T.; Lima, M.J.; Empresarias, E.S.D.C.; De Setúbal, P.I.P. Cooperation in tourism and regional development. Tour. Manag. Stud. 2018, 14, 50–62. [Google Scholar] [CrossRef] [Green Version]
  5. Perez-Romero, M.; Flores-Romero, M.; Alfaro-Garcia, V.; Merigo, J. Tourism competitiveness: Bibliometric analysis of global scientific production from 1991 to 2018. Inquietud Empresarial 2021, 21, 55–73. [Google Scholar]
  6. Rodríguez-Díaz, B.; Pulido-Fernández, J.I. Sustainability as a Key Factor in Tourism Competitiveness: A Global Analysis. Sustainability 2020, 12, 51. [Google Scholar] [CrossRef] [Green Version]
  7. Kanazawa, F.N.; Giraldi, J.D.M.E.; Oliveira, J.H.C.D. Online and offline communication for country brands: An exploratory study of the Brazil Brand. Rev. Bras. Pesqui. Turismo 2019, 13, 58–71. [Google Scholar] [CrossRef] [Green Version]
  8. Palacios-Florencio, B.; Santos-Roldán, L.; Berbel-Pineda, J.M.; Castillo-Canalejo, A.M. Sustainable Tourism as a Driving force of the Tourism Industry in a Post-COVID-19 Scenario. Soc. Indic. Res. 2021, 1–21. [Google Scholar] [CrossRef]
  9. Santana-Jiménez, Y.; Hernández, J.M. Estimating the effect of overcrowding on tourist attraction: The case of Canary Islands. Tour. Manag. 2011, 32, 415–425. [Google Scholar] [CrossRef]
  10. Yin, J.; Chen, Y.; Ji, Y. Effect of the event strength of the coronavirus disease (COVID-19) on potential online organic agricultural product consumption and rural health tourism opportunities. Manag. Decis. Econ. 2021, 42, 1156–1171. [Google Scholar] [CrossRef]
  11. Merdivenci, F.; Karakaş, H. Analysis of Factors Affecting Health Tourism Performance Using Fuzzy Dematel Method. Adv. Hosp. Tour. Res. 2020, 8, 371–392. [Google Scholar] [CrossRef]
  12. Yang, J.Y.; Paek, S.; Kim, T.; Lee, T.H. Health tourism: Needs for healing experience and intentions for transformation in wellness resorts in Korea. Int. J. Contemp. Hosp. Manag. 2015, 27, 1881–1904. [Google Scholar] [CrossRef]
  13. Pessot, E.; Spoladore, D.; Zangiacomi, A.; Sacco, M. Natural Resources in Health Tourism: A Systematic Literature Review. Sustainability 2021, 13, 2661. [Google Scholar] [CrossRef]
  14. Dunets, A.N.; Yankovskaya, V.; Plisova, A.B.; Mikhailova, M.V.; Vakhrushev, I.B.; Aleshko, R.A. Health tourism in low mountains: A case study. Entrep. Sustain. Issues 2020, 7, 2213–2227. [Google Scholar] [CrossRef]
  15. Kling, K.G.; Margaryan, L.; Fuchs, M. (In) equality in the outdoors: Gender perspective on recreation and tourism media in the Swedish mountains. Curr. Issues Tour. 2020, 23, 233–247. [Google Scholar] [CrossRef]
  16. Zeng, L.; Li, R.Y.M. Tourist Satisfaction, Willingness to Revisit and Recommend, and Mountain Kangyang Tourism Spots Sustainability: A Structural Equation Modelling Approach. Sustainability 2021, 13, 10620. [Google Scholar] [CrossRef]
  17. Crouch, G.I.; Ritchie, J.R.B. Tourism, competitiveness, and societal prosperity. J. Bus. Res. 1999, 44, 137–152. [Google Scholar] [CrossRef]
  18. Reisinger, Y.; Michael, N.; Hayes, J.P. Destination competitiveness from a tourist perspective: A case of the United Arab Emirates. Int. J. Tour. Res. 2018, 21, 259–279. [Google Scholar] [CrossRef]
  19. Abreu-Novais, M.; Ruhanen, L.; Arcodia, C. Destination competitiveness: What we know, what we know but shouldn’t and what we don’t know but should. Curr. Issues Tour. 2016, 19, 492–512. [Google Scholar] [CrossRef]
  20. Plumins, M.; Sceulovs, D.; Gaile-Sarkane, E. Competitiveness definitions’ and concepts qualitative content analysis. In Proceedings of the 21st International Scientific Conference, Brno, Czech Republic, 19–20 May 2016; p. 380. Available online: https://www.researchgate.net/profile/Anna-Lis/publication/329590890_Technology_transfer_centers_as_an_instrument_for_the_development_of_technological_capabilities/links/5c11550e299bf139c754773d/Technology-transfer-centers-as-an-instrument-for-the-development-of-technological-capabilities.pdf#page=379 (accessed on 10 October 2021).
  21. Hanafiah, M.H.; Zulkifly, M.I. Tourism destination competitiveness and tourism performance: A secondary data approach. Compet. Rev. 2019, 29, 592–621. [Google Scholar] [CrossRef]
  22. Fernández, J.A.S.; Azevedo, P.S.; Martín, J.M.M. Determinants of tourism destination competitiveness in the countries most visited by international tourists: Proposal of a synthetic index. Tour. Manag. Perspect. 2020, 33, 100582. [Google Scholar] [CrossRef]
  23. Neto, A.Q.; Dimmock, K.; Lohmann, G.; Scott, N. Destination competitiveness: How does travel experience influence choice? Curr. Issues Tour. 2019, 23, 1673–1687. [Google Scholar] [CrossRef]
  24. Cvelbar, L.K.; Dwyer, L.; Koman, M.; Mihalic, T. Drivers of Destination Competitiveness in Tourism: A Global Investigation. J. Travel Res. 2016, 55, 1041–1050. [Google Scholar] [CrossRef]
  25. Buhalis, D. Marketing the competitive destination of the future. Tour. Manag. 2000, 21, 97–116. [Google Scholar] [CrossRef] [Green Version]
  26. Cimbaljević, M.; Stankov, U.; Pavluković, V. Going beyond the traditional destination competitiveness—Reflections on a smart destination in the current research. Curr. Issues Tour. 2019, 22, 2472–2477. [Google Scholar] [CrossRef]
  27. Cronjé, D.F.; du Plessis, E. A review on tourism destination competitiveness. J. Hosp. Tour. Manag. 2020, 45, 256–265. [Google Scholar] [CrossRef]
  28. Kubickova, M.; Martin, D. Exploring the relationship between government and destination competitiveness: The TALC model perspective. Tour. Manag. 2020, 78, 104040. [Google Scholar] [CrossRef]
  29. Jovicic, D.Z. From the traditional understanding of tourism destination to the smart tourism destination. Curr. Issues Tour. 2019, 22, 276–282. [Google Scholar] [CrossRef]
  30. Luštický, M.; Štumpf, P. Leverage points of tourism destination competitiveness dynamics. Tour. Manag. Perspect. 2021, 38, 100792. [Google Scholar] [CrossRef]
  31. Hakim, L. Managing Biodiversity for a Competitive Ecotourism Industry in Tropical Developing Countries: New Opportunities in Biological Fields. In Proceedings of the 8th International Conference on Global Resource Conservation (ICGRC 2017), Malang, Indonesia, 19–20 July 2017; Available online: https://aip.scitation.org/doi/abs/10.1063/1.5012708 (accessed on 10 October 2021).
  32. Romeo, R.; Grita, F.; Parisi, F.; Russo, L. Vulnerability of Mountain Peoples to Food Insecurity: Updated Data and Analysis of Drivers; Food & Agriculture Org.: Roma, Italy, 2020; Available online: https://books.google.com.sg/books?hl=zh-CN&lr=&id=pzkQEAAAQBAJ&oi=fnd&pg=PA106&dq=32.%09Romeo,+R.%3B+Grita,+F.%3B+Parisi,+F.%3B+Russo,+L.+Vulnerability+of+Mountain+Peoples+to+Food+Insecurity:+Updated+Data+and+Analysis+of+Drivers%3B+Food+%26+Agriculture+Org++.:+2020.&ots=5800ujn0Jd&sig=dQknWDFFZYSD677Lhf5Eq476umo&redir_esc=y#v=onepage&q=32.%09Romeo%2C%20R.%3B%20Grita%2C%20F.%3B%20Parisi%2C%20F.%3B%20Russo%2C%20L.%20Vulnerability%20of%20Mountain%20Peoples%20to%20Food%20Insecurity%3A%20Updated%20Data%20and%20Analysis%20of%20Drivers%3B%20Food%20%26%20Agriculture%20Org%20%20.%3A%202020.&f=false (accessed on 10 October 2021).
  33. Pan, X.; Yang, Z.; Han, F.; Lu, Y.; Liu, Q. Evaluating Potential Areas for Mountain Wellness Tourism: A Case Study of Ili, Xinjiang Province. Sustainability 2019, 11, 5668. [Google Scholar] [CrossRef] [Green Version]
  34. del Rio-Rama, M.; Maldonado-Erazo, C.; Duran-Sanchez, A.; Alvarez-Garcia, J. Mountain tourism research. A review. Eur. J. Tour. Res. 2019, 22, 130–150. [Google Scholar]
  35. Jiang, Z. A Review of Mountain Tourism Environment Research. J. Chongqing Norm. Univ. 2007, 24, 77–81. [Google Scholar]
  36. Tian, M. Hotspots, progress and enlightenments of foreign mountain tourism research. World Reg. Stud. 2020, 29, 1071–1081. [Google Scholar]
  37. Zeng, Y.X.; Zhong, L.S. Identifying conflicts tendency between nature-based tourism development and ecological protection in China. Ecol. Indic. 2020, 109. [Google Scholar] [CrossRef]
  38. Hartwell, H.; Fyall, A.; Willis, C.; Page, S.; Ladkin, A.; Hemingway, A. Progress in tourism and destination wellbeing research. Curr. Issues Tour. 2018, 21, 1830–1892. [Google Scholar] [CrossRef] [Green Version]
  39. Bowling, A.; Rowe, G.; McKee, M. Patients’ experiences of their healthcare in relation to their expectations and satisfaction: A population survey. J. R. Soc. Med. 2013, 106, 143–149. [Google Scholar] [CrossRef] [Green Version]
  40. Taplin, R.H. The influence of competition on visitor satisfaction and loyalty. Tour. Manag. 2013, 36, 238–246. [Google Scholar] [CrossRef]
  41. Chang, Y.-T.; Liu, S.-M.; Park, H.; Roh, Y. Cruise traveler satisfaction at a port of call. Marit. Policy Manag. 2015, 43, 483–494. [Google Scholar] [CrossRef]
  42. Kim, J.A.; Kim, C.W. The Effect of Satisfaction on Wellness Tourist Attractions Service Quality Factors towards Intention to Re-visit and Recommend. J. Artic. Manag. Syst. 2020, 16, 245–263. [Google Scholar] [CrossRef]
  43. Han, H.; Hwang, J. Growing competition in the healthcare tourism market and customer retention in medical clinics: New and experienced travellers. Curr. Issues Tour. 2018, 21, 680–702. [Google Scholar] [CrossRef]
  44. Yen, C.-H.; Teng, H.-Y.; Chang, S.-T. Destination brand identity and emerging market tourists’ perceptions. Asia Pac. J. Tour. Res. 2020, 25, 1311–1328. [Google Scholar] [CrossRef]
  45. Bayih, B.E.; Singh, A. Modeling domestic tourism: Motivations, satisfaction and tourist behavioral intentions. Heliyon 2020, 6, e04839. [Google Scholar] [CrossRef] [PubMed]
  46. Kim, J. A Study on Behavior Intention of Wellness Tourists Applying Extended Planned Behavior Theory. J. Distrib. Manag. Res. 2020, 23, 123–136. [Google Scholar] [CrossRef]
  47. Cotter, K.N.; Fekete, A.; Silvia, P.J. Why Do People Visit Art Museums? Examining Visitor Motivations and Visit Outcomes. Empir. Stud. Arts 2021. [Google Scholar] [CrossRef]
  48. Chen, L.-H.; Wang, M.-J.S.; Morrison, A.M. Extending the memorable tourism experience model: A study of coffee tourism in Vietnam. Br. Food J. 2021, 123, 2235–2257. [Google Scholar] [CrossRef]
  49. Nazmfar, H.; Eshghei, A.; Alavi, S.; Pourmoradian, S. Analysis of travel and tourism competitiveness index in middle-east countries. Asia Pac. J. Tour. Res. 2019, 24, 501–513. [Google Scholar] [CrossRef]
  50. Gomezelj, D.O.; Mihalič, T. Destination competitiveness—Applying different models, the case of Slovenia. Tour. Manag. 2008, 29, 294–307. [Google Scholar] [CrossRef]
  51. Fathi, H.; Wang, J.H.; Song, H.J. A study on strategies for local tourism development in Morocco from the perspective of community-based tourism: The case study of Chefchaoun. Korean J. Hosp. Tour. 2018, 27, 21–36. [Google Scholar] [CrossRef]
  52. Zhou, W.Z.; Pan, H.A. Study on the Tourist Satisfaction Index Model. In Proceedings of the International Symposium on Green Hospitality and Tourism Management, Atlanta, GA, USA, 29–31 January 2010; Georgia State Univ, Robinson Coll Business, Sch Hospital: Atlanta, GA, USA; pp. 249–256. Available online: http://apps.webofknowledge.com/full_record.do?product=UA&search_mode=GeneralSearch&qid=68&SID=F1zzVnIQrNqL965rjkW&page=1&doc=6 (accessed on 10 October 2021).
  53. Chen, C.-M.; Chen, S.H.; Lee, H.T. The destination competitiveness of Kinmen’s tourism industry: Exploring the interrelationships between tourist perceptions, service performance, customer satisfaction and sustainable tourism. J. Sustain. Tour. 2011, 19, 247–264. [Google Scholar] [CrossRef]
  54. Zheng, Y.; Wang, J.; Tsai, S.-B.; Li, G.; Wang, J.; Zhou, J. Research on Customer Satisfaction in Marine Cultural and Sustainable Tourism—A Case Study of Shanghai. Sustainability 2017, 9, 921. [Google Scholar] [CrossRef] [Green Version]
  55. He, Y.; Zhao, R.; Duan, S.; Jin, M. Intuitionistic fuzzy number: An application to a scenic tourist satisfacation evaluation. J. Differ. Equ. Appl. 2017, 23, 21–29. [Google Scholar] [CrossRef]
  56. Teixeira, S.; Ferreira, J.; Almeida, A.; Parra-Lopez, E. Tourist events and satisfaction: A product of regional tourism competitiveness. Tour. Rev. 2019, 74, 943–977. [Google Scholar] [CrossRef]
  57. Perles-Ribes, J.F.; Moreno-Izquierdo, L.; Torregrosa, T.; Ramón-Rodríguez, A.B. Satisfaction, seasonality and tourist expenditure in consolidated tourist destinations. Anatolia-Int. J. Tour. Hosp. Res. 2021, 32, 489–500. [Google Scholar] [CrossRef]
  58. Ye, S.; Wei, W.; Wen, J.; Ying, T.; Tan, X. Creating Memorable Experience in Rural Tourism: A Comparison between Domestic and Outbound Tourists. J. Travel Res. 2021, 60, 1527–1542. [Google Scholar] [CrossRef]
  59. Chen, J.M.; Neuts, B.; Nijkamp, P.; Liu, J. Demand Determinants of Cruise Tourists in Competitive Markets: Motivation, Preference and Intention. Tour. Econ. 2016, 22, 227–253. [Google Scholar] [CrossRef]
  60. Han, H.; Kiatkawsin, K.; Koo, B.; Kim, W. Thai wellness tourism and quality: Comparison between Chinese and American visitors’ behaviors. Asia Pac. J. Tour. Res. 2020, 25, 424–440. [Google Scholar] [CrossRef]
  61. Pai, C.-K.; Kang, S.; Liu, Y.; Zheng, Y. An Examination of Revisit Intention Based on Perceived Smart Tourism Technology Experience. Sustainability 2021, 13, 1007. [Google Scholar] [CrossRef]
  62. Li, T.; Liu, F.; Soutar, G.N. Experiences, post-trip destination image, satisfaction and loyalty: A study in an ecotourism context. J. Destin. Mark. Manag. 2021, 19, 100547. [Google Scholar] [CrossRef]
  63. Garver, M.S.; Mentzer, J.T. Logistics Research Methods: Employing Structural Equation Modeling to Test for Construct Validity. J. Bus. Logist. 1999, 20, 33–58. [Google Scholar]
  64. Eisinga, R.; Grotenhuis, M.T.; Pelzer, B. The reliability of a two-item scale: Pearson, Cronbach, or Spearman-Brown? Int. J. Public Health 2013, 58, 637–642. [Google Scholar] [CrossRef]
  65. Tan, W.-K. Repeat visitation: A study from the perspective of leisure constraint, tourist experience, destination images, and experiential familiarity. J. Destin. Mark. Manag. 2017, 6, 233–242. [Google Scholar] [CrossRef]
  66. Prayag, G.; Hosany, S.; Muskat, B.; Del Chiappa, G. Understanding the Relationships between Tourists’ Emotional Experiences, Perceived Overall Image, Satisfaction, and Intention to Recommend. J. Travel Res. 2017, 56, 41–54. [Google Scholar] [CrossRef] [Green Version]
  67. Jensen, Ø.; Li, Y.; Uysal, M. Visitors’ satisfaction at managed tourist attractions in Northern Norway: Do on-site factors matter? Tour. Manag. 2017, 63, 277–286. [Google Scholar] [CrossRef]
  68. Marques, C.; da Silva, R.V.; Antova, S. Image, satisfaction, destination and product post-visit behaviours: How do they relate in emerging destinations? Tour. Manag. 2021, 85, 104293. [Google Scholar] [CrossRef]
  69. Chin, C.H.; Lo, M.C.; Bin Razak, Z.; Pasbakhsh, P.; Mohamad, A.A. Resources Confirmation for Tourism Destinations Marketing Efforts Using PLS-MGA: The Moderating Impact of Semirural and Rural Tourism Destination. Sustainability 2020, 12, 6787. [Google Scholar] [CrossRef]
  70. Purnomo, Y.W. A Scale for Measuring Teachers’ Mathematics-Related Beliefs: A Validity and Reliability Study. Int. J. Instr. 2017, 10, 23–38. [Google Scholar] [CrossRef]
  71. Chin, W.W. Commentary: Issues and Opinion on Structural Equation Modeling. Manag. Inf. Syst. Q. 1998, 22, 7–16. [Google Scholar]
  72. Yin, N. The influencing outcomes of job engagement: An interpretation from the social exchange theory. Int. J. Prod. Perform. Manag. 2018, 67, 873–889. [Google Scholar] [CrossRef]
  73. Fornell, C.; Larcker, D.F. Evaluating structural equation models with unobservable variables and measurement error. J. Mark. Res. 1981, 18, 39–50. [Google Scholar] [CrossRef]
  74. Li, R.Y.M.; Poon, S.W. Using web 2.0 to share knowledge of construction safety: The fable of economic animals. Econ. Aff. 2011, 31, 73–79. [Google Scholar] [CrossRef]
Figure 1. Total tourist revenue, GDP, and total number of tourists received from 2016 to 2020 in Panzhihua city. Data source: http://www.panzhihua.gov.cn (10 October 2021).
Sustainability 13 13314 g001
Figure 2. Growth rate of total tourist revenue, GDP, and total number of tourists received from 2016 to 2020 in Panzhihua city. Data source: http://www.panzhihua.gov.cn (10 October 2021).
Sustainability 13 13314 g002
Figure 3. Preliminary model construction.
Sustainability 13 13314 g003
Figure 4. Standardized model of “satisfaction–behavioral intentions–competitiveness”.
Sustainability 13 13314 g004
Table 1. Descriptions of the latent and observed variables.
Latent VariableObserved VariableDescription
SatisfactionTravel expectations (TS1) The tourists’ expectations to be met from mountain-based health and wellness tourism projects [47,67,68]
Post-trip travel recognition (TS2) The post-trip recognition of mountain-based health and wellness tourist destinations [41,47,53]
Behavioral intentionsWillingness to revisit (RI1) Being willing to go to this mountain-based health and wellness tourist destination again [41,65]
Willingness to recommend (RI2) Being willing to recommend a mountain recreation tour to friends and relatives [41,47,66]
CompetitivenessNumber of tourists (RC1)The impact of the increasing number of tourists on the competitiveness of mountain-based health and wellness tourist destinations
Growth rate of tourist arrivals (RC2)The impact of the growth rate of tourist arrivals on the competitiveness of mountain-based health and wellness tourist destinations
Tourism income (RC3)The contribution of tourism income to the competitiveness of mountain-based health and wellness tourist destinations
Tourism revenue growth rate (RC4)The impact of the growth rate of tourism income on the competitiveness of mountain-based health and wellness tourist destinations
Overnight visitor reception (RC5)The proportion of overnight tourist reception to the competitiveness of mountain-based health and wellness tourist destinations
Total tourism revenue as a proportion of GDP (RC6)The proportion of total tourism revenue in local GDP to the competitiveness of mountain-based health and wellness tourist destinations
Table 2. Goodness-of-fit statistics.
Fitting IndexIndex ValueFit
Absolute fit
Chi-squared value (CMIN)43.716--
Degrees of freedom (df)28--
CMIN/df1.561<3Good
Goodness-of-fit index (GFI)0.983>0.90Good
Mean residual square root (RMR)0.020<0.05Good
Mean square root of approximation error (RMSEA)0.034<0.05Good
Parsimonious goodness-of-fit
Parsimonious benchmark goodness-of-fit index (PNFI)0.607>0.50Good
Value-added fit
Normative fit index (NFI)0.975>0.95Good
Irregular fitting index (TLI)0.985>0.95Good
Comparative fitting index (CFI)0.991>0.95Good
Table 3. Regression weights: group 1—default model.
EstimateS.E.C.R.p
H1F7<---F60.6390.0749.330***
H2F8<---F60.2330.0682.7650.006
H3F8<---F70.2990.0673.383***
TS1<---F60.771
TS2<---F60.8020.09011.692***
RI1<---F70.770
RI2<---F70.7610.08311.247***
RC5<---F80.6020.08911.687***
RC4<---F80.6770.10410.961***
RC3<---F80.6290.1039.916***
RC2<---F80.7010.10210.768***
RC1<---F80.6650.10310.358***
RC6<---F80.604
Table 4. Standardized total effects, direct effects, and indirect effects.
Standardized Total EffectsStandardized Direct EffectsStandardized Indirect Effects
F6F7F8 F6F7F8 F6F7F8
F70.6390.0000.000F70.6390.0000.000F70.0000.0000.000
F80.4240.2990.000F80.2330.2990.000F80.1910.0000.000
RC10.2820.1990.665RC10.0000.0000.665RC10.2820.1990.000
RC20.2970.2100.701RC20.0000.0000.701RC20.2970.2100.000
RC30.2660.1880.629RC30.0000.0000.629RC30.2660.1880.000
RC40.2870.2020.677RC40.0000.0000.677RC40.2870.2020.000
RC50.2550.1800.602RC50.0000.0000.602RC50.2550.1800.000
RC60.2560.1800.604RC60.0000.0000.604RC60.2560.1800.000
RI20.4860.7610.000RI20.0000.7610.000RI20.4860.0000.000
RI10.4920.7700.000RI10.0000.7700.000RI10.4920.0000.000
TS20.8020.0000.000TS20.8020.0000.000TS20.0000.0000.000
TS10.7710.0000.000TS10.7710.0000.000TS10.0000.0000.000
Table 5. Validity and reliability test.
Validity TestReliability Test
FactorQuantity of KMO Sampling AppropriatenessApproximate Chi-SquaredDegrees of FreedomSignificanceAVE ScoresC.R.α (Standard)α
F60.5239.3061p = 0.0000.620.760.7640.764
F70.5209.2991p = 0.0000.620.760.7390.738
F80.8341036.13315p = 0.0000.420.810.8340.833
Comprehensive0.8261718.90445p = 0.000 0.830.83
Table 6. Correlations of all variables.
F6F7F8
F60.62
F70.640.62
F80.420.450.42
A V E 2 0.790.790.65
Publisher’s Note: MDPI stays neutral with regard to jurisdictional claims in published maps and institutional affiliations.

