Article

The Determination of Priority Areas for the Construction of Green Roofs with Use of the Urban Area Valorisation Method

Department of Landscape Architecture, Wrocław University of Environmental and Life Sciences, ul. Grunwaldzka 55, 50-357 Wrocław, Poland
*
Author to whom correspondence should be addressed.
Sustainability 2021, 13(23), 13227; https://doi.org/10.3390/su132313227
Submission received: 18 October 2021 / Revised: 20 November 2021 / Accepted: 23 November 2021 / Published: 29 November 2021

Abstract

:
The aim of the research was to valorise the analysed urbanized area in the direction of determining the hierarchy in the order of interventions aimed at increasing the share of biologically active area and natural field retention, the potential impact of green roofs on the valorisation of the studied urbanized areas. The research covered the Gajowice estate in Wrocław. The scope of the research included the division of the area into working cells, for which valorisation was carried out using the point method based on the criterion of the degree of covering the land with vegetation and the degree of covering the area with various types of buildings. The valorisation result was determined on the basis of a comparative matrix taking into account the results of the partial assessment of vegetation and building cover. The impact of green infrastructure (green roofs) on valorisation was simulated by proposing their location on buildings with the so-called big plate. The introduction of green roofs on selected buildings improved the valorisation result in some research cells, reducing the number of cells requiring intervention. This raised the valorisation assessment by even two classes, which resulted in a significant reduction in the number of critical areas, with too much hardened surface, and increased the number of areas with a satisfactory level of biologically active surfaces.

1. Introduction

Urban greenery plays an essential role in shaping local climate. It plays the role of urban air conditioning that cools down the environment and balances temperature through evapotranspiration [1]. Green infrastructure (GI) is defined as areas that maintain natural ecological processes, support air resources, and foster health and quality of life [2]. Phenomena related to climate changes, such as heatwaves, droughts, and floods, have a negative influence on urban and rural areas throughout the world [3,4,5,6,7]. Due to that, the main idea of GI consists in using natural or semi-natural infrastructure to minimise the risk of occurrence of the harmful natural phenomena mentioned above [8].
The climate is one of the most sensitive elements of the natural environment, which strongly reacts to changes in land use and management. Urbanization and industrialization cause wide changes in the climatic environment. Which consequently leads to emergence in urban areas and islands of: Urban Heat Island (UHI), air pollution, precipitation, as well as changes in air circulation [9]. Considering the above, one should link the scope of changes in the climate environment with the urban agglomeration that interferes with the natural environment, being the direct cause of these processes. According to scientific forecasts and the prognoses of increasing global urbanisation, in 2014 urban areas were inhabited by approximately 54% of the world’s population, and it is estimated that this number will grow even more, to reach 66% in 2050 [10]. As a result of such rapid process, natural land cover is being replaced with developed, impermeable surfaces. Large areas of artificial horizontal and vertical surfaces prevent rainwater from infiltrating the soil. City centres in particular, being areas of dense, sealed, and often high development, modify air flow, and thus determine heat and vapour exchange. Apart from that, industrial, transport, and municipal activities result in the emission of pollutants in form of dust and gases. This affects the solar irradiation balance and the emission of heat from fuel combustion processes [11,12]. As a result, the created environment is completely different from natural areas. The phenomenon of heat collection in urban areas results in the emergence of UHI, which means that city centres are warmer than the surrounding suburban and rural areas [13,14,15]. According to the Report of the Intergovernmental Panel on Climate Change (IPCC) of 2007, the UHI will become one of the main and most important problems in the 21st century.

2. Literature Review

2.1. Problems of Urban Areas

As the population of large cities is constantly increasing, it will become necessary to broaden the development of research on the climate of urban areas [16]. Skilful use of green areas and building arrangements, with the aim to thin out dense development, increasing horizontal and vertical air exchange and land drainage may, in the future, lead to a significant improvement of the city’s microclimate and the living conditions of inhabitants. One of the related actions was the Sustainable Urbanization Strategy that was adopted in 2016 with the support of the United Nations Development Programme (UNDP). However, due to the rapid urbanisation process, new buildings are often located in areas threatened, e.g., by floods, including on riverbanks and flooding areas, which increases the risk of disasters [17]. The use of GI, including both intensive and extensive green roofs (GR) is an economic and environmental investment [18,19]. Each surface, whether horizontal or vertical, where GI and GR are applied, plays the role of a filter that cleans the air, while producing oxygen at the same time [20,21].
GI is a vital element of the urban infrastructure, which contributes to reducing the problem of UHI. The European Strategy on Green Infrastructure defines GI as “a strategically planned network of high quality natural and semi-natural areas with other environmental features, which is designed and managed to deliver a wide range of ecosystem services and protect biodiversity in both rural and urban settings” [22]. The implementation of GI enables to better adapt to climate changes [23], in particular if local authorities and the municipality are involved in promoting and implementing the policy and practices that support GI [24].

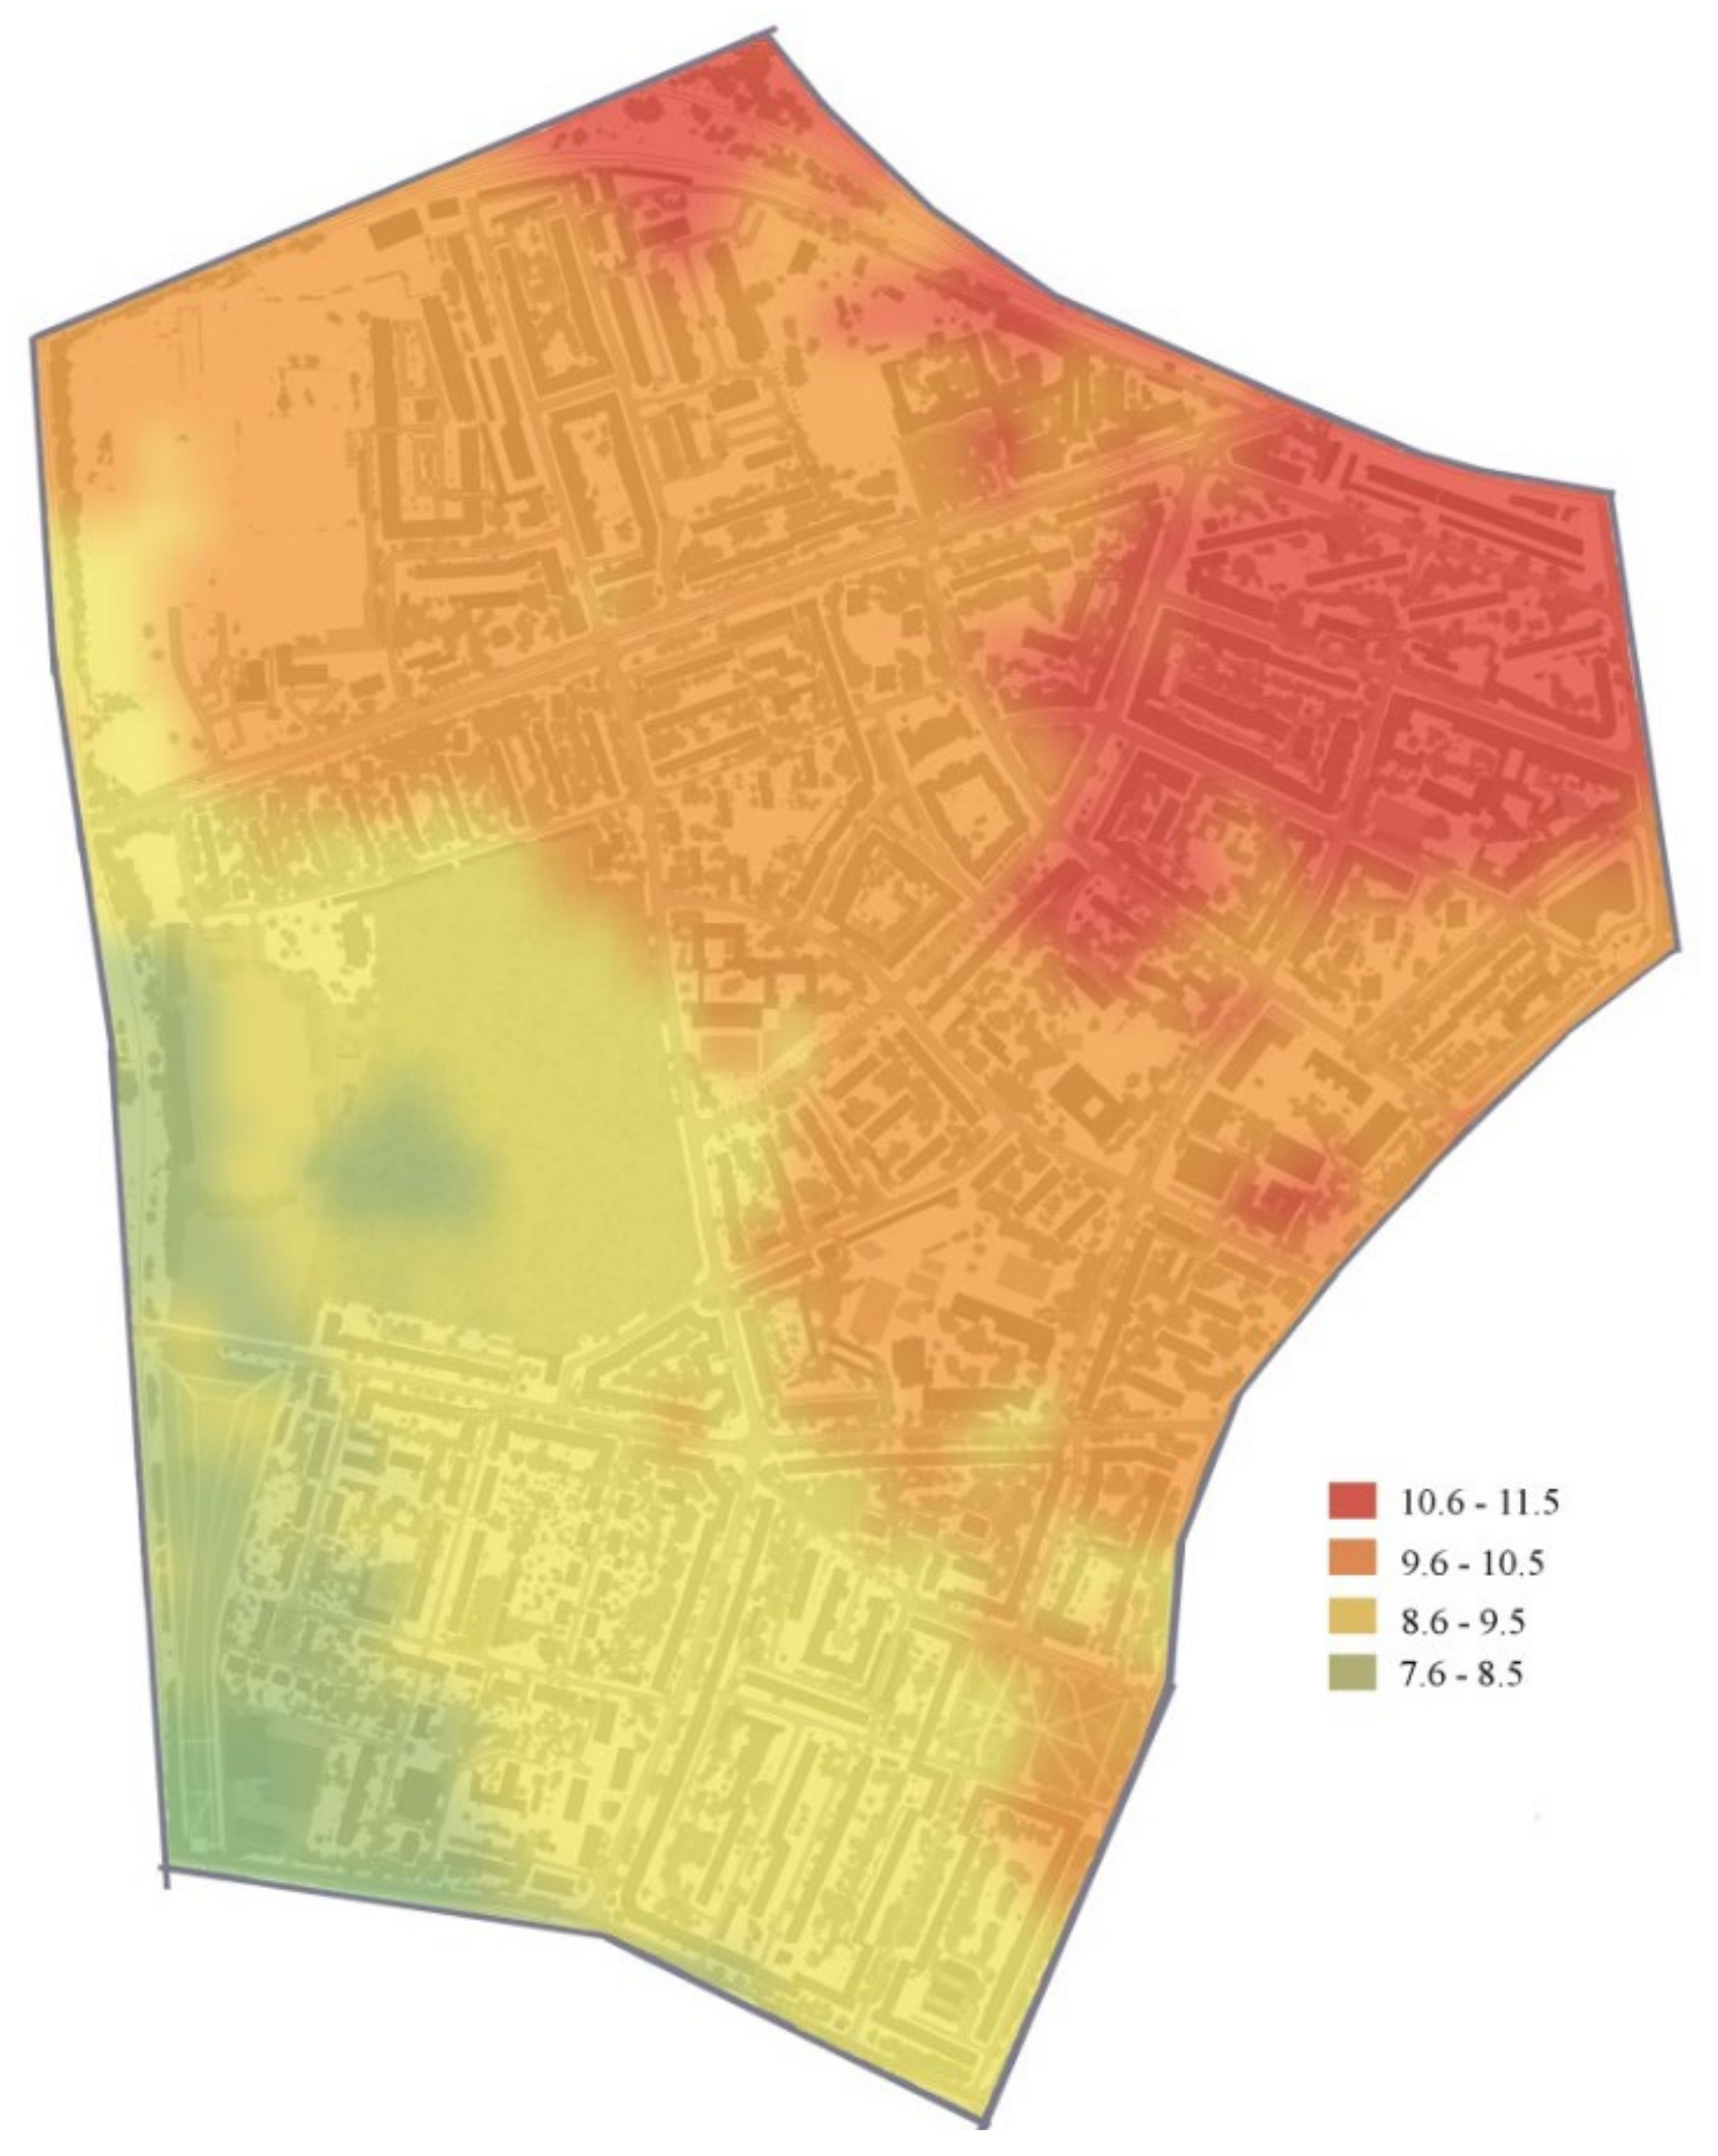
2.2. Urban Heat Island in Wrocław

In Wrocław, the UHI occurs mostly at night, during cloudless, calm weather [25]. The highest intensity of UHI is noted in the city centre, with medium UHI in high development areas and the lowest in single-family housing areas. The most intensive UHI is observed during summer nights. The phenomenon occurs more frequently in summer than in winter. In summer, the intensity of UHI in Wrocław increases between 6 and 9 p.m., when the buildings that have accumulated heat during daytime start to release it. The maximum intensity of the phenomenon is noted between 10 and 12 p.m. [9]. Then the UHI starts to decrease around 6 a.m., to reach the minimum at 9 a.m. [26,27,28].

2.3. Biologically Active Surfaces and Biodiversity

The actions to support biodiversity and the protection of rare species are the subject of numerous declarations and strategies [29,30]. In 2009, the Ministry of Development of Singapore started a movement to support the introduction of a City Biodiversity Index (CBI) for cities. Due to the adopted climate and environment policies, 35 cities from all around the globe became involved. The aim of this project was to monitor the statues of biodiversity in urban areas and to support its reconstruction. In Poland, the Act on Environmental Protection is executed in the provisions of local spatial development plans and in economic and investment activities. These actions are sup-ported by recommendations concerning the sustenance of ecological processes, ecosystems, saving habitats, as well as the protection and reclamation of greenery in cities [31].
The term “biologically active surface” (BAS) is defined in § 3 (22) of the Ordinance of the Minister of Infrastructure of the 12 April 2002 as “an area whose surface is arranged in a way that ensures natural vegetation of plants and rainwater retention, as well as 50% of the surface area of terraces and flat roofs with such surface and other surfaces that ensure natural vegetation of plants, of a surface area not lower than 10 m2, as well as surface water in this area” [32]. As a result, for the purposes of excluding the surface area of the real property from BAS it should be assumed that BAS is an area with a surface arranged in a way that enables natural vegetation of plants and rainwater retention.
The methods and coefficients used to determine the proportion of developed surface to the area of BAS vary across different countries (Table 1). The parameters used, as well as the factors that are taken into consideration when calculating and assigning weights to those proportions also vary. This study presents selected elements of biological activity based on the examples of three cities: Berlina, Malmo, and Seattle, which will be compared with the Polish version of the coefficients, proposed by the team led by Alina Pancewicz [31].
Certain countries have introduced legislation that regulates land development in the context of sustainable recreation of the city structure [33]. However, such legal regulations are not available or enforced in all countries [34]. Still, even if local self-governments can-not rely on such legal regulations, considering the pace of climate changes, they should closely monitor the scale of land use and limit the uncontrolled spread of city borders so that the cities will develop in an optimum, smart way [35].
Berlin has developed the BAF Biotope Area Factor [36,37,38,39]. Its most important elements are the native soil as well as selecting plants that match local environmental conditions and the rainwater infiltration capacity. The aim of this regulation is to ensure beneficial microclimate conditions and to improve the aesthetic quality of the city. The authorities of Malmo created the Green Space Factor (GSF) [40]. The definition and scope of this factor are similar to those of BAF, but apart from that, it takes into account the structure of greenery and the size of trees and bushes that enable to add further area to the calculation. The Green Factor (GF) developed in Seattle [41] includes native plants and the resistance to droughts. The city also promotes visual accessibility of residential estate greenery and designing cultivation areas, such as decorative vegetable gardens.
In Poland, the Ordinance of the Minister of Infrastructure requires at least 25% of the plot surface to be designated for BAS [32]. This is considered to be the ratio of the BAS to the total surface area of the plot. The principles of calculating the coefficients were defined by Alina Pancewicz et al. [31], assuming that the following criteria are important: connection to native soil, the presence of water sur-face, native species connected to type of greenery.
The systems for calculating BAS [42] are dominated by two properties, namely rainwater retention capacity and coverage of land with greenery.
Natural water retention is the ability to retain water and to store it in the environment, which results in improved water balance in the catchment and enables to stop or slow down the water discharge also, which fosters the development of the natural environment. Water retention in soil reduces the risk of drought. The water is released slowly, so it stays in the ground for a longer period, supplying the ground waters [43,44,45,46,47,48,49,50,51]. Such water management prevents flooding in cases of torrential rain. These types of solutions that promote retention are applied in GI in cities. Some examples are raingardens irrigated with rainwater, plant passages, GR, open-work pavements, water absorbing crates installed below parking lots or rainwater collection tanks.
The main aim of the study is an attempt to optimize the system of BAS in the urban ecosystem by designating areas with the potential for GR on existing buildings. In addition, also on the example of the Gajowice estate in Wrocław: designating zones of high greenery in the city; high buildings and land sealing; zones with GR potential.
The designated optimization action is determined on the basis of, inter alia, legal provisions that define the amount of surface that must be allocated to a BAS. Knowledge about UHI in Wrocław is also used, as well as the quality and type of development in the selected area. The result of the implementation is the identification of problem areas, after using the Biotope Area Factor indicator proposed for Poland. Problem areas in which the installation of GR on existing facilities will be justified, due to the need to increase BAS in places where there is such a potential. The article is divided into a methodological part, which includes the division of the estate into buildings and greenery, point bonitation method, assigning classes to areas; and the result part, describing the summary assessment of the area with quality classes and the correlation of critical points with potential areas.

3. Area and Methodology of the Study
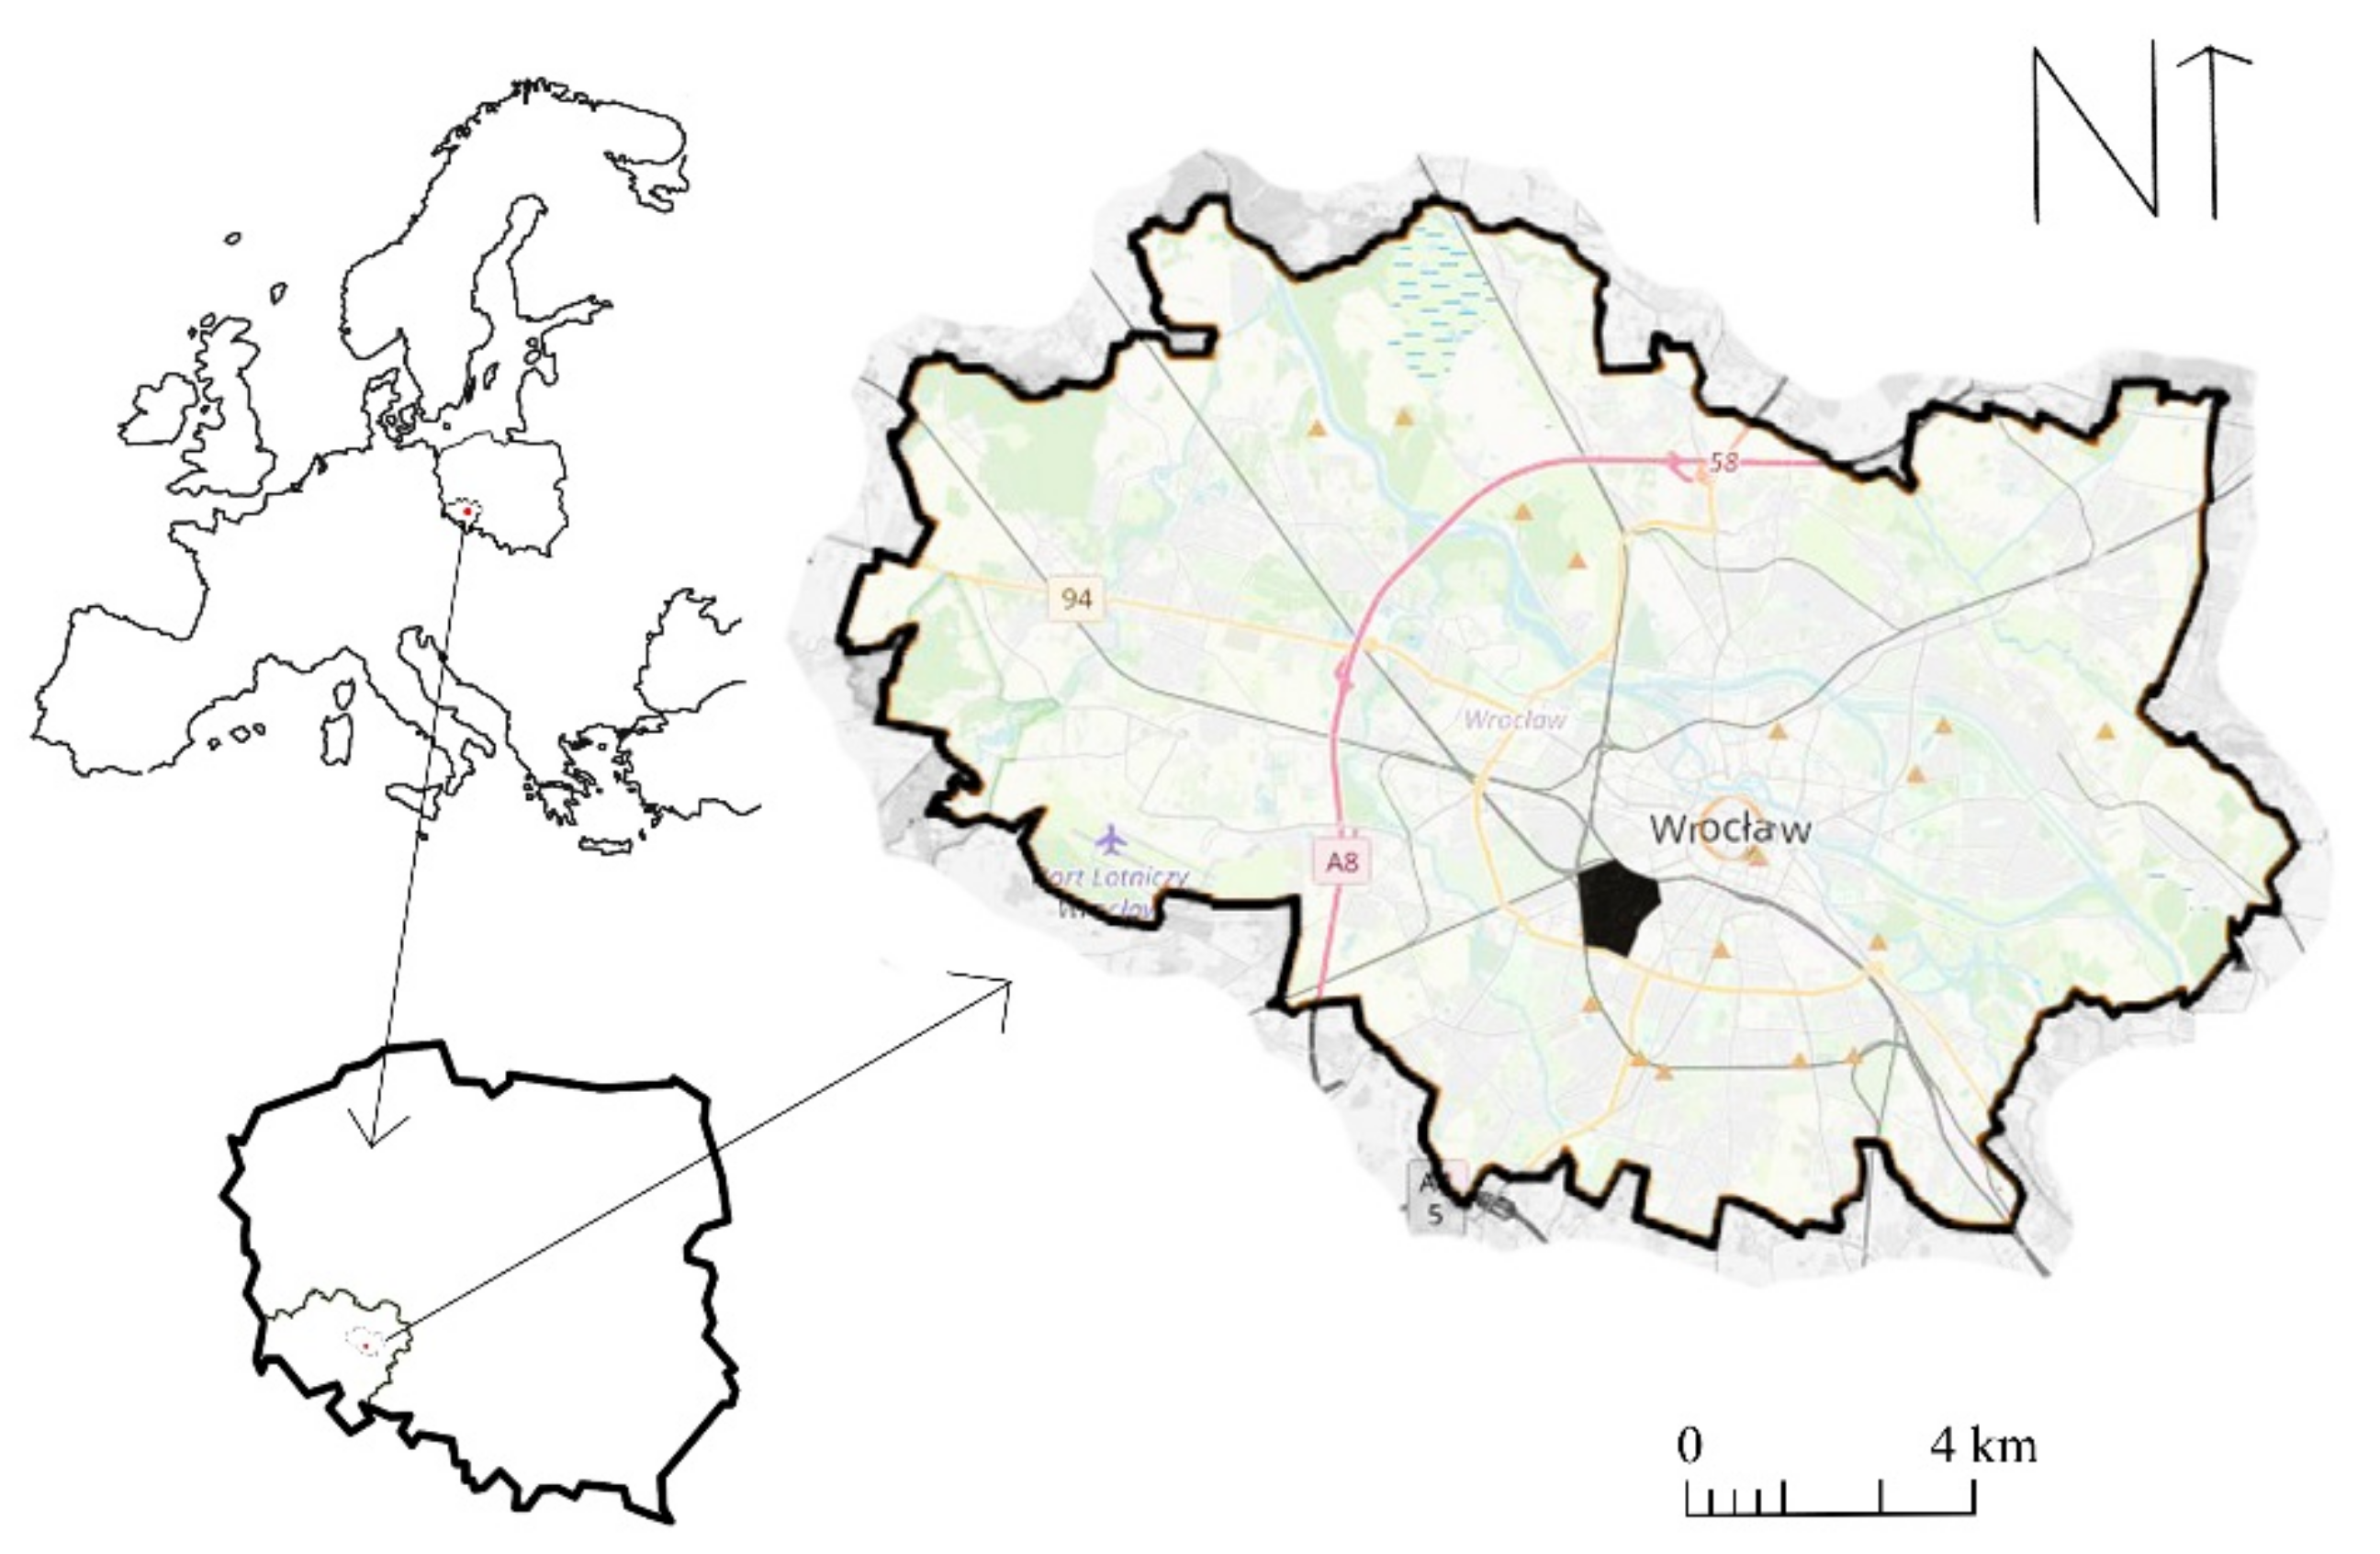
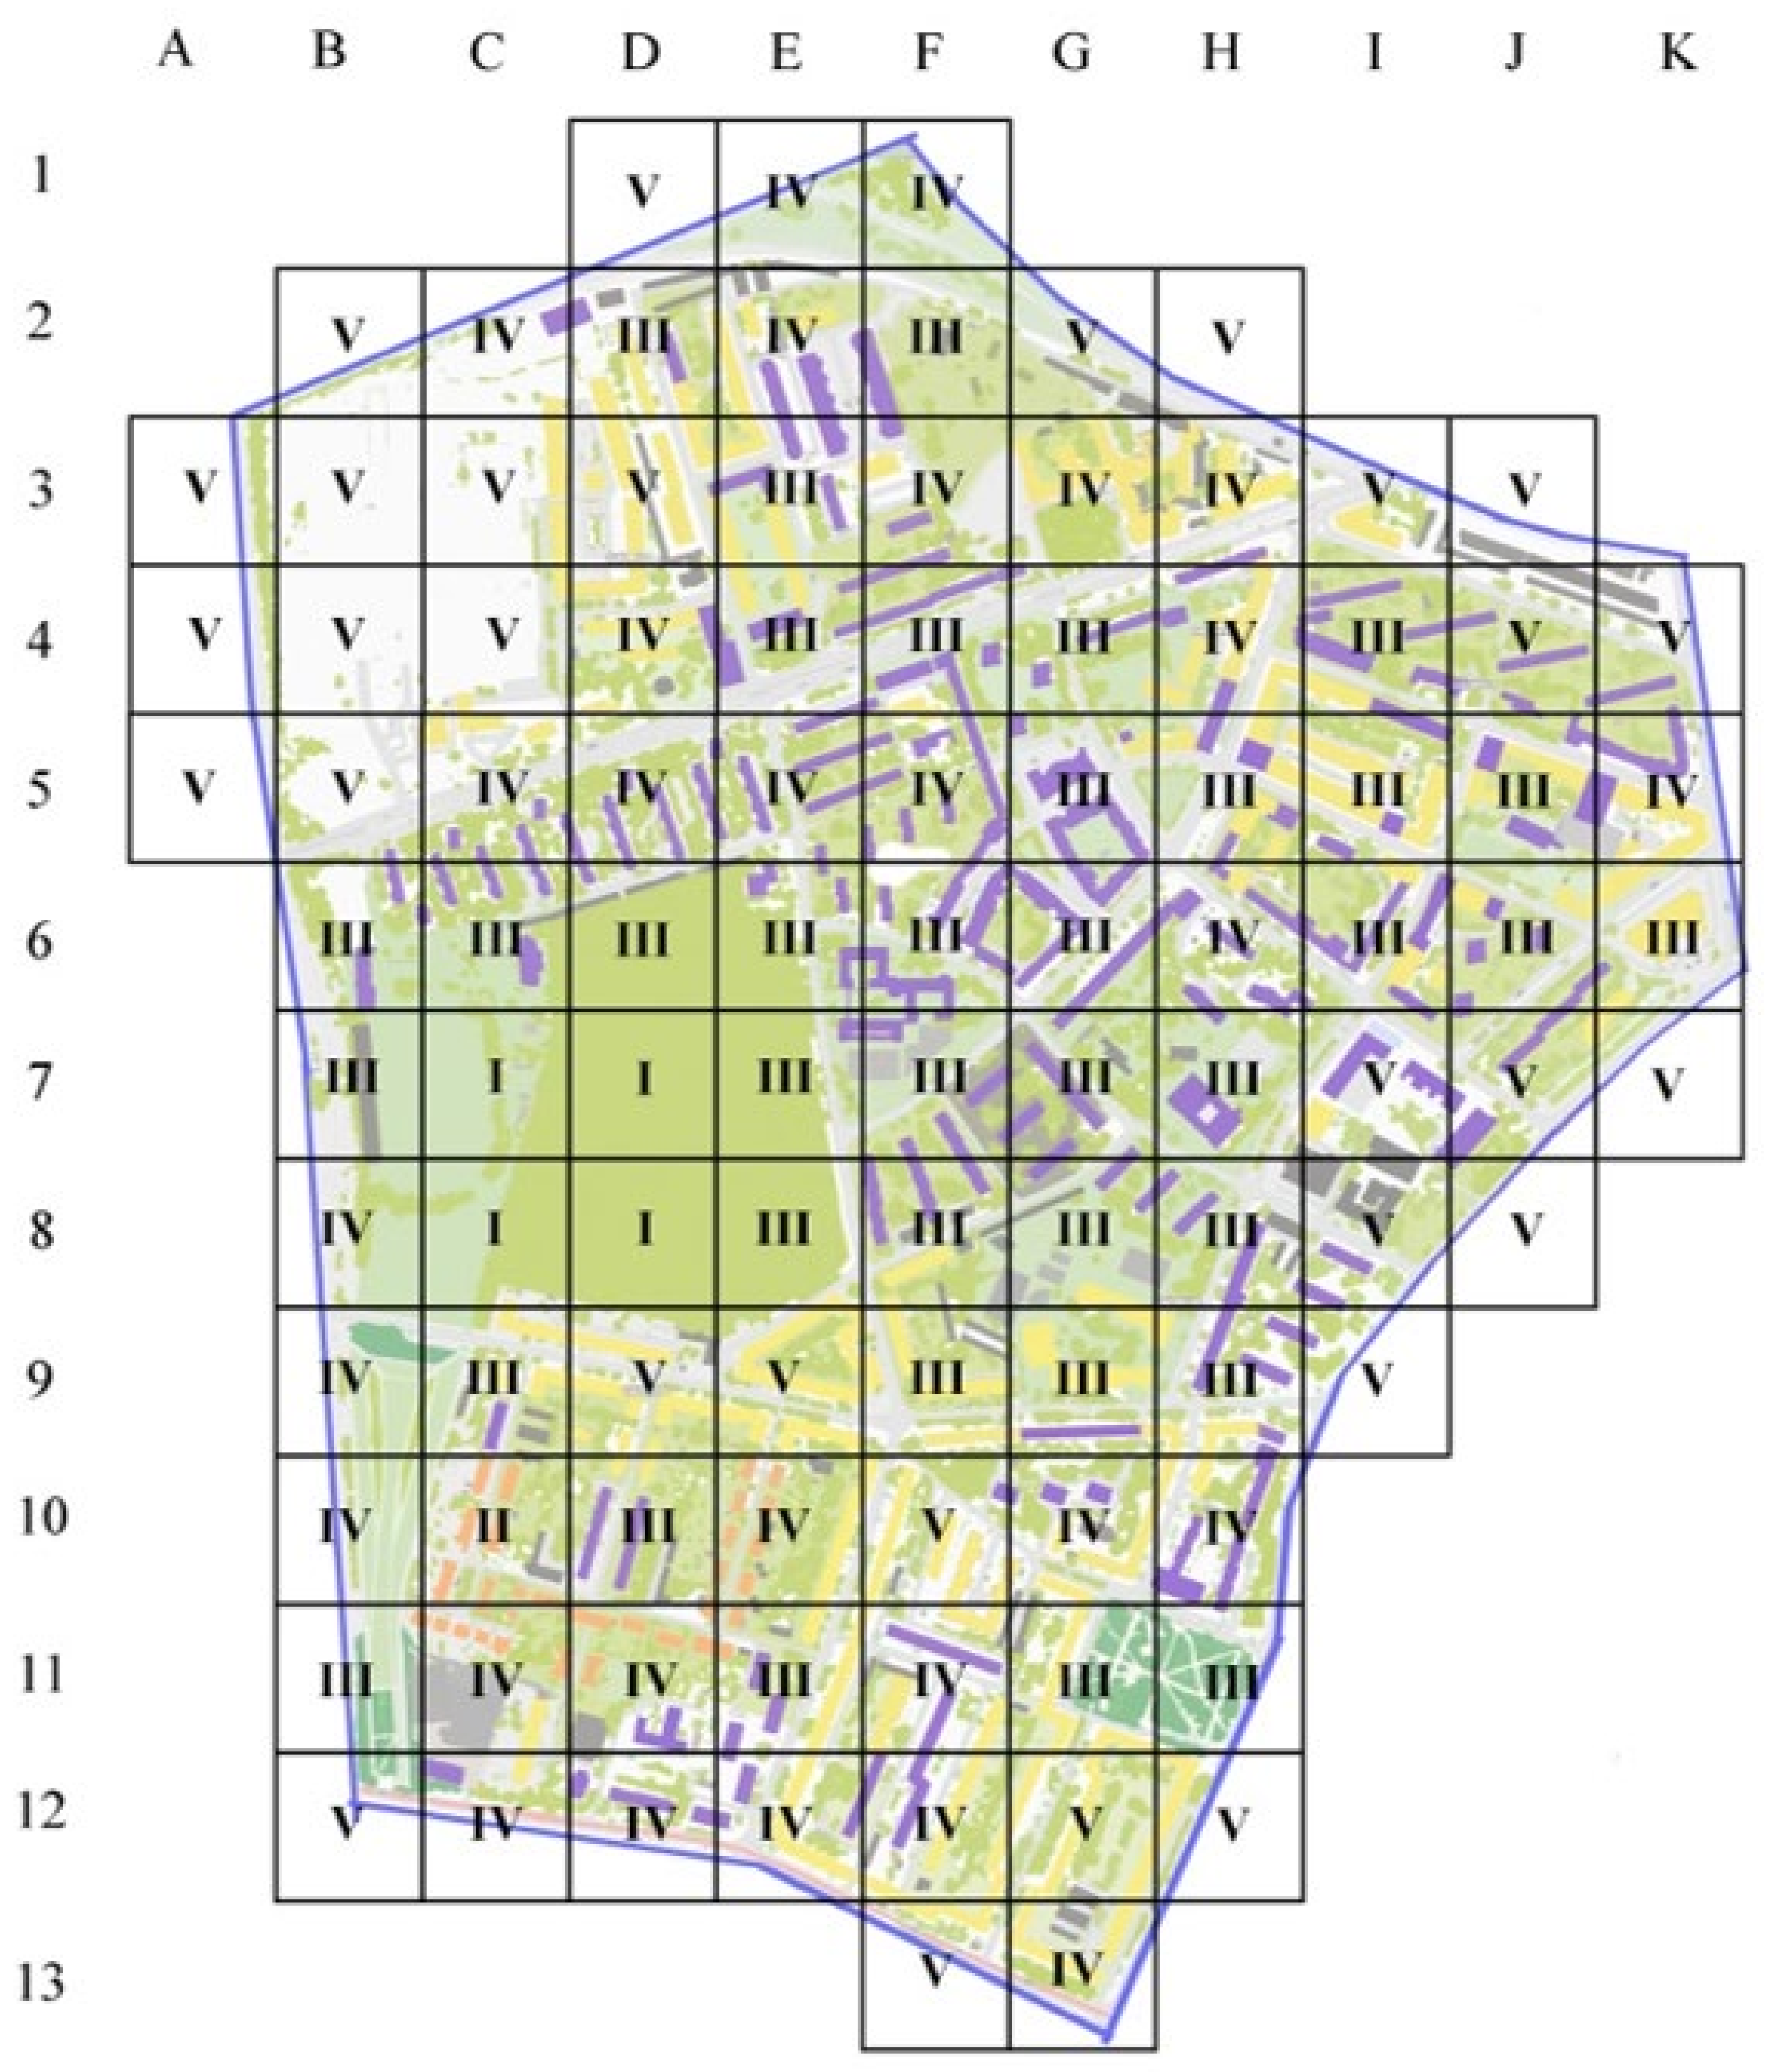
3.1. Research Area

Wrocław (Figure 1) is situated in south-western Poland, in the Silesian Lowland. The Odra River with four main tributaries flows through the city. Wrocław has the fourth largest population in Poland with over 640,000 inhabitants. It also has the fifth largest surface area: 292.82 km2. The city, with the surrounding villages, is considered to be the centre of the growing Wrocław Agglomeration, which, according to estimates, is inhabited by approx. 1.25 million people. About 31.4% of the city area is occupied by developed areas, mainly residential estates, industrial buildings and warehouses. The other part includes urban green areas (36.6%), agricultural areas (28.9%) and water (3.1%) [1].

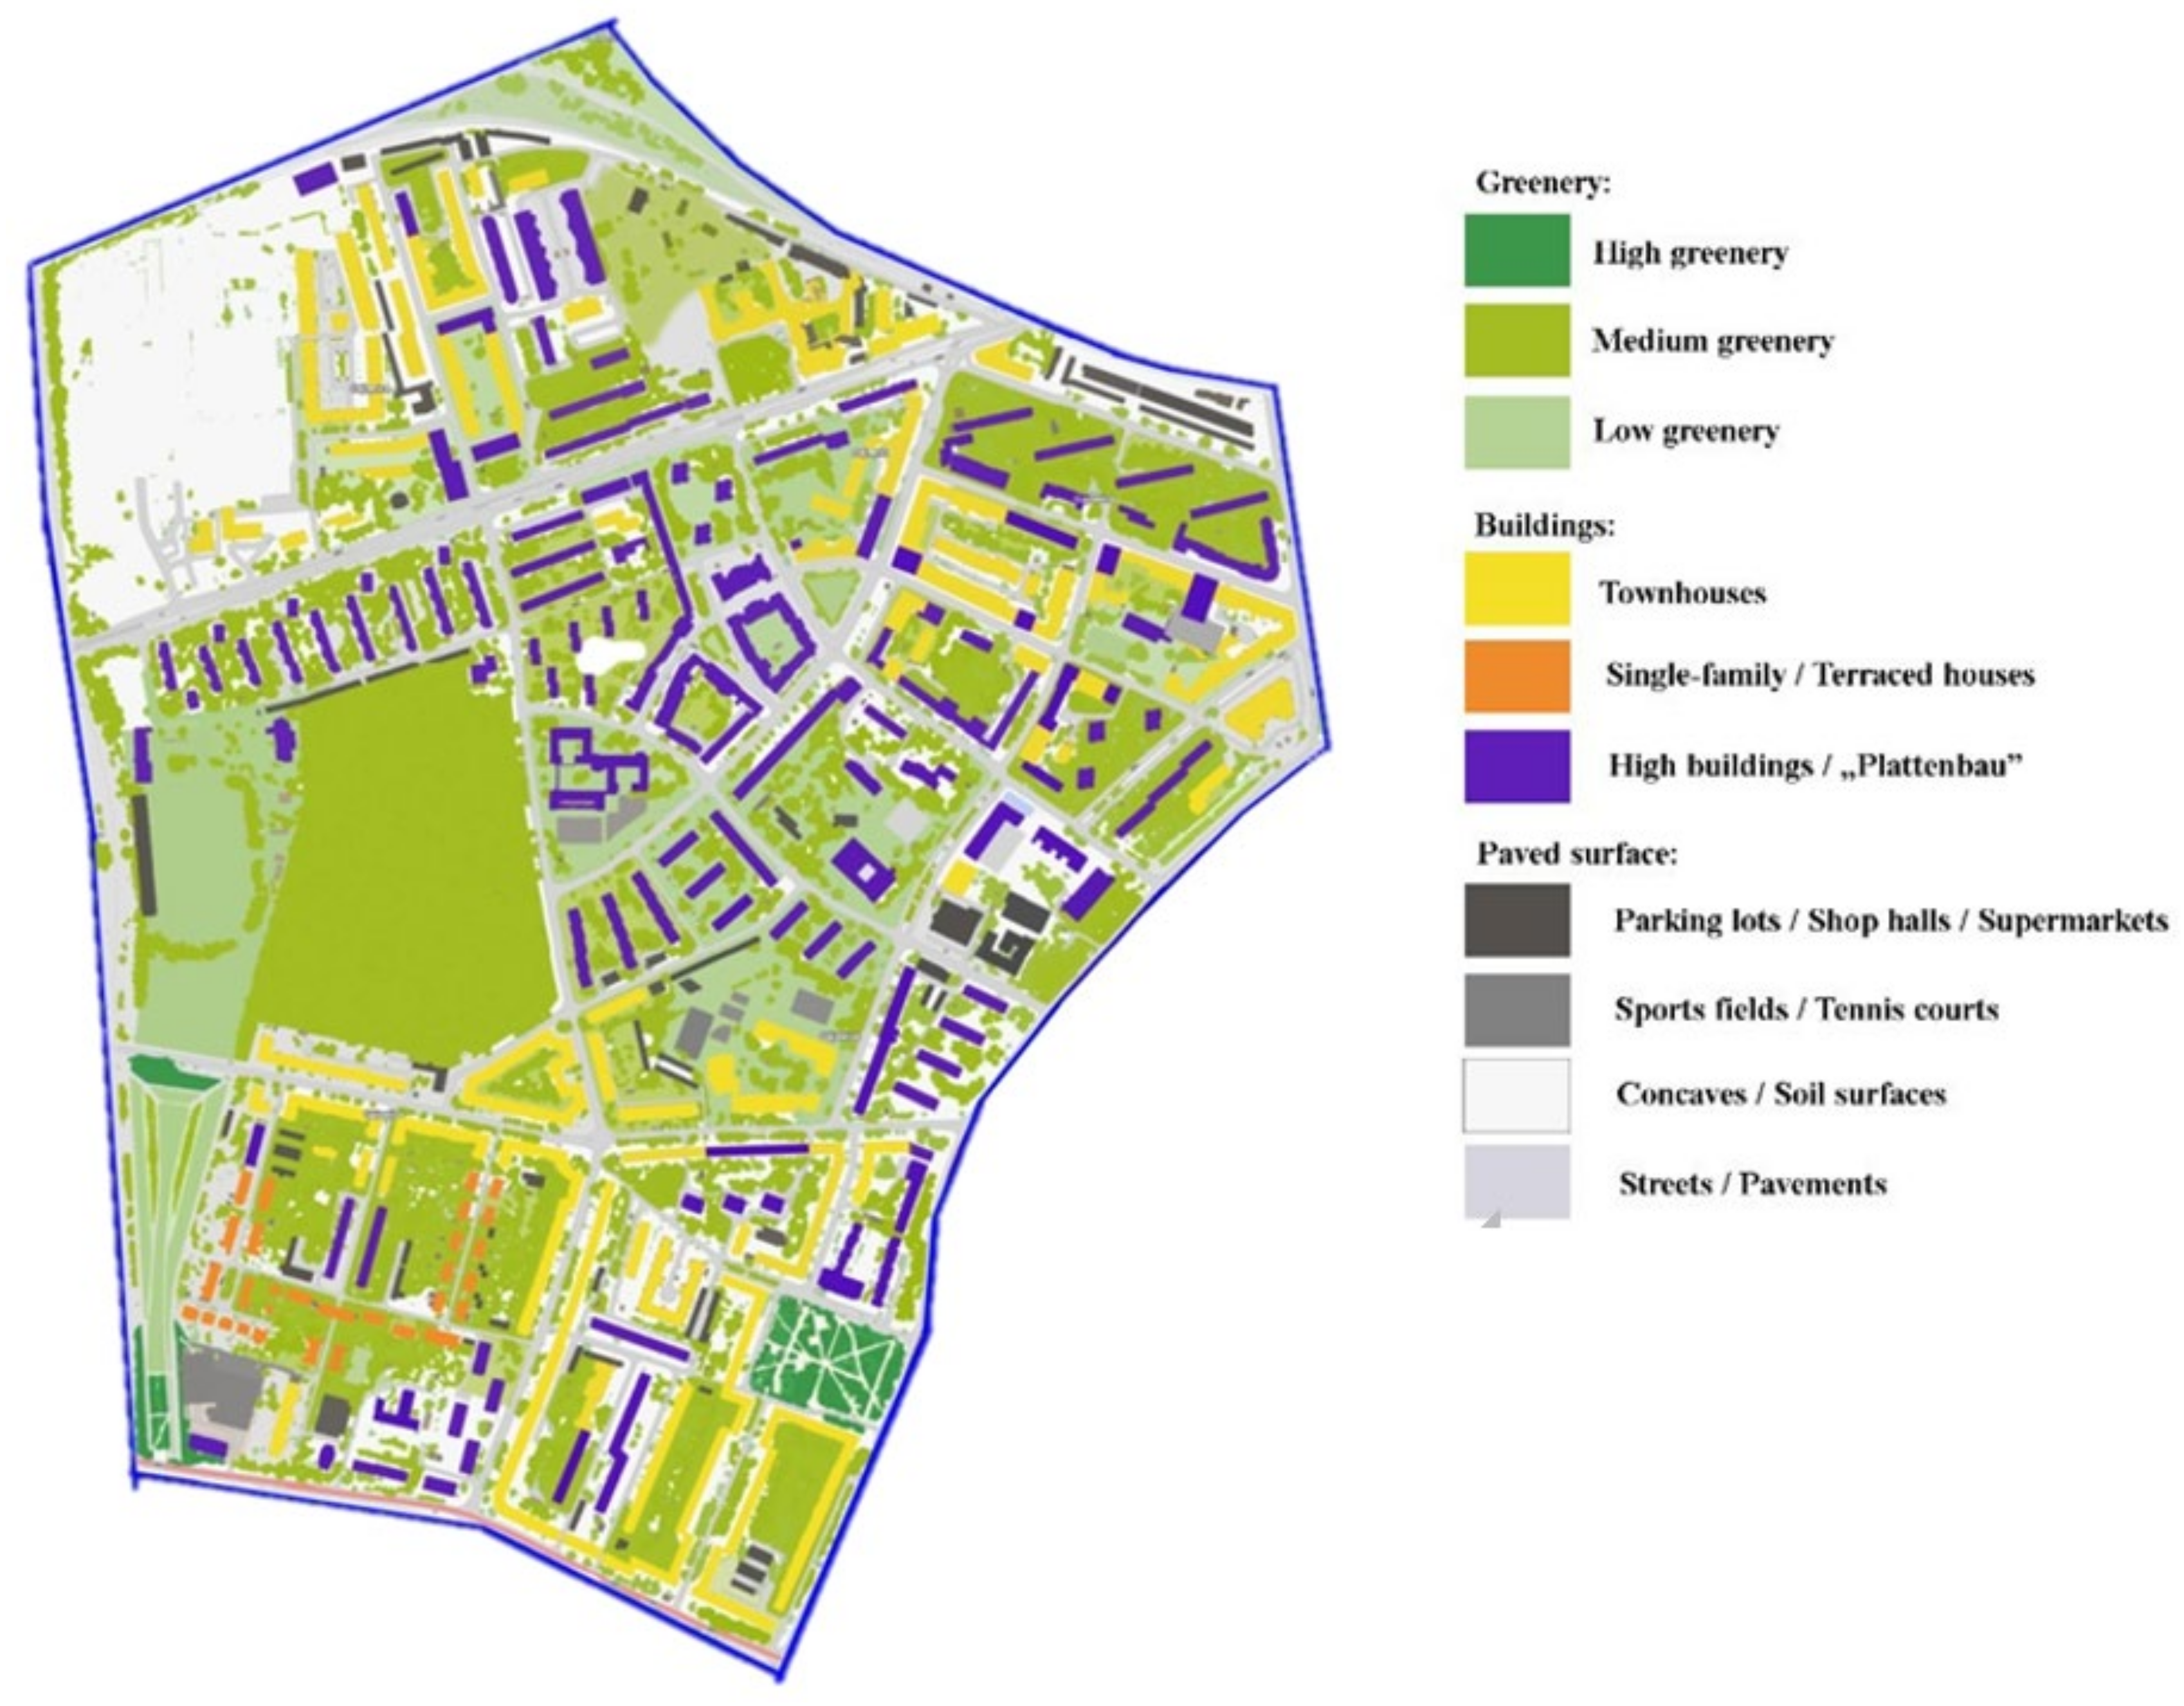
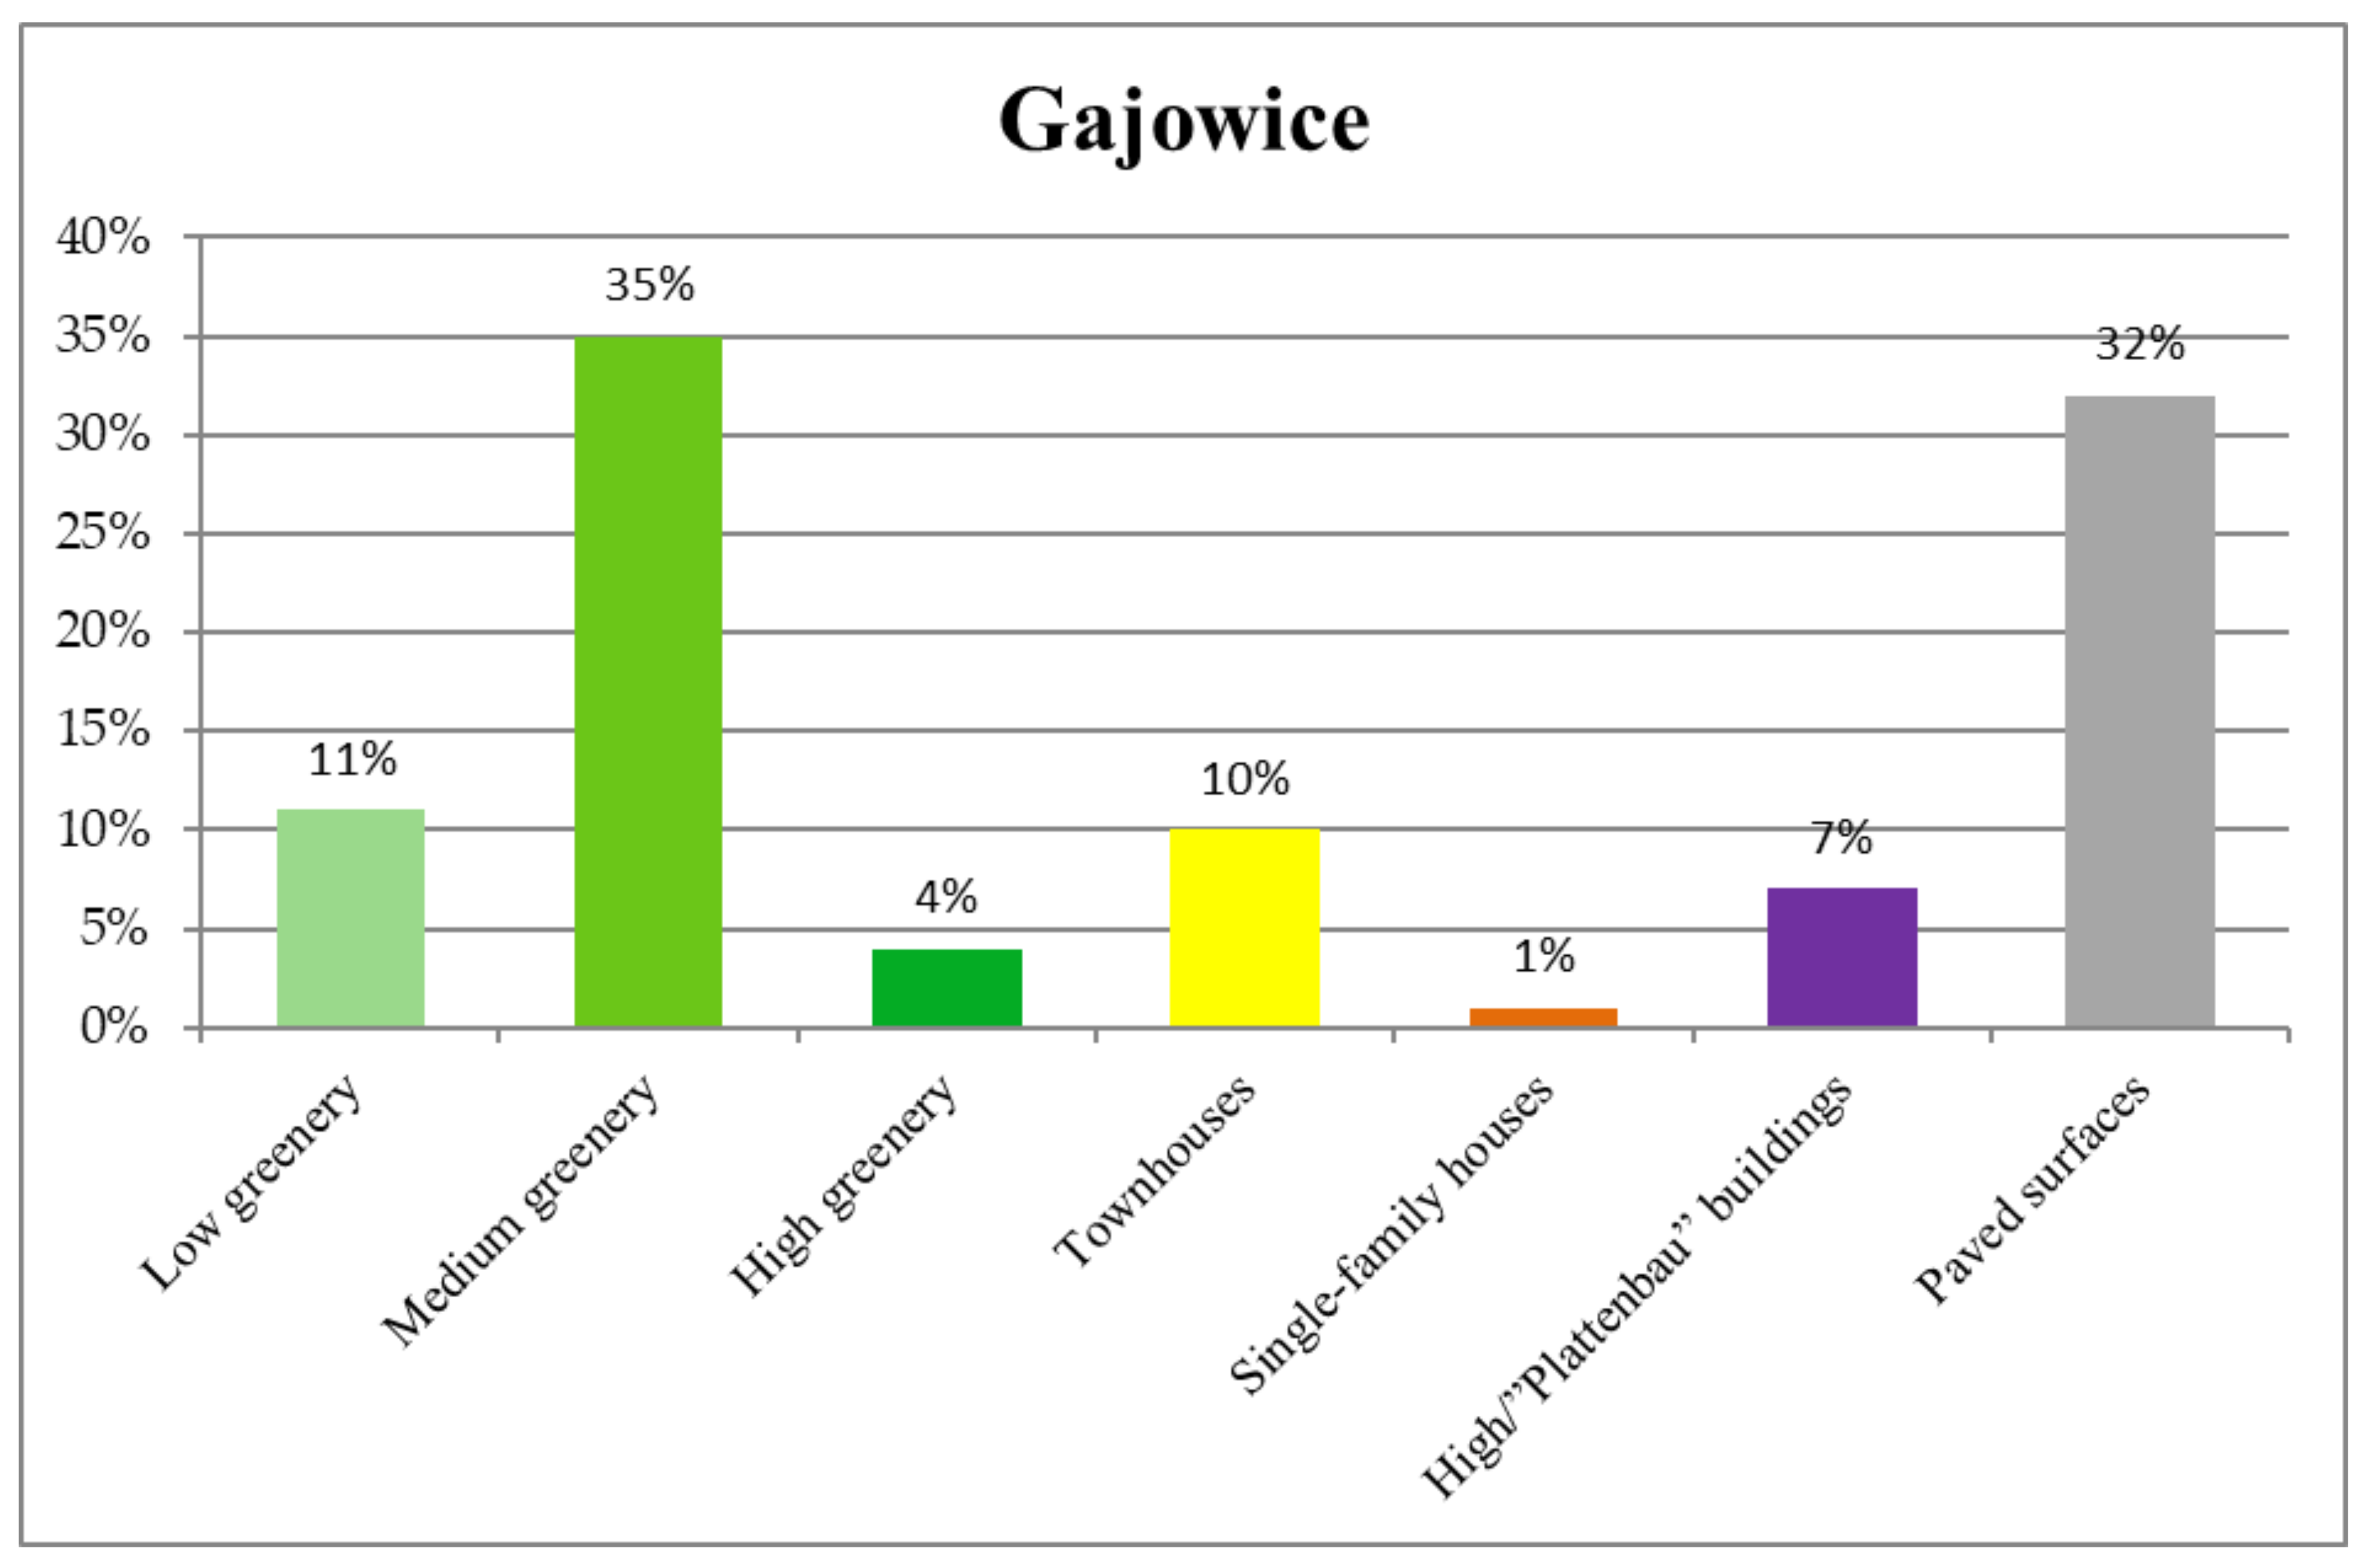
3.2. Gajowice—Analysed Area

The research area is the residential district Gajowice, situated in the southern part of Wrocław (Figure 1). This area (Figure 2) reaches out to the north to the railway line to the Wrocław Główny railway station and Swobodna Street. It is limited by Zaporoska and Gajowicka Streets to the east, Haller Avenue to the south, and by the Cargo Bypass Railroad of Wrocław and the Sports Stadium, allotment gardens, and the Pafawag Hill to the west. Gajowice are a medium-height development zone, up to 18 m, and the city centre increased height zone [52]. The distinctive element of the western part of the area are apartment blocks with free spaces between blocks and quarter interiors. The eastern part is dominated by high buildings with yards. The southern part contains single-family housing with gardens and terraced houses. In the studies developed by the Municipal Office of Wrocław, Gajowice were characterised as a Complete Estate, i.e., such that satisfies the basic needs of inhabitants, has a distinctive character and ensures access to greenery) [53]. In the area of Gajowice there are High greenery (HG) and it constitutes 4% of the area. Medium greenery (MG) occupies about 35% of the area. Low greenery (LG) covers approx. 11%. High-rise, multi-storey and prefabricated “Plattenbau” buildings from the 1970s and 1980s cover 7% of the land area. Single-family and terraced houses constitute approx. 1% of the area, post-war townhouses approx. 10% of the area and paved surfaces cover approximately 32% of the studied area.
The UHI phenomenon in Wrocław has been investigated and described on the basis of research conducted since 1997. Studies on microclimate demonstrated the occurrence of UHI in the analysed area [54,55,56]. According to the results of spatial management modelling and the assessment of exposure of Wrocław urban areas, places that are prone the UHI phenomenon large urban clusters that are not separated by GI or water reservoirs [57]. The analyses have demonstrated that the highest intensity of the UHI is noted in the centre of Wrocław, in areas with high buildings and dense residential estates. This also covers the Gajowice district. Due to the multi-layered structure of the district, where each layer is characterised by different properties, Gajowice experienced the full range of temperatures that occur in the Wrocław UHI (Figure 3). As a result, the highest temperature is noted in the north-eastern part of the district that is situated closer to the city centre, with dense development up to 5 storeys high, and small amounts of greenery between developed areas. On the other hand, the presence of green areas (a cemetery and allotment gardens) to the west of the riverbed of the Old Odra, in the south-western part of the Gajowice district, leads to the emergence of the “cool lake” phenomenon [27,54,55].
The Gajowice district was selected for the analyses presented here, because it is situated in the area that includes the Wrocław UHI, various types of development and land management, such as townhouses, high buildings (so-called Plattenbau) prefabricated apartment blocks, single-family and terraced houses, various examples of GI, and because of its status of a “complete district”.

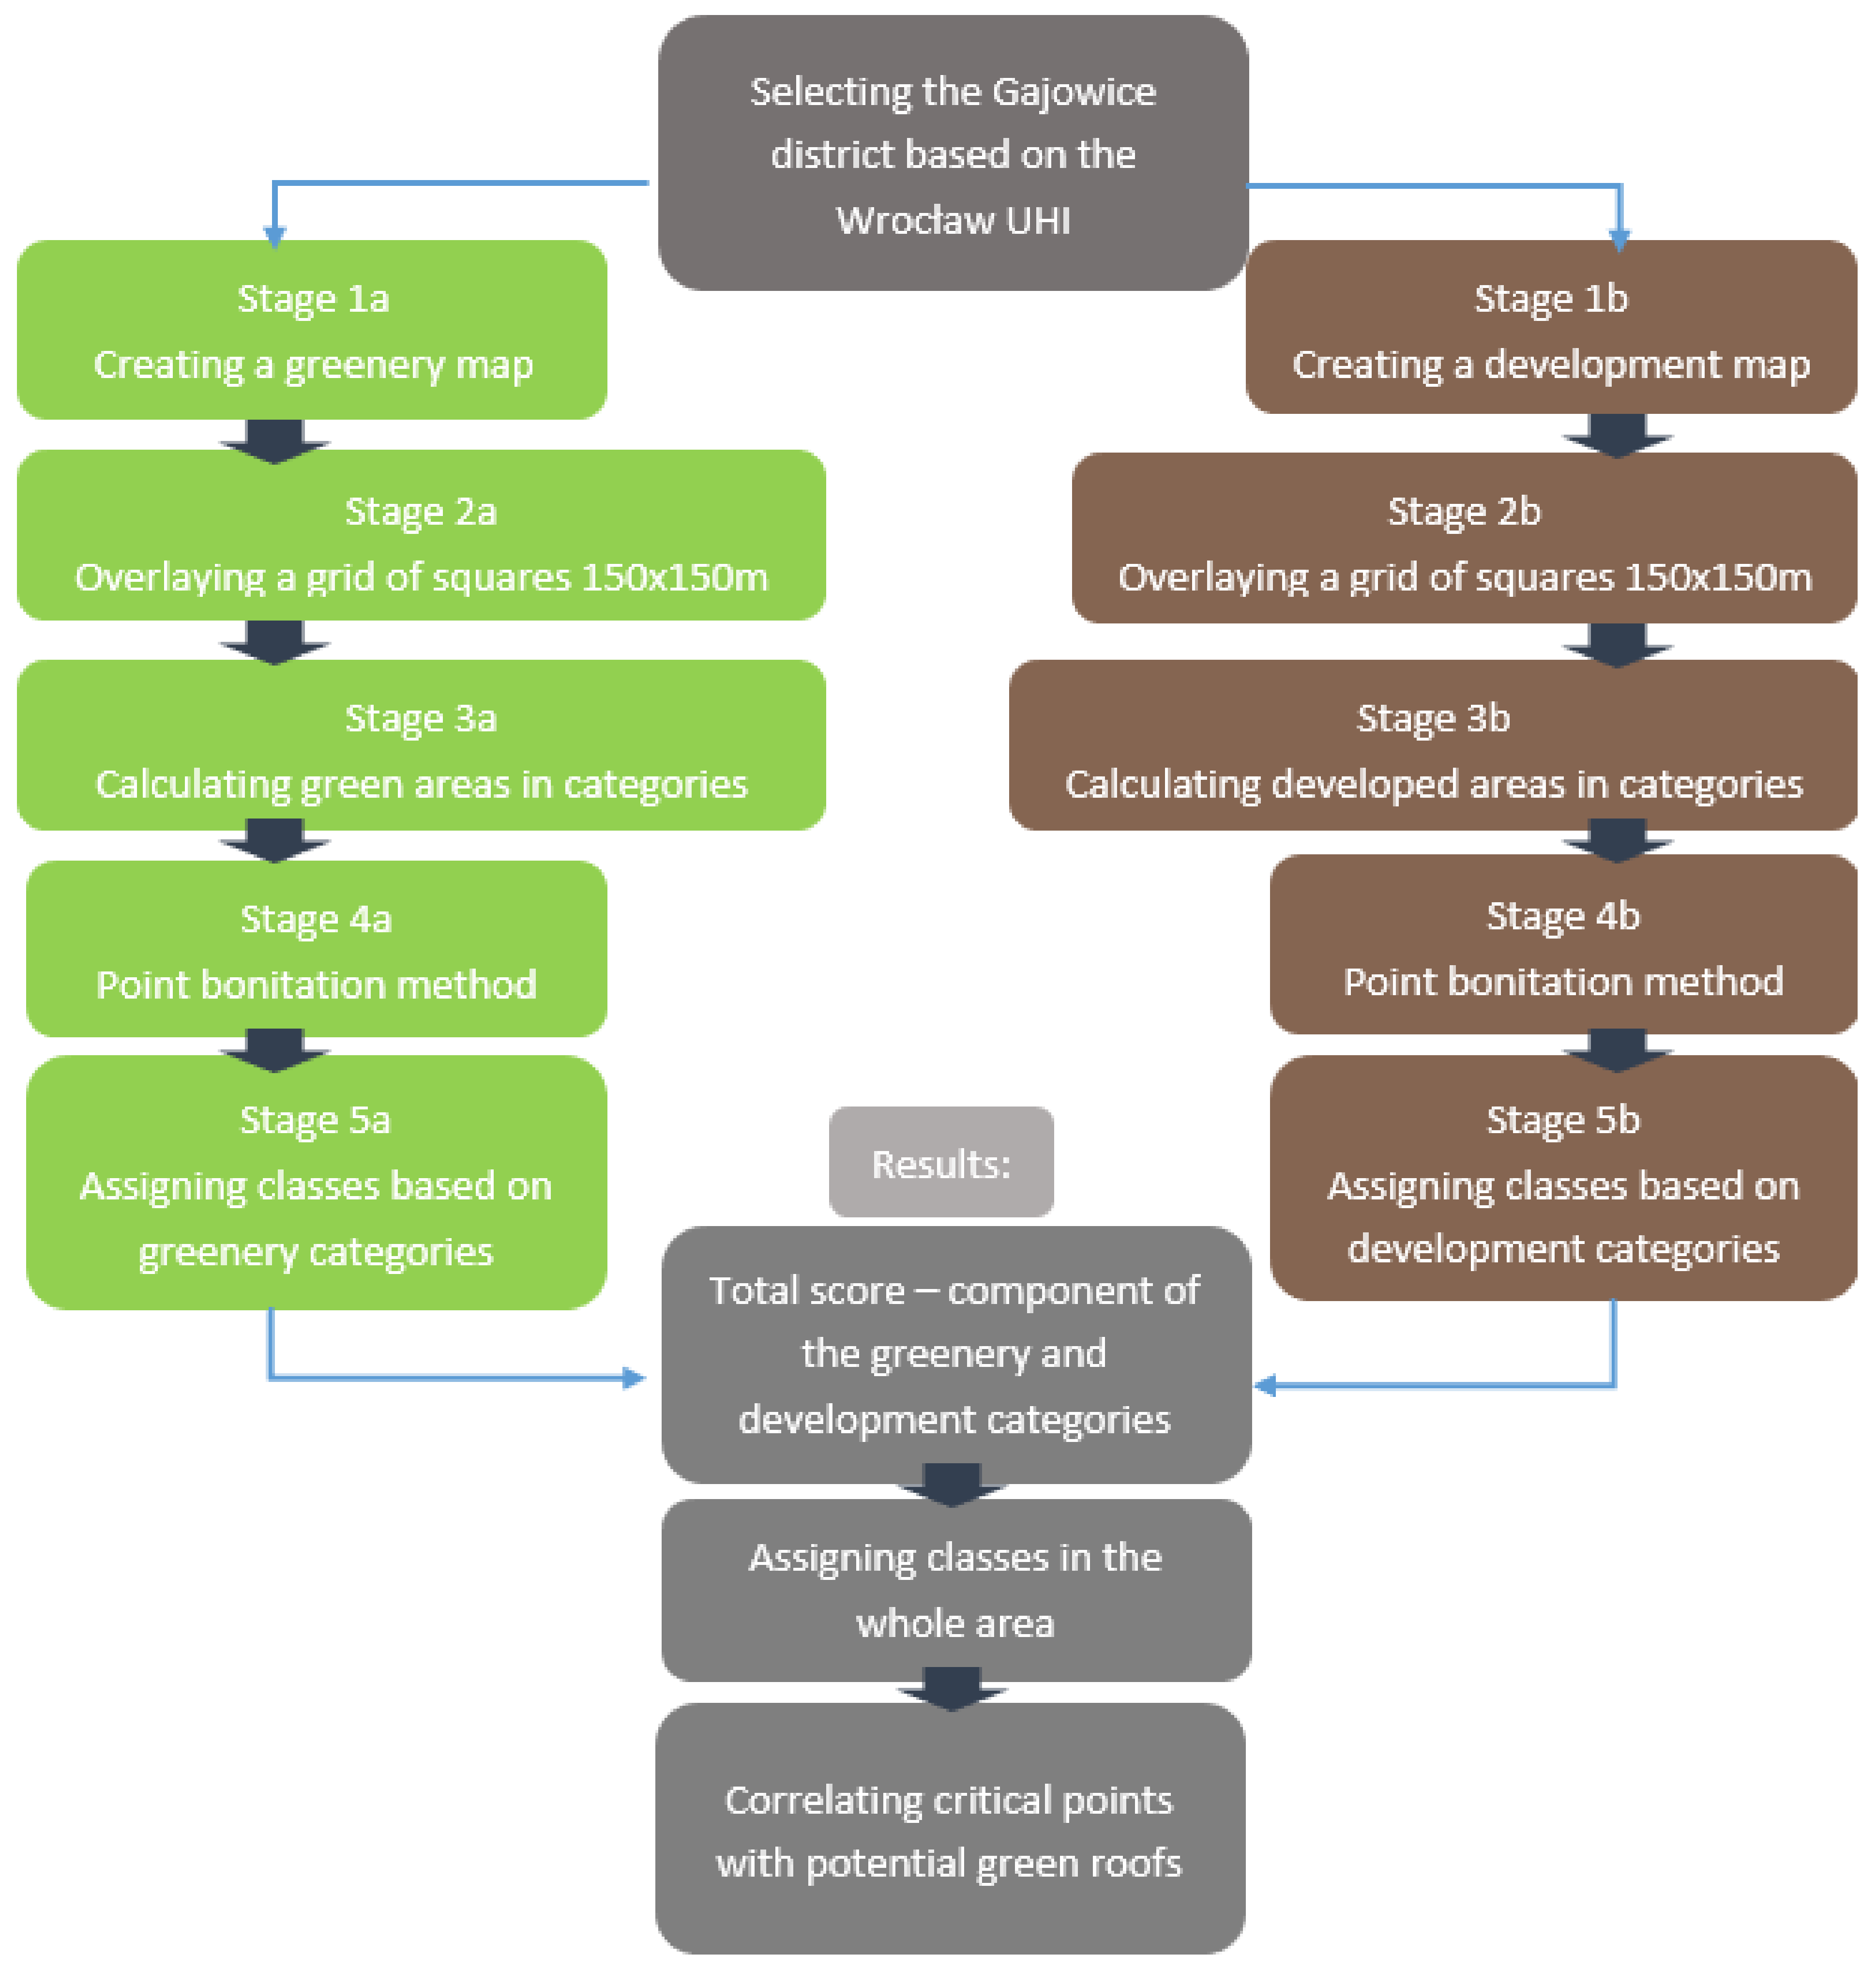
3.3. Research Methodology

The study is based on information and maps obtained from the field inspections by Google Street View (GSV); publicly accessible database of topographic objects (www.geoportal.gov.pl (accessed on 22 September 2021)) updated for 2018; publicly accessible data on the height of buildings, local plans, 2018 study, complete housing estates, nature map, map of the solar potential, publicly accessible orthophotomap 2020 made on the basis of digital images—Spatial Information System of Wrocław (https://geoportal.wroclaw.pl/ (accessed on22 September 2021)); OpenStreetMap (www.openstreetmap.org (accessed on15 July 2021)) and, as visual aid, the orthophotomap from the Google Maps portal; UHI normalized map from 2000 developed by Szymanowski [27,28,54,55]. They were the basis for drawing the research areas with use of ArcGis, Autocad, and Corel Draw software. The maps were then used for analyses and evaluations at further stages of the works.
The sequence of the conducted tests and methodology are presented in the diagram in Figure 4. Maps of greenery and urban development (stage 1a, 1b) were created for the analysed area (Figure 5). The greenery was divided into 3 categories: high, large-surface greenery (parks, forests, and other green areas dominated by tall trees), (Figure 5a); medium greenery—allotment gardens, green areas, squares, and boulevards (which have not been classified as high greenery areas) and educational gardens; and low greenery—fields, meadows, lawns, football fields and sports areas with permeable paving, cemeteries, irrigation fields, and green riverbanks. Development was divided into 4 categories: high buildings (over 5 floors)/prefabricated “Plattenbau” buildings (these buildings were erected in the 1970s and 1980s with use of panels from prefabricated concrete) [58], single family/terraced houses; townhouses; paved surfaces, i.e., parking lots, pavements, streets, sports pitches with artificial lawns, tennis courts, soil areas with hardened surface (Figure 5b). The existing buildings, such as sports halls, warehouses, supermarkets, etc. were considered to be paved surface areas where GR cannot be constructed due to structural reasons.

3.4. Valorisation of Urban Areas
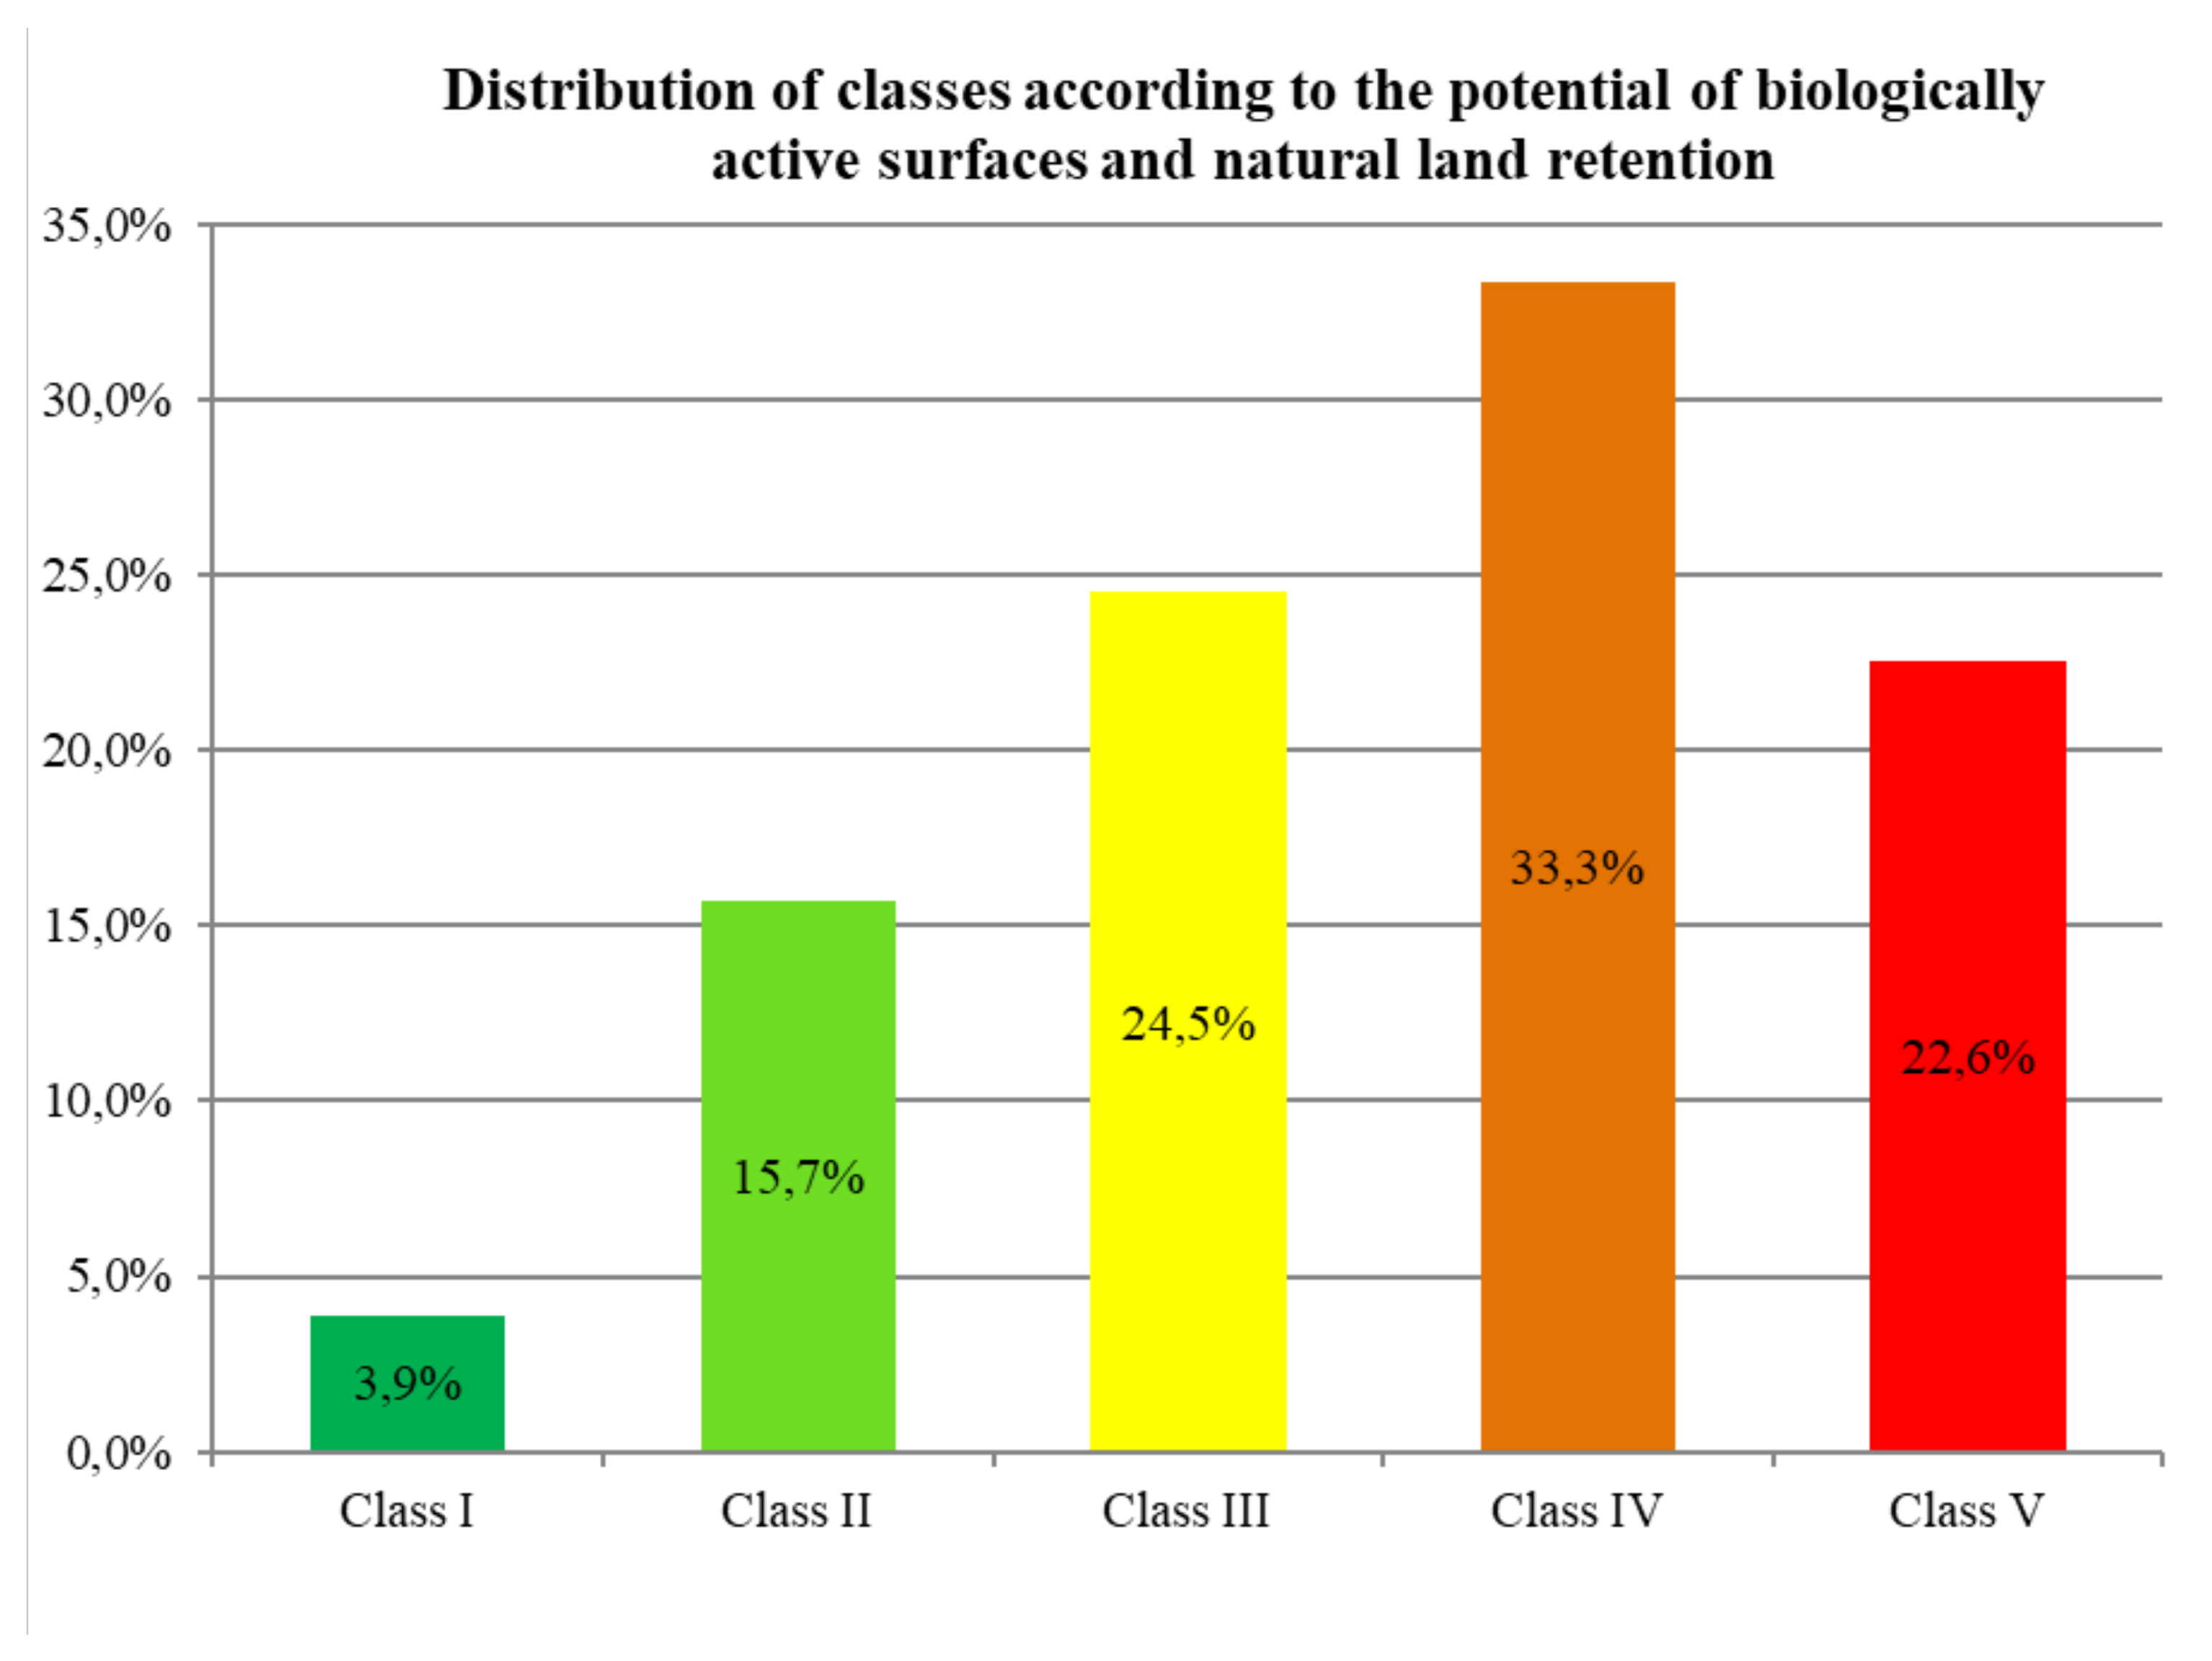
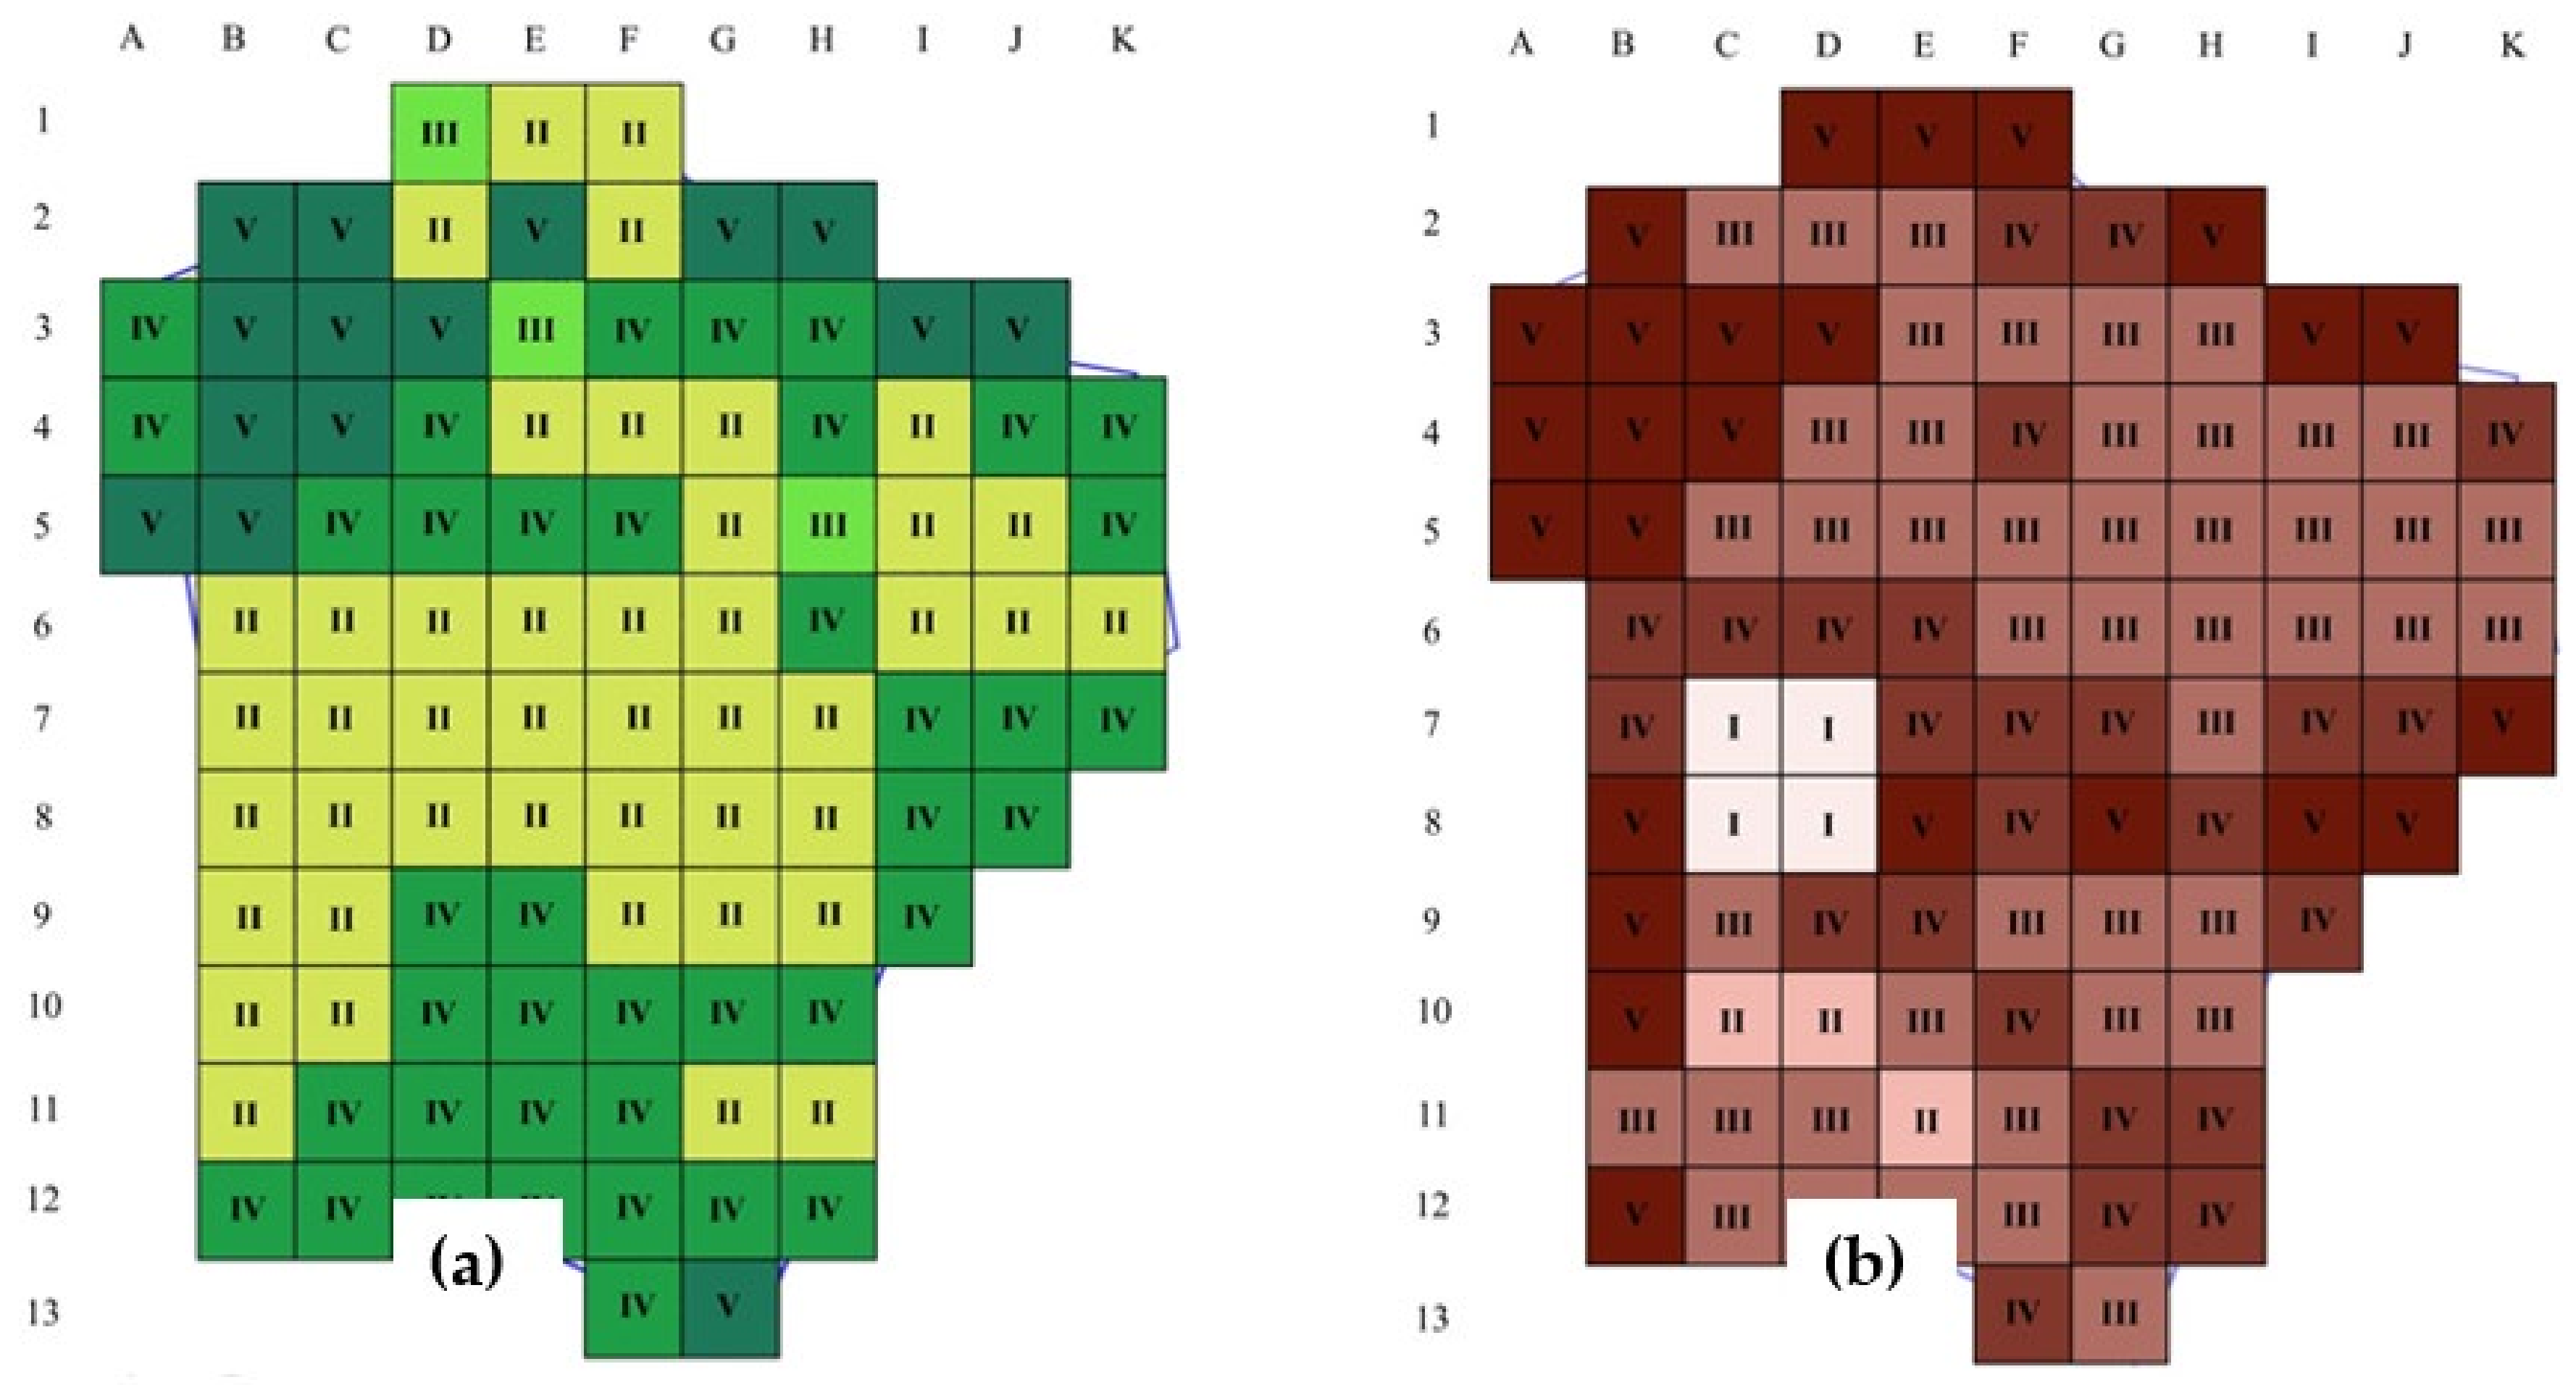
Human beings assign a certain value to every part of space or phenomenon that they see. Valorisation is thus a subjective relationship that occurs between the evaluating subject and the evaluated object [59]. Space valorisation consists in attributing properties to objects and actions, determining their meaning and assigning value, in an attempt to classify the space for various purposes. First, the principles and the selection of properties that characterise the analysed subject are determined. Then, the method of classifying the evaluated values of the environment is chosen. The result of valorisation is a characteristic of the distinctive types and kinds of space. Categories should be determined in a manner that enables grouping, because the properties of the given fragment of space determine its designation and use that meets social needs or limitations that result from the environmental protection regulations [60].
Individual maps with marked types of urban greenery and kinds of development were overlaid with a grid of squares (stage 2a, 2b) used in landscape studies and environmental and life science valorisations [61,62,63,64,65,66] of the dimensions of 150 × 150 m (Figure 6). The size of the squares was selected based on the analyses of street blocks that exist in Polish cities. It is also similar to the square grid that is used in landscape studies [64]. The average surface area of a quarter (block) between streets is approx. 1.1 ha, while the degree of development of quarters and development intensity fluctuate around 80%. Such degree of development results, among others, from war damage [67]. Classifying the urban area as the city centre zone allows us to subject its typological image to a simple division [68]. Based on this division, linear elements are distinguished in the city plan: alley, street, boulevard, and surface elements: yard, piazza, square. The surface area of such squares is usually about 1 ha (100 × 100 m) [69]. On the other hand, it is also assumed that quarters of a side length that exceeds 180 m make it difficult to travel on foot so that neighbouring blocks become isolated areas. For quarters with larger sides, it is recommended to create internal passages [70]. This is why, due to the low degree of development, squares of the surface area of 150 by 150 m were selected. The surface area of each cell is 2.25ha, which is nearly twice as big as the average quarter. The surfaces occupied by objects from each category of greenery and development were calculated for each square constituting a cell (stage 3a, 3b). One 150 × 150 cm square on the map was 100% of the surface, i.e., corresponded to 22,500 m2 in reality. Squares where the surface does not occupy the full area of the cell are calculated on an individual basis. Fields that occupy less than 100% of the overlaying cell are considered to be 100% of the area and calculated proportionally. Then, land valorisation was conducted with use of the point bonitation method (stage 4a, 4b). The point bonitation method consists in: using the information contained in the created maps; selecting factors or properties that influence the valorisation of the analysed area; assigning a score; overlaying a grid of squares onto the map; evaluating of each of the squares being an analysed cell for the given property; at last the presentation of the overall valorisation of the land.
For each category, percentage thresholds were proposed that corresponded to the share of the given land development type in the analysed cell. The thresholds were assigned scores. The thresholds were defined based on the required size of BAS in developed areas (25%), pursuant to the Ordinance on the technical conditions that should be met by buildings and their locations [71] and based on the surface area that requires a water law permit due to the reduction of natural land retention (70%) pursuant to the Water Law [72] and pursuant to the Draft of the Act on investments aimed at counteracting the effects of droughts (50%) [73]. Similar percentage thresholds were proposed in the Impact of GR on microclimate to reduce UHI. For the purposes of the study, the existing urban areas were assigned three percentage thresholds corresponding to the amount of greenery: 25%, 50%, and 75%, and its influence on the environment was calculated [74]. As far as greenery is concerned (Table 2) the highest score was assigned to cells containing areas with high greenery, as the most valuable type. The lowest scores were given to low greenery. If the total value of greenery was lower than 5% 0 points were assigned for each class, if the value exceeded 95% the score was multiplied by 1.5. For values higher than 95% the score was multiplied by 2.0, and for values higher than 95% the score was multiplied by 2.5.
For the valorisation of developed areas, it was assumed that the assigned score decreases with the increase in the developed area. Moreover, in the valorisation of developed areas it was assumed that buildings that offer the possibility to construct GR (according to the criteria adopted for research purposes) require a higher score. Buildings characterised by a potential to construct GR include buildings on so-called “Plattenbau housing estates”, buildings with flat roofs, pent roofs of the maximum inclination of 30%, with a minimum amount of ventilation shafts and chimneys. This was based on the assumption that such roofs were originally calculated to accommodate snow load zones, which means that their structure should be able to bear the load of a GR or that it will only require slight adaptations [58]. The issues of safety and strength of the structure as well as modernization were discussed in research on the establishment of GR on prefabricated buildings. Also roof load capacity analysis of buildings was performed. [75,76,77,78]. For the buildings under study, the analysis was performed based on: the technical data contained in the literature on the structural system [79,80]; technical documentation for a typical building; the snow load standard valid in the period of building erection [81] and the current standard adapted to the European norms [82]. The result of the analysis was the conclusion that on some buildings it was possible extensive GR could be introduced, provided that they are in good technical condition. In other cases, after an assessment of the technical condition for each roof, it is proposed to build strain relief structures in the form of steel beams. Such a solution then would allow for the establishment of heavier GR [56].
According to the adopted criteria, high buildings (“Plattenbau”) blocks (Table 3) show a potential to construct GR. In the methodology used, this increases the value of the land, so they were assigned higher scores. Single-family and terraced houses are characterised by surrounding greenery on the land plots. However, their potential to construct GR is low or even non-existent, so this category of houses was assigned a lower score. Apartment buildings were usually constructed before World War II, so their structure often makes it impossible to construct GR. Besides, they are under the protection of the conservator. The only greenery surrounding these buildings includes green roadside belts and the yard inside the whole quarter, currently occupied only by roofed parking spaces and dumpster enclosures. Paved areas, i.e., parking lots, pavements, streets, sports pitches with artificial lawns, tennis courts, and squares with hardened soil surface were assigned the lowest score. If the total development value exceeded 95%, 0 points were assigned in each class, and for total development value lower than 5% in each group, 5 points were assigned in each class.
In order to illustrate the valorisation with use of the proposed method, a procedure was presented for the area in cell 9C (Table 4, Figure 7). The table contains surfaces in three categories of greenery and four categories of development, both in square meters and percentage share. Then, the scores were assigned for low, medium, and high greenery, as well as scores for high “Plattenbau” buildings, single-family and terraced houses, townhouses, and paved surfaces. Finally, the values in individual categories were added to obtain an overall score for the cell, in the greenery and development categories, separately (Figure 8 and Figure 9). These data were then used to assign a class to the area.
At the subsequent stage, classes were assigned according to the potential of BAS and natural land retention (Table 5). Five classes of potential were determined (Table 6): Class I—high potential—large share of greenery, not requiring intervention, very large green coverage, in particular high greenery; Class II—average potential—large share of greenery, small amounts of paved or sealed surfaces, requires little intervention; Class III—neutral potential—the area of paved or sealed surfaces is equal or lower than that of permeable surfaces, it is recommended to take actions to increase the share of greenery; Class IV—poor potential, paved or sealed surfaces dominate green areas, requires corrective actions to increase the share of greenery; Class V—very poor potential—paved or sealed surfaces significantly dominate over green areas, urgent intervention is required.
The conducted valorisation was the basis for determining so-called critical points (class V), i.e., areas where the BAS are too small in relation to the surrounding elements of development or paved surfaces. Critical points were considered to be the areas that require immediate action to thin out the development and create GI.

4. Results

The Gajowice District (Figure 10) has a surface area of ≈ 1.69 km2 (169.08 ha), including green areas occupying ≈ 0.84 km2 (831.38 ha) and developed area ≈ 0.86 km2 (858.61 ha), where: high greenery ≈ 0.07 km2 (6.9 ha), medium greenery ≈ 0.59 km2 (589.06 ha), low greenery ≈ 0.18 km2 (172.33 ha), townhouses ≈ 0.17 km2 (166.44 ha), single-family and terraced housing ≈ 0.012 km2 (11.78 ha), tall “Plattenbau” buildings ≈ 0.12 km2 (124.31 ha), and paved surfaces ≈ 0.55 km2 (556.08 ha).
The average surface area (Table 7) of high greenery was 362.73 m2, ranging from 0 to 8742.6 m2, which is the lowest average value for greenery; for medium greenery it was 8259.17 m2, ranging from 0 to 18361.72 m2, which is the highest average value for greenery; while for low greenery the average was 2036.16 m2, ranging from 0 to 14,200 m2. As far as development is concerned: The average surface area of high Plattenbau development was 1231.67 m2, ranging from 0 to 4468.64 m2; the value for single-family housing was 101.95 m2, ranging from 0 to 2661.22 m2, which is the lowest value in the development category; for townhouses this was 1317.88 m2, ranging from 0 to 6590.65 m2; and for paved surfaces the value was 5515.39 m2, ranging from 0 to 19,464.67 m2, which was the highest average value in the development category.
The distribution of classes was as follows (Figure 11): out of 102 analysed cells, class V was assigned to 23, class IV: 34 cells, class III: 25 cells, class II: 16 cells, and class I: 4 cells. The conducted analysis demonstrated that the highest scores and, at the same time, classes, were assigned to cells where high greenery occupied the largest surface or those with large areas of medium greenery (Figure 12a). As far as development is concerned (Figure 12b), the score was the higher, the lower the percentage share of paved surfaces or buildings. However, the score was slightly higher if the building showed potential for establishing GR. The highest scores were noted in the vicinity of the allotment gardens, the Pafawag hill, green squares or in areas with large amounts of street or yard greenery. Such places were mostly found in railroad areas, near barracks and paved squares, near parking lots and supermarkets. Areas that belong to class IV, where corrective actions have to be taken quite soon, are mainly those that contain high and “Plattenbau” buildings, and townhouses without a sufficient amount of green areas in their neighbourhood.
The results were then reassessed, Critical points were correlated with areas where the existing development shows a potential for establishing GR. The most potential objects can be found in areas in class IV and in class III. These are places that require urgent intervention. Some of the marked locations are situated in critical areas that need immediate intervention due to insufficient amount of GI. After the proportion coefficient proposed for Poland was applied (the ratio of the total land surface area and the calculated BAS), the assigned scores and classes differed from the initial results (Figure 13a). Significant differences were noted for greenery. However, this did not affect the result of development analysis in itself (Figure 13b), because scores for percentage area were assigned based on the assumption that the score for the given cell would be the higher, the lower the surface area occupied by development. Due to that, this did not change the score after deducting the area with potential for GR.
Figure 14a shows the overall assessment of the site with the assignment of classes and determination of critical points of class V (marked in red). Figure 14b shows potential roofs that meet the criteria adopted in this study and the conditions for the construction of GR, marked on the map. Roofs with installed photovoltaic panels were also marked, because there are certain modern technologies that enable the construction of GR on roofs equipped with photovoltaic panels. Thus, the installation of photovoltaic systems does not deprive these roofs of the potential to construct GR [83]. The final stage of the analysis involved the theoretical introduction of GR on the roofs of high apartment blocks and classifying them as low greenery (i.e., similarly to lawns or extensive greenery). At the same time, the surface of potential locations was reduced by 0.5 and the obtained result was added to the category of low greenery (Figure 14c) and deducted from the surface area of high buildings and prefabricated “Plattenbau” blocks. Then, another valorisation of the analysed cells of the Gajowice estate was performed.
The map of greenery shows significant differences. First of all, numerous cells were moved from class IV to classes III and II or from class III to II thanks to increased amounts of green areas. Seven cells in class V were moved to class IV. Class I remained unchanged: even after adding the value of greenery none of the cells met the conditions included in the criteria for class I. As far as the development category was concerned, no differences were noted after the application of GR in the selected locations, as the score was still insufficient to change the assigned class. The class differences in the category of greenery are presented in the diagram below (Figure 15).
To compare, in the total evaluation of 102 cells: initially, 23 cells were assigned to class V, which now consists of 16 cells. Class IV included 34 cells, now 18, class III: initially 25 cells, now 26, class II: initially 16 cells, now 38, and class I: 4 cells (no changes). This is illustrated in the diagram below (Figure 16) that presents a comparison of the number of cells before and after the application of GR on the suitable roofs that have potential to do so.

5. Discussion

The key to the development of land management and integrating the “grey infrastructure” with GI is creating a system of “green infrastructure” before “grey infrastructure” in the city [84]. Designing GI allows controlling the disorderly urban sprawl [13].
As a result of the conducted analyses, a 150 × 150 m grid was overlain on the map of Gajowice. Points where GR may be constructed were marked, which improved the valorisation assessment of the analysed area. Similar results were obtained in the study conducted in Shenzhen, China. The potential area for the construction of GR was determined, with a surface of 1899.40 ha. In order to present the spatial characteristic of the potential for the construction of GR, the authors divided the city of Shenzhen into a spatial network of ten-hectare fields and calculated the potential for creating GR in each area. Then potential points were defined as key implementation areas. These points were considered to be GR on specific buildings, which were referred to as basic units. The results demonstrated a significant improvement of the valorisation of the city in terms of the potential for the application of GR [66]. In strongly urbanized regions of China, the use of roof spaces and the optimization of roofs for the construction of GR have become very popular [85,86].
In our study, buildings and areas with a potential for the construction of GR were determined, but they were also assigned classes IV and V, which means that they require immediate intervention. These are mainly points located in densely developed areas close to the city centre, which are covered with high, multi-family houses. On the other hand, single-family and terraced houses showed lower potential for the construction of GR and a less urgent need to introduce GI. Similar conclusions were achieved by a group of scientists who conducted research in the area of the city of Braunschweig in Germany. It was calculated that 8596 buildings (8.6% of the total number of structures) were classified as having potential for the application of GR. The central part of the city of Braunschweig is referred to as the Hot-Spot of GR potential. This means that it offers a higher percentage of benefits in comparison to single-family and suburban houses. The author of that study proposed a method of improving the valorisation of the city for the purposes of determining priority areas for the installation of GR in urban areas [87]. Apart from that, several studies provide a quantitative determination of the way in which a GR positively influences thermal climate, air quality, rainwater retention, and biodiversity if applied on a city scale [88,89].
The authors note that GR in the analysed area will influence its valorisation assessment and their location within the UHI may limit its intensity and thus its disadvantageous effects on humans. The study conducted by Umberto Berardi in the outdoor microclimate benefits and energy saving resulting from GR retrofits confirmed that, due to the large number of buildings in the Ryerson University campus in Toronto, GI should be introduced. The installation of GR will reduce energy consumption, greenhouse gas emission, and operational costs. Ultimately, the implementation of GR for a larger number of buildings on the campus would have a significant influence on the city microclimate and ensure a real possibility to reduce the influence of UHI in the campus area [90]. In addition, another aspect that reduces the adverse effects on humans and climate is that GR are influenced by the amount of water they are able to retain to evapotranspiration and thus reduce the UHI and it will influence its valorisation assessment. Based on research conducted by many groups of scientists, including from France or Poland (in Warsaw and Wrocław) it can be seen that GR are one of the measures to mitigate problems with excessive surface runoff in urbanized areas. The quality of the subsoil, the drainage layer and the vegetation used affect the quality of the runoff. In Wrocław, as in many Polish cities, snowmelt and heavy rainfall contributes to the development of local flooding in urban areas [48]. Therefore, it is even more important to pay attention to the creation of the GR potential on the very dense building grid of the Gajowice housing estate. GR serve a number of functions in highly urbanized areas, such as climate change mitigation, e.g., UHI, air quality improvement and reducing noise levels [49]. GR are valuable solutions for rain management improvements in urban areas as they manage the quantity and quality of the runoff and they can partly store and delay rainfall water [50,51].
As for the changes in temperature and UHI in the light of GI and GR, the study on Impact of GR on microclimate to reduce UHI led to the conclusion that if 25% new greenery is added to existing areas, the amount of heat will decrease by 6%. Moreover, if 50% greenery is added, the amount of heat in the environment will fall by 10%, and the addition of 75% greenery may reduce the heat even by 20%. The study suggests that combining 50% of paved surfaces with 50% GI and GR may reduce local heat by 25%. The proportion of 50% paved surfaces to 50% GI may result in an average decrease in heat by 30% during daytime [74]. Similar parameters were adopted to determine the scores in each category of development and greenery in the Gajowice District. When the development occupies less than 25% of the area, the score is higher. The score decreases proportionally when the share of developed areas increases to 50%, and cells where paved surfaces occupy over 70% of the area receive the lowest score. Greenery is evaluated on a reverse scale: 25% gives the lowest score, while 70% and more—the highest.

6. Summary and Conclusions

The analysis of Gajowice revealed areas that require immediate intervention. Assigning classes to areas allowed us to estimate the scale of the need to implement GI. The conditions that building structures have to meet in order to enable the installation of GR were defined. This allowed us to select and mark potentially suitable buildings whose roof structure makes it possible to construct at least extensive GR. Further research on the analytical model may ultimately support the selection of areas for new investments, based on the assumption that GR will be installed in adequate proportions. It may also become a template for local authorities to set the directions of optimization of the system of BAS in the urban ecosystem, for example as an element that helps modern cities to adapt to climate changes.
Actions aimed at improving the valorisation value of land have a decidedly positive influence on the amount of BAS and reducing the occurrence of UHI. Installing GR improved the natural value and increased the amount of BAS. The introduction of GR also had a positive influence on valorisation;the number of developed areas decreased, giving way to green areas. The determination of critical points enabled taking action. The introduction of GR increased the valorisation score even by two classes. Even if the reduction coefficient 0.5 was applied (i.e., the value was reduced by 50%), the results still remained satisfactory.
However, both before the coefficient was applied and the potential roofs were qualified as BAS, and after these actions, the problem of the lack of BAS in the dense network of buildings was still visible. If GI was installed on the selected buildings, where the construction of GR is justified due to the need to increase BAS in areas that have the potential, the situation would be improved, yet still not perfect. Due to that, in locations where it is impossible to install GR, other forms of GI should be applied, e.g., by unsealing paved surfaces, constructing parking lots with permeable surface, or underground parking lots with GR, by additionally applying living walls, green acoustic screens, green ventilation shafts, etc.
The results of the research allowed to define the character of the landscape in a given area and its evaluation, in the future they will be used to determine the directions of spatial development of Wrocław. They will be the basis for local urban policy and space planning in modern cities. The result of the research will be a universal model, showing the potential change in the city’s climate after introducing green roofs on as many housing estates as possible.

Author Contributions

Conceptualization, K.P. and B.J.; methodology, K.P. and B.J.; software, K.P.; validation, K.P.; formal analysis, K.P.; investigation, K.P.; resources, K.P.; data curation, K.P.; writing—original draft preparation, K.P.; writing—review and editing, B.J. and K.P.; visualization, K.P.; supervision, B.J.; project administration, K.P.; funding acquisition, K.P. All authors have read and agreed to the published version of the manuscript.

Funding

B010/0015/21—Maintenance and Development of the Research Potential of Departments and Institutes.

Institutional Review Board Statement

Not applicable.

Informed Consent Statement

Not applicable.

Data Availability Statement

Not applicable.

Conflicts of Interest

The authors declare no conflict of interest.

References

  1. Hesslerová, P.; Pokorný, J.; Huryna, H.; Seják, J.; Jirka, V. The impacts of greenery on urban climate and the options for use of thermal data in urban areas. Prog. Plan. 2021, 100545, in press. [Google Scholar] [CrossRef]
  2. Mell, I.C. Green Infrstructure: Concepts and Planning. FORUM-E-Journal. 2008. Available online: https://www.researchgate.net/publication/228664177_Green_Infrstructure_concepts_and_planning (accessed on 18 August 2021).
  3. Dumenu, W.; Obeng, E.A. Climate change and rural communities in Ghana: Social vulnerability, impacts, adaptations and policy implications. Environ. Sci. Policy 2016, 55, 208–217. [Google Scholar] [CrossRef]
  4. Gentle, P.; Maraseni, T.N. Climate change, poverty and livelihoods: Adaptation practices by rural mountain communities in Nepal. Environ. Sci. Policy 2012, 21, 24–34. [Google Scholar] [CrossRef]
  5. Reckien, D.; Creutzig, F.; Fernandez, B.; Lwasa, S.; Tovar-Restrepo, M.; McEvoy, D.; Satterthwaite, D. Climate change, equity and the Sustainable Development Goals: An urban perspective. Environ. Urban. 2017, 29, 159–182. [Google Scholar] [CrossRef]
  6. Schroter, D.; Zebisch, M.; Grothmann, T. Climate Change in Germany Vulnerability and Adaptation of Climate-Sensitive Sectors. Klimastatusbericht des DWD. 2005, pp. 44–56. Available online: https://research.fit.edu/media/site-specific/researchfitedu/coast-climate-adaptation-library/europe/germany-amp-poland/Schroter-et-al.-2005.-german-adaptation-of-climate-sensative-sectors.pdf (accessed on 20 October 2021).
  7. Tol, R.S.J. The Economic Impacts of Climate Change. Rev. Environ. Econ. Policy 2018, 12, 4–25. [Google Scholar] [CrossRef] [Green Version]
  8. Deely, J.; Hynes, S.; Barquín, J.; Burgess, D.; Finney, G.; Silió, A.; Álvarez-Martínez, J.M.; Bailly, D.; Ballé-Béganton, J. Barrier identification framework for the implementation of blue and green infrastructures. Land Use Policy 2020, 99, 105108. [Google Scholar] [CrossRef]
  9. Dubicki, A.; Dubicka, M.; Szymanowski, M.; Wrocławia, K. Środowisko Wrocławia–Informator (The Climate of Wrocław. The Environment of Wrocław–Guidebook); Dolnośląska Fundacja Ekorozwoju: Wrocław, Poland, 2002; pp. 9–25. Available online: https://www.researchgate.net/publication/312854324_Klimat_Wroclawia (accessed on 25 July 2021).
  10. Akbari, H.; Rose, L.S. Urban Surfaces and Heat Island Mitigation Potentials. J. Human-Environ. Syst. 2008, 11, 85–101. [Google Scholar] [CrossRef] [Green Version]
  11. Landsberg, H.E. The Urban Climate; Academic Press: Cambridge, MA, USA, 1981; p. 285. Available online: https://www.sciencedirect.com/bookseries/international-geophysics/vol/28/suppl/C (accessed on 7 May 2021).
  12. Żyromski, A.; Biniak-Pieróg, M.; Burszta-Adamiak, E.; Zamiar, Z. Evaluation of Relationship between Air Pollutant Concentration and Meteorological Elements in Winter Months. J. Water Land Dev. 2014, 22, 25–32. [Google Scholar] [CrossRef] [Green Version]
  13. Xu, X.; González, J.E.; Shen, S.; Miao, S.; Dou, J. Impacts of urbanization and air pollution on building energy demands—Beijing case study. Appl. Energy 2018, 225, 98–109. [Google Scholar] [CrossRef]
  14. Wang, R.; Eckelman, M.J.; Zimmerman, J. Consequential Environmental and Economic Life Cycle Assessment of Green and Gray Stormwater Infrastructures for Combined Sewer Systems. Environ. Sci. Technol. 2013, 47, 11189–11198. [Google Scholar] [CrossRef] [PubMed]
  15. Arnberger, A.; Allex, B.; Eder, R. Urban Heat Impacts on the Elderly in Vienna: Stakeholder Views and Oping Behaviors of Elderly Residents. Int. Assoc. Urban. Clim. Newsl. 2013, 48, 12. Available online: https://urban-climate.org/newsletters/IAUC048.pdf (accessed on 7 May 2021).
  16. Gawuć, L. Dobowa Zmienność Powierzchniowej Miejskiej Wyspy Ciepła Wybra Nych Miast w Polsce Podczas fali upałów w Sierpniu 2013 na Podstawie Danych Satelitarnych (Diurnal Variability of Surface Urban Heat Island during a Heat Wave in Selected Cities in Poland in August 2013 by Means of Satellite Imagery). Prace Naukowe Politechniki Warszawskiej. Inżynieria Środowiska. 2014, pp. 19–34. Available online: https://www.researchgate.net/publication/290433718_Dobowa_zmiennosc_Powierzchniowej_Miejskiej_Wyspy_Ciepla_wybranych_miast_w_Polsce_podczas_fali_upalow_w_sierpniu_2013_na_podstawie_danych_satelitarnych (accessed on 7 May 2021).
  17. United Nations Development Programme. Sustainable Urbanization Strategy UN DP’s Support. to Sustainable, Inclusive and Resilient Cities in the Developing World; United Nations: New York, NY, USA, 2016; Available online: https://www.undp.org/publications/sustainable-urbanization-strategy (accessed on 7 May 2021).
  18. Francis, L.F.M.; Jensen, M.B. Benefits of green roofs: A systematic review of the evidence for three ecosystem services. Urban For. Urban Green. 2017, 28, 167–176. [Google Scholar] [CrossRef]
  19. Oberndorfer, E.; Lundholm, J.; Bass, B.; Coffman, R.R.; Doshi, H.; Dunnett, N.; Gaffin, S.; Köhler, M.; Liu, K.K.Y.; Rowe, B. Green Roofs as Urban Ecosystems: Ecological Structures, Functions, and Services. BioScience 2007, 57, 823–833. [Google Scholar] [CrossRef]
  20. Hopkins, G.; Goodwin, C. Living Architecture. Green Roof and Walls. International Green Roof Association, 2006, Global Networking for Green Roofs, Green Roof News; CSIRO Publishing: Clayton, Australia, 2011. [Google Scholar]
  21. Pawłowska, K. Chinese Cities Extensive and Semi-Intensive Green Roofs, Green Roofs and Walls as a Solutions Supporting Urban Green Infrastructure, Zielone Dachy IrośLinne ściany Jako Rozwiązania Wspomagające Zieloną Infrastrukturę miast, Monografianaukowa Uniwersytetu Przyrodniczego we Wrocławiu, 2020, p. 59. Available online: https://doi.org/10.30825/1.17.2020 (accessed on 12 September 2021).
  22. European Commission. Building a Green Infrastructure for Europe; Publications Office of the European Union: Luxembourg, 2013; Available online: https://doi.org/10.2779/54125 (accessed on 18 August 2021).
  23. Schneider, P.; Gottschalk, N.; Löser, R.; Scharbrodt, T. Integrated Climate Protection Program for the City of Chemnitz—Climate Diagnosis, Climate Change Prognosis and Conception of Adaptation Measures in the Urban Area. In Resilient Cities: Cities and Adaptation to Climate Change—Proceedings of the Global Forum 2010; Local Sustainability; Springer: Bonn, Germany, 2011; Volume 1, pp. 299–310. Available online: https://scholar.google.com/scholar_lookup?title=Integrated+Climate+Protection+Program+for+the+City+of+Chemnitz%E2%80%94Climate+Diagnosis,+Climate+Change+Prognosis+and+Conception+of+Adaptation+Measures+in+the+Urban+Area&author=Schneider,+P.&author=Gottschalk,+N.&author=L%C3%B6ser,+R.&author=Scharbrodt,+T.&publication_year=2011&pages=299%E2%80%93310 (accessed on 18 August 2021).
  24. Ambrey, C.; Byrne, J.; Matthews, T.; Davison, A.; Portanger, C.; Lo, A. Cultivating climate justice: Green infrastructure and suburban disadvantage in Australia. Appl. Geogr. 2017, 89, 52–60. [Google Scholar] [CrossRef] [Green Version]
  25. Kłysik, K.; Fortuniak, K. Temporal and Spatial Characteristics of the Urban Heat island of Łódź, Poland. Atmos. Environ. 1999, 33, 3885–3895. Available online: https://scholar.google.com/citations?view_op=view_citation&hl=en&user=MBwgzTsAAAAJ&citation_for_view=MBwgzTsAAAAJ:eMMeJKvmdy0C (accessed on 12 September 2021). [CrossRef]
  26. Dubicka, M. Wpływ Cyrkulacji Atmosferyna Kształtowanie Warunków Klimatu (na Przykładzie Wrocławia) (The Influence of the Circulation of the Atmosphere on the Shaping of Climate Conditions (Based on the Example of Wrocław)); St. Geogr. LX: Wrocław, Poland, 1994; p. 296. [Google Scholar]
  27. Dubicka, M.; Szymanowski, M. Struktura miejskiej wispy ciepła I jej związek z warunkami pogodowymii urbanistycznymi Wrocławia (The structure of the urban heat island and its relation to the weather and urban conditions of Wrocław). Acta Univ. Wratislav. 2000, 22, 99–118. [Google Scholar]
  28. Dubicka, M.; Szymanowski, M. Modyfikowanie Klimatu Lokalnego Przez Obszary Zurbanizowane (Modifying the Local Climate by Urbanized Areas). In Kształtowanie Przestrzeni Zurbanizowanej w Myśl Zasad Ekorozwoju; Polski Klub Ekologiczny: Wrocław, Poland, 2001; pp. 41–53. [Google Scholar]
  29. The Gran Canaria Declaration, Las Palmas 2000, The Gran Canaria Declaration Calling for a Global Program for Plant Conservation. Available online: https://www.researchgate.net/publication/340332856_The_Gran_Canaria_Declaration_calling_for_a_Global_Program_for_Plant_Conservation (accessed on 18 August 2021).
  30. Plant Conservation Report 2020: A review of progress towards the Global Strategy for Plant Conservation 2011–2020, CBD Technical Series No.95. 2020. Available online: https://www.cbd.int/doc/publications/cbd-ts-95-en-lr.pdf (accessed on 18 August 2021).
  31. Drapella-Hermansdorfer, A.; Dyraga, A.; Pancewicz, A.; Rostański, K.; Szulczewska, B.; Zachariasz, A. Zielona Infrastruktura Miasta (Green City Infrastructure), Monografia; Wydawnictwo Politechniki Śląskiej: Gliwice, Poland, 2014; Available online: http://polsl.expertus.com.pl/expertusbin/expertus.cgi?KAT=%2Fvar%2Fwww%2Fbibgl%2Fexpertusdata%2Fpar%2F&FST=data.fst&FDT=data01.fdt&ekran=ISO&lnkmsk=2&cond=AND&mask=2&F_00=02&V_00=Zachariasz+A+ (accessed on 18 August 2021).
  32. Rozporządzenie Ministra Infrastruktury z dnia 12 Kwietnia 2002 r. w Sprawie Warunków Technicznych, Jakim Powinny Odpowiadać Budynki i Ich usytuowanie (z późn. Zm.) (Regulation of the Minister of Infrastructure of April 12, 2002 on Technical Conditions to be Met by Buildings and their Location). Available online: https://isap.sejm.gov.pl/isap.nsf/DocDetails.xsp?id=WDU20020750690 (accessed on 18 August 2021).
  33. Tan, Y.; Xu, H.; Zhang, X. Sustainable urbanization in China: A comprehensive literature review. Cities 2016, 55, 82–93. [Google Scholar] [CrossRef]
  34. Stacherzak, A.; Hełdak, M.; Raszka, B. Planning documents and sustainable development of a commune in Poland. WIT Trans. Ecol. Environ. 2012, 162, 23–34. [Google Scholar] [CrossRef] [Green Version]
  35. Lu, X.-H.; Ke, S.-G. Evaluating the effectiveness of sustainable urban land use in China from the perspective of sustainable urbanization. Habitat Int. 2018, 77, 90–98. [Google Scholar] [CrossRef]
  36. Berlin Biotope Area of Factor-Implementation Guidelines Helping to Control Temperature and Runoff Climate Adapt. Available online: https://climate-adapt.eea.europa.eu/metadata/case-studies/berlinbiotope-area-factor-2013implementation-of-guidelines-helping-to-control-temperatureandrunoff/#challenges_anchor (accessed on 5 November 2020).
  37. Szulczewska, B.; Giedych, R. Ekologiczno-Przestrzenne Wskaźniki Stosowane w Planowaniui Projektowaniu Terenów Osiedli Mieszkaniowych (Ecological and Spatial Indicators Used in Planning and Designing Areas of Housing Estates). In Zieleń Osiedlowa Stan Obecnyi Wskazania Poprawy; Kosmala, M., Ed.; Polskie Zrzeszenie Inżynierówi Techników Sanitarnych Oddział Toruń: Toruń, Poland, 2010; pp. 46–59. Available online: https://www.google.com/url?sa=t&rct=j&q=&esrc=s&source=web&cd=&ved=2ahUKEwjeta60wLP0AhXFwosKHUmAC7oQFnoECAQQAQ&url=http%3A%2F%2Fkak.sggw.pl%2Fimages%2Fstories%2FPublikacje%2FOsiedla%2520mieszkaniowe%2520w%2520strukturze%2520przyrodniczej%2520miasta.pdf&usg=AOvVaw2RuLLehzNYRlBVEaj8j3JD (accessed on 5 November 2020).
  38. Kazmierczak, A.; Carter, J.; Adaptation to climate change using green and blue infrastructure. A Database of Case Studies. Berlin: The Biotope Area Factor Climate Change Impacts Addressed. 2010. Available online: https://orca.cardiff.ac.uk/64906/1/Database_Final_no_hyperlinks.pdf (accessed on 18 August 2021).
  39. Peroni, F.; Pristeri, G.; Codato, D.; Pappalardo, S.E.; De Marchi, M. Biotope Area Factor: An Ecological Urban Index to Geovisualize Soil Sealing in Padua, Italy. Sustainability 2019, 12, 150. [Google Scholar] [CrossRef] [Green Version]
  40. Kruuse, A. The Green Space Factor and the Green Points System. Available online: https://nextcity.nl/wp-content/uploads/2017/01/1701256-Malmoe-Tools-c-Annika-Kruuse.pdf (accessed on 5 June 2021).
  41. Hirst, J. Functional Landscapes: Assessing Elements of Seattle Green Factor. Berg. Partnersh. PS 2008. Available online: https://www.scribd.com/document/180251845/Functional-Landscapes-Assessing-Elements-of-Seattle-Green-Factor (accessed on 21 September 2021).
  42. Rostański, K.M. Natura Modelowania. Elementy Naturalistyczne w Kompozycji Urbanistycznej (The Nature of Modeling. Naturalistic Elements in an Urban Composition). Wydawnictwo Politechniki Śląskiej, Gliwice 2012. Available online: https://www.researchgate.net/publication/260298027_Natura_modelowana_Elementy_naturalistyczne_w_kompozycji_urbanistycznej (accessed on 19 August 2021).
  43. Mioduszewski, W. Small (natural) water retention in rural areas/Mała (naturalna) retencja wodna na obszarach wiejskich. J. Water Land Dev. 2014, 20, 19–29. [Google Scholar] [CrossRef] [Green Version]
  44. Mioduszewski, W.; Querner, E.P.; Kowalewski, Z. The analysis of the impact of small retention on water resources in the catchment/Analiza oddziaływania małej retencji na zasoby wodne zlewni. J. Water Land Dev. 2014, 23, 41–51. [Google Scholar] [CrossRef]
  45. Mosiej, J.; Bus, A. New challenges in rural water management in Poland–selected problems. In Proceedings of the 7th International Scientific Conference Rural Development 2015, Akademija, Lithuania, 1–20 November 2015; Raupelienė, A., Ed.; Aleksandras Stulginskis University: Kaunas, Lithuania. [Google Scholar] [CrossRef] [Green Version]
  46. Patro, M.; Zubala, T. Possibilities of shaping the water retention in agricultural landscape. Teka Komisji Ochronyi Kształtowania Środowiska Przyrodniczego 2012, 9, 143–152. [Google Scholar]
  47. Drabiński, A.; Radczuk, L.; Mokwa, M.; Nyc, K.; Markowska, J.; Jawecki, B.; Malczewska, B. Program Małej Retencji Wodnej w Województwie Dolnośląskim (Small Water Retention Program in the Dolnośląskie Voivodeship); Centrum Modelowania Procesów Hydrologicznych: Wrocław, Poland, 2008. [Google Scholar]
  48. Baryła, A.; Karczmarczyk, A.; Brandyk, A.; Bus, A. The influence of a green roof drainage layer on retention capacity and leakage quality. Water Sci. Technol. 2018, 77, 2886–2895. [Google Scholar] [CrossRef] [PubMed] [Green Version]
  49. Berretta, C.; Poë, S.; Stovin, V. Moisture content behaviour in extensive green roofs during dry periods: The influence of vegetation and substrate characteristics. J. Hydrol. 2014, 511, 374–386. [Google Scholar] [CrossRef]
  50. Burszta-Adamiak, E.; Mrowiec, M. Modelling of green roofs’ hydrologic performance using EPA’s SWMM. Water Sci. Technol. 2013, 68, 36–42. [Google Scholar] [CrossRef] [PubMed]
  51. Bouzouidja, R.; Séré, G.; Claverie, R.; Ouvrard, S.; Nuttens, L.; Lacroix, D. Green roof aging: Quantifying the impact of substrate evolution on hydraulic performances at the lab-scale. J. Hydrol. 2018, 564, 416–423. [Google Scholar] [CrossRef]
  52. Studium Uwarunkowańi Kierunków Zagospodarowania Przestrzennego Wrocławia (Study of the Conditions and Directions of Spatial Development in Wrocław). 2017. Available online: https://geoportal.wroclaw.pl/studium/ (accessed on 22 September 2021).
  53. Śródmieście Południowe Jednostka Urbanistyczna A11 W Studium Wrocławia Wytyczne Przestrzenne Na Rzecz Osiedla Kompletnego Wrocław, 2019 (Southern Downtown Urban Planning Unit A11 In Wrocław Study Spatial Guidelines for the Complete Housing Estate Wrocław). Available online: https://gis.um.wroc.pl/imap/?gpmap=kompletne (accessed on 22 September 2021).
  54. Szymanowski, M.; Kryza, M. Local regression models for spatial interpolation of urban heat island—An example from Wrocław, SW Poland. Theor. Appl. Clim. 2011, 108, 53–71. [Google Scholar] [CrossRef] [Green Version]
  55. Szymanowski, M.; Kryza, M. Application of geographically weighted regression for modelling the spatial structure of urban heat island in the city of Wroclaw (SW Poland). Procedia Environ. Sci. 2011, 3, 87–92. Available online: https://www.researchgate.net/publication/289180117_Application_of_the_geographically_weighted_regression_for_spatial_interpolation_of_the_urban_heat_island_in_Wroclaw_SW_Poland (accessed on 25 July 2021). [CrossRef] [Green Version]
  56. Rubaszek, J.; Szymanowski, M.; Michalski, A.; Tatko, R.; Weber-Siwirska, M. Procedure for the selection and evaluation of prefabricated housing buildings for the implementation of green roofs in the context of Urban Heat Island mitigation. The example of Wrocław, Poland. PLoS ONE 2021, 16, e0258641. [Google Scholar] [CrossRef]
  57. Kazak, J.K. The Use of a Decision Support System for Sustainable Urbanization and Thermal Comfort in Adaptation to Climate Change Actions—The Case of the Wrocław Larger Urban Zone (Poland). Sustainability 2018, 10, 1083. [Google Scholar] [CrossRef] [Green Version]
  58. Weber-Siwirska, M.; Rubaszek, J.; Tatko, R. Assessment of the possibility of greening the Large-Panel buildings roofs on the example of the Dorota-Barbara housing estate in Wrocław, Poland. In Redefining Cities in View of Climatic Changes; Politechnika Warszawska: Warszawa, Poland, 2019. [Google Scholar]
  59. Pawłowski, T. Wartości Estetyczne (Aesthetic Values); Wiedza Powszechna: Warszawa, Poland, 1987. [Google Scholar]
  60. Janiszek, M.; Majorek, A. Waloryzacja Przestrzeni Miejskiejna Podstawie Projektów Zrealizowanych w Ramach Budżetu Obywatelskiego (Valorization of Urban Space on the Basis of Projects Implemented within the Framework of the Civic Budget), Komitet Przestrzennego Zagospodarowania Kraju Polskiej Akademii Nauk Zeszyt 268, rok 2017. pp. 167–185. Available online: https://www.researchgate.net/publication/326583241_Waloryzacja_przestrzenimiejskiej_na_podstawie_projektow_zrealizowanych_w_ramach_budzetu_obywatelskiego (accessed on 19 September 2021).
  61. Dudek, T. Ocena Walorów Krajobrazowych Okolic Rzeszowa (Assessment of Landscape Values in the Vicinity of Rzeszów), Acta Scientiarum Polonorum. Administratio Locorum 11/1. pp. 65–71. Available online: https://www.researchgate.net/publication/315797838_Assessment_of_the_landscape_value_of_the_Rzeszow_surroundings_Ocena_walorow_krajobrazowych_okolic_Rzeszowa (accessed on 19 September 2021).
  62. Połucha, I.; Marks, E. Ocena Walorów Przyrodniczychi Kulturowych Gminy Reszel Pod Kątem Rozwoju Turystyki (Assessment of the Natural and Cultural Values of the Reszel Commune in Terms of Tourism Development), Acta Scientiarum Polonorum. Administratio Locorum 11/2. 2012, pp. 177–197. Available online: https://bazhum.muzhp.pl/media/files/Acta_Scientiarum_Polonorum_Administratio_Locorum/Acta_Scientiarum_Polonorum_Administratio_Locorum-r2012-t11-n2/Acta_Scientiarum_Polonorum_Administratio_Locorum-r2012-t11-n2-s177-197/Acta_Scientiarum_Polonorum_Administratio_Locorum-r2012-t11-n2-s177-197.pdf (accessed on 19 September 2021).
  63. Kot, R.; Sobiech, M. Ocena Georóżnorodności Rzeźby Terenu Wybranych Fragmentów Krajobrazu Młodoglacjalnego Pojezierza Chełmińsko-Dobrzyńskiego (Assessment of Geodiversity of the Terrain of Selected Fragments of the Young-Glacial Landscape of the Chełmno-Dobrzyń Lake District). Rocznik Świętokrzyski. Ser. B–Nauki Przyr. 2013, 34, 77–92. Available online: https://rocznikswietokrzyski.pl/wp-content/uploads/2016/07/Kot_Sobiech.pdf (accessed on 19 September 2021).
  64. Jakiel, M. Ocena Atrakcyjność Wizualnej Krajobrazu Dolinek Krakowskich–Możliwości Zastosowania w Planowaniu Przestrzennym (Assessment of the Visual Attractiveness of the Landscape of the Krakow Valleys-Possible Use in Spatial Planning). Współczesne Problemyi Kierunki Badawcze w Geografii. 2015, 3, 91–107. Available online: https://www.researchgate.net/publication/286933612_Ocena_atrakcyjnosc_wizualnej_krajobrazu_dolinek_krakowskich_-_mozliwosci_zastosowania_w_planowaniu_przestrzennym_Assessment_of_the_visual_attractiveness_of_the_landscape_-_application_in_spatial_plann (accessed on 19 September 2021).
  65. Czubaszek, R.; Wysocka-Czubaszek, A.; Brzózko, A. Waloryzacja krajobrazu gminy wiejskiej Wysokie Mazowieckie (Valorisation of the landscape of the rural commune of Wysokie Mazowieckie). Problemy Ekologii Krajobrazu 2016, 41, 81–93. [Google Scholar]
  66. Hong, W.; Guo, R.; Tang, H. Potential assessment and implementation strategy for roof greening in highly urbanized areas: A case study in Shenzhen, China. Cities 2019, 95, 102468. [Google Scholar] [CrossRef]
  67. Wojtas, L. Próba Waloryzacji Śródmieść Miast Tworzonych Na Przełomie XIX i XX W. (Na Przykładzie Miast Górnośląskich) (Attempt at Valorization of City Centers of Cities Created at the Turn of 19th and 20th W. (On the Example of Upper Silesian Cities), Zeszyty Naukowe Politechniki Śląskiej, Seria: Architektura Z. 19, 1992, Nr Kol. 1110. Available online: https://delibra.bg.polsl.pl/Content/30136/BCPS_33334_1992_Proba-waloryzacji-sr.pdf (accessed on 19 September 2021).
  68. Bielcki, C. Ciągłość w architekturze (Continuity in architecture). Architektura 1978, 3, 26–75. [Google Scholar]
  69. Nowakowski, M. Komunikacja a Kształtowanie Centrum Miasta (Communication and Shaping the City Center); Arkady: Warszawa, Poland, 1976; p. 22. [Google Scholar]
  70. Lamprecht, M. Ewolucja Kwartałów Śródmiejskich Łodzi W Kontekście Kurczenia Się Miasta (Evolution of Łódź City Center Quarters in the Context of City Shrinking). Współczesne Wyzwania, Studia Miejskie Tom 23. 2016. Available online: https://www.studiamiejskie.uni.opole.pl/wp-content/uploads/2017/03/S_Miejskie_23_2016-Lamprecht.pdf (accessed on 10 October 2021).
  71. Regulation minister of infrastructure of 12 April 2002 on the technical conditions to which the buildings should correspond and their location. J. Laws 2019, 1065. Available online: https://www.global-regulation.com/translation/poland/3353940/regulation-of-the-minister-of-infrastructure-of-12-april-2002-on-technical-conditions%252c-which-should-correspond-to-the-buildings-and-their-location.html (accessed on 10 October 2021).
  72. Water Law. Journal of Laws 2017, 1566. Act of 20 July 2017 New Water Law (Journal of Laws 2017, item 1566), in Force as of 1 January 2018, Excluding Some Provisions, as Defined by the Act. Available online: https://apgw.gov.pl/en/legal-acts (accessed on 10 October 2021).
  73. Polish Waters Devise the Drought Effects Counteracting Plan; Parliamentary Document No. 13444. Nr Projektu: POIS.02.01.00-00-0015/16. Available online: https://stopsuszy.pl/en/drought-effects-counteracting-plan-decp/ (accessed on 10 October 2021).
  74. Dwivedi, A.; Mohan, B.K. Impact of green roof on micro climate to reduce Urban Heat Island. Remote. Sens. Appl. Soc. Environ. 2018, 10, 56–69. [Google Scholar] [CrossRef]
  75. Knyziak, P. The Quality and Reliability in the Structural Design, Production, Execution and Maintenance of the Precast Residential Buildings in Poland in the Past and Now. Key Eng. Mater. 2016, 691, 420–431. [Google Scholar] [CrossRef]
  76. Kozłowski, A.; Rybka, A.; Plewako, Z. Improving Safety–Safety Evaluation of External Sandwich Panels in Large-panel Buildings. In COST C16 Improving the Quality of Existing Urban Building Envelopes: Structures; Di Giulio, R., Bozinovski, Z., Verhoef, L.G.W., Eds.; IOS Press: Amsterdam, The Netherlands, 2007; pp. 211–220. [Google Scholar] [CrossRef]
  77. Ligęza, W. Renovation of Large-Panel Buildings in Context of Urban Renewal/Remonty Budynków Wielkopłytowych, Jako Element Rewitalizacji Miast. Civ. Environ. Eng. Rep. 2015, 17, 83–95. [Google Scholar] [CrossRef] [Green Version]
  78. Tofiluk, A.; Knyziak, P.; Krentowski, J. Revitalization of Twentieth-Century Prefabricated Housing Estates as Interdisciplinary Issue. IOP Conf. Ser. Mater. Sci. Eng. 2019, 471, 112096. [Google Scholar] [CrossRef]
  79. Chełmicki, J.; Kamiński, S. Wrocławska Wielka Płyta–system budownictwa mieszkaniowego z elementów wielkowymiarowych (Wrocław Large Plate-a system of housing construction made of large-size elements). In Systemy Budownictwa Mieszkaniowego I Ogólnego; Ciołek, W., Ed.; Arkady: Warszawa, Poland, 1974; pp. 225–254. (In Polish) [Google Scholar]
  80. Dzierżewicz, Z.; Starosolski, W. Systemy budownictwa wielkopłytowego w Polsce w latach 1970–1985. In Przegląd Rozwiązań Materiałowych, Technologicznychi Konstrukcyjnych (Systems of Large-Panel Construction in Poland in the Years 1970–1985. Review of Material, Technological and Design Solutions); Wolters Kluwer: Warszawa, Poland, 2010. (In Polish) [Google Scholar]
  81. Polish Standard UKD 624.042.42PN-80/B-02010T. Obciążenia w Obliczeniach Statycznych–obciążenie śniegiem [Loads in Static Calculations–Snow Loads]. (In Polish), Sektor Budownictwa i Konstrukcji Budowlanych, 2010. Available online: https://www.google.com/url?sa=t&rct=j&q=&esrc=s&source=web&cd=&cad=rja&uact=8&ved=2ahUKEwiX9P_W27X0AhWFn4sKHc4ZDwgQFnoECAQQAQ&url=http%3A%2F%2Fpowierzchnie.bejur.com.pl%2Fimages%2Fulotki%2Fnorma.pdf&usg=AOvVaw1K1KlJMB7UgO6EtRAOidB- (accessed on 10 October 2021).
  82. Polish standard, PN-EN-1991-1-3:2005. Eurokod 1: Oddziaływaniana konstrukcje–Część 1–3: Oddziaływania ogólne–Obciążenie śniegiem [Eurocode 1: Actions on structures–Part 1–3: General actions–Snow loads]. (In Polish), SektorBudownictwa i Konstrukcji Budowlanych, 2005. Available online: https://sklep.pkn.pl/pn-en-1991-1-3-2005p.html (accessed on 10 October 2021).
  83. Shafique, M.; Luo, X.; Zuo, J. Photovoltaic-green roofs: A review of benefits, limitations, and trends. Sol. Energy 2020, 202, 485–497. [Google Scholar] [CrossRef]
  84. Sun, Y.; Deng, L.; Pan, S.-Y.; Chiang, P.-C.; Sable, S.S.; Shah, K.J. Integration of green and gray infrastructures for sponge city: Water and energy nexus. Water-Energy Nexus 2020, 3, 29–40. [Google Scholar] [CrossRef]
  85. He, Y.; Yu, H.; Ozaki, A.; Dong, N.; Zheng, S. Long-term thermal performance evaluation of green roof system based on two new indexes: A case study in Shanghai area. Build. Environ. 2017, 120, 13–28. [Google Scholar] [CrossRef]
  86. Ng, E.; Chen, L.; Wang, Y.; Yuan, C. A study on the cooling effects of greening in a high-density city: An experience from Hong Kong. Build. Environ. 2012, 47, 256–271. [Google Scholar] [CrossRef]
  87. Grunwald, L.; Heusinger, J.; Weber, S. A GIS-based mapping methodology of urban green roof ecosystem services applied to a Central European city. Urban For. Urban Green. 2017, 22, 54–63. [Google Scholar] [CrossRef]
  88. Karteris, M.; Theodoridou, I.; Mallinis, G.; Tsiros, E.; Karteris, A. Towards a green sustainable strategy for Mediterranean cities: Assessing the benefits of large-scale green roofs implementation in Thessaloniki, Northern Greece, using environmental modelling, GIS and very high spatial resolution remote sensing data. Renew. Sustain. Energy Rev. 2016, 58, 510–525. [Google Scholar] [CrossRef]
  89. Sun, T.; Grimmond, C.S.B.; Ni, G.-H. How do green roofs mitigate urban thermal stress under heat waves? J. Geophys. Res. Atmos. 2016, 121, 5320–5335. [Google Scholar] [CrossRef]
  90. Berardi, U. The outdoor microclimate benefits and energy saving resulting from green roofs retrofits. Energy Build. 2016, 121, 217–229. [Google Scholar] [CrossRef]
Figure 1. Position of the analysed area. Author: Kamila Pawłowska (K.P.), based on OpenStreetMap.
Sustainability 13 13227 g001
Figure 2. Map of greenery and development in Gajowice. Author: K.P.
Sustainability 13 13227 g002
Figure 3. UHI in the area of Gajowice. Author: K.P., based on the map developed by Professor Szymanowski.
Sustainability 13 13227 g003
Figure 4. Diagram of research methodology. Author: K.P.
Sustainability 13 13227 g004
Figure 5. Map of Gajowice divided into urban greenery (a) and developed areas (b). Author: K.P.
Sustainability 13 13227 g005
Figure 6. Overlaying the grid of squares on the maps of greenery and development—distinguishing the analysed cells. Author: K.P.
Sustainability 13 13227 g006
Figure 7. Valorisation procedure based on the example of evaluation of cell 9C. Author: K.P.
Sustainability 13 13227 g007
Figure 8. Classes of greenery and development with a total score: (a)—greenery, (b)—development. Author: K.P.
Sustainability 13 13227 g008
Figure 9. Classes of the potential of BAS and natural land retention of urban areas. Author: K.P.
Sustainability 13 13227 g009
Figure 10. Presentation of the surface areas of greenery and developed areas. Author: K.P.
Sustainability 13 13227 g010
Figure 11. Distribution of classes of the potential of BAS and natural land retention of urban areas. Author: K.P.
Sustainability 13 13227 g011
Figure 12. Classes of greenery (a) and development (b) marked by colours. Author: K.P.
Sustainability 13 13227 g012
Figure 13. Classes in the greenery (a) and development (b) categories after considering the proposed area of GR. Author: K.P.
Sustainability 13 13227 g013
Figure 14. (a)—Defined classes and critical points, (b)—Roofs that show potential according to the criteria in the context of classes and critical points, (c)—New classes assigned after establishing GR on roofs with potential. Author: K.P.
Sustainability 13 13227 g014
Figure 15. Distribution of classes in the greenery category before and after the application of GR. Author: K.P.
Sustainability 13 13227 g015
Figure 16. Number of classes in the overall categories before and after the application of GR. Author: K.P.
Sustainability 13 13227 g016
Table 1. Comparison of factors [author: Kamila Pawłowska (K.P.), based on: Pancewicz (ed.), 2014].
Factor
ElementBerlinMalmoSeattlePoland
Impermeable surfaces0.00.0-------
Surfaces with vegetation connected with the ground (e.g., lawns with taller greenery)1.01.00.1–0.8
(depending on the height of greenery and the size of the occupied area in m2)
0.7–1.0 *
Green walls (e.g., with climbers or vertical gardens)0.50.70.70.8
Green roofs (intensive or extensive)0.70.60.4–0.7
(depending on substrate thickness)
0.5
* Additionally: 0.1
Drought-resistant or native plants
* 0.7—lawns on native soil and other greenery on native soil; 1.0—greenery on native soil with trees and shrubs whose crown projection will occupy at least 60% of the surface 5 years after planting, also surface of water reservoirs whose bottom is not isolated from native soil.
Table 2. Point score of the valorisation of greenery in specific classes of percentage share of green areas and categories of greenery. Author: Bartosz Jawecki (B.J.).
Categories Adopted for the Valorisation of Greenery
Greenery<25% *25–50%50–70%>70%
Low greenery **4.254.54.755
Medium greenery ***5.255.55.756
High greenery ****6.256.56.757
*If the total value of greenery is lower than 5%, assign 0 points in each class
**If the value exceeds 95%, the score should be multiplied by 1.5%
***If the value exceeds 95%, the score should be multiplied by 2.0%
****If the value exceeds 95%, the score should be multiplied by 2.5%
Table 3. Point score for the valorisation of development in individual classes of percentage share in surface of development and development categories. Author: B.J.
Categories Adopted for the Valorisation of Development
Development<25% *25–50%50–70%>70%
High-rise/prefabricated “Plattenbau” buildings43.753.53.25
Single-family/terraced houses32.752.52.25
Townhouses21.751.51.25
Paved surfaces10.750.50.25
*If the total value of development exceeds 95%, assign 0 points in each class.
**If the total value of development is lower than 5%, in each group assign 5 points in each class.
Table 4. Valorisation procedure based on the example of evaluation of cell 9C. Author: K.P.
9CHigh GreeneryMedium GreeneryLow GreeneryHigh-Rise/
PREFABRICATED “Plattenbau” Buildings
Single-Family/Terraced HousesTownhousesPaved SurfacesSum
Area m22234.6211,297.221862.37357.2302633.264115.322,500
Area %10508201218100
Table 5. Class ranges of the potential of BAS and natural land retention of urban areas for green and developed areas. Author: B.J.
Potential of BAS and Natural Land Retention of Urban Areas for Green and Developed Areas. Author: B.J.
ClassGreeneryDevelopment
LargeI13.11–17.5 pts14.01–20 pts
AverageII9.61–13.1 pts9.01–14 pts
NeutralIII7.01–9.60 pts5.01–9 pts
PoorIV5.31–7.0 pts2.01–5 pts
Very poorV0.0–5.3 pts0–2 pts
Table 6. Overall classification of the potential of BAS and natural land retention of urban areas. Author: B.J.
Building Indicator/Sealing
Greening Indicator14.01–20 pts9.01–14 pts5.01–9 pts2.01–5 pts0–2 pts
13.11–17.5 ptsIIIIIIIIII
9.61–13.1 ptsIIIIIIIIIV
7.01–9.60 ptsIIIIIIIIVIV
5.31–7.0 ptsIIIIIIVIVV
0.0–5.3 ptsIIIIIIIVVV
Table 7. Average, maximum and minimum values of the adopted land development categories. Author: K.P.
Type A v g . ±   s t a n d a r d d e v i a t i o n m i n . m a x .
High greenery 362.73   m 2 ± 158.23   m 2 0 8742.6   m 2
Medium greenery 8259.17   m 2 ± 561.23   m 2 0 18361.72   m 2
Low greenery 2036.16   m 2 ± 410.65   m 2 0 14200   m 2
High/“Plattenbau” buildings 1231.67   m 2 ± 126.13   m 2 0 4468.64   m 2
Single-family houses 101.95   m 2 ± 46.07   m 2 0 2661.22   m 2
Townhouses 1317.88   m 2 ± 165.89   m 2 0 6590.65   m 2
Paved surfaces 5515.39   m 2 ± 464.19   m 2 0 19464.67   m 2
Publisher’s Note: MDPI stays neutral with regard to jurisdictional claims in published maps and institutional affiliations.

