Article

Students’ and Parents’ Perceptions of Barriers to Cycling to School—An Analysis by Gender

1
Science & Engineering Faculty, School of Engineering, University of Limerick, Limerick, Ireland
2
School of Civil Engineering, College of Engineering and Architecture, University College Dublin, Belfield Dublin 4, Ireland
*
Author to whom correspondence should be addressed.
Sustainability 2021, 13(23), 13213; https://doi.org/10.3390/su132313213
Submission received: 19 October 2021 / Revised: 23 November 2021 / Accepted: 24 November 2021 / Published: 29 November 2021
(This article belongs to the Special Issue Urban Mobility and Active Transport Transition)

Abstract

:
Internationally, there is increased emphasis on the need to reduce dependency on cars and to encourage more sustainable forms of travel, including active travel. To encourage increased levels of cycling, the focus has generally been on improving cycling infrastructure and on making cycling safer. While cycling rates have increased in many countries, including Ireland, women are often less likely to cycle than men. While there are some notable exceptions to this (for example, in the Netherlands) this phenomenon of lower cycling rates amongst women is common and research shows that the differences between male and female cycling rates can be seen from an early age. This paper explores the reasons why women are less likely to cycle than men, by examining the modal choices of school-going students, and the attitudes of their parents/guardians to their modal choices. The survey was conducted in the city of Limerick in the midwestern region of Ireland. The results show multi-factorial barriers to cycling to school for girls compared to boys. Uniforms, traffic concerns, physical efforts of cycling, effects on personal appearance, and peer-influences were factors affecting girls more than boys. Male parents/guardians did not significantly differentiate by the gender of their children in relation to factors associated with cycling to school, unlike female parents/guardians who were found to be significantly less supportive of their daughters than their sons. Additionally, parents/guardians were generally more likely to afford their male children greater independence in their school travel choices. While there are many considerations that would affect students’ perceptions towards cycling, an adjustment to the school uniform policy would, at least, remove the most significant barrier for girls. Further research must be carried out to determine how to shift the perceptions of the efforts associated with cycling, especially among girls, and how to encourage female parents/guardians to better support their daughters to cycle to school.

1. Introduction

In Ireland, as in many other countries, there has been significant emphasis in the past decade to reduce car travel and to increase travel by more sustainable modes of transportation, in particular active modes [1]. This is driven by the recognition that private car travel is an unsustainable form of transport. As travelling by bicycle is an accessible and energy efficient form of travel, there is scope to encourage the uptake of cycling across the population to reduce greenhouse gases emissions [2]. The health benefits associated with cycling to school have also been well-documented with studies showing higher cardio-respiratory fitness among children and adolescents who cycle to school compared with those who do not cycle [3,4]. A full understanding of the reasons behind the current low rates of cycling, especially in half of the population, females, is required to meaningfully inform policy to encourage the mass uptake of cycling.
Low rates of cycling and significant gender differences exist across many countries. In England, males made 24 cycling trips per year on average across all ages, while females made only eight cycling trips, according to 2019 figures. The same survey showed that males travelled on average 3.7 times farther than females by bicycle (138 km v 37 km in 2019) [5]. The gender inequality is constant in the English-speaking countries of Canada, USA, UK, Ireland, Australia and New Zealand where the percentage of cyclists that are female, for all trips, ranges only from 20% to 30% [6].
While this trend of lower cycling rates amongst women is common internationally, there are exceptions. This tends to be in countries where the overall cycling commuter rates are higher and where cycling is seen as a more conventional mode for commuting. In Finland, Germany, and Sweden, almost half of cyclists are female. In Denmark and in the Netherlands, 18% and 26% of all trips are by bicycle, respectively. Furthermore, approximately 55% of all cyclists are female [6].
In many countries, the differences in cycling rates between men and women are apparent from an early age. In England, up to the age of 16, boys make three times as many bicycle trips per year as girls [5]. The Central Statistics Office (CSO) in Ireland reports that only 2% of boys cycle and only 1% of girls cycle to primary school but that at secondary school level, the rate for boys doubles to 4% while the rate for girls halves to 0.5% [7]. This suggests that the transition from primary school to secondary school has a significant effect on cycling to school rates, in particular by gender.
The reasons for the lower cycling rate among schoolgirls compared with schoolboys may be associated with safety perceptions as well as peer and parental influences. However, most of the research on gendered cycling differences relates to adults and not children. Presented here are the main findings from research available on cycling barriers by gender for adults followed by, where available, those for adolescents.
There are several factors which may explain the reasons for lower cycling rates amongst women. Existing research seems to indicate that, in many countries, women are more likely than men to see cycling as a risky behaviour, with greater concerns in relation to both safety in traffic and personal safety. However, in countries with high levels of cycling amongst women, the public perception for both men and women is that cycling is safe [8]. Several studies have demonstrated that females express greater concerns than males regarding the risks associated with cycling. Aldred and Elliott [9] conducted an extensive study of attitudes to cycling amongst males and females, and amongst different age groups, examining research from a number of different countries. Their findings indicated that female cyclists are more likely than male cyclists to want to be segregated from other traffic. It is also suggested in their work that further research should be carried out on children’s own views of the barriers to cycling. Dill and Gliebe [10] made similar findings related to female preferences for segregation in the USA.
Women are also more likely than men to have concerns about their personal safety when cycling [11,12]. The public nature of cycling can also lead to the harassment from motorists. This appears to be most prevalent in low-cycling countries where cycling is a marginalised activity. A study of 1414 cyclists in Australia showed that cyclists self-reported on different types of harassment that they experienced from motorists, affecting females more than males. While males were subjected to significantly more of some types of harassment than females, including “throwing objects” and “obscene gestures”, arguably the most unpleasant, “sexual harassment” was reported, proportionally, 25 times more often by females than males [13].
Research also suggests that women rate their cycling ability negatively compared to men, feel that they do not have the appropriate skills required to cycle and are more likely to see lack of infrastructure as a barrier to cycling [9,14,15].
Distance is a barrier to cycling for both genders, but more so for women. Carroll and Brazil [16] found that there was a significantly greater reduction in the female cycling mode share with distance from the city centre.
Research also suggests that there is a conflict between the requirements to look presentable and cycling, especially among women. This has been found in studies in the US [17] and the UK [18]. The latter describes an obligation particularly felt amongst women, especially at work, to “appear attractive and smart” and that this was not conducive to cycling in bad weather conditions. Corroborating research carried out by the Transport Research Laboratory in the UK affirms that women were less likely to commute by bicycle because of their personal appearance concerns. The safety requirement of having to wear a helmet was a particular deterrent [19].
The factors described thus far (safety, personal safety, social pressure) affect both adult and young cyclists. However, this paper will focus on school children to explore if some of these differences in perceptions of cycling start to emerge at a young age. In previous research by the authors [20], it was found that there were no significant differences between boys and girls across a number of predefined barriers to active commuting to school, except proportionally the “weather” and “bags” seemed to affect girls significantly more than boys. That research comprising 4122 students related to barriers to both walking and cycling to school whereas this study relates to cycling only. Although children’s perceptions of cycling to school may match their perceptions of active travel to school, this research explicitly addresses cycling.
Similar to the findings of cycling preferences among adults, a study of adolescents in Belgium found strong preferences for separation from traffic, especially with a raised kerb or a barrier rather than road markings; shorter distances and cycling with friends. This was a comprehensive study comprising 882 participants across twelve schools; however, the results by gender were not presented [21].
A further analysis on cycling to school distance limits revealed literature, also from Flanders, which indicated that eight kilometres is a feasible cycling to school distance. This was, however, among older teenagers, 17- and 18-year-olds, whereas younger adolescents may have different thresholds [22].
The influence of parents/guardians on cycling and modal choice will also be explored. Research related to teenage New Zealanders indicates that parents perceive cycling to be less supported by themselves, by students and even by the schools when compared with walking. Parents were more concerned with their children’s safety in relation to cycling compared with walking; although, safety concerns for both walking and cycling increased with distance from school [23].
Pang and Rundle-Thiele [24] found that, among Australian parents/guardians, social norms have a significant effect on walking and cycling to school behaviours. This suggests that parents/guardians are influenced by what their friends, neighbours and family members think about allowing children to actively commute to school.
The independence that parents/guardians offer their children with respect to their mobility is seen as a significant factor in students’ travel mode to school. There is strong evidence that children and young people would prefer more independence and would walk and cycle more if they had the choice but are limited by their and their parents’/guardians’ personal safety fears [25]. There is much consensus in research from around the world that indicates that boys are afforded more independence than girls [26]. This is considered to be one of the factors for differing cycling to school rates among boys and girls. Solana [27] conducted research on Spanish families regarding active commuting to school for 9 to 12-year-olds. They found that mothers and fathers had similar views regarding the barriers to active commuting, with both mothers and fathers seeing distance as the most significant barrier. However, they found that the perceptions of mothers differed in several respects to those of fathers. Mothers were more likely to be involved in organising extra-curricular activities for their children and this led to more positive attitudes to active commuting to schools, as this allowed greater flexibility. On the other hand, mothers were more likely to see walking as being something children would find boring, and that this was a barrier to active commuting. Mothers also perceived, more than fathers, that the lack of policemen at junctions was a barrier to active commuting to school. Research in this area is limited and there are gaps in our knowledge regarding the influence of parents on their children’s commuting choices.
With an overarching aim of informing policy on sustainable commuting, particularly travel by bicycle to school, this paper seeks to add to the research on cycling and the differences in the perceptions of a range of factors associated with cycling to school amongst boys and girls in secondary school. The objectives of the paper are:
  • To identify differences in the rates of cycling amongst boys and girls, at primary and secondary school, by weather conditions.
  • To examine if boys and girls perceived barriers to cycling differently.
  • To identify the role of parents in the commuting choices of children and
  • To examine if male and female parents/guardians have different perceptions of barriers to cycling for boys and girls.

2. Methodology

2.1. Survey Design

This study included two surveys: one of secondary school students, aged between 12 and 18, and one of their parents/guardians in Limerick City and suburbs which is in the midwestern region of Ireland. The area comprises urban and suburban development, includes primary schools, post-primary schools and third level institutions and has a population of 94,192 [28]. The student survey was designed to meet the objectives above. Based on the widening of the gender gap in cycling to school rates between primary and secondary school, a series of questions were developed for both stages. Travel mode questions for both to and from school during both good and bad weather conditions were asked. Previous research by the authors revealed, in a small proportion of instances, a difference in travel modes for travel to and from school [20] and much research has indicated that weather affects cycling commuting rates with a greater effect on the less experienced cyclists [29]. As the research relates to cycling to school, the participants included only students who could reasonably be expected to cycle to school. Therefore, a screening question was included whereby participants that lived greater than 8km from school skipped part of the survey. This was based on criterion distances research carried out in Belgium which indicated a sharp fall in cycling commuting rates beyond eight kilometres among older adolescents [22].
A series of statements was developed where students were asked their level of agreements with factors related to cycling to school. An exhaustive list of statements was initially developed based on previous assumptions as well the previous research by the authors and by others. This list was reduced following a review of the study objectives and following a pilot test. The student survey contained, among other things, a series of thirty-six questions relating to cycling to school. These questions were in the form of a series of statements to which participants were asked to indicate their level of agreement from Strongly Agree = 1 to Strongly Disagree = 5. An analysis of the means indicates the average level of agreement with statements. The risk of introducing errors, as participants were asked to recollect behaviour, was considered. However, in this case, it was justified as participants only had to recall to when they were in their final year of primary school when they would typically have been twelve years old. This was important, as it is clear from CSO data that the significant change in cycling rates between males and females starts to emerge as children move from primary school (attended between the ages of 4 and 12 in Ireland) and secondary school (attended by children between the ages of 13 and 18 in Ireland). See summary of survey structure in Figure 1. The parent/guardian survey was designed to examine relationships between their travel patterns and attitudes towards cycling and those of their children. A list of Likert Scale questions was also developed which related closely to that of the students.

2.2. Sampling Methodology

Of the fifteen secondary schools in study area that were contacted, seven mixed-gendered schools engaged with the study. In most cases, a small number of teachers in each of the schools coordinated the surveys locally. This involved getting the parents’/guardians’ consent and organising a computer laboratory and a timeslot during which the online surveys could be completed. Unique codes were created for each participant to anonymise responses and to match student and parent/guardian responses from the same households. The surveys were conducted between January 2019 and February 2020.
Parents and guardians were asked to offer their consent to allow their children participate in the study and to participate in the parents’/guardians’ survey by providing their email addresses. Parents/guardians were emailed links to the online surveys and unique codes.

2.3. Final Sample

Table 1 shows the details of the final sample of students and parents/guardians in the study. There were 497 responses from students relating to the primary school questions and 354 for the secondary school questions. The distance-related screening question for students reduced the number of responses for both parts of the student survey. The mean age of the student participants who completed the surveys was 14.9 and 15.0 years for the primary and secondary school parts of the survey, respectively.
Table 1 provides details of the sample: there were 429 female and 250 male parents/guardians, which is a ratio of 1.7:1, that offered email addresses. This included 210 pairs whereby two parents/guardians provided email addresses for their child. A total of 251 parents/guardians, (M = 47.4 years, SD = 5.9 years) ranging in age from 32 to 65 years, completed the survey, including 15 pairs of responses where two parents/guardians responded to the survey with respect to their child. Females outnumbered male parents/guardians by almost a 2:1; however, this is explained by the similar gender split of those who consented to complete the survey by providing their email addresses.

3. Results

3.1. Cycling to/from School Rates by Gender and by Weather

The cycling to school rates are presented by weather conditions, good and bad, by journey direction, to and from school, by gender, male and female, and by school type, primary or secondary school, in Table 2. The figures shown are the numbers and percentages within totals. At primary school level, boys are 2.7 times more likely than girls (7.3% vs. 2.7%) to cycle to and from school in all weather conditions. This is the case when to and from school and when good and bad weather conditions are averaged. The corresponding rates from the 2016 census, for Limerick City and Suburbs, indicated that boys are twice as likely to cycle than girls (1.13% vs. 0.57%). The analysis for travel to and from secondary school travel, reveals that boys are approximately 18 times more likely than girls (7.1% vs. 0.4%) to cycle; while the CSO’s figures from secondary school indicate that boys are 24.3 times more likely to cycle than girls (4.69% vs. 0.19%) [7]. The ratios of boy to girls cycling reflects the CSO’s data; however, the cycling rates among the sample are higher than the CSO’s data. This is likely due to the fact that the survey omitted 15.8% and 28.8% of those who lived greater than 8km from primary and secondary school respectively.
For the eight comparisons–cycling to and from school, in good and bad weather conditions, for both genders and for both primary school and secondary school–the results of column proportion tests confirmed that there were statistically significant differences in all eight comparisons. It is concluded that there are significant differences in cycling to and from school rates between boys and girls for both primary school and secondary school.
While the proportions of boys cycling to and from primary and secondary schools were low, averaging at approximately 7.2%, the proportion of girls cycling to/from primary school was statistically significantly lower and further lower for girls at secondary school level. The responses indicated that no girls cycle to secondary school while only one and two girls cycle home from school in good and bad weather conditions respectively. This limits the statistical analysis that can be conducted on girls who cycle to school.

3.2. Barriers to Cycling to School with Significant Gender Differences

Students were asked to indicate their level of agreement with statements relating to cycling to school. The results of the Mann-Whitney U tests, with Benjamini-Hochberg adjustments, for secondary school-related questions, show that there were statistically significant differences (p < 0.05) in perceptions between male and female students in several factors, see Table 3.
The factor with the largest difference between means was “my uniform does not lend itself to riding a bicycle”, where the mean for female students was 1.88 and that for male students was 2.95. It should be noted that it is obligatory for girls in secondary to wear long skirts at least to “midcalf” in all of the schools that engaged with the study [30,31], and this is common in most schools in Ireland.
Many of the factors that were significantly different for boys and girls at secondary school level relate to an aversion to the physical exertion of cycling rather than any environmental barriers. This includes perceptions that the number of bags or weight of bags is a barrier to cycling or being “too tired”, “too lazy”, “not physically fit enough to cycle” or that cycling “involves too much planning ahead”. These results also show girls’ resistance to the effort that is associated with cycling to school. Girls’ perceptions of their skills for cycling to school were significantly different from that of boys. This is evidenced by a comparison of the mean responses by gender of the “handing a bike” and an inability to “fix minor mechanical issues” statements.
Aligned with research among adults, female students seemed to be more concerned about their physical appearance than males with a significant difference in means related to the level of agreement with the statement, “cycling would ruin my hair especially if I wore a helmet”. There were also significant differences in the perceptions among boys and girls of the barriers to cycling to school associated with traffic volumes and speeds with girls more than boys seemingly affected by traffic conditions.
There was a significant difference between males and females regarding the peer-perception of cycling to school with proportionally more girls than boys indicating that “cycling to school being uncool”.
An obvious barrier to cycling to school is having access to a bicycle. A significantly higher rate of boys than girls indicated owning or having access to a bicycle. Literature on bicycle ownership rates by gender was not found and therefore, comparisons between these results and previous research could not be made.

3.3. Age-Effect of Perceptions towards Cycling to School

Following the analyses comparing the responses to various statements about cycling to/from school by gender, the age-effect was examined, i.e., does the gender difference in attitudes and perceptions related to cycling to school vary with age. As the dependent variable was ordinal–varying from Strongly Agree to Strongly Disagree–ordinal regression was carried out. This was important to examine, as the study seeks to identify if the differences between male and female perceptions of cycling becomes more marked as students move from pre-adolescence to adolescence.
Table 4 shows the ordinal regression results comprising the Wald’s chi-squared statistic and associated p-values for the independent variable age. The 95% confidence intervals of odds ratios are also shown. The results of the ordinal regression analyses indicate that age is not statistically significant for each of the 36 statements related to cycling to school.

3.4. Parents’/Guardians’ Effect on Cycling to School by Student Gender

There were 168 cases where parents’/guardians’ responses matched with those of their respective children. Mean scores and standard deviations showing parents’/guardians’ level of agreement, by student gender, with statements on their children cycling to school are shown in Table 5. The results indicate that parents’/guardians’ barriers to cycling consent for both their male and female children relate to safety issues, particularly traffic volumes, traffic speeds and driver behaviour. This aligns with previous research on parents’ barriers to active travel to school [27]. Parents/guardians also cited heavy/numerous bags as a factor affecting their children’s ability to cycling to school.
Analysing the results by student gender reveals some interesting findings. Table 5 also shows the Mann-Whitney U test results, with p-values of less than 0.05 shown in bold, which reveal significant differences, by student gender, in following factors:
  • On average, parents/guardians indicated a neutral response to “he/she would get too hot and sweaty if he/she cycled” for their girls but indicated disagreement for their boys. (Mean scores: Girls: 3.06; Boys: 3.61).
  • Parents/guardians thought that their girls’ uniforms do not lend themselves to riding a bicycle, however, this was not the case for their boys (Mean scores: Girls: 1.98; Boys: 3.36).
  • Parents/guardians disagreed with the statement, cycling would ruin his/her hair especially if he/she wore a helmet for both their boys and their girls; however, for they disagreed more for their boys than their girls (Mean scores: Girls: 3.46; Boys: 4.11).
  • Parents/guardians responded neutrally to the statement, “it is uncool to cycle to school” for the girls but disagreed for their boys (Mean scores: Girls: 3.37; Boys: 4.06).
This analysis would indicate that, in general, parents/guardians are more likely to consider their female children as having particular barriers to cycling, ranging from the effect of cycling on their physical appearance to the suitability of their uniforms as well as the social context of cycling among peers. However, for both boys and girls, cycling was not seen as convenient because of pre- and post-school activities. Interestingly, parents/guardians, on average, did not indicate a difference in their personal safety concerns between their male and female children. There was general disagreement among parents/guardians with the statement, “I am concerned of him/her being attacked by bullies or strangers on his/her way to/from school”.

3.5. Parents’/Guardians’ Responses by Student Gender and by Parents’/Guardians’ Gender

Mann-Whitney U tests results show that there were no significantly different factors associated with cycling to school between boys and girls when the male parents’/guardians’ responses are isolated. The Benjamini-Hochberg corrections adjusted the p-values for significance of all factors including that associated with “school uniforms” which was significant prior to the correction (p = 0.004). The corresponding results for female parents’/guardians’ responses indicate significant differences between boys and girls cycling to school. Uniforms were considered by female parents/guardians as a factor affecting their girls more than their boys. Additionally, the negative effect of cycling on their hair was more applicable to their daughters than their sons. Finally, female parent/guardians indicated that girls’ abilities were less than those of boys for fixing minor mechanical issues. This is important as it appears that the same-sex parent (female) has a more negative perception of their daughters’ ability to cycle. It may be that the same sex parent has a greater impact upon the modal choices of a child. The results of analyses by student gender and by female parent/guardian gender are shown in Table 6.

3.6. Travel to School Independence

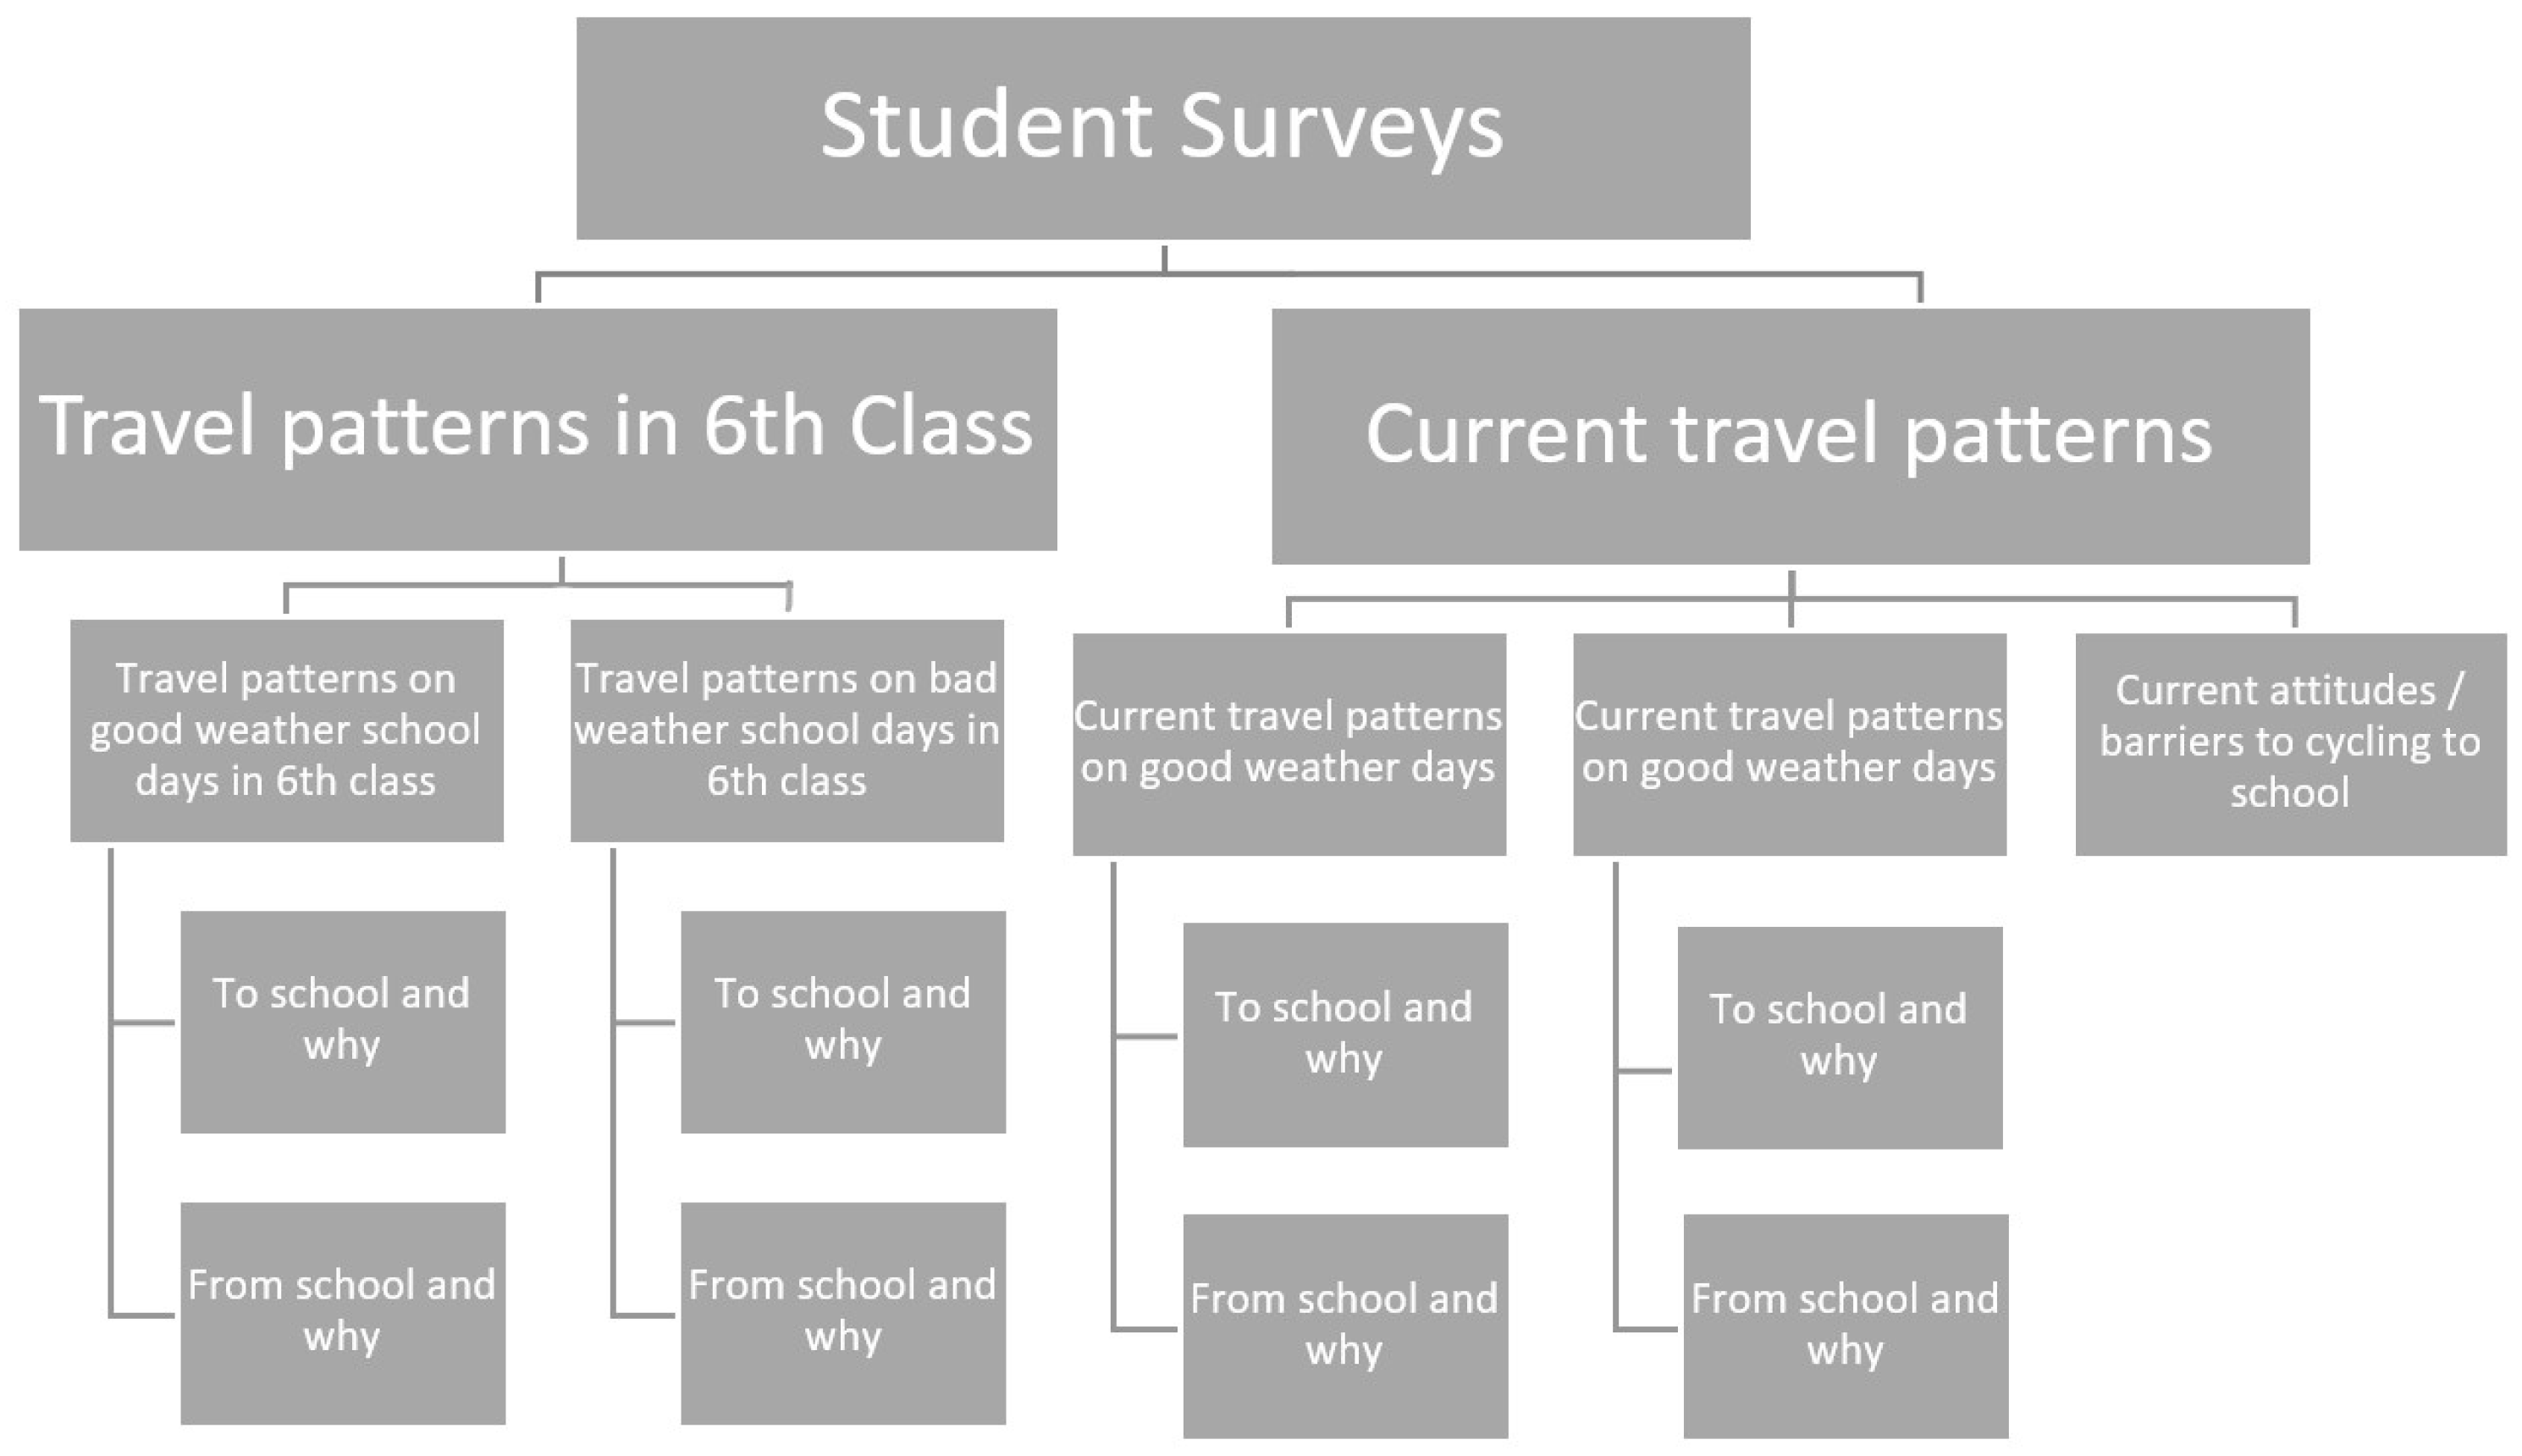
Student participants were asked who chose their means of travel to school when they were in sixth class of primary school and who chooses their current means of travel to school. Students were given two options: “me” or “my parent (s)/guardian (s)”.
As expected, the majority (74.4%) of students indicated that their parent (s)/guardian (s) chose their means of travel to sixth class of primary school and while more females than males indicated this, the difference was not statistically significant. Table 7.
A chi-square test of independence was performed to examine the relationship between gender and the “who chose means of travel to/from primary school”. The relationship between these variables was not significant, X2 (1, N = 477) = 1.916, p = 0.166.
At secondary school level, the proportion of respondents that specified that their parents choose their means of travel to school reduces significantly to 52.2%. When represented by gender, the results show that 57.7% and 46.3% of female and male students respectively indicate that their parents choose their means of travel to school. A chi-square test of independence confirmed that unlike for primary school, there is a relationship gender and the “who chooses means of travel to/from secondary school”, X2 (1, N = 339) = 4.389, p = 0.036.
A binary logistic regression was carried out to predict “who chooses means of travel” to secondary school. Using the 12- to 16-year-old cohort of the sample, the result of the analysis revealed that age (p = 0.995) was not significant, but gender (p = 0.043) was significant. The odds ratio for gender is 1.603 indicating that, controlling for age, males are 1.603 times more likely to choose their means of travel school than females. This suggests that female students have less control over their independence and aligns with the findings from 3.5 above which indicates that parents/guardians, especially females, have stronger perceptions of the barriers to cycling to school for their daughters compared to their sons.

4. Discussion

The main objectives of the paper were:
(a)
To identify differences in the rates of cycling amongst boys and girls, at primary and secondary school.
(b)
To examine if secondary school boys and girls perceived barriers to cycling differently.
(c)
To identify the role of parents in the commuting choices of children
(d)
To examine if male and female parents/guardians have different perceptions of barriers to cycling for boys and girls.
The research confirmed that girls cycle to school less than boys and that the difference in the rates of cycling increases significantly as children move from primary to secondary school. Bad weather conditions affected cycling rates for both boys and girls at both school levels. This finding aligns with some research on active travel to school in Canada [32] but contradicted other findings albeit from the Netherlands [33] where active travel rates to school are significantly higher. Cycling rates may be more affected by bad weather conditions than walking and as this analysis considers cycling behaviours only, it is unsurprising that bad weather had a significant negative affect on cycling.
At secondary school level, predictably, girls’ uniforms–long skirts–were a substantial barrier to cycling when compared with the corresponding–trousers–for boys. It seems understandable that the awkwardness of cycling with long skirts for girls is added to the requirement to carry heavy and/or numerous bags which also significantly affects girls more than boys. Additionally, the bike-handling question would have been answered with due consideration to uniforms, carrying bags, and mixing with traffic, each of which affecting girls more than boys. It comes, therefore, with little surprise that “handling a bicycle” was a factor affecting girls significantly more than boys. Most international research [14,15,34,35] in the area focusses on females’ stronger preferences for separation from traffic. This research, however, suggests there are a number of factors that are barriers to cycling more for girls than for boys beginning, perhaps with uniforms, that form a vicious circle pushing teenage girls away from cycling to school.
Girls also indicated, in stronger terms than boys, not being physically fit enough, that they would get too hot and sweaty, that they often feel too tired to cycle and that they were too lazy to cycle. This suggests overall lower physically fitness levels among girls which aligns with research that indicates that Irish schoolgirls complete less physical activity than boys at both primary and post-primary school levels [36]. The extra effort required to cycle to school compared with traveling by car would seem to be more of a deterrent to cycling for girls. Addressing this may require significant cultural and attitudinal changes among teenage girls.
Personal safety concerns (perceived risk of attack) did not seem to be a major barrier to cycling for girls and significantly less so for boys. This, interestingly, contradicts findings by the authors in a previous study, also among secondary school children [20], but supports the themes from other research [13].
Girls seem to be more interested in their physical appearance than boys or at least girls indicate more strongly than boys that cycling would affect their hair, especially with a helmet. While corresponding international research among adolescents was not found, this finding aligns with research among adults [19].
While the rate of cycling increases among boys but decreases among girls from primary to secondary school, a regression analysis using age as an independent variable indicated that age was not a significant predictor in each factor related to cycling to secondary school. This would indicate that there is a considerable change in perceptions among girls towards cycling as the move from sixth class of primary school to first year of secondary school but not, significantly at least, thereafter.
Parents/guardians generally found that traffic volumes and speeds and lack of cycling infrastructure were barriers to cycling to school for their children. This general safety concern barrier aligns with other research [23]. Parents’/guardians’ perceptions of personal factors would indicate that school bags and the inability “to fix minor mechanical issues” were not conducive to cycling. However, this was not the case for some other personal factors where parents/guardians generally perceived their children’s physical fitness, their ability to handle a bicycle, their tiredness/laziness and their grooming routines as factors that should not affect their cycling to school.
In general, parents/guardians showed that their attitudes also affect travel to school and that they have different attitudes towards the modal choices of their sons and daughters. However, this broad view may be misleading. Upon further analysis, it was found that, for all factors related to cycling to school, male parents’/guardians’ perceptions are not significantly differentiated by the gender of their child. Although, female parents/guardians indicated clear distinctions between their girls and boys across several factors. This is the most significant finding of the research and has policy development implications. Factors related to fixing minor mechanical issues, uniforms and ruining hair, would seem more likely to be barriers to cycling for girls rather than for boys according to female parents/guardians. The suggestion is that to increase the rates of cycling among female students, female parents’/guardians’ support is necessary. Perhaps, there is significant scope to affect a positive change in cycling to school rates by addressing specifically the concerns of female parents/guardians.
Little research has been done in the area; however, the finding of no significant difference in traffic-related perceptions between male and female parents/guardians aligns with other research [27]. This Spanish study examined parents’ perceived barriers to active commuting to school, albeit among 9 to 12-years-olds in Spain compared with 12 to 18-years-olds in Ireland. It found no significant differences between mothers’ and fathers’ perceptions of traffic-related dangers in relation to active commuting to school for their children. However, the same study found the children’s extra-curricular activities were positively correlated with active commuting to school by mother but not by fathers. Perhaps, there are significant differences, between Irish female parents/guardians and their international counterparts, in the care of their respective boys and girls.
There is an alignment between some aspects of the students’ responses and those of their parents/guardians. Secondary school girls indicated in stronger terms than boys that their parents/guardians think that it is unsafe to cycle. This suggests that boys and girls are aware of the level of parental/guardian support for cycling with girls indicating receiving significant less perceived support than boys. The analysis of the parents/guardians’ responses suggests that this is true.
On the related issue of travel to school independence, the results aligned with other research that indicated that boys experience more independent mobility than [26,37]. Specifically, the results indicated that boys were offered more independence than girls for travel to primary school and offered even more independence than girls at secondary school level. It could be inferred that this is also a result of seemingly a higher level of protectiveness of female parents/guardians of their girls.

5. Conclusions

This study examined the factors associated with cycling to school using survey responses from a sample of students and their parents/guardians across Limerick City and suburbs. There were many barriers to cycling to school that significantly affected girls more than boys. Some of these were as expected relating to uniforms, dangerous traffic and not being confident handling a bicycle; however, other barriers, which related to the physical effort associated with cycling to school, should be further investigated.
The finding, that indicated that girls are more peer-influenced in relation to cycling to school than boys, needs further exploration. Perhaps, this is part of a larger gender-related phenomena or maybe it is specifically travel-related.
The effect of parents/guardians was significant and raises interesting questions about how parents/guardians, in particular female parents/guardians, view their children and their independence. The protectiveness of parents/guardians relating to their children’s school travel is affected by student gender with boys offered more independence than girls at secondary school level. It seems that female parents/guardians rate the factors associated with cycling more negatively than their male counterparts, especially for girls, and are less likely to allow their girls the independence to make their own travel choices.
From a policy development perspective, there are two main recommendations: one which relates to secondary school girls and one in relation to female parents/guardians. For the former, there should be a focus on increasing cycling skills through early intervention; changing the policies or the design of school uniforms and the development of measures to address the negative attitudes towards the physical efforts required to cycle to school. The latter should be encouraged to match their perceptions of cycling to school for their girls with those of their boys. However, further research should be conducted to determine how such policies are developed and implemented.

Author Contributions

Conceptualization, R.H. and A.A.; methodology, R.H. and A.A.; software, R.H. and A.A.; validation, R.H.; formal analysis, R.H.; investigation, R.H.; resources, R.H.; data curation, R.H.; writing—original draft preparation, R.H.; writing—review and editing, R.H. and A.A.; visualization, R.H.; supervision, A.A.; project administration, R.H. and A.A.; funding acquisition, N/A. All authors have read and agreed to the published version of the manuscript.

Funding

This research received no external funding.

Institutional Review Board Statement

The study was conducted according to the guidelines of the Declaration of Helsinki, and approved by the UCD Office of Research Ethics of University College Dublin (protocol code LS-18-77-Higgins-Ahern, 19 October 2018).

Informed Consent Statement

Informed consent was obtained from all subjects involved in the study.

Data Availability Statement

Not applicable.

Acknowledgments

Many thanks to the supporting schools in Limerick City and suburbs.

Conflicts of Interest

The authors declare no conflict of interest.

References

  1. Carroll, P.; Caulfield, B.; Ahern, A. Modelling the potential benefits of increased active travel. Transp. Policy 2019, 79, 82–92. [Google Scholar] [CrossRef] [Green Version]
  2. Department of Transport, T.A.S. National Cycle Policy Framework. 2009. Available online: http://www.smartertravel.ie/sites/default/files/uploads/2013_01_03_0902%2002%20EnglishNS1274%20Dept.%20of%20Transport_National_Cycle_Policy_v4%5B1%5D%5B1%5D.pdf (accessed on 24 February 2021).
  3. Cooper, A.R.; Wedderkopp, N.; Jago, R.; Kristensen, P.L.; Moller, N.C.; Froberg, K.; Page, A.S.; Andersen, L.B. Longitudinal associations of cycling to school with adolescent fitness. Prev. Med. 2008, 47, 324–328. [Google Scholar] [CrossRef]
  4. Cooper, A.R.; Wedderkopp, N.; Wang, H.; Andersen, L.B.; Froberg, K.; Page, A.S. Active travel to school and cardiovascular fitness in Danish children and adolescents. Med. Sci. Sports Exerc. 2006, 38, 1724–1731. [Google Scholar] [CrossRef] [PubMed]
  5. UK Government. Statistical Data Set—Mode of Travel 2020. Available online: https://www.gov.uk/government/statistical-data-sets/nts03-modal-comparisons#mode-by-age-and-gender (accessed on 24 August 2020).
  6. Garrard, J.; Handy, S.; Dill, J. Women and cycling. City Cycl. 2012, 2012, 211–234. [Google Scholar]
  7. Central Statistics Office. Census of Population 2016—Profile 6 Commuting in Ireland. 2016. Available online: http://www.cso.ie/en/releasesandpublications/ep/p-cp6ci/p6cii/p6mtw/ (accessed on 21 November 2017).
  8. Pucher, J.; Buehler, R. Making cycling irresistible: Lessons from the Netherlands, Denmark and Germany. Transp. Rev. 2008, 28, 495–528. [Google Scholar] [CrossRef]
  9. Aldred, R.; Elliott, B.; Woodcock, J.; Goodman, A. Cycling provision separated from motor traffic: A systematic review exploring whether stated preferences vary by gender and age. Transp. Rev. 2017, 37, 29–55. [Google Scholar] [CrossRef] [PubMed]
  10. Dill, J.; Gliebe, J. Understanding and Measuring Bicycling Behavior: A focus on Travel Time and Route Choice. Final report OTREC-RR-08-03 prepared for Oregon Transportation Research and Education Consortium (OTREC). Available online: https://doi.org/10.15760/trec.151 (accessed on 30 December 2008).
  11. Bopp, M.; Kaczynski, A.T.; Besenyi, G. Active commuting influences among adults. Prev. Med. 2012, 54, 237–241. [Google Scholar] [CrossRef]
  12. Heesch, K.C.; Sahlqvist, S.; Garrard, J. Gender differences in recreational and transport cycling: A cross-sectional mixed-methods comparison of cycling patterns, motivators, and constraints. Int. J. Behav. Nutr. Phys. Act. 2012, 9, 106. [Google Scholar] [CrossRef] [Green Version]
  13. Garrard, J.; Crawford, S.; Hakman, N. Revolutions for Women: Increasing Women’s Participation in Cycling; Department for Victorian Communities Sport and Recreation, Deakin University: Melbourne, Australia, 2006; p. 78. [Google Scholar]
  14. Akar, G.; Fischer, N.; Namgung, M. Bicycling choice and gender case study: The Ohio State University. Int. J. Sustain. Transp. 2013, 7, 347–365. [Google Scholar] [CrossRef]
  15. Misra, A.; Watkins, K.; Le Dantec, C.A. Socio-demographic influence on rider type self classification with respect to bicycling. In Proceedings of the Transportation Research Board 94th Annual Meeting, Washington, DC, USA, 11–15 January 2015. [Google Scholar]
  16. Carroll, J.; Brazil, W.; Morando, B.; Denny, E. What drives the gender-cycling-gap? Census analysis from Ireland. Transp. Policy 2020, 97, 95–102. [Google Scholar] [CrossRef]
  17. Broache, A. Perspectives on Seattle Women's Decisions to Bike for Transportation. Master’s Thesis, University of Washington, Seattle, WA, USA, 2012. [Google Scholar]
  18. Dalton, A. Cycling Experiences: Exploring Social Influence and Gender Perspectives. Ph.D. Thesis, University of the West of England, Bristol, UK, 2016. [Google Scholar]
  19. Davies, D.; Halliday, M.E.; Mayes, M.; Pocock, R.L. Attitudes to Cycling: A Qualitative Study and Conceptual Framework; Transport Research Laboratory: Crowthorne, UK, 1997. [Google Scholar]
  20. Higgins, R.; Ahern, A. Analysis of Commuting Patterns of Post-Primary School CSPPA Study Participants. In Proceedings of the Irish Transport Research Network Conference 2018, Dublin, Ireland, 29–30 August 2018. [Google Scholar]
  21. Verhoeven, H.; Ghekiere, A.; Van Cauwenberg, J.; Van Dyck, D.; De Bourdeaudhuij, I.; Clarys, P.; Deforche, B. Which physical and social environmental factors are most important for adolescents’ cycling for transport? An experimental study using manipulated photographs. Int. J. Behav. Nutr. Phys. Act. 2017, 14, 108. [Google Scholar] [CrossRef] [PubMed] [Green Version]
  22. Van Dyck, D.; De Bourdeaudhuij, I.; Cardon, G.; Deforche, B. Criterion distances and correlates of active transportation to school in Belgian older adolescents. Int. J. Behav. Nutr. Phys. Act. 2010, 7, 87. [Google Scholar] [CrossRef] [Green Version]
  23. Mandic, S.; Hopkins, D.; Bengoechea, E.G.; Flaherty, C.; Coppell, K.; Moore, A.; Williams, J.; Spence, J.C. Differences in parental perceptions of walking and cycling to high school according to distance. Transp. Res. Part F Traffic Psychol. Behav. 2020, 71, 238–249. [Google Scholar] [CrossRef]
  24. Pang, B.; Rundle-Thiele, S.R.; Kubacki, K. An empirical examination of the ecological and cognitive active commuting framework: A social marketing formative research study. Health Educ. 2017, 117, 581–598. [Google Scholar] [CrossRef]
  25. Lorenc, T.; Brunton, G.; Oliver, S.; Oliver, K.; Oakley, A. Attitudes to walking and cycling among children, young people and parents: A systematic review. J. Epidemiol. Community Health 2008, 62, 852–857. [Google Scholar] [CrossRef] [PubMed]
  26. Mitra, R.; Faulkner, G.E.; Buliung, R.N.; Stone, M.R. Do parental perceptions of the neighbourhood environment influence children’s independent mobility? Evidence from Toronto, Canada. Urban Stud. 2014, 51, 3401–3419. [Google Scholar] [CrossRef]
  27. Aibar Solana, A.; Mandic, S.; Lanaspa, E.G.; Gallardo, L.O.; Casterad, J.Z. Parental barriers to active commuting to school in children: Does parental gender matter? J. Transp. Health 2018, 9, 141–149. [Google Scholar] [CrossRef]
  28. Central Statistics Office. Central Statistics Office—Census 2016 Small Area Population Statistics. 2020. Available online: http://census.cso.ie/sapmap/ (accessed on 25 August 2020).
  29. Motoaki, Y.; Daziano, R.A. A hybrid-choice latent-class model for the analysis of the effects of weather on cycling demand. Transp. Res. Part A Policy Pract. 2015, 75, 217–230. [Google Scholar] [CrossRef]
  30. Castletroy College. School Uniform. 2021. Available online: https://www.castletroycollege.ie/page/School-Uniform/32563/Index.html (accessed on 17 May 2021).
  31. Crescent College Comprehensive. School Uniform. 2021. Available online: https://www.crescentsj.com/about/school-uniform/ (accessed on 17 May 2021).
  32. Blanchette, S.; Larouche, R.; Tremblay, M.S.; Faulkner, G.; Riazi, N.A.; Trudeau, F. Influence of weather conditions on children's school travel mode and physical activity in three diverse regions of Canada. Appl. Physiol. Nutr. Metab. 2020, 46, 552–560. [Google Scholar] [CrossRef]
  33. Helbich, M.; Van Emmichoven, M.J.Z.; Dijst, M.J.; Kwan, M.P.; Pierik, F.H.; De Vries, S.I. Natural and built environmental exposures on children's active school travel: A Dutch global positioning system-based cross-sectional study. Health Place 2016, 39, 101–109. [Google Scholar] [CrossRef]
  34. Dill, J.; McNeil, N. Four types of cyclists? Examination of typology for better understanding of bicycling behavior and potential. Transp. Res. Rec. 2013, 2387, 129–138. [Google Scholar] [CrossRef] [Green Version]
  35. Wittmann, K.; Savan, B.; Ledsham, T.; Liu, G.; Lay, J. Cycling to high school in Toronto, Ontario, Canada: Exploration of school travel patterns and attitudes by gender. Transp. Res. Rec. 2015, 2500, 9–16. [Google Scholar] [CrossRef]
  36. Woods, C.; Powell, C.; Saunders, J.A.; O'Brien, W.; Murphy, M.H.; Duff, C.; Farmer, O.; Johnston, A.; Connolly, S.; Belton, S. The Children’s Sport Participation and Physical Activity Study 2018 (CSPPA 2018); Department of Physical Education and SportSciences, University of Limerick: Limerick, Ireland, 2019. [Google Scholar]
  37. Fyhri, A.; Hjorthol, R. Children’s independent mobility to school, friends and leisure activities. J. Transp. Geogr. 2009, 17, 377–384. [Google Scholar] [CrossRef]
Figure 1. Student Survey Structure.
Sustainability 13 13213 g001
Table 1. Table showing final sample of students and parents/guardians in the study.
Students(N, %)Age in Years (M, SD)
Primary School Survey
Male252 (50.7%)15.2, 2.2
Female 245 (49.3%)14.7, 1.5
Total497 (100%)14.9, 1.9
Secondary School Survey
Male169 (47.7%)15.2, 2.4
Female 185 (52.3%)14.9, 1.5
Total354 (100%)15.0, 2.0
Parents/Guardians
Male86 (34.3%)49.8, 6.3
Female 165 (65.7%)46.2, 5.3
Total251 (100%)47.4, 5.9
M: Means, SD: Standard Deviation.
Table 2. Contingency table showing cycling to and from school rates by weather, by gender and by school type (n = 463 for primary school, n = 457 for secondary school).
Primary School TravelSecondary School Travel
To or FromWeatherGenderGender
MaleFemaleTotalMaleFemaleTotal
ToGoodNo.24a11b359a0b9
%10.3%4.9%7.7%5.7%0.0%2.7%
BadNo.9a2b1111a0b11
%4.0%0.9%2.5%7.2%0.0%3.4%
TotalNo.33a13b4620a0b20
%7.2%2.9%5.1%6.4%0.0%3.0%
FromGoodNo.27a9b3615a1b16
%11.8%4.0%7.9%9.4%0.6%4.8%
BadNo.7a2a99a2b11
%3.1%0.9%2.0%5.9%1.2%3.4%
TotalNo.34a11b4524a3b27
%7.4%2.5%5.0%7.7%0.9%4.1%
TotalTotalNo.67a24b9144a3b47
%7.3%2.7%5.0%7.1%0.4%3.6%
Subscripts a and b indicate that, following a z-test, the column proportions are significantly different.
Table 3. Results of Mann-Whitney U tests with Benjamini-Hochberg adjustments comparing Likert Scales responses related to cycling to secondary school for boys and girls (n = 154 males, 174 females).
FactorMaleFemaleUZSig. BH Adj.
MSDMSD
It is too far to cycle3.711.283.281.4511,125−2.56800.0100.022
My journey is too short to consider cycling3.561.313.641.2612,838−0.4960.6200.676
It would take too much time3.311.362.931.3211,138−2.5330.0110.023
The slopes are too steep3.451.283.401.2512,899−0.4180.6760.716
The weather is too bad to consider cycling3.111.222.981.1312,249−1.2130.2250.279
There are attractions such as parks, attractive buildings, shops or friends’ houses along my route to school2.841.332.561.1811,664−1.9110.0560.092
There are a lot of bad smells and exhaust fumes along my route to school3.641.113.551.0612,568−0.8270.4080.474
I think that cycling to school is good for the environment1.981.041.981.1113,005−0.2980.7650.773
It is not safe to cycle3.541.103.221.2011,293−2.3740.0180.032
There are no bicycle lanes/bicycle lanes are of poor quality on my way to school3.191.373.161.2913,004−0.2890.7730.773
There are too many junctions/junctions are not safe for cyclists3.291.223.061.2511,929−1.5880.1120.156
The roads are too narrow from my house to my school to make cycling safe3.661.173.441.2111,806−1.7590.0780.123
The street lighting is poor3.741.153.591.1312,134−1.3660.1720.229
The bicycle parking facilities at my school are not good3.341.223.271.1412,681−0.6840.4940.556
There is too much traffic on the roads/traffic goes too fast to make cycling safe3.061.232.661.2510,889−2.8430.0040.011
Drivers don’t give cyclists respect2.901.213.051.1312,220−1.2430.2140.275
I don’t own or have access to a bicycle3.971.223.541.3910,870−2.9160.0040.010
I have to carry too many bags/my bags are too heavy2.541.221.951.019638−4.414<0.001<0.001
It involves too much planning ahead3.381.272.881.1410,072−3.832<0.0010.001
I would not be able to fix minor mechanical issues (e.g., repair a puncture or adjust the brakes)3.301.292.761.2310,071−3.822<0.0010.001
Travel by other means is more convenient2.311.312.031.0911,940−1.6060.1080.156
It is not convenient because of my pre or after-school activities2.971.382.811.2912,338−1.0910.2750.330
I am not physically fit enough to cycle4.161.113.821.2010,967−2.8450.0040.011
I do not feel confident handling a bike4.061.093.371.198680−5.570<0.001<0.001
I would get too hot and sweaty if I cycled3.341.282.861.2510,474−3.3380.0010.003
I often feel too tired to cycle3.361.312.781.269924−3.999<0.001<0.001
My uniform does not lend itself to riding a bicycle2.971.321.851.226888−7.772<0.001<0.001
Cycling would ruin my hair especially if I wore a helmet3.511.282.741.258880−5.257<0.001<0.001
I would be afraid of being attacked by bullies or strangers on my way to/from school3.901.173.581.1610,999−2.7450.0060.014
It is uncool to cycle to school3.711.133.171.189809−4.177<0.001<0.001
I am too lazy to cycle3.531.253.081.2810,588−3.2070.0010.005
Walking is more sociable2.591.122.301.1111,301−2.3760.0180.032
Driving a car or getting a lift in a car is cooler3.491.213.061.2510,639−3.1560.0020.005
My parent(s)/guardian(s) think that I would not be capable of cycling3.821.223.621.2211,922−1.6150.1060.156
My parent(s)/guardian(s) think that it is unsafe to cycle3.551.263.141.3010,837−2.9080.0040.010
My parent(s)/guardian(s) think that other means or travel are more convenient2.591.302.281.1611,513−2.1040.0350.061
M: Means, SD: Standard Deviation, U: Test statistic for Mann-Whitney U Test, Z: Standardised Test Statistic, Sig. (2-t): p-values for Mann-Whitney U Test, BH Adj.: p-values following Benjamini-Hochberg adjustments (bold values indicate statistical significance at the p < 0.05 level).
Table 4. Ordinal regression results for age effect on cycling to school factors (n = 527).
FactorAge
Wald χ2p-ValueOR95% CI
I have to carry too many bags/my bags are too heavy1.0970.2951.0550.954–1.167
I do not feel confident handling a bike0.9820.3221.0540.95–1.169
I often feel too tired to cycle0.8660.3521.0480.949–1.158
My uniform does not lend itself to riding a bicycle1.0500.3050.9480.857–1.05
Cycling would ruin my hair especially if I wore a helmet1.8360.1751.0720.969–1.185
It is uncool to cycle to school0.7600.3830.9560.865–1.057
It involves too much planning ahead0.9420.3320.9520.862–1.052
I would not be able to fix minor mechanical issues (e.g., repair a puncture or adjust the brakes)0.3800.5381.0320.934–1.139
I would get too hot and sweaty if I cycled0.9400.3320.9520.862–1.051
I am too lazy to cycle0.0380.8450.9900.896–1.094
It is too far to cycle3.1570.0761.0980.99–1.217
There is too much traffic on the roads/traffic goes too fast to make cycling safe0.1610.6891.0210.924–1.127
Driving a car or getting a lift in a car is cooler0.4020.5261.0330.935–1.142
I don’t own or have access to a bicycle0.4290.5131.0350.934–1.147
It would take too much time1.6040.2051.0670.965–1.178
It is not safe to cycle0.2350.6281.0250.927–1.133
My parent(s)/guardian(s) think that it is unsafe to cycle1.7610.1851.0700.968–1.184
I am not physically fit enough to cycle0.4130.5211.0350.931–1.15
I would be afraid of being attacked by bullies or strangers on my way to/from school0.9830.3211.0530.951–1.167
My parent(s)/guardian(s) think that other means of travel are more convenient0.2310.6311.0250.927–1.132
Wald χ2: Wald chi-square test value, p-value: Wald test p-value, OR: Odd Ratio, 95%, CI: 95% Confidence Interval for Odds Ratio.
Table 5. Results of Mann-Whitney U tests with Benjamini-Hochberg adjustments comparing Likert Scales responses of parents/guardians related to cycling to secondary school (n = 87 males, 81 females).
FactorMale StudentsFemale StudentsUZSig. BH Adj.
MSDMSD
It is too far to cycle3.521.433.251.553202−1.0570.2910.517
His/her journey is too short to consider cycling4.031.153.891.283327−0.6670.5050.646
It would take too much time3.541.403.171.533039−1.5960.1100.321
The slopes are too steep3.970.923.771.163303−0.7400.4590.613
The weather is too bad to consider cycling3.211.193.041.223272−0.8220.4110.626
There are attractions such as parks, attractive buildings, shops or friends’ houses along his/her route to school3.011.173.141.273294−0.7510.4530.630
There are a lot of bad smells and exhaust fumes along his/her route to school3.401.173.411.133515−0.0280.9780.978
I think that cycling to school is good for the environment1.490.631.540.913392−0.4830.6290.745
It is not safe to cycle2.541.402.311.263219−1.0020.3170.533
There are no bicycle lanes/bicycle lanes are of poor quality on his/her way to school2.381.482.111.433053−1.5910.1120.298
There are too many junctions/junctions are not safe for cyclists2.601.432.271.253106−1.3690.1710.365
The roads are too narrow from our house to his/her school to make cycling safe2.801.572.721.533395−0.4220.6730.769
The street lighting is poor3.111.372.941.523329−0.6370.5240.645
The bicycle parking facilities at his/her school are good2.481.102.601.033268−0.8470.3970.635
There is too much traffic on the roads/traffic goes too fast to make cycling safe2.151.232.041.243284−0.8050.4210.612
Drivers don’t give cyclists respect1.990.922.111.133429−0.3200.7490.799
He/she doesn’t own or have access to a bicycle4.071.253.991.293414−0.3760.7070.780
He/she has to carry too many bags/his/her bags are too heavy1.901.091.670.923113−1.4240.1550.353
It involves too much planning ahead3.371.223.141.123077−1.4680.1420.350
He/she is not able to fix minor mechanical issues (e.g., repair a puncture or adjust the brakes)2.661.192.201.122739−2.5970.0090.060
Travel to school by other means is more convenient2.131.161.790.923012−1.7340.0830.266
It is not convenient because of pre or after-school activities3.151.262.941.223186−1.1070.2680.505
He/she is not physically fit enough to cycle4.510.704.191.063033−1.7420.0810.290
He/she does not feel confident handling a bike4.011.043.621.282959−1.8840.0600.238
He/she would get too hot and sweaty if he/she cycled3.611.003.061.252639−2.9030.0040.030
He/she often feels too tired to cycle4.010.833.521.192756−2.5620.0100.056
His/her uniform does not lend itself to riding a bicycle3.361.281.981.241604−6.248<0.001<0.001
Cycling would ruin his/her hair especially if he/she wore a helmet4.110.923.461.232443−3.579<0.0010.006
I am concerned of him/her being attacked by bullies or strangers on his/her way to/from school3.541.133.521.273489−0.1150.9090.938
It is uncool to cycle to school4.060.843.371.402613−3.0250.0020.026
He/she is too lazy to cycle4.061.003.641.172812−2.3700.0180.081
Walking is more sociable2.831.032.651.163109−1.3640.1730.345
M: Means, SD: Standard Deviation, U: Test statistic for Mann-Whitney U Test, Z: Standardised Test Statistic, Sig. (2-t): p-values for Mann-Whitney U Test, BH Adj.: p-values following Benjamini-Hochberg adjustments (bold values indicate statistical significance at the p < 0.05 level).
Table 6. Results of T-tests comparing means of Likert Scales responses of female parents/guardians related to cycling to secondary school (n = 63 males, 51 females).
FactorMale StudentsFemale StudentsUZSig. BH Adj.
MSDMSD
It is too far to cycle3.441.503.121.601437−0.9970.3190.600
His/her journey is too short to consider cycling4.081.133.921.311529−0.4750.6350.923
It would take too much time3.491.443.081.611372−1.3860.1660.379
The slopes are too steep3.980.963.781.271538−0.4130.6800.907
The weather is too bad to consider cycling3.241.213.061.291488−0.6930.4890.823
There are attractions such as parks, attractive buildings, shops or friends’ houses along his/her route to school3.081.173.041.371583−0.1410.8880.980
There are a lot of bad smells and exhaust fumes along his/her route to school3.401.173.431.171568−0.2260.8210.973
I think that cycling to school is good for the environment1.460.561.530.881571−0.2370.8121.000
It is not safe to cycle2.431.402.391.301604−0.0180.9861.000
There are no bicycle lanes/bicycle lanes are of poor quality on his/her way to school2.371.542.041.431395−1.3010.1930.386
There are too many junctions/junctions are not safe for cyclists2.601.492.291.301441−0.9800.3270.581
The roads are too narrow from our house to his/her school to make cycling safe2.761.602.761.581590−0.1000.9200.982
The street lighting is poor3.061.383.021.561604−0.0180.9860.986
The bicycle parking facilities at his/her school are good2.571.072.531.061576−0.1810.8560.978
There is too much traffic on the roads/traffic goes too fast to make cycling safe2.131.252.061.291531−0.4580.6470.900
Drivers don’t give cyclists respect2.031.002.121.111561−0.2780.7811.000
He/she doesn’t own or have access to a bicycle4.161.183.781.401376−1.4160.1570.418
He/she has to carry too many bags/his/her bags are too heavy1.901.091.750.931499−0.6640.5070.772
It involves too much planning ahead3.401.253.081.261366−1.4110.1580.390
He/she is not able to fix minor mechanical issues (e.g., repair a puncture or adjust the brakes)2.651.182.041.131121−2.8810.0040.042
Travel to school by other means is more convenient2.031.111.710.921349−1.5800.1140.365
It is not convenient because of pre or after-school activities3.251.282.901.301359−1.4500.1470.428
He/she is not physically fit enough to cycle4.590.664.221.121354−1.6620.0970.343
He/she does not feel confident handling a bike4.081.043.571.361289−1.9060.0570.259
He/she would get too hot and sweaty if he/she cycled3.631.073.101.331242−2.1510.0310.201
He/she often feels too tired to cycle4.030.883.591.201297−1.8520.0640.256
His/her uniform does not lend itself to riding a bicycle3.521.242.021.30690−5.351<0.001<0.001
Cycling would ruin his/her hair especially if he/she wore a helmet4.240.823.531.291109−2.9850.0030.045
I am concerned of him/her being attacked by bullies or strangers on his/her way to/from school3.621.143.411.361495−0.6690.5030.805
It is uncool to cycle to school4.160.773.431.511242−2.1860.0290.230
He/she is too lazy to cycle4.111.003.611.281263−2.0550.0400.213
Walking is more sociable2.811.032.631.201381−1.3320.1830.390
M: Means, SD: Standard Deviation, U: Test statistic for Mann-Whitney U Test, Z: Standardised Test Statistic, Sig. (2-t): p-values for Mann-Whitney U Test, BH Adj.: p-values following Benjamini-Hochberg adjustments (bold values indicate statistical significance at the p < 0.05 level).
Table 7. Table showing numbers and percentages of students that indicated who chose/choose their means of travel to school by gender (n = 477 for primary school, n = 339 for secondary school).
Gender MeMy Parent(s)/Guardian(s)Total
Primary School
MaleCount69175244
% within Gender28.3%71.7%100.0%
FemaleCount53180233
% within Gender22.7%77.3%100.0%
TotalCount122355477
% within Gender25.6%74.4%100.0%
Secondary School
MaleCount8876164
% within Gender53.7%46.3%100.0%
FemaleCount74101175
% within Gender42.3%57.7%100.0%
TotalCount162177339
% within Gender47.8%52.2%100.0%
Publisher’s Note: MDPI stays neutral with regard to jurisdictional claims in published maps and institutional affiliations.

