1. Introduction
Following the UN Sustainable Development Goals, set in Agenda 2030, social sustainability has increasingly become a goal for urban policy and planning and for local and regional developmental strategies. Social sustainability is the least-developed dimension of the sustainable development discourse [
1], compared to environmental and economic sustainability. Still, there is an agreement that social sustainability implies values such as e.g., social inclusion, social interaction and participation, safety, and a sense of cohesion in local areas [
2,
3]. Sustainable social development thus indicates a process of change towards specific social values. However, due to “conceptualizations and definitional concerns,” assessment and measurement of social sustainability remains a challenge [
1]. Social capital, defined as “social networks, the reciprocities that arise from them and the value of these for achieving mutual goals” [
4] is viewed as a crucial part of social sustainability [
5,
6]. Therefore, developing or strengthening social capital could be seen as a means for how the process of sustainable social development could be shaped and assessed [
6,
7]. The concept of social capital is rather well defined and operationalized [
8], with significant contributions from scholars such as Robert Putnam [
9,
10] and Alejandro Portes [
11]; hence, it could be a useful indicator for measuring social sustainability. Social capital is also increasingly acknowledged as key in urban and local development for ensuring and assessing social sustainability. Accordingly, a neighbourhood high in social capital could be viewed as being socially sustainable. However, little is known about the processes through which local social capital is generated and how it changes over time [
12]. Most research has focused on the definition and function of social capital. In contrast, less emphasis has been put on how social capital could be developed, what institutional and political conditions facilitate its development, and how cultural changes influence the development of social capital [
13]. This study tries to fill this gap by using repeated measures of neighbourhood social capital to investigate how it changes over time and what factors exist that might influence the development of social capital, and thus social sustainability, in local areas.
There are some examples of studies reporting from interventions designed to strengthen social capital in local areas. These studies underline the importance of investments in the physical environment, such as setting up attractive meeting places [
14,
15], arranging requested and inclusive community activities [
16,
17], and ensuring access to local meeting places such as libraries and cafés [
18,
19]. These interventions focus on meso-level interactions for social capital to be strengthened in local communities.
A related question asks if and how neighbourhood social capital is influenced by the sociodemographic and socioeconomic composition of people living in an area. The economic literature has emphasised that community heterogeneity (racial and ethnic diversity and income inequality) tends to erode trust and reduce civic engagement (and hence social capital). Drawing on data from the World Values Survey and the European Values Survey on civic engagement over time in Western European countries, Costa and Khan [
20] found that high levels of ethnic heterogeneity were associated with lower levels of participation in various organisations in almost all countries. Interestingly, they found Sweden to be an exception with relatively high levels of civic engagement despite comparable high-income inequality and ethnic heterogeneity [
20]. Whether this pattern holds at local and neighbourhood levels in the Swedish setting remains unknown. Further, a study from Philadelphia, USA [
21] found that neighbourhood social capital was associated with racial composition (higher levels of social capital in neighbourhoods with less than 50% black residents) and socioeconomic disadvantage (lower levels of social capital in neighbourhoods with a high proportion of people with low income and low educational levels). However, since social capital is context-specific, these patterns may differ in various community contexts and at different spatial levels (national vs regional, municipal, and neighbourhood). Thus, further explorations on how the composition of people influences the development of social capital and social sustainability in different settings are needed, not least in local areas where urban planning and policy for social sustainability take place. In addition, most research on social capital tends to be cross-sectional, making it hard to rule out causal inference and changes over time. This current study contributes to further understanding the factors that may influence social capital development in local areas, by measuring social capital changes over time in 46 neighbourhoods in northern Sweden.
Given its multidimensional and context-specific feature, the measurement of social capital and comparability between studies pose a challenge. Social capital consists of different dimensions (structural and cognitive) and forms (bonding, bridging, and linking) and can be measured at the individual, family, organisational, as well as area levels [
8,
22]. In addition, area-specific social capital can be simultaneously conceptualized at different levels such as national, regional, municipal, and neighbourhood levels, which is why the level of analysis (spatial scale) needs to be carefully considered in any study. An association that holds true at the country level might not be valid at the neighbourhood level, and vice versa. The effect of social capital on, e.g., well-being, might also differ between various contexts. Based on national data from the Netherlands, Mohnen et al. [
23] found a stronger positive health effect of area-specific social capital in urban areas than in rural areas, even though the overall level of social capital was lower in the city. The authors [
23] claimed that these results support the hypothesis that access to social capital does not necessarily imply actual benefits from it.
Many studies so far have used aggregated individual data on trust and social participation to measure area-specific social capital, but the need for indicators that relate more clearly to the local area have been raised [
22,
24,
25]. In the present study, we used a previously developed instrument to measure neighbourhood social capital based on questions related to people’s perceptions about social values in their neighbourhoods [
26]. This instrument was previously used in a baseline survey from 2006 with the same neighbourhood division. In this follow-up study, we analysed the development of social capital in the same neighbourhoods over 14 years.
In sum, in this study we used repeated measures of neighbourhood social capital in urban and rural neighbourhoods in a municipality in northern Sweden, as an indicator for social sustainable development. The overall aims were to examine changes in neighbourhood social capital in relation to neighbourhood-level sociodemographic and socioeconomic characteristics over time and to draw out implications of these findings for local policies aiming to strengthen social capital for socially sustainable development.
In the next section, we present the study context and the linkages of data from the social capital surveys in 2006 and 2020 and the Swedish register data, which provide the ecological, neighbourhood-level social capital, sociodemographic, and socioeconomic data employed in this study. In the results section, we map the distribution and changes in neighbourhood social capital in choropleth maps and analyse sociodemographic and sociodemographic factors associated with neighbourhood social capital. Next, we discuss and contextualise the positive and negative changes in neighbourhood social capital and its associated factors observed in this study. Finally, we reflect upon the strengths and the weaknesses of the study and its implications for local policies aiming to strengthen social capital for socially sustainable development.
3. Results
Table 1 summarizes the sociodemographic, socioeconomic, and social capital characteristics in urban and rural neighbourhoods in Umeå Municipality in 2006 and 2017. Over 11 years, the proportion of households in urban and rural areas with at least one adult with a high level of education, one foreign-born member, older pensioners, and the mean disposable income increased. There were no marked changes in the proportion of households with children under 12 years old. In contrast, the proportion of households that received cash welfare benefits or unemployment benefits, and those with single parents, decreased during the same period. On average, the proportion of individuals in urban and rural neighbourhoods who reported that neighbours talk to each other, help each other, are involved in issues concerning the place, and care for each other changed only marginally during the same period. The proportion of individuals in urban and rural areas responding that neighbours care for and help each other was higher in 2017 compared to 2006, indicating an overall increase in some of the social capital indicators in Umeå Municipality over time.
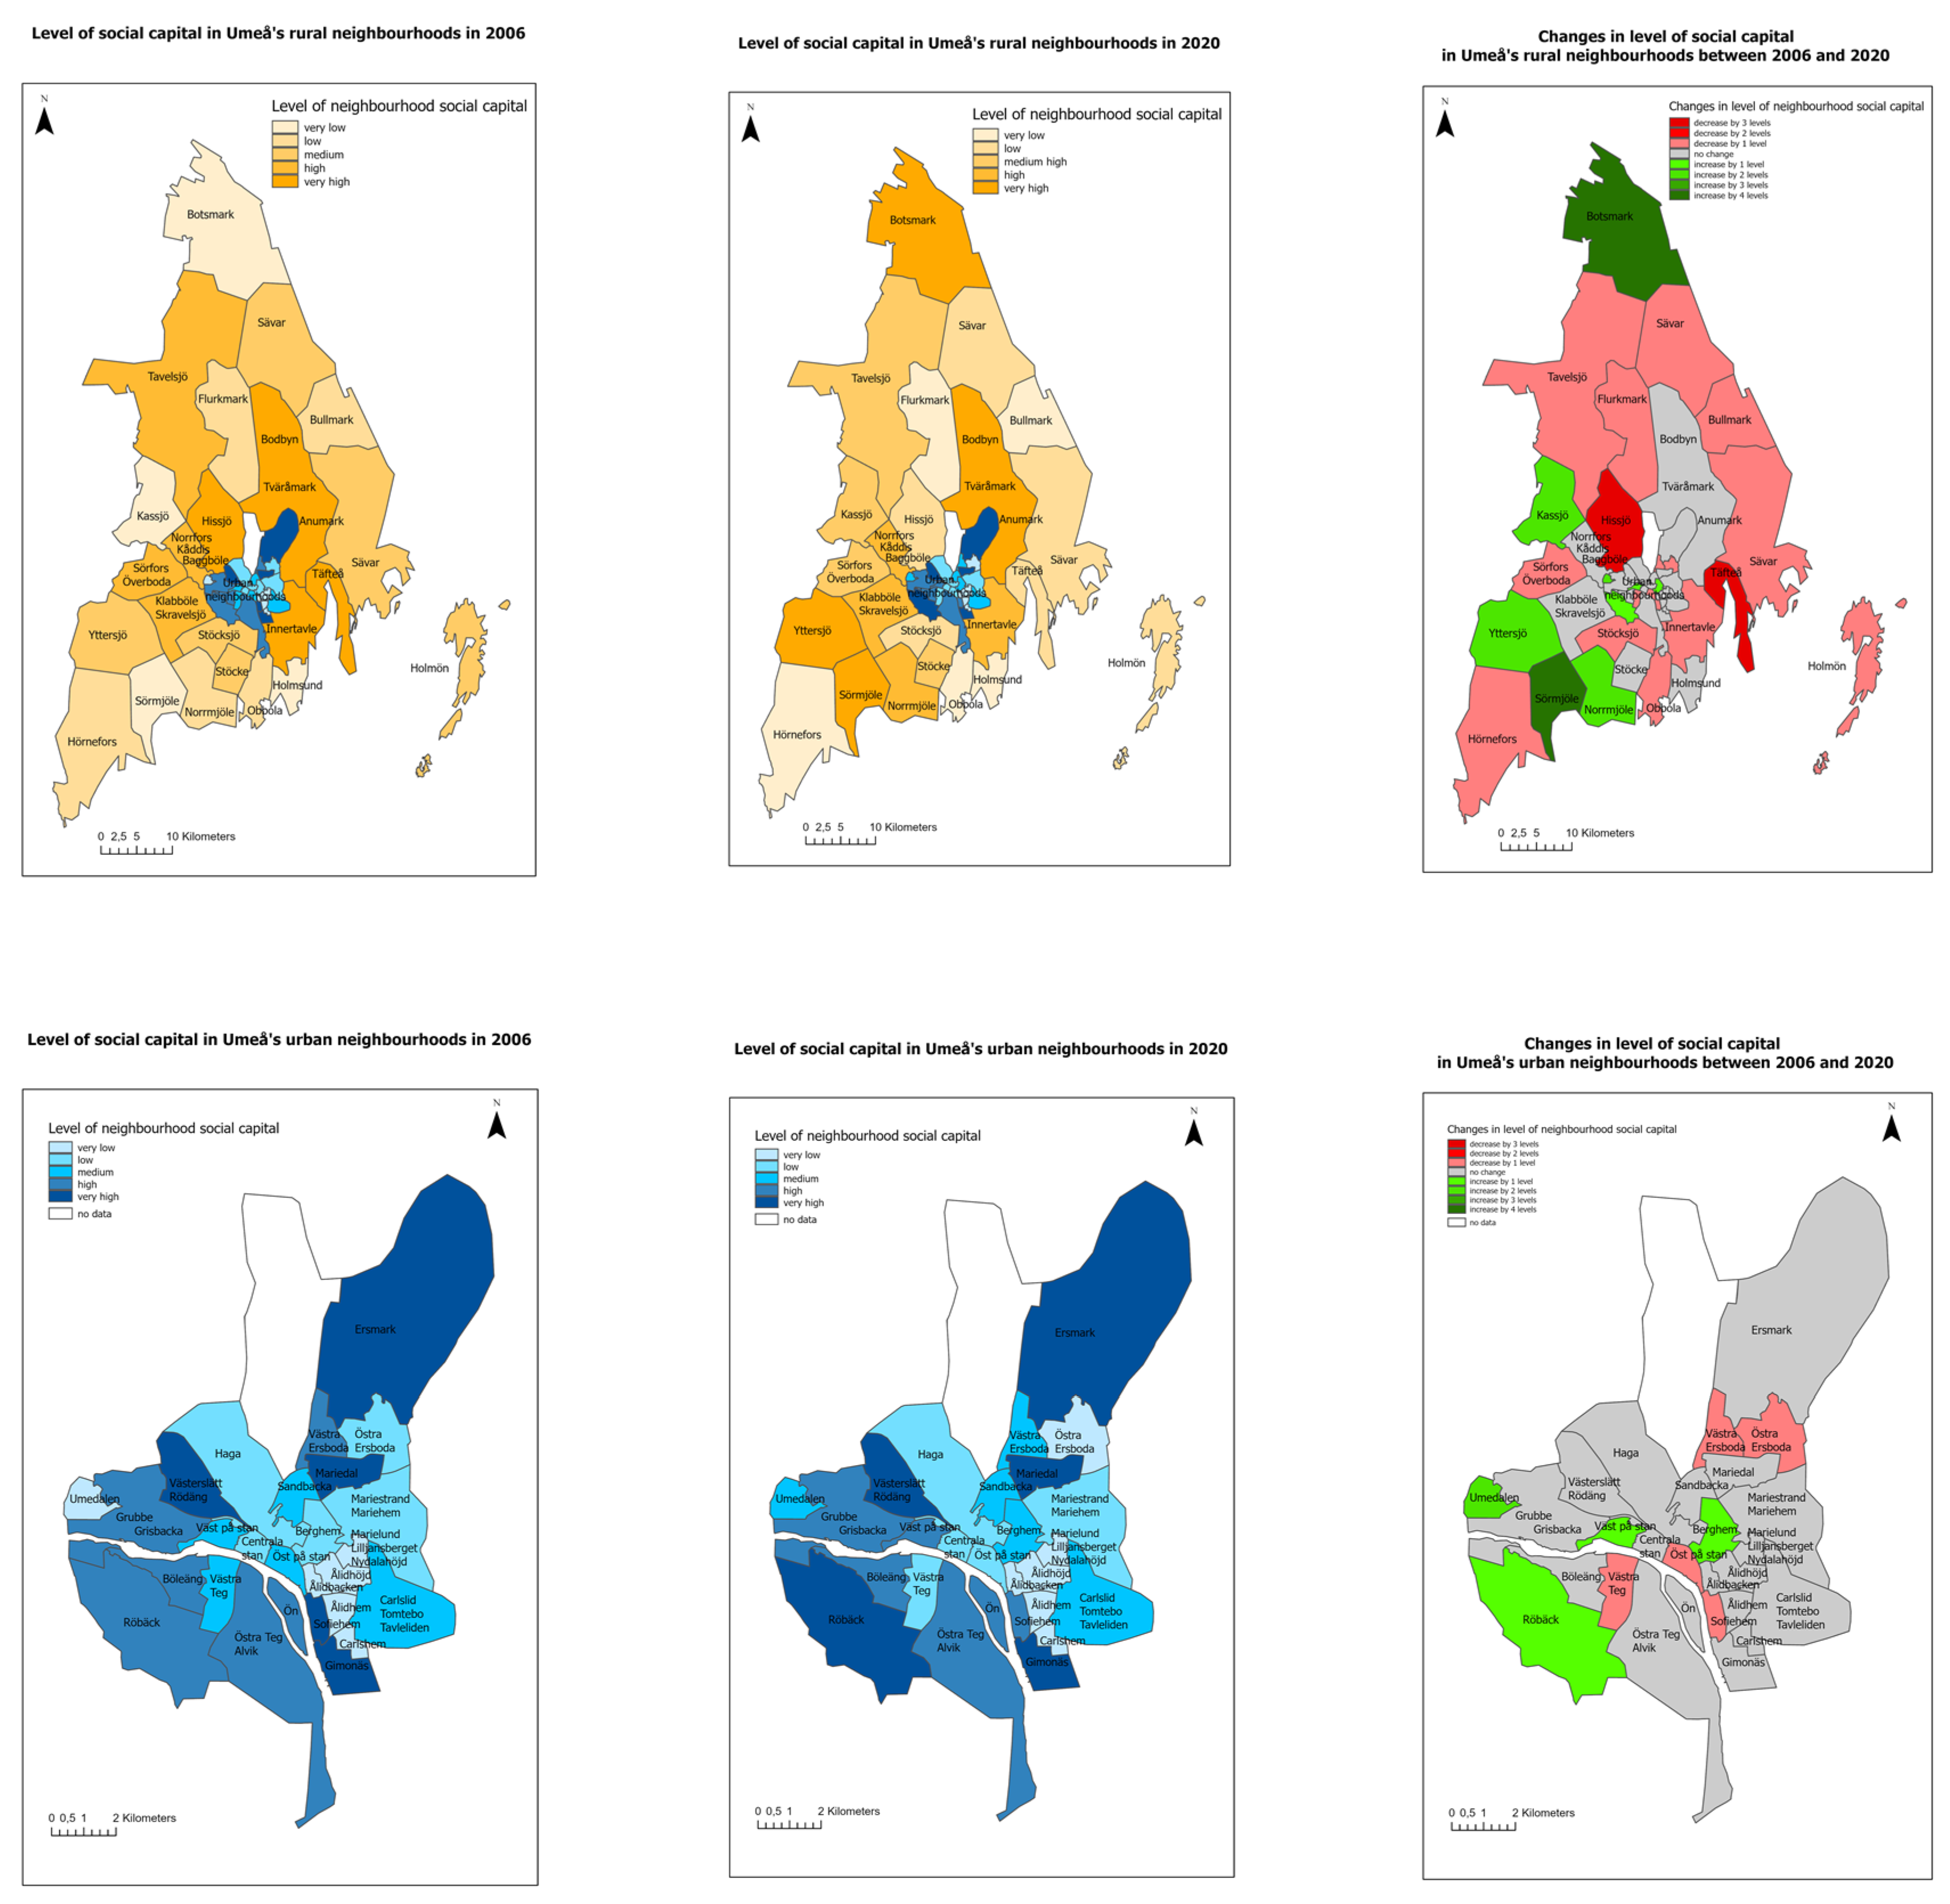
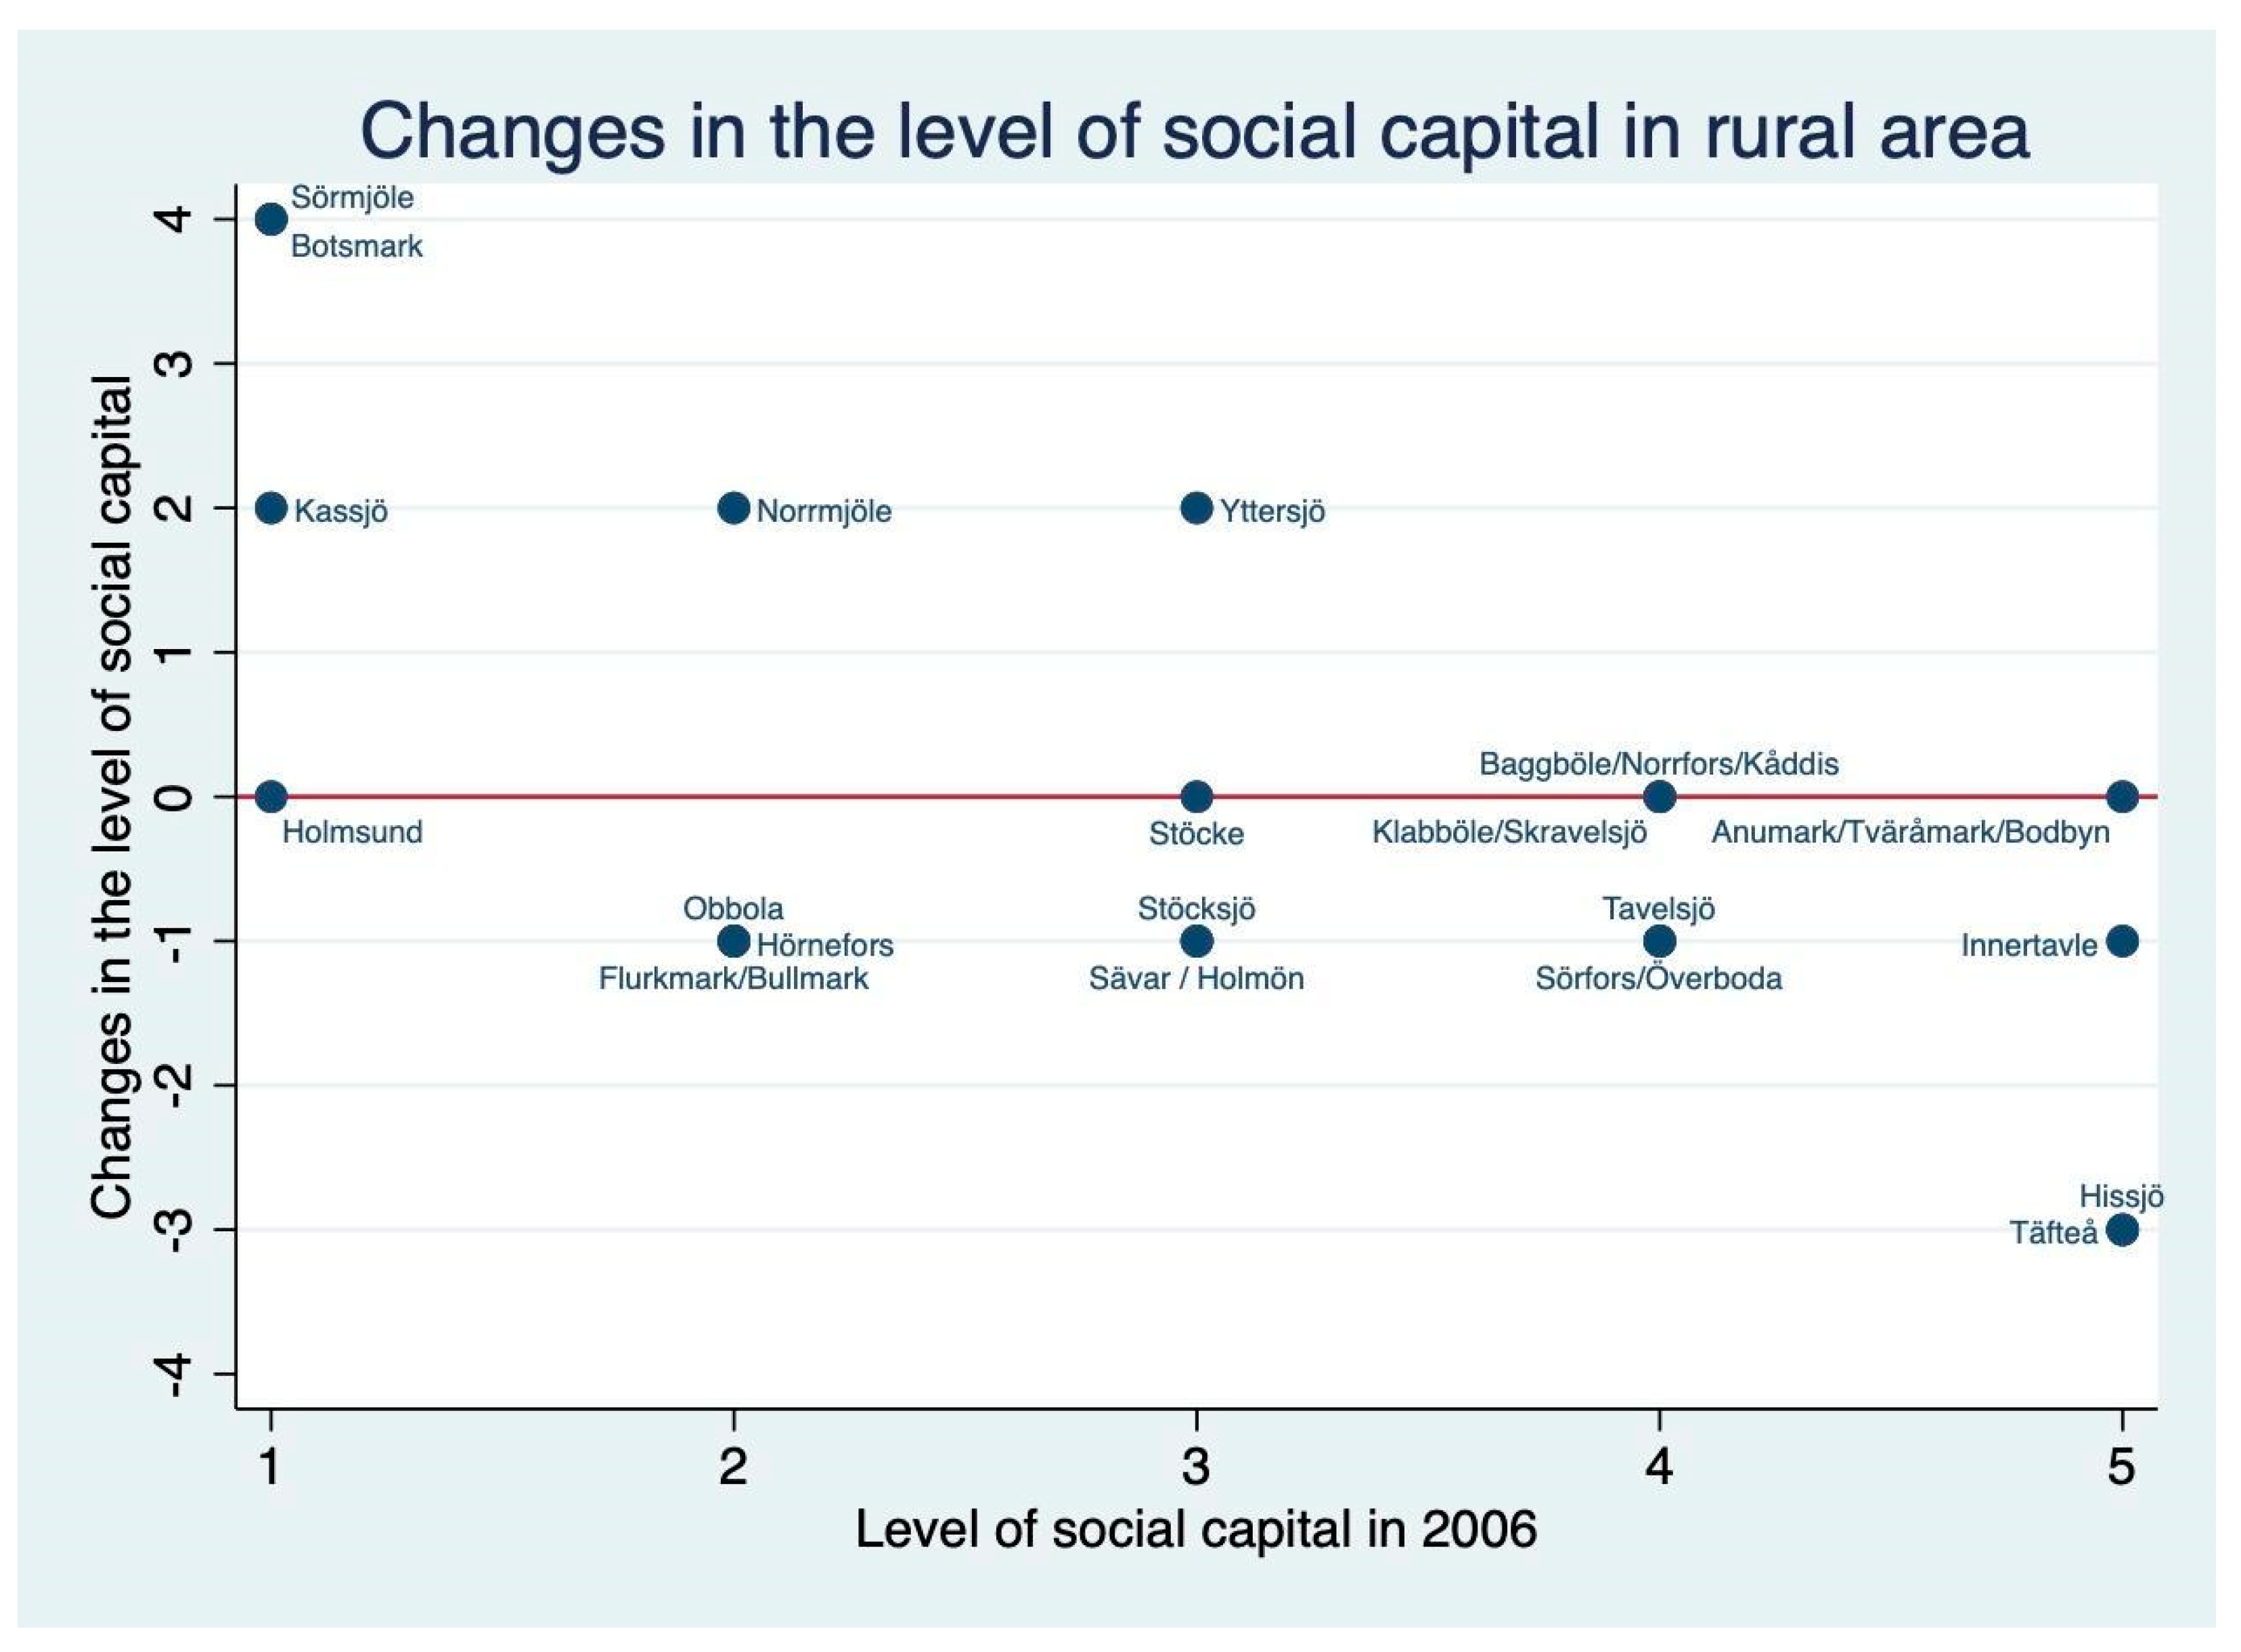
Figure 1 shows the spatial distribution of the five levels of neighbourhood social capital in urban and rural areas in Umeå Municipality in 2006 and 2017. Almost half of the neighbourhoods, and especially those in the urban area, were categorised into the same quintile in terms of their level of social capital at the two different points of observation (
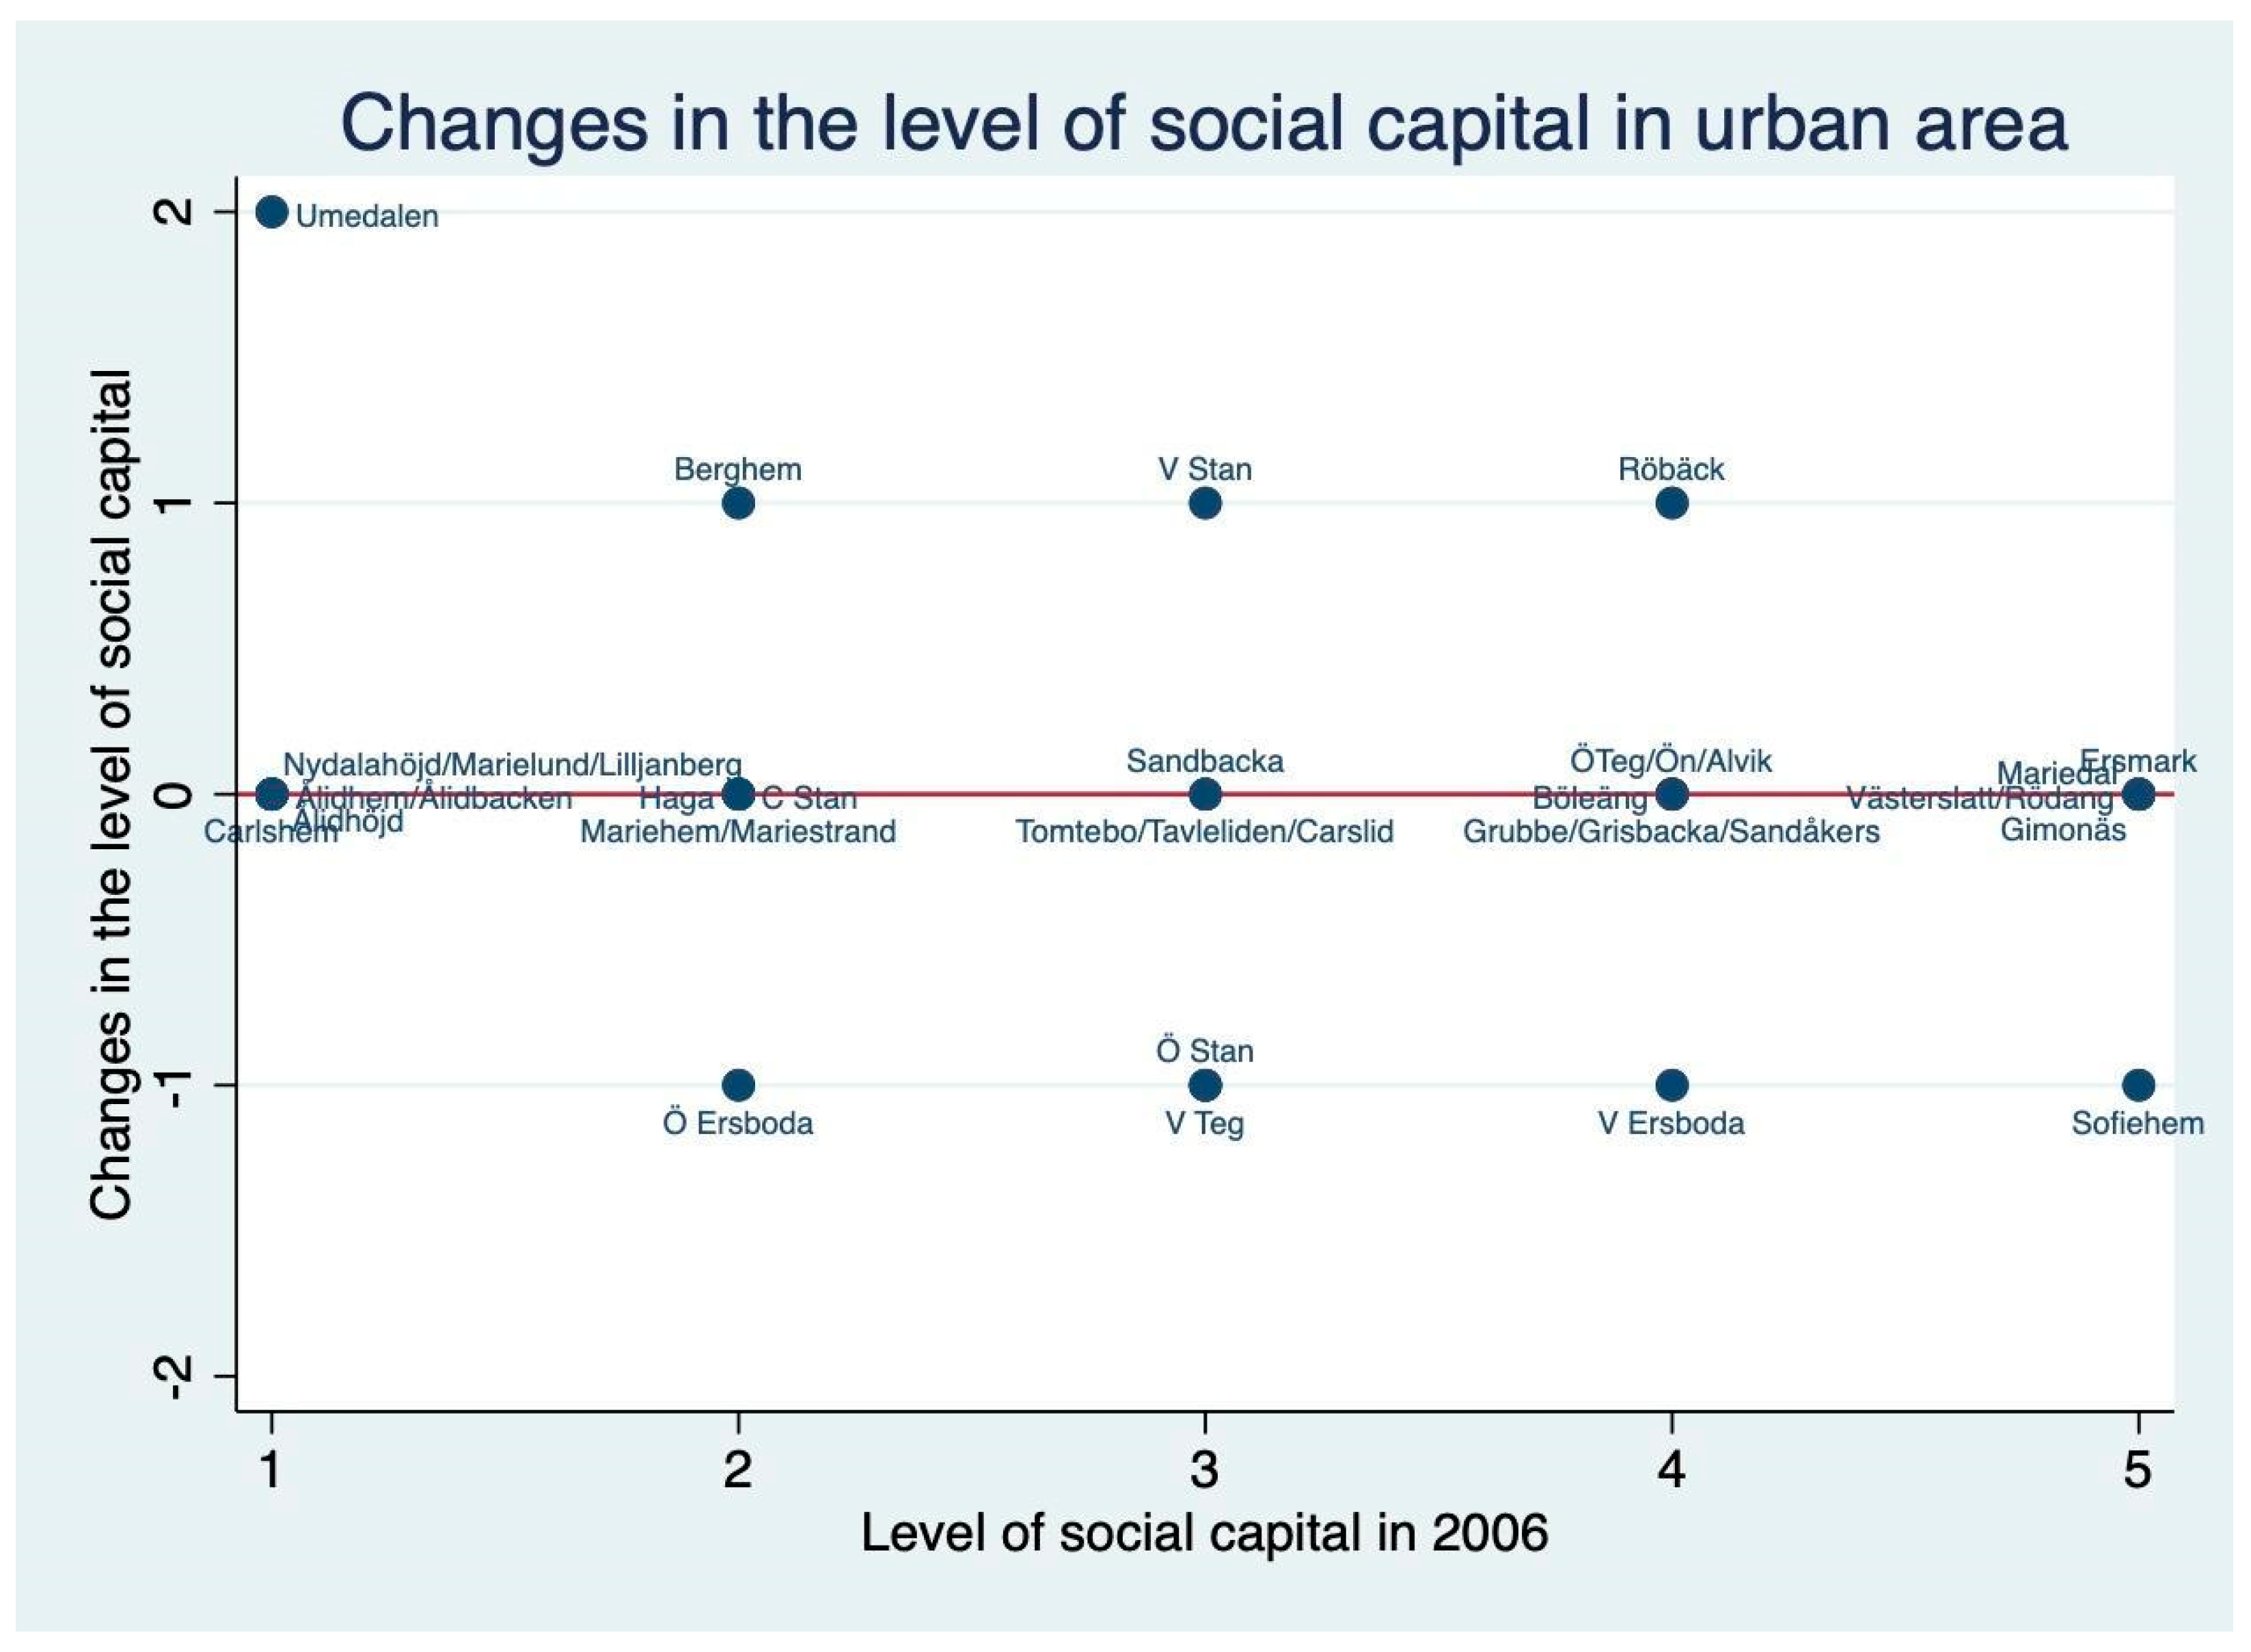
Appendix A). Only one neighbourhood in the urban area, Umedalen, moved by two quintiles, from being at the lowest quintile of (very low) social capital in 2006 to the third quintile (medium social capital) in 2017. Otherwise, the other neighbourhoods with changes in their levels of social capital either moved up or moved down by one quintile of the level of social capital. In contrast, in the rural area, some neighbourhoods moved up by two or even four quintiles (Botsmark and Sörmjöle moved from being in the lowest quintile with very low social capital in 2006 to the highest quintile, very high in 2017). Some neighbourhoods, such as Täfteå and Hissjö, had lower levels of social capital in 2017 (they moved from the fifth quintile, high, in 2006 to the 2nd quintile, low, in 2017). In total, four of the urban neighbourhoods increased their levels of social capital, while five neighbourhoods decreased their social-capital levels. In the rural areas, five villages increased their social-capital levels, while ten villages decreased their social-capital levels (
Appendix A).
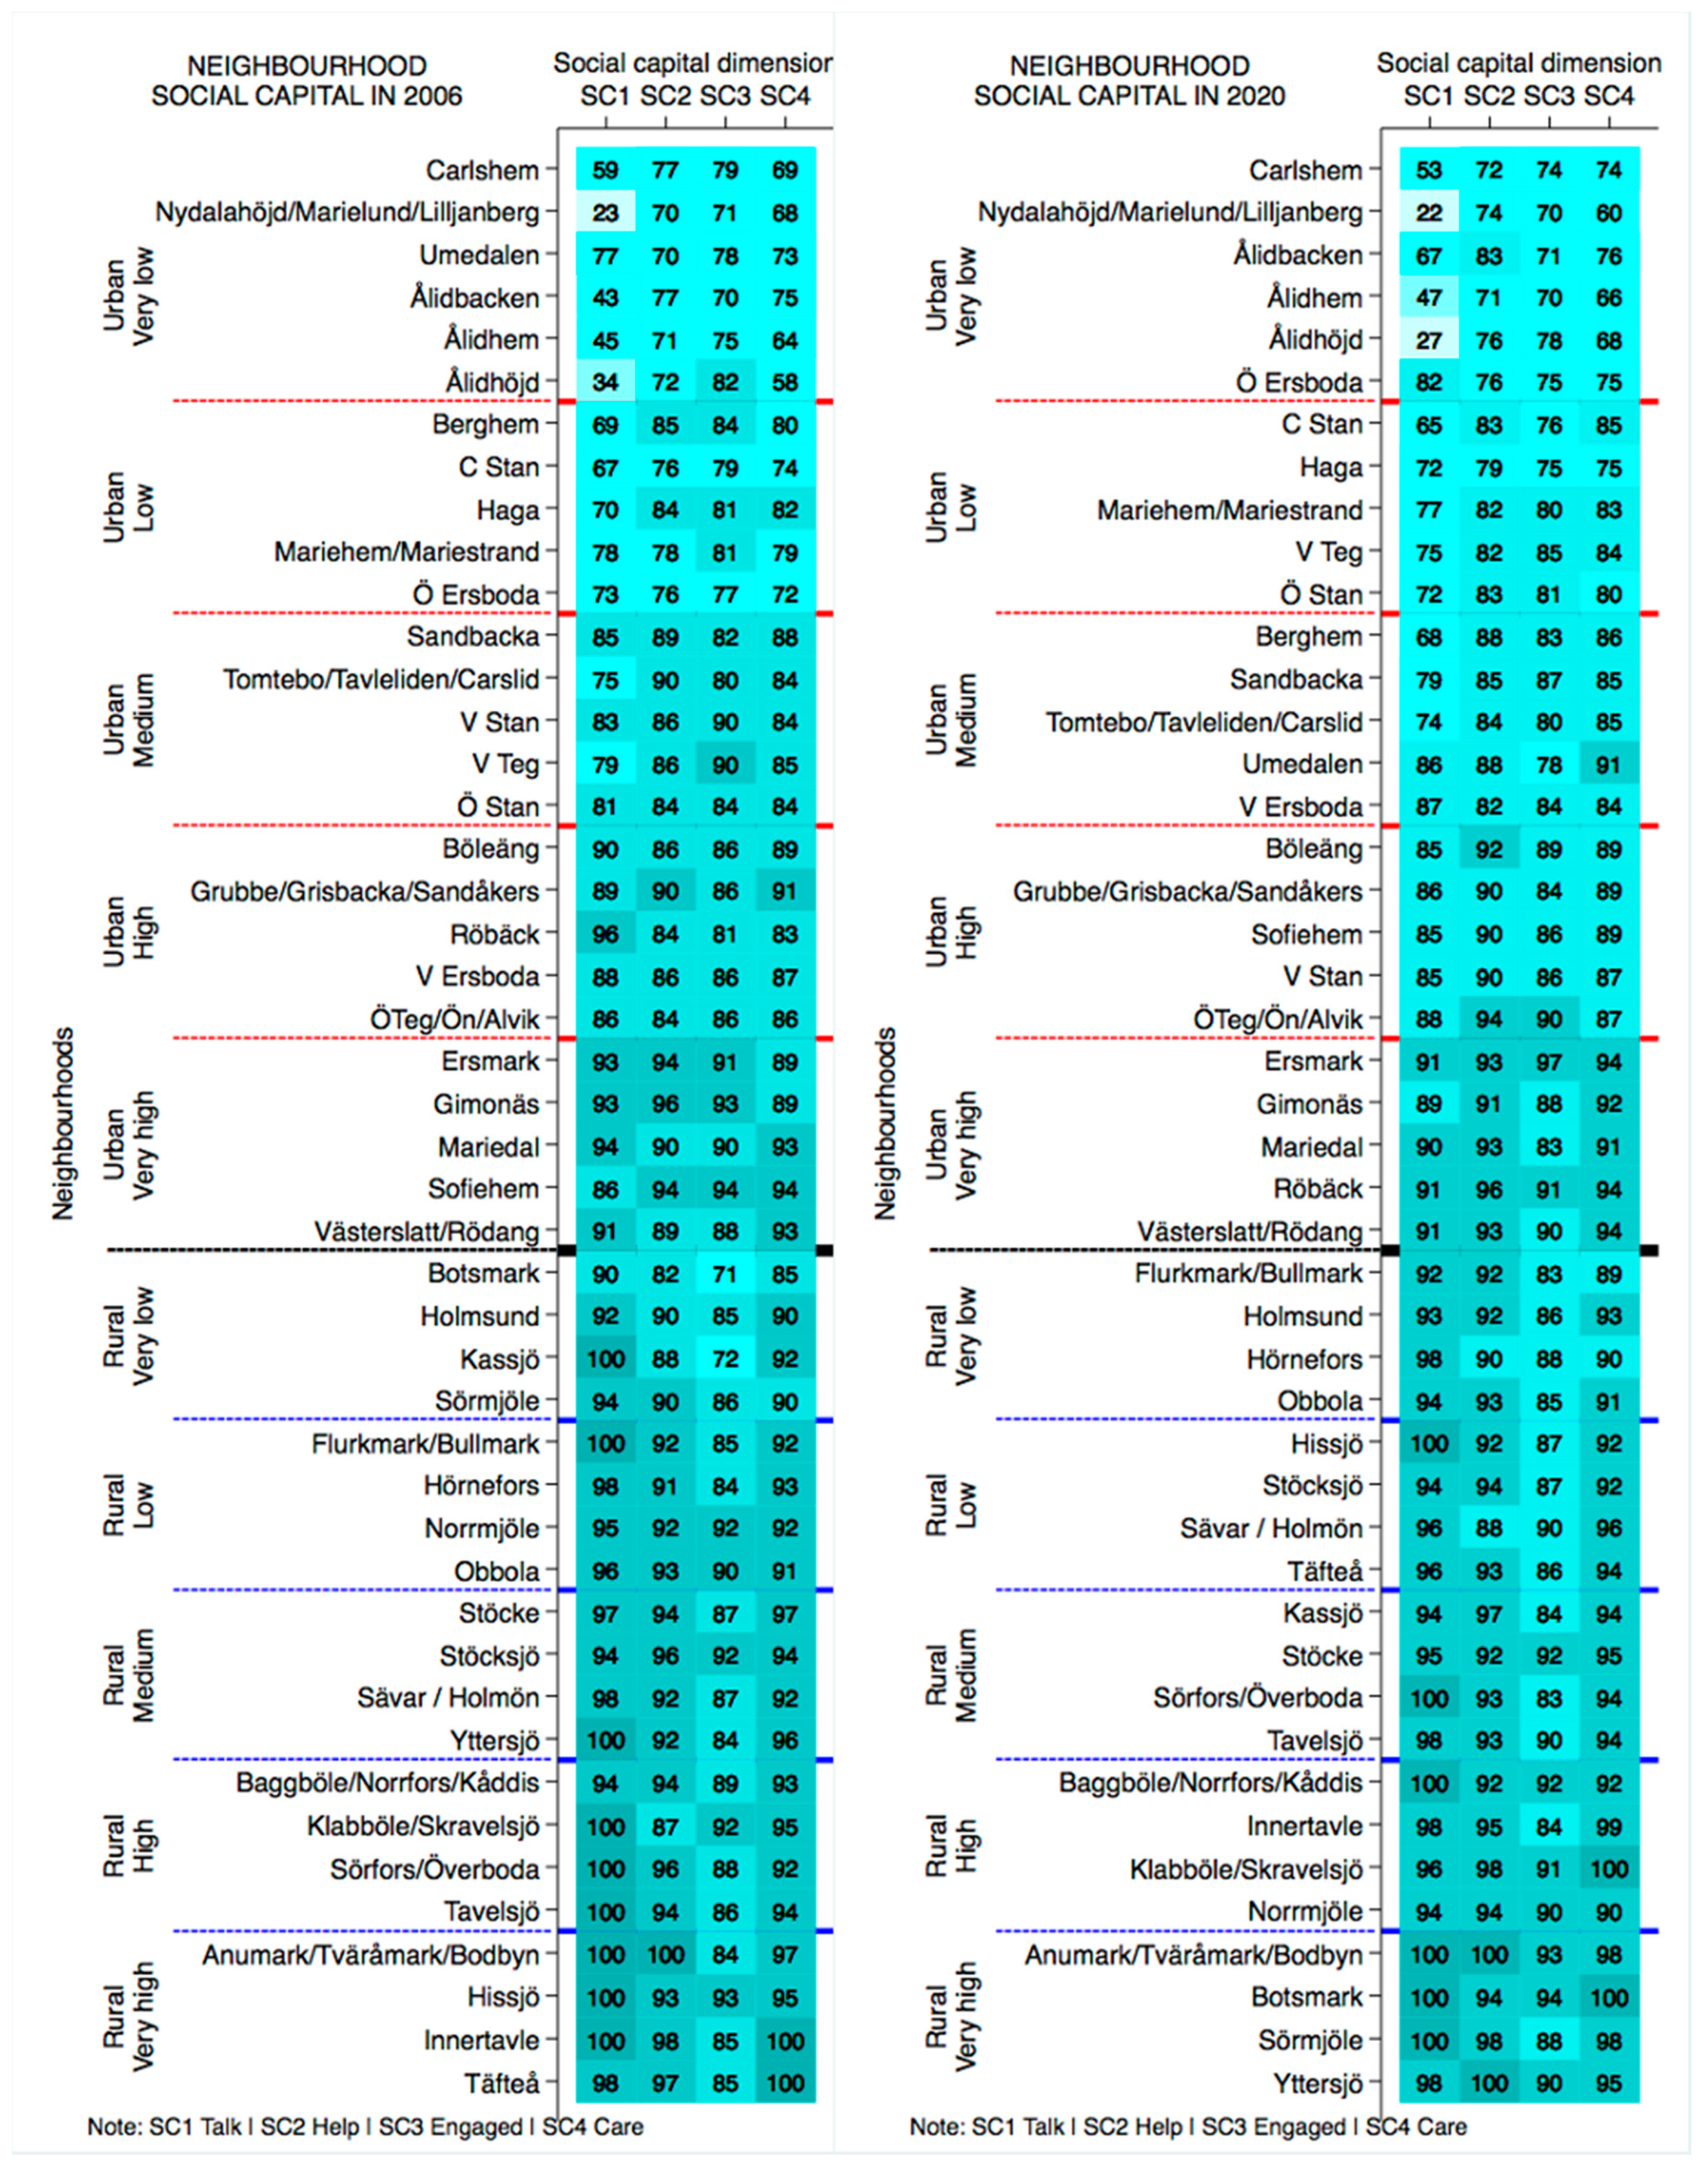
Appendix B shows the five levels of social capital in urban and rural neighbourhoods in 2006 and 2017, with the corresponding distributions of responses to the four social capital indicators (neighbours talk, neighbours help, expected to be involved, and neighbours care). The darker gradient colours represent a higher proportion of responses to the questions. As expected, a higher proportion of people in rural neighbourhoods responded positively to these indicators. It is important to note that even if a neighbourhood moved up or down in the overall social capital level (which was derived as a composite estimate of all the indicators), average responses to a single indicator might show a reverse pattern. For example, Ö Ersboda changed from being categorised as a neighbourhood with low social capital in 2006 to very low social capital in 2017. Looking at the single indicator, however, the proportion of respondents who reported that neighbours talked to each other increased from 73% in 2006 to 82% in 2017.
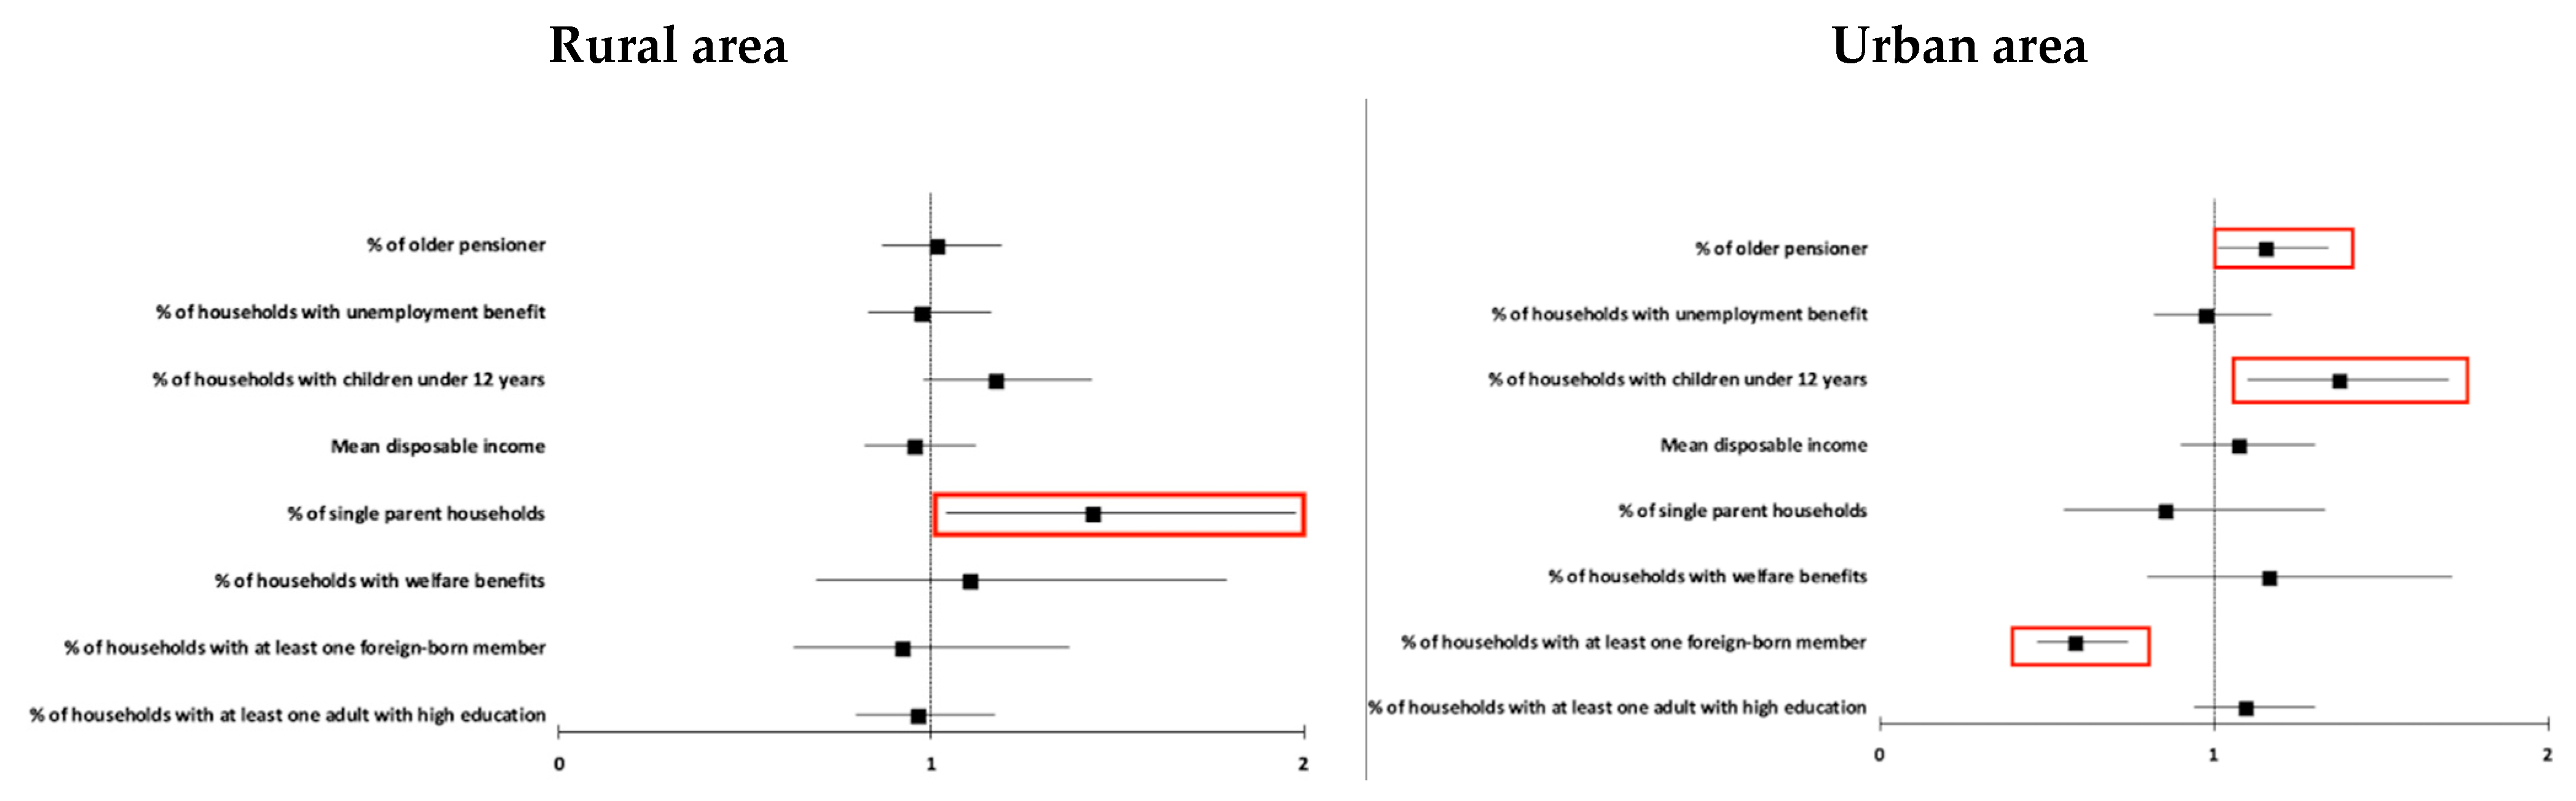
Figure 2 presents the odds ratio of an urban or rural neighbourhood having a higher level of social capital based on their socioeconomic and sociodemographic characteristics. In the urban area, having a higher proportion of households with older pensioners (OR = 1.16, 95% CI = 1.01–1.34) or children under 12 years old (OR = 1.38, 95% CI = 1.11–1.70) were significantly associated with the probability of having a higher level of social capital. In contrast, the higher the proportion of households in a neighbourhood with at least one foreign-born member, the lower the probability of the neighbourhood being classified as having a higher level of social capital. A one percentage point increase in the proportion of households with at least one foreign-born member was associated with a 41% lower probability of the neighbourhood being classified as having a higher level of social capital. None of the sociodemographic and socioeconomic variables in the rural area was associated with the probability of a higher level of social capital, except for the proportion of single-parent households. A one percentage point increase in the proportion of single-parent households was associated with a 44% higher odds for the neighbourhood to be classified at a higher level of social capital (OR = 1.44, 95% CI = 1.04–1.98). As shown in
Table 1, the proportion of households with older pensioners and at least one adult not born in Sweden increased by several percentage points in urban and rural areas between 2006 and 2017. In contrast, there were only marginal changes in the proportion of households with children under 12 and single-parent households.
While
Figure 2 indicates the odds ratio of a neighbourhood having a higher level of social capital, it does not provide details for each quintile, presented in
Figure 3 and
Appendix C.
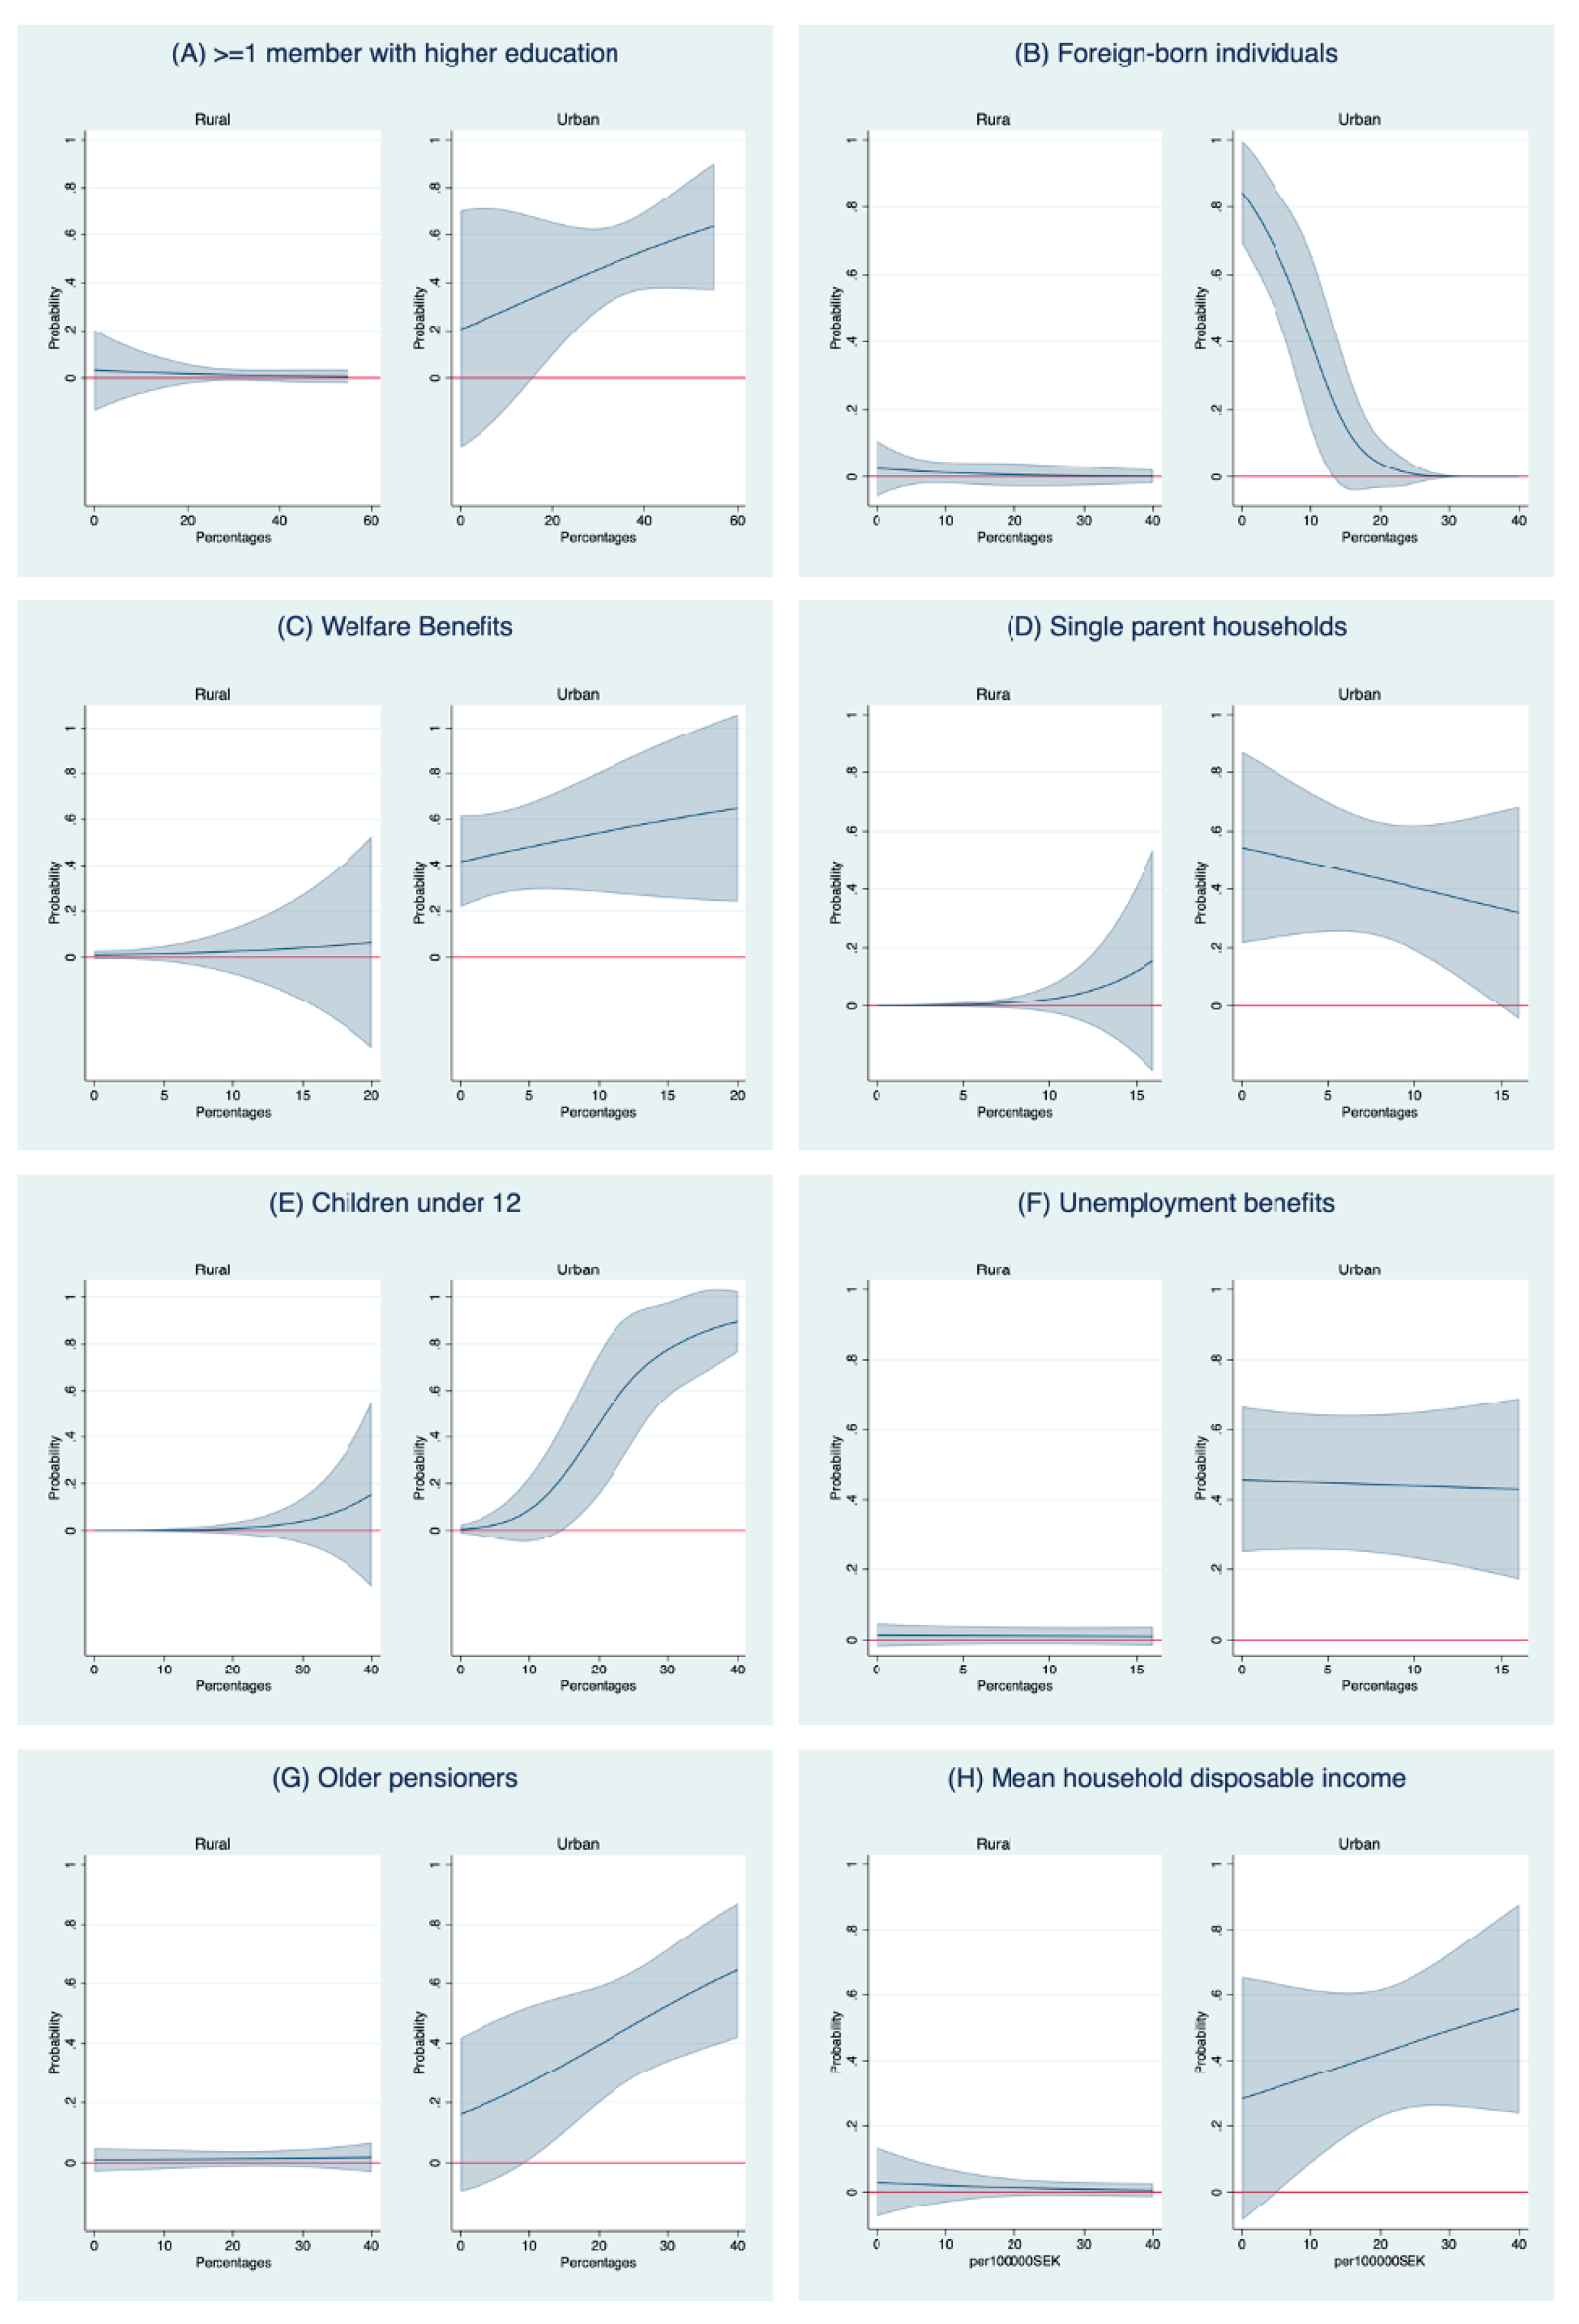
Figure 3 illustrates the probability of belonging to the fifth quintile of neighbourhood social capital (very high) based on different sociodemographic and socioeconomic characteristics. A more complete version of the graph with a probability of belonging to all the five different quintiles is presented in
Appendix C. None of the results of the fifth quintile in rural areas were significant. In urban areas, the higher the proportion of households with at least one adult with a high level of education, receiving cash welfare benefits, with children under twelve, with older pensioners, or with higher household disposable income, the higher the probability that the neighbourhoods were classified in the highest quintile of social capital, i.e., very high social capital. Meanwhile, the higher the proportion of households with at least one foreign-born member or of single-parent households, the lower the probability of a neighbourhood being classified in the highest quintile of social capital.
4. Discussion
This study examined changes in social capital in 46 urban and rural neighbourhoods in Umeå, a fast-growing municipality in northern Sweden, as a proxy for social sustainable development in the study setting. We analysed whether neighbourhood-level sociodemographic and socioeconomic changes were correlated with changes in neighbourhood social capital. To our knowledge, only a few studies have used repeated measures of social capital in local areas. Thus, our study contributes insights into how social capital changes over time in local areas and the factors influencing its development. This knowledge can guide local policies that aim to strengthen social capital to ensure sustainable social development. However, further research from various cultural contexts on how neighbourhood social capital and social sustainability change over time in local areas are needed, in order to examine if our results are valid in other settings.
4.1. Changes over Time in Social Capital and Socioeconomic and Sociodemographic Factors
Overall, our results show a positive development of social capital in Umeå Municipality during 2006–2017. On average, in both urban and rural areas, the proportion of people responding that neighbours care for and help each other was higher in the 2020 survey compared to the 2006 survey. The other social capital components changed only marginally over time. These findings mirror the results in the European Social Progress Index, showing that the region of northern Sweden (in which Umeå Municipality is located) had the highest score with regards to social development and quality of life, compared to other regions in Europe, in 2016 as well as in 2020 [
35]. However, the EU Social Progress Index measures social progress at the overall regional level. At the same time, our results illustrate changes in social progress (social capital) over time at a lower hierarchical spatial level (see [
36]). At the municipal level, this overall positive trend suggests that municipal strategies to ensure social sustainable growth have been relatively successful. Among other things, the municipality set up a commission for a socially sustainable Umeå, tasked with analysing differences in living conditions between groups and geographic areas and providing concrete measures for sustainable social development throughout the municipality [
37]. On the other hand, the results also show how positive socioeconomic development accompanies the overall positive development of social capital. Over the study period, the proportion of households with at least one adult with higher education and mean disposable income increased across both urban and rural neighbourhoods. During the same period, the proportion of households receiving cash welfare benefits and unemployment benefits decreased. Our findings indicate an overall positive association between economic security and social capital at the municipal level, as suggested by others [
10,
38].
However, the overall positive trend in social capital over time in Umeå Municipality was not consistently observed in all neighbourhoods. Our results show that 15 out of the 46 neighbourhoods (five urban and ten rural neighbourhoods) had a negative development of social capital over the 14 years. These findings indicate that municipal strategies to strengthen social capital to ensure social sustainability should balance municipal and neighbourhood needs, which may vary. Thus, interventions might need to be designed differently in different neighbourhoods to achieve sustainable social development in the whole municipality.
Overall, the levels of social capital were higher in rural compared to urban neighbourhoods. The proportion of individuals reporting that neighbours talk, help each other, are involved in issues concerning their place, and care for each other was higher in rural than urban neighbourhoods. More than 95% of the participants in rural areas reported that neighbours talked to each other compared to around 75% in urban areas. Population density has been previously linked to lower probability of neighbours interacting with one another [
39]. In smaller rural areas, it may be more natural for people to know each other and talk to each other (or to depend on each other for daily support), whereas denser urban settlements tend to produce fewer neighbourly interactions. Other studies have also indicated that social capital is generally higher in rural compared to urban areas [
10,
23,
40], especially bonding social capital [
41]. However, higher levels do not necessarily mean that people living there benefit from it [
23].
Further, our results support previous research suggesting that social capital is a relatively stable characteristic in local areas that does not fluctuate too much over time, at least not in a relatively stable society [
10,
33,
42]. Almost half of the 46 neighbourhoods retained their same social capital rank over 14 years, while 9 neighbourhoods increased in social capital rank, and 15 neighbourhoods decreased in social capital rank. Still, it is not unreasonable to believe that social capital fluctuates more in municipalities with rapid population growth, such as Umeå: however, this warrants further investigations.
We completed our follow-up survey in early spring 2020, just before the outbreak of the COVID-19 pandemic. To understand how the pandemic situation—with social restrictions such as staying at home and avoiding physical contact with other people—might have affected local social capital, we conducted a subsequent telephone survey (during June–November 2020) among a sub-sample (i.e., non-responders to the 2020 survey) of those who participated in the baseline survey in 2006 [
43]. Contradicting other studies that argued that the COVID-19 pandemic erodes social capital [
44], our results showed that neighbourhood social capital increased during the pandemic, particularly in high-social-capital neighbourhoods. Our results are thus in line with previous research showing that neighbourhoods and societies with high levels of social capital tend to be more resilient, facilitate adaptation processes, and recover more easily (see, e.g., [
45,
46,
47]). However, the spatial scale is important to consider. It is not unlikely that a societal crisis such as a pandemic could lead to a decrease in trust in authorities and politicians at the national level and at the same time increase trust, help, and support between neighbours in local areas, because people feel that one need to “stick together” to protect each other.
4.2. Factors Associated with Positive Changes in Neighbourhood Social Capital
Our main finding in this study was that higher levels of neighbourhood social capital are associated with specific sociodemographic factors, but these factors differ in urban and rural areas. In urban neighbourhoods, the probability of having higher social capital increased significantly with a higher proportion of households with older pensioners and households with children under 12 years in the neighbourhood. These results indicate that social capital is higher in areas where people spend their time since one could assume that families with children under 12, and retired people, are more bound to their living area and thus spend more time in their neighbourhoods compared to people of working age. It is reasonable to believe that people who spend time in their neighbourhood are also more likely to contribute to the neighbourhood’s social climate. In line with this, a Dutch study about social capital, neighbourhood attachment, and participation concluded that older residents were more likely to participate in civic activities [
48].
In rural neighbourhoods, the proportions of retired people and children under 12 were not associated with higher levels of social capital. Instead, a higher proportion of single-parent households was associated with higher levels of neighbourhood social capital in the rural areas, which is harder to interpret. This contradicts the conventional view that single parents tend to be socially isolated from the mainstream of society. However, Sweden has the highest proportion of single-parent households within the EU, with 34% of all households with children [
49]. Stavrova and Fetchenhauer [
50] compared well-being among single and partnered parents in 43 European countries. They found that, in individualist countries in which single-parent families were a socially acceptable practice (e.g., the Scandinavian countries), single parents did not report a lower level of well-being than partnered parents. Thus, it might be that the high proportion of single-parent households in Sweden, in combination with the overall organisation of the welfare state with, e.g., proportional costs for childcare, makes single parents less excluded from social life. Further, the proportion of households with children under 12 was considerably higher in rural areas (around 24%) compared to urban areas (around 14%). Therefore, social interaction in rural areas could potentially be more centred around family relations, with less room for engagement in the neighbourhood/village as a whole. Thus, single-parent households in rural areas might need to reach out to the broader village to mobilise help and support. These actions, in turn, might create a social environment that positively influences social capital in the whole village. A study from Austria [
51] on urban–rural differences in social capital found that people in rural areas reported more family contacts, while people in urban areas reported more contact with friends. In sum, our study shows that social capital might operate differently between different spatial areas in the same municipality. Thus, interventions aiming to strengthen social capital to ensure social sustainability in local areas need to carefully consider the specific local context in order to adjust and plan the intervention in line with the specific needs and conditions of the intervention setting.
Further, our findings demonstrate that higher levels of neighbourhood social capital are mainly associated with sociodemographic rather than socioeconomic factors. None of the socioeconomic neighbourhood factors, i.e., mean of household income, reception of welfare or unemployment benefits, or education level, were significantly associated with having higher levels of neighbourhood social capital. It might be a characteristic of the Swedish welfare state that the overall high level of social security translates to the absence of a linkage between socioeconomic disadvantage and social exclusion, unlike less-generous welfare states such as the USA or Japan.
However, when we estimated the subsequent probability of belonging to different quintiles of neighbourhood social capital, we observed some significant (and unexpected) results in some of the factors in the urban area. For example, the higher proportion of households receiving cash welfare benefits, the higher the probability of belonging to the fifth (very high) quintiles of neighbourhood social capital. Thus, our results do not fully support the idea that high levels of neighbourhood social capital require a socioeconomic prosperous environment, as suggested by others [
21]. Even neighbourhoods with a high proportion of households receiving cash welfare benefits (indicating a very low income level) had very high social capital. In our study setting, the sociodemographic composition of people in a neighbourhood, rather than their socioeconomic position, influenced neighbourhood interactions, help, and support (i.e., social capital).
4.3. Factors Associated with Negative Changes in Neighbourhood Social Capital
In rural neighbourhoods/villages, none of the sociodemographic and socioeconomic variables were negatively associated with levels of social capital. On the contrary, in urban neighbourhoods, an increase in the proportion of households with foreign-born adult members was significantly associated with a decrease in the likelihood of having higher social capital, even after controlling for all other sociodemographic and socioeconomic variables. This finding is in line with other (contested) studies that have found that ethnic diversity obstructs social capital development [
20,
21,
52]. One proposed explanation is that people tend to have lower trust in people dissimilar to themselves in terms of income, religion, or ethnicity [
53], thus eroding social capital. Consequently, neighbourhood interactions could be harder to develop when people differ regarding ethnicity since “birds of a feather flock together” [
54]. Putnam’s [
52] contested study, based on data from 41 different communities in the US, found that people in ethnically diverse communities tended to withdraw from both bonding (with similar people) and bridging social networks, thus eroding social capital in general. Putnam’s claim, known as the “constrict claim,” was later tested on the country level in Europe. Gesthuizen, van der Meer, and Scheepers [
55] found no support for Putnam’s hypothesis in European societies. Instead, the authors concluded that economic inequality and the national history of democracy in European societies were more critical for explaining cross-national differences in social capital in Europe.
Results about the negative influence of ethnic diversity on social capital and cohesion have been criticised for not considering how low socioeconomic status influences social interactions [
56]. Another concern is that these results could be used to encourage homogeneity and anti-immigrant policies rather than policies to encourage “strength in diversity” [
56]. These conclusions and solutions could have detrimental effects since there is strong evidence for how increased opportunities for interethnic contact facilitate interethnic interactions, which stimulate both out- and in-groups’ trust and trust in neighbours [
57].
Van de Meer and Tolsma reviewed 90 studies from different countries about the effect of ethnic diversity on social cohesion [
57]. In line with our results, they found a consistent association between high ethnic heterogeneity and lower levels of within-neighbourhood social cohesion. In contrast, they did not find any support for a negative association between ethnic heterogeneity and inter-ethnic cohesion. They [
57] discuss that this finding supports the notion that ethnic diversity increases opportunities for interethnic contacts, which further increases interethnic trust and thus social cohesion. Further, beyond the spatial level of neighbourhoods, e.g., on a country level, they did not find any consistent evidence that ethnic heterogeneity is negatively associated with social cohesion. The authors [
57] discuss that this could potentially be explained by ethnic heterogeneity obstructing the sense of shared social norms in the neighbourhood, which creates uncertainty about how to socially interact with neighbours. However, this uncertainty does not spill over to decrease social cohesion in the overall society since people, in general, are able to distinguish between how they view their immediate environment and how they view the world as such. In addition, van de Meer and Tolsma [
57] found that the negative association between ethnic heterogeneity and intra-neighbourhood social cohesion was particularly strong in studies from the US (the only country with some additional evidence for negative spill-over effects on general trust in society). Van de Meer and Tolsma [
57] discuss that this could be understood in light of the relatively high levels of heterogeneity in the US, combined with the pronounced segregation of cities and the persistence of ethnic inequalities. Segregation and ethnic inequalities obstruct interethnic contact opportunities and are more likely to occur in a context where multicultural policies are lacking. Taken together, this indicates that segregation, rather than ethnic diversity per se, is the problem [
58,
59]. Hence, it might not be the percent immigrants that matters for social cohesion; rather, it is the segregation of immigrants.
These results and arguments are important to consider in light of our current results. Sweden has traditionally had a generous immigration policy. However, this changed dramatically in 2015 (during the refugee crisis when Sweden received more than 160,000 asylum seekers), with the launching of a new, far more restrictive immigration policy (first launched as a temporary law but made permanent in 2021). These changes towards very restrictive migration legislation were accompanied by changes in public opinions about immigrants, mirrored by the fact that the ultra-nationalistic and anti-immigrant political party Sweden Democrats became the third-largest party in the parliament elections in 2018. Further, segregation and social inequality have increased significantly in Sweden during the last few decades [
60] and are now viewed as huge societal challenges. This indicates that the patterns previously observed in the US with segregation, and ethnic inequalities, could now be evolving in the Swedish context. Thus, we agree with van der Meer and Tolsma [
57] that policymakers need to consider the combination of heterogeneity, segregation, and inequality to understand and target the potential adverse effect of ethnic diversity for social capital and sustainable social development. Rather than concluding that homogeneity is “good” for social capital and sustainable social development, policies should focus on actions that can increase opportunities for interethnic contacts and, at the same time, fight inequality and segregation.
Further research is needed on how to stimulate opportunities for inter-ethnic interactions in local communities in various cultural settings. In addition, there is a need for more studies on how to simultaneous strengthen social capital and ensure social sustainable development at different spatial levels, such as overall municipal/city and neighbourhood levels. Strengthening within-neighbourhood ties and cohesion (i.e., bonding social capital) might promote a social sustainable neighbourhood but at the same time lead to polarizations and tensions at the municipal/city level, thus eroding social sustainability at a higher spatial level. Qualitative studies exploring how different social groups experience social capital, social inclusion, and social sustainability in various living environments (e.g., urban versus rural neighbourhoods) are also needed, as well as further investigations on the role of social capital and social sustainability during societal crises such as a pandemic.
4.4. Strengths and Limitations
Using a similar tool and analytical approach in the social capital survey in 2006 and 2020 allowed us to have comparable data in comparing the changes in social capital levels across neighbourhoods in Umeå Municipality. As we only had two data points of measurement for social capital, we had to assume that the levels of neighbourhood social capital did not change swiftly in between the surveys. We believe this assumption is valid, considering the stable nature of social capital in a relatively stable community in northern Sweden. The lack of access to neighbourhood registry sociodemographic and socioeconomic data for the years 2017–2020 limited the analyses to the period time of 2006–2017.
5. Conclusions—Implications for Local Policies Aiming to Strengthen Social Capital for Socially Sustainable Development
Sociodemographic, rather than socioeconomic, factors were associated with levels of social capital at the neighbourhood level. Local policies aiming to strengthen social capital for sustainable social development should therefore strive for neighbourhoods with mixed sociodemographic groups, i.e., designing neighbourhoods that are attractive for families with children, pensioners, and single-parent households. Ensuring that people (want to) spend time in their neighbourhoods is essential for social capital and sustainable social development. This could, e.g., imply planning for meeting places that attract different groups of people, such as libraries, safe and enjoyable playgrounds for children, youth centres for adolescents, and attractive recreation areas for older people. Local access to shops, cafés, and restaurants could also increase social interactions and people’s interests in spending time in their neighbourhoods.
Neighbourhood social capital operates and is associated with different factors in urban and rural areas. Thus, policies to strengthen social capital as a means for ensuring sustainable social development need to consider the specific local area and adjust interventions to the local needs. Hence, it is important to consider both the municipal and neighbourhood conditions to ensure sustainable social development in the whole municipality. Overall positive development in the municipality might not benefit all neighbourhoods and vice versa. This requires careful mapping of local needs before implementing any intervention. In some neighbourhoods, interventions to increase neighbour interactions and social cohesion might be needed (i.e., strengthening bonding social capital), to ensure social sustainability. In other neighbourhoods, it might instead be important to increase a sense of inclusion in the municipality/city as a whole to ensure social sustainable development. This could be done by, e.g., increasing involvement and representativeness by the neighbourhood in municipal processes (i.e., building bridging and linking social capital).
Policies to strengthen social capital for sustainable social development should include interventions that increase possibilities for inter-ethnic social contacts, since opportunities for interethnic interactions increase interethnic relations, which in turn increases trust and social cohesion. Supporting opportunities for inter-ethnic interactions requires conscious municipal actions on how to fight segregation and discrimination and creating inclusive and ethnically mixed school-settings, meeting places, and leisure activities. This could, e.g., imply the strategic location of attractive leisure activities and schools to stimulate the flow of people between neighbourhoods, which could then increase opportunities for inter-ethnic contacts.


