
Assessing the Influence of Strategic Resources on the Quality of Life in Spanish Cities


Abstract
:1. Introduction
2. Theoretical Framework: The Resource-Based View
2.1. E-Government
E-Government Measurement
2.2. Transparency
Transparency Measurement
2.3. Reputation
Measurement of Reputation
3. An Overview of Quality of Life
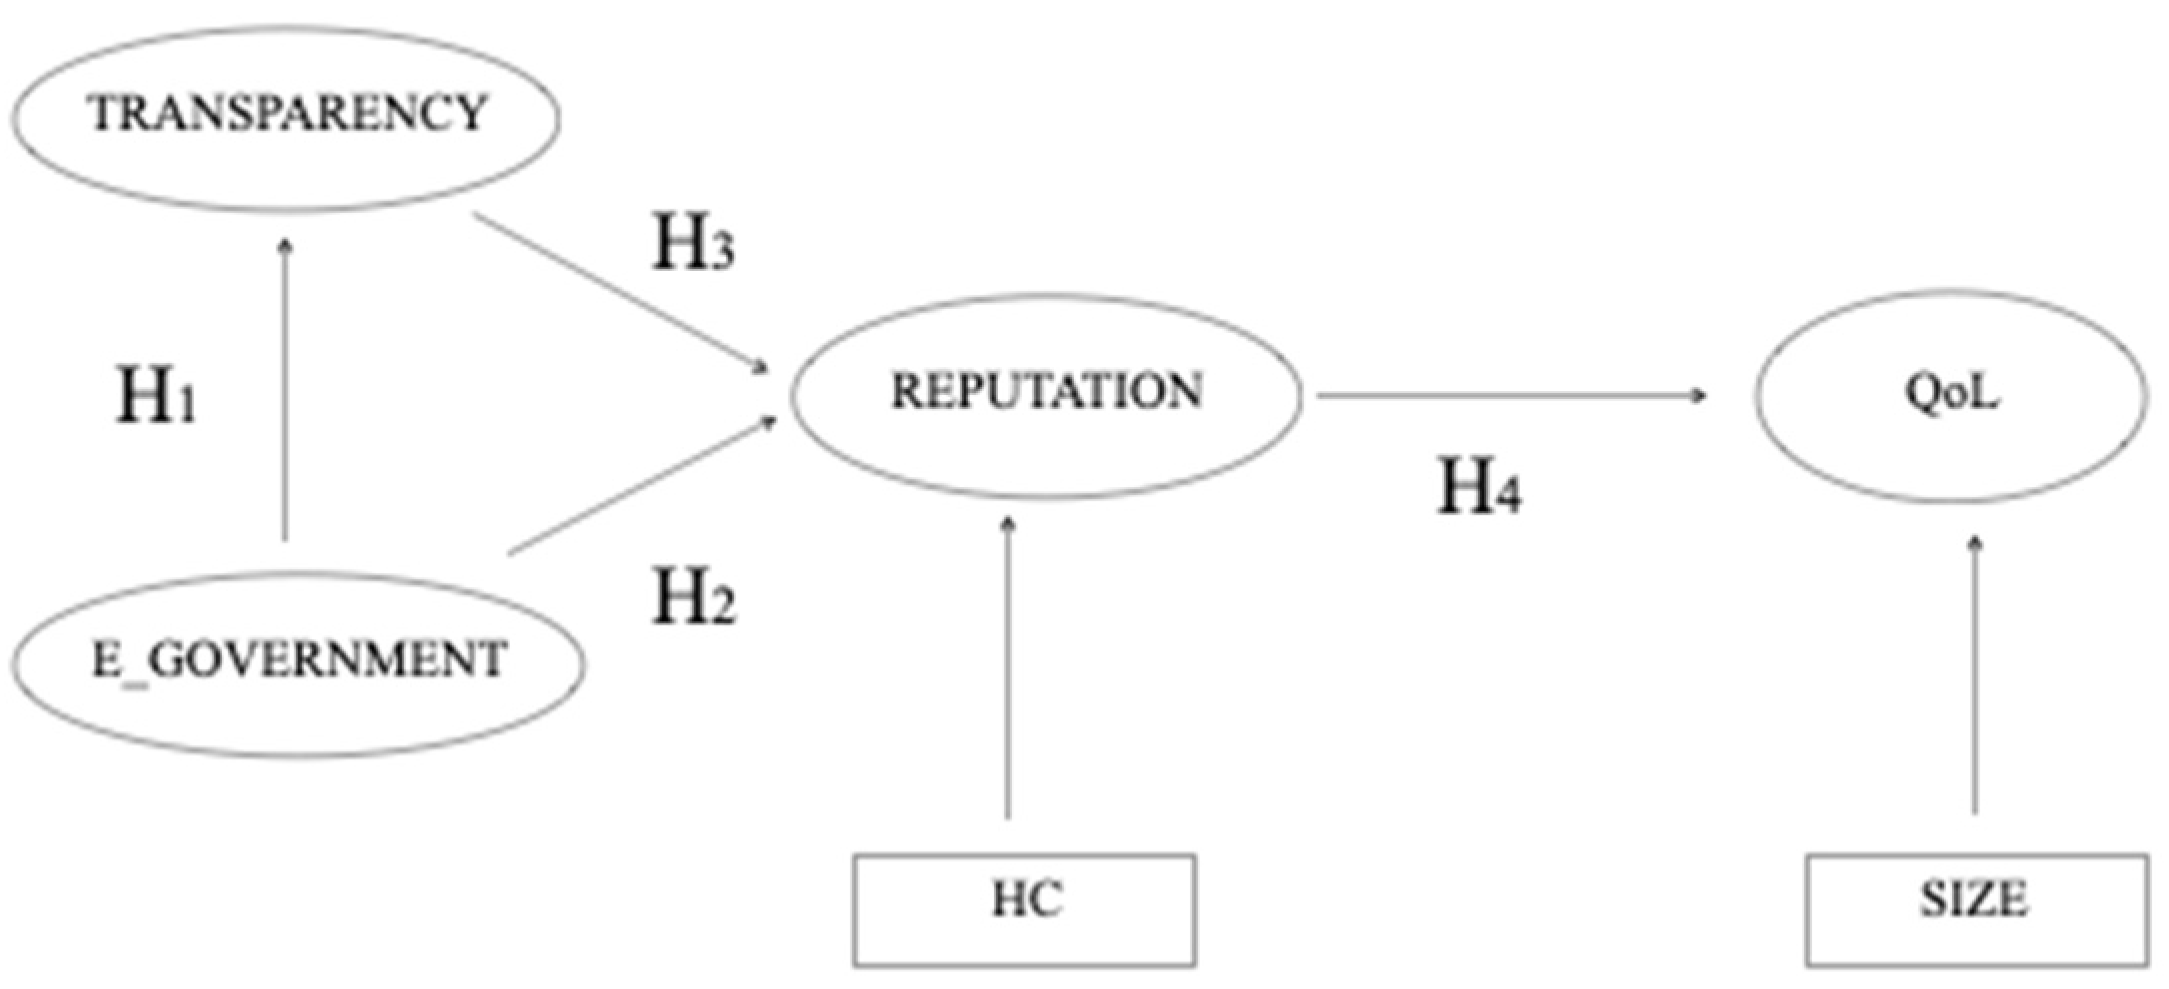
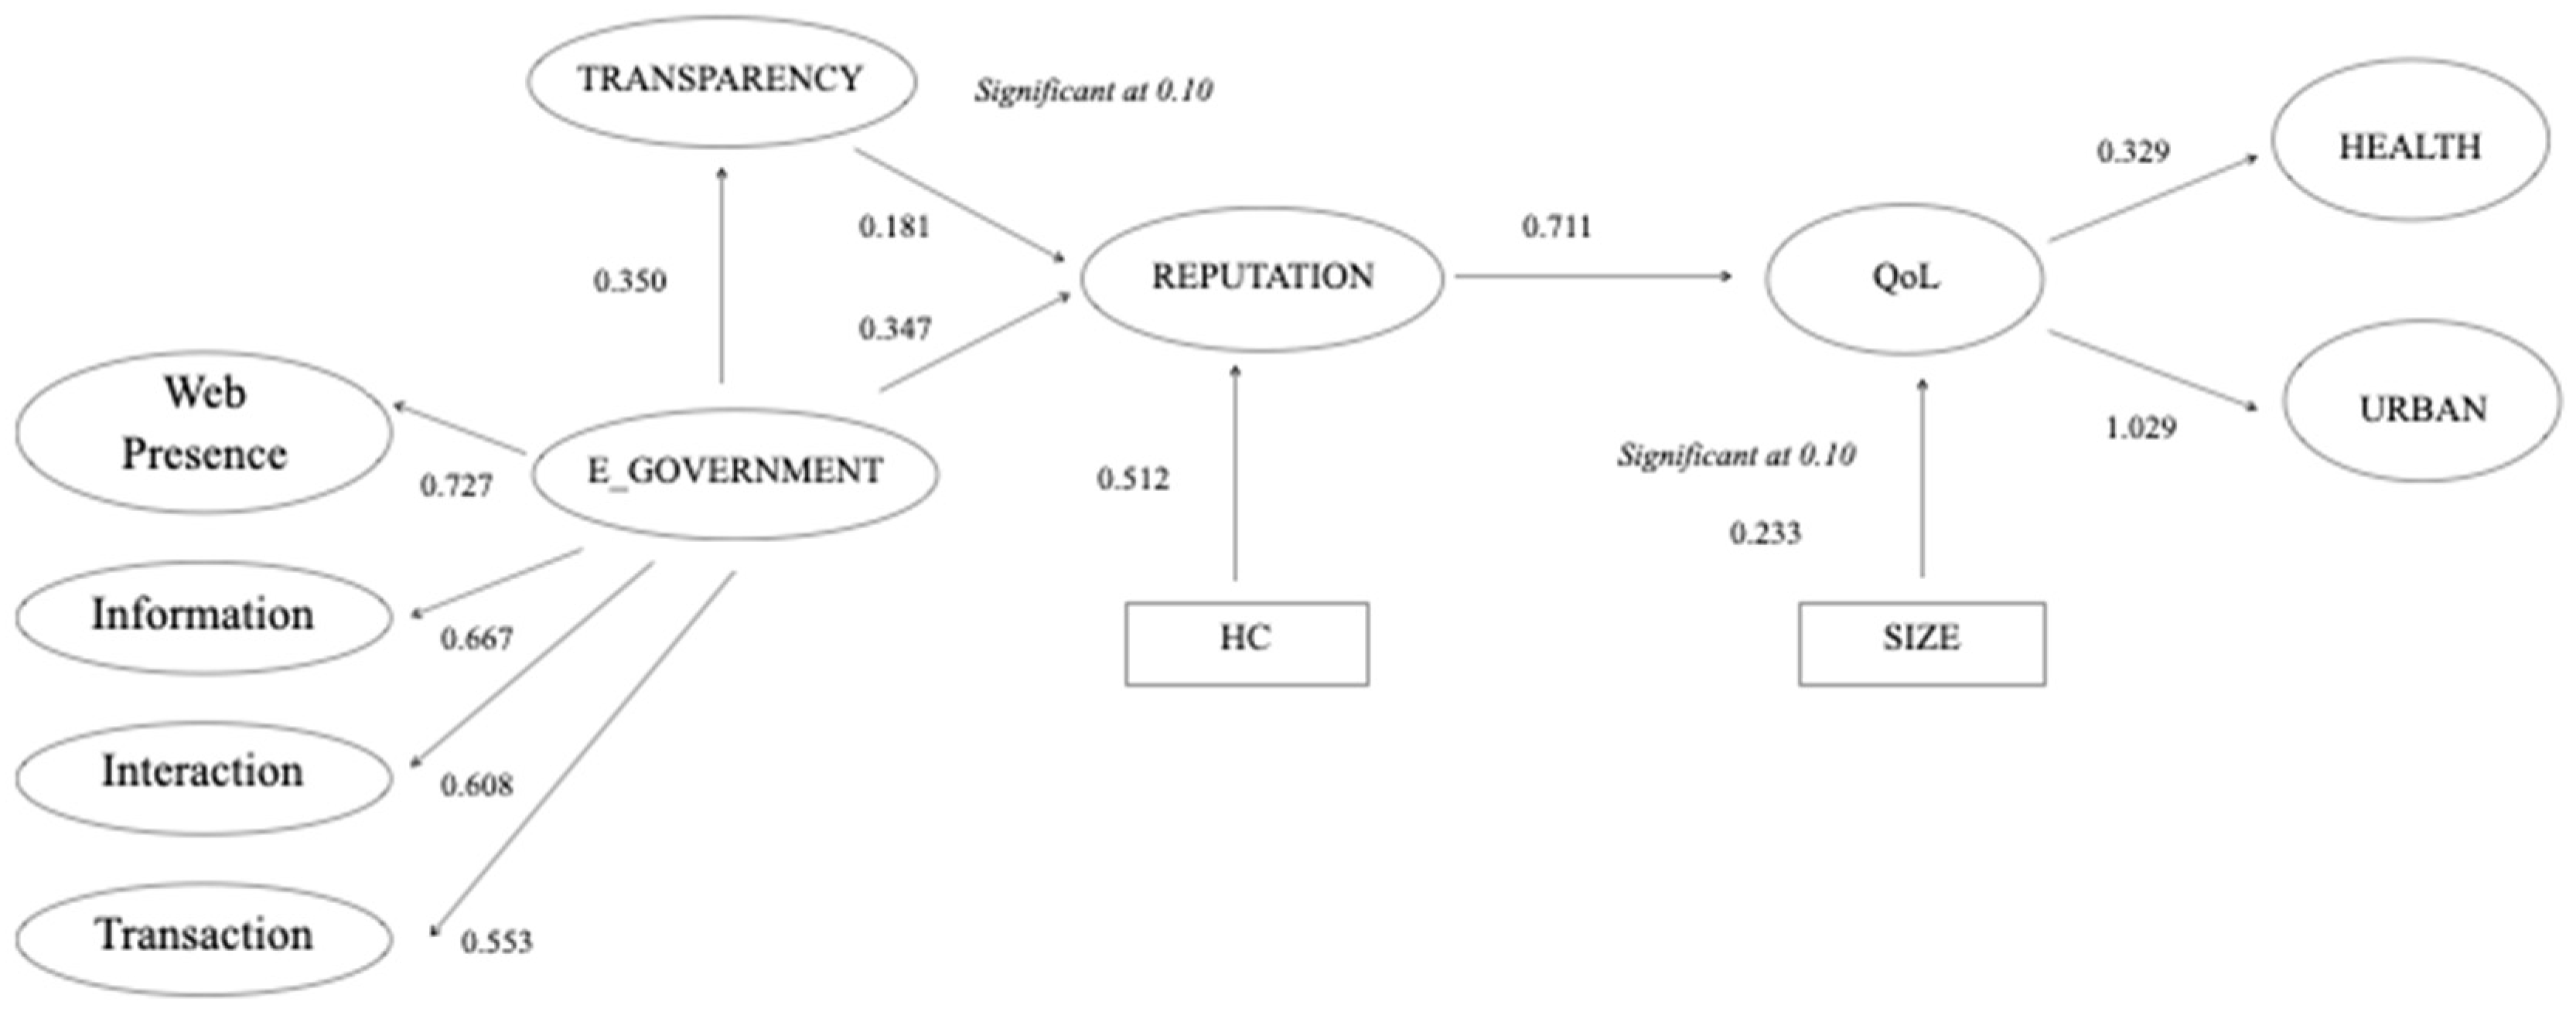
4. Modeling Interactions among Strategic Resources and QoL
5. Data, Variables, and Methodology
6. Results and Discussion
7. Conclusions
Author Contributions
Funding
Institutional Review Board Statement
Informed Consent Statement
Data Availability Statement
Conflicts of Interest
Appendix A

| Stage | Item | Content |
|---|---|---|
| Web presence | Forms Council/plenary Proceedings Search box Web map RSS | Proceeding documents (general information) Acts or changes in description of laws in the council Decrees and local regulations To find information inside city web pages Map of the website Up-to-date news subscription |
| Information | Street map Transportation | City map with all streets (can be static or dynamic) Transport facilities and how to get to the city |
| Interaction | Citizen mailbox Telephone listings | Information request or method of contact Telephone numbers of the different services |
| Transaction | Follow-up functionality Online applications Payments Digital signatures/certificate Citizen folder Mobile | It is possible to track the online applications or check the status Is it possible to apply for documentation and service requests? The possibility to finalize a payment transaction on the web (taxes, fees, etc.) If it is possible to obtain certified documents directly from the website Citizens can update and maintain personal details The website is ready for mobile devices |
| E-democracy | Blogs | Discussion and forum facility for debate and posting information |
| Area | Subarea |
|---|---|
| Information about the Municipal Corporation | Basic institutional information (10) Information on municipal rules and regulations (5) |
| Relations with Citizens and Society | Characteristics of the council’s website (3) Information and citizen care and attention (11) Level of commitment to citizens (6) |
| Economic and Financial Transparency | Accounting and budgetary information (11) Transparency in municipal income and expenses (6) Transparency in municipal debt (4) |
| Information about Municipal Service Contract Bidding | Procurement of service procedures (4) Relations and transactions with suppliers (2) |
| Transparency about Urban Development/Public Works | Urban planning and planning agreements (4) Re-planning decisions and planning permissions (2) Announcements and public works tenders (4) Contractor information, offers and resolutions (2) Monitoring and control of execution of works (3) Planning indicators and public works (3) |
| Component | Content |
|---|---|
| General population survey | Evaluation by citizens of the different municipalities assessed on the most relevant aspects of their city, the cities of their autonomous community, and the country as a whole |
| Expert evaluation | A large group of experts in urban management from different responsibilities (urban planning, mobility, etc.) point out the best cities and practices in four large dimensions of reputation: environmental, competitive, managerial, and social and democratic |
| Benchmarking of indicators | The cities analyzed are compared based on 97 different measures, which lead to the elaboration of indicators related to the reputation of a city |
| Direct evaluation of merits | City councils are requested to provide information on key municipal management indicators, as well as on the actions that are being carried out in various lines and supporting documentation |
| Valuation of the mayor and municipal management by citizens | Citizens give an assessment of their mayor, a key figure in municipal action, as well as municipal management as a whole |
| Component | Item |
|---|---|
| Socioeconomic | Average annual household income Homes that meet the basic housing requirements Male employment rate Female employment rate Male activity rate Female activity rate Residents born in non-European countries Population aged over 16 with university studies Population aged over 16 in high-skilled jobs Housing price Rental housing price |
| Urban environment | Safety against robberies with violence and intimidation Safety against sexual violence Safety against drug-related crime Participation in local elections Participation in national elections Non-financial expenditure Green area extension Average travel time to work Travel journeys in public transport Flights/distance in time to the nearest airport Average temperature in the coldest month Overnight tourist stays Population engaged in artistic and cultural activities |
| Health | Infant mortality rate per 1000 live births Male mortality rate under 65 years old Female mortality rate under 65 years old Mortality rate due to cardiovascular and respiratory diseases under 50 years old Mortality rate caused by cardiovascular and respiratory diseases in the population between 50 and 65 years old Mortality rate caused by tumors under 50 years old Mortality rate caused by tumors between 50 and 65 years old Life expectancy at birth (men) Life expectancy at birth (women) AIDS-related deaths Suicides and self-inflicted injuries |
References
- Stiglitz, J.E.; Sen, A.; Fitoussi, J.-P. Report by the Commission on the Measurement of Economic Performance and Social Progress. Available online: https://www.economie.gouv.fr/files/finances/presse/dossiers_de_presse/090914mesure_perf_eco_progres_social/synthese_ang.pdf (accessed on 15 June 2015).
- Kalimeris, P.; Bithas, K.; Richardson, C.; Nijkamp, P. Hidden Linkages between Resources and Economy: A “Beyond-GDP” Approach Using Alternative Welfare Indicators. Ecol. Econ. 2020, 169, 106508. [Google Scholar] [CrossRef]
- Lambiri, D.; Biagi, B.; Royuela, V. Quality of Life in the Economic and Urban Economic Literature. Soc. Indic. Res. 2007, 84, 1. [Google Scholar] [CrossRef] [Green Version]
- Diener, E.D.; Suh, E. Measuring Quality of Life: Economic, Social and Subjective Indicators. Soc. Indic. Res. 1997, 40, 189–216. [Google Scholar] [CrossRef]
- Nissi, E.; Sarra, A. A Measure of Well-Being across the Italian Urban Areas: An Integrated DEA-Entropy Approach. Soc. Indic. Res. 2018, 136, 1183–1209. [Google Scholar] [CrossRef]
- Estoque, R.C.; Togawa, T.; Ooba, M.; Gomi, K.; Nakamura, S.; Hijioka, Y.; Kameyama, Y. A Review of Quality of Life (QOL) Assessments and Indicators: Towards a “QOL-Climate” Assessment Framework. Ambio 2019, 48, 619–638. [Google Scholar] [CrossRef] [PubMed]
- Węziak-Białowolska, D. Quality of Life in Cities—Empirical Evidence in Comparative European Perspective. Cities 2016, 58, 87–96. [Google Scholar] [CrossRef]
- González, E.; Cárcaba, A.; Ventura, J. The Importance of the Geographic Level of Analysis in the Assessment of the Quality of Life: The Case of Spain. Soc. Indic. Res. 2011, 102, 209–228. [Google Scholar] [CrossRef]
- Bovaird, T.; Löffler, E. Moving from Excellence Models of Local Service Delivery to Benchmarking ‘Good Local Governance’. Int. Rev. Adm. Sci. 2002, 68, 9–24. [Google Scholar] [CrossRef]
- De Guimarães, J.C.F.; Severo, E.A.; Felix Júnior, L.A.; da Costa, W.P.L.B.; Salmoria, F.T. Governance and Quality of Life in Smart Cities: Towards Sustainable Development Goals. J. Clean. Prod. 2020, 253, 119926. [Google Scholar] [CrossRef]
- Cárcaba, A.; González, E.; Ventura, J. Social Progress in Spanish Municipalities (2001–2011). Appl. Res. Qual. Life 2017, 12, 997–1019. [Google Scholar] [CrossRef] [Green Version]
- Rodriguez-Hevía, L.F.; Navío-Marco, J.; Ruiz-Gómez, L.M. Citizens’ Involvement in e-Government in the European Union: The Rising Importance of the Digital Skills. Sustainability 2020, 12, 6807. [Google Scholar] [CrossRef]
- Garrido-Rodríguez, J.C.; López-Hernández, A.M.; Zafra-Gómez, J.L. The Impact of Explanatory Factors on a Bidimensional Model of Transparency in Spanish Local Government. Gov. Inf. Q. 2019, 36, 154–165. [Google Scholar] [CrossRef]
- Bannister, F.; Connolly, R. The Trouble with Transparency: A Critical Review of Openness in e-Government. Policy Internet 2011, 3, 158–187. [Google Scholar] [CrossRef]
- Weiss, J. Trust as a Key for Strategic Management? The Relevance of Council–Administration Relations for NPM-Related Reforms in German Local Governments. Public Manag. Rev. 2017, 19, 1399–1414. [Google Scholar] [CrossRef]
- Gul, R. The Relationship between Reputation, Customer Satisfaction, Trust, and Loyalty. J. Public Adm. Gov. 2014, 4, 368–387. [Google Scholar] [CrossRef] [Green Version]
- Porumbescu, G. Linking Transparency to Trust in Government and Voice. Am. Rev. Public Adm. 2017, 47, 520–537. [Google Scholar] [CrossRef]
- Lee, J. 10 Year Retrospect on Stage Models of E-Government: A Qualitative Meta-Synthesis. Gov. Inf. Q. 2010, 27, 220–230. [Google Scholar] [CrossRef]
- Bonsón, E.; Torres, L.; Royo, S.; Flores, F. Local E-Government 2.0: Social Media and Corporate Transparency in Municipalities. Gov. Inf. Q. 2012, 29, 123–132. [Google Scholar] [CrossRef]
- Estevez, E.; Janowski, T. Electronic Governance for Sustainable Development—Conceptual Framework and State of Research. Gov. Inf. Q. 2013, 30, S94–S109. [Google Scholar] [CrossRef]
- Joshi, P.R.; Islam, S. E-Government Maturity Model for Sustainable E-Government Services from the Perspective of Developing Countries. Sustainability 2018, 10, 1882. [Google Scholar] [CrossRef] [Green Version]
- Kim, S.; Lee, J. Citizen Participation, Process, and Transparency in Local Government: An Exploratory Study. Policy Stud. J. 2019, 47, 1020–1041. [Google Scholar] [CrossRef]
- Piña, G.; Avellaneda, C. Central Government Strategies to Promote Local Governments’ Transparency: Guidance or Enforcement? Public Perform. Manag. Rev. 2019, 42, 357–382. [Google Scholar] [CrossRef]
- Albu, O.B.; Flyverbom, M. Organizational Transparency: Conceptualizations, Conditions, and Consequences. Bus. Soc. 2019, 58, 268–297. [Google Scholar] [CrossRef]
- Da Cruz, N.F.; Tavares, A.F.; Marques, R.C.; Jorge, S.; de Sousa, L. Measuring Local Government Transparency. Public Manag. Rev. 2016, 18, 866–893. [Google Scholar] [CrossRef] [Green Version]
- Cucciniello, M.; Porumbescu, G.A.; Grimmelikhuijsen, S. 25 Years of Transparency Research: Evidence and Future Directions. Public Adm. Rev. 2017, 77, 32–44. [Google Scholar] [CrossRef]
- Meijer, A.; ’t Hart, P.; Worthy, B. Assessing Government Transparency: An Interpretive Framework. Adm. Soc. 2018, 50, 501–526. [Google Scholar] [CrossRef] [Green Version]
- Piotrowski, S.J. Governmental Transparency in the Path of Administrative Reform; Piotrowski, S.J., Ed.; State University of New York Press: Albany, NY, USA, 2007; ISBN 0791470865. [Google Scholar]
- Puron-Cid, G.; Rodríguez Bolívar, M.P. The Effects of Contextual Factors into Different Features of Financial Transparency at the Municipal Level. Gov. Inf. Q. 2018, 35, 135–150. [Google Scholar] [CrossRef]
- Meijer, A. Understanding Modern Transparency. Int. Rev. Adm. Sci. 2009, 75, 255–269. [Google Scholar] [CrossRef]
- Grimmelikhuijsen, S.G.; Welch, E.W. Developing and Testing a Theoretical Framework for Computer-Mediated Transparency of Local Governments. Public Adm. Rev. 2012, 72, 562–571. [Google Scholar] [CrossRef] [Green Version]
- Rindova, V.P.; Williamson, I.O.; Petkova, A.P.; Sever, J.M. Being Good or Being Known: An Empirical Examination of the Dimensions, Antecedents, and Consequences of Organizational Reputation. Acad. Manag. J. 2005, 48, 1033–1049. [Google Scholar] [CrossRef] [Green Version]
- Chun, R. Corporate Reputation: Meaning and Measurement. Int. J. Manag. Rev. 2005, 7, 91–109. [Google Scholar] [CrossRef]
- Agarwal, J.; Osiyevskyy, O.; Feldman, P.M. Corporate Reputation Measurement: Alternative Factor Structures, Nomological Validity, and Organizational Outcomes. J. Bus. Ethics 2015, 2, 485–506. [Google Scholar] [CrossRef]
- Carpenter, D. Institutional Strangulation: Bureaucratic Politics and Financial Reform in the Obama Administration. Perspect. Politics 2010, 8, 825–846. [Google Scholar] [CrossRef]
- Delgado García, J.B.; de Quevedo Puente, E. The Complex Link of City Reputation and City Performance. Results for FsQCA Analysis. J. Bus. Res. 2016, 69, 2830–2839. [Google Scholar] [CrossRef]
- Bustos, E.O. Organizational Reputation in the Public Administration: A Systematic Literature Review. Public Adm. Rev. 2021, 81, 731–751. [Google Scholar] [CrossRef]
- Picci, L. Reputation-Based Governance. Public Adm. 2010, 91, 232–250. [Google Scholar]
- D’Oria, L.; Crook, T.R.; Ketchen, D.J.; Sirmon, D.G.; Wright, M. The Evolution of Resource-Based Inquiry: A Review and Meta-Analytic Integration of the Strategic Resources–Actions–Performance Pathway. J. Manag. 2021, 47, 1383–1429. [Google Scholar] [CrossRef]
- Szymaniec-Mlicka, K. Resource-Based View in Strategic Management of Public Organizations—A Review of the Literature. Management 2015, 18, 19–30. [Google Scholar] [CrossRef] [Green Version]
- Pee, L.G.; Kankanhalli, A. Interactions among Factors Influencing Knowledge Management in Public-Sector Organizations: A Resource-Based View. Gov. Inf. Q. 2016, 33, 188–199. [Google Scholar] [CrossRef]
- Cabral, S.; Mahoney, J.T.; McGahan, A.M.; Potoski, M. Value Creation and Value Appropriation in Public and Nonprofit Organizations. Strateg. Manag. J. 2019, 40, 465–475. [Google Scholar] [CrossRef]
- Carmeli, A.; Tishler, A. Resources, Capabilities, and the Performance of Industrial Firms: A Multivariate Analysis. Manag. Decis. Econ. 2004, 25, 299–315. [Google Scholar] [CrossRef] [Green Version]
- Cárcaba, A.; González, E.; Ventura, J.; Arrondo, R. How Does Good Governance Relate to Quality of Life? Sustainability 2017, 9, 631. [Google Scholar] [CrossRef] [Green Version]
- Wernerfelt, B. A Resource-Based View of the Firm. Strateg. Manag. J. 1984, 5, 171–180. [Google Scholar] [CrossRef]
- Carmeli, A. A Conceptual and Practical Framework of Measuring Performance of Local Authorities in Financial Terms: Analysing the Case of Israel. Local Gov. Stud. 2002, 28, 21–36. [Google Scholar] [CrossRef]
- Andrews, R.; Boyne, G.A.; Walker, R.M. Strategy Content and Organizational Performance: An Empirical Analysis. Public Adm. Rev. 2006, 66, 52–63. [Google Scholar] [CrossRef]
- Andrews, R.W.; Boyne, G.A.; Walker, R. The Impact of Management on Administrative and Survey Measures of Organizational Performance. Public Manag. Rev. 2011, 13, 227–256. [Google Scholar] [CrossRef]
- Piening, E.P. Dynamic Capabilities in Public Organizations. A Literature Review and Research Agenda. Public Manag. Rev. 2013, 15, 209–245. [Google Scholar] [CrossRef]
- Andrews, R.; Beynon, M.J.; Mcdermott, A.M. Organizational Capability in the Public Sector: A Configurational Approach. J. Public Adm. Res. Theory 2016, 26, 239–258. [Google Scholar] [CrossRef]
- Zhao, Y.; Fan, B. Exploring Open Government Data Capacity of Government Agency: Based on the Resource-Based Theory. Gov. Inf. Q. 2018, 35, 1–12. [Google Scholar] [CrossRef]
- Barney, J.B. The Emergence of Resource-Based Theory: A Personal Journey. J. Manag. 2021, 47, 1663–1676. [Google Scholar] [CrossRef]
- Barney, J.B.; Clark, D.N. Resource-Based Theory: Creating and Sustaining Competitive Advantage; Oxford University Press Oxford: New York, NY, USA, 2007. [Google Scholar]
- Grant, R.M. Prospering in Dynamically-Competitive Environments: Organizational Capability as Knowledge Integration. Organ. Sci. 1996, 7, 375–387. [Google Scholar] [CrossRef] [Green Version]
- Zhang, H.; Xu, X.; Xiao, J. Diffusion of E-Government: A Literature Review and Directions for Future Directions. Gov. Inf. Q. 2014, 31, 631–636. [Google Scholar] [CrossRef]
- Yang, K.; Rho, S.-Y. E-Government for Better Performance: Promises, Realities, and Challenges. Int. J. Public Adm. 2007, 30, 1197–1217. [Google Scholar] [CrossRef]
- Bannister, F.; Connolly, R. Defining E-Governance. e-Serv. J. 2015, 8, 3–25. [Google Scholar] [CrossRef]
- Meijer, A.; Bekkers, V. A Metatheory of E-Government: Creating Some Order in a Fragmented Research Field. Gov. Inf. Q. 2015, 32, 237–245. [Google Scholar] [CrossRef]
- Reffat, R. Developing a Successful E-Government. Proceedings of the Symposium on E-government: Opportunities and Challenge. Available online: https://www.scirp.org/(S(351jmbntvnsjt1aadkozje))/reference/ReferencesPapers.aspx?ReferenceID=1462856 (accessed on 15 June 2015).
- Scholl, H.J. Is e-government research a flash in the pan or here for the long shot? In Electronic Government; Springer: Berlin/Heidelberg, Germany, 2006; pp. 13–24. [Google Scholar]
- Iskender, G.; Ozkan, S. Analysis of Success Factors in E-Government Transformation in Turkey: Are These Factors Really the Causes of Success? Inf. Dev. 2013, 90, 1–10. [Google Scholar] [CrossRef]
- Yildiz, M. E-Government Research: Reviewing the Literature, Limitations, and Ways Forward. Gov. Inf. Q. 2007, 24, 646–665. [Google Scholar] [CrossRef]
- Welch, E.W.; Hinnant, C.C. Internet Use, Transparency, and Interactivity Effects on Trust in Government. In Proceedings of the 36th Annual Hawaii International Conference on System Sciences, 2003, Big Island, HI, USA, 6–9 January 2003. [Google Scholar] [CrossRef]
- Moon, M.J. Can IT Help Government to Restore Public Trust? Declining Public Trust and Potential Prospects of IT in the Public Sector. In Proceedings of the 36th Annual Hawaii International Conference on System Sciences, HICSS 2003, Big Island, HI, USA, 6–9 January 2003. [Google Scholar] [CrossRef]
- Shim, D.C.; Eom, T.H. E-Government and Anti-Corruption: Empirical Analysis of International Data. Int. J. Public Adm. 2008, 31, 298–316. [Google Scholar] [CrossRef]
- Colesca, S.E. Understanding Trust in E-Government. Econ. Eng. Decis. 2009, 63, 7–15. [Google Scholar]
- Bertot, J.C.; Jaeger, P.T.; Grimes, J.M. Using ICTs to Create a Culture of Transparency: E-Government and Social Media as Openness and Anti-Corruption Tools for Societies. Gov. Inf. Q. 2010, 27, 264–271. [Google Scholar] [CrossRef]
- Oliveira, G.H.; Welch, E.W. Social Media Use in Local Government: Linkage of Technology, Task, and Organizational Context. Gov. Inf. Q. 2013, 30, 397–405. [Google Scholar] [CrossRef]
- Tolbert, C.J.; Mossberger, K. The Effects of E-Government on Trust and Confidence in Government. Public Adm. Rev. 2006, 66, 354–369. [Google Scholar] [CrossRef]
- Luoma-aho, V. Neutral Reputation and Public Sector Organizations. Corp. Reput. Rev. 2006, 10, 124–143. [Google Scholar] [CrossRef]
- Teo, T.S.H.; Srivastava, S.C.; Jiang, L. Trust and Electronic Government Success: An Empirical Study. J. Manag. Inf. Syst. 2009, 25, 99–132. [Google Scholar] [CrossRef]
- Huang-Horowitz, N.C. Public Relations in the Small Business Environment: Creating Identity and Building Reputation. Public Relat. Rev. 2015, 41, 345–353. [Google Scholar] [CrossRef]
- Jun, K.-N.; Wang, F.; Wang, D. E-Government Use and Perceived Government Transparency and Service Capacity. Public Perform. Manag. Rev. 2014, 38, 125–151. [Google Scholar] [CrossRef]
- Twizeyimana, J.D.; Andersson, A. The Public Value of E-Government—A Literature Review. Gov. Inf. Q. 2019, 36, 167–178. [Google Scholar] [CrossRef]
- Snead, J.T.; Wright, E. E-Government Research in the United States. Gov. Inf. Q. 2014, 31, 129–136. [Google Scholar] [CrossRef]
- Alcaide–Muñoz, L.; Rodríguez–Bolívar, M.P.; Cobo, M.J.; Herrera–Viedma, E. Analysing the Scientific Evolution of E-Government Using a Science Mapping Approach. Gov. Inf. Q. 2017, 34, 545–555. [Google Scholar] [CrossRef]
- Wirtz, B.W.; Daiser, P. A Meta-Analysis of Empirical e-Government Research and Its Future Research Implications. Int. Rev. Adm. Sci. 2018, 84, 144–163. [Google Scholar] [CrossRef]
- Sá, F.; Rocha, Á.; Pérez Cota, M. From the Quality of Traditional Services to the Quality of Local E-Government Online Services: A Literature Review. Gov. Inf. Q. 2016, 33, 149–160. [Google Scholar] [CrossRef]
- Lee-Geiller, S.; Lee, T. (David) Using Government Websites to Enhance Democratic E-Governance: A Conceptual Model for Evaluation. Gov. Inf. Q. 2019, 36, 208–225. [Google Scholar] [CrossRef]
- Moon, M.J. The Evolution of E-Government among Municipalities: Rhetoric or Reality? Public Adm. Rev. 2002, 62, 424–433. [Google Scholar] [CrossRef]
- Nielsen, M.M. E-Governance and Stage Models: Analysis of Identified Models and Selected Eurasian Experiences in Digitising Citizen Service Delivery. Electron. Gov. Int. J. 2016, 12, 107–141. [Google Scholar] [CrossRef]
- Iannacci, F.; Seepma, A.P.; de Blok, C.; Resca, A. Reappraising Maturity Models in E-Government Research: The Trajectory-Turning Point Theory. J. Strateg. Inf. Syst. 2019, 28, 310–329. [Google Scholar] [CrossRef]
- Esteves, J. Análisis Del Desarrollo Del Gobierno Electrónico Municipal En España; IE Working Paper; Fundación Instituto de Empresa: Madrid, Spain, 2005. [Google Scholar]
- CIBERP@ÍS VII Radiografía de Las Webs Municipales. Available online: http://elpais.com/diario/2007/07/19/ciberpais/1184809221_850215.html (accessed on 15 June 2015).
- Ingrams, A.; Manoharan, A.; Schmidthuber, L.; Holzer, M. Stages and Determinants of E-Government Development: A Twelve-Year Longitudinal Study of Global Cities. Int. Public Manag. J. 2020, 23, 731–769. [Google Scholar] [CrossRef] [Green Version]
- Manoharan, A.P.; Ingrams, A.; Kang, D.; Zhao, H. Globalization and Worldwide Best Practices in E-Government. Int. J. Public Adm. 2021, 44, 465–476. [Google Scholar] [CrossRef]
- Cuadrado-Ballesteros, B.; Santis, S.; Bisogno, M. Public-Sector Financial Management and E-Government: The Role Played by Accounting Systems. Int. J. Public Adm. 2021, 1–15. [Google Scholar] [CrossRef]
- Heald, D. Varieties of Transparency. Proc.-Br. Acad. 2006, 25–43. [Google Scholar] [CrossRef]
- Harrison, T.M.; Sayogo, D.S. Transparency, Participation, and Accountability Practices in Open Government: A Comparative Study. Gov. Inf. Q. 2014, 31, 513–525. [Google Scholar] [CrossRef]
- Tejedo-Romero, F.; de Araujo, J.F.F.E. Determinants of Local Governments’ Transparency in Times of Crisis: Evidence from Municipality-Level Panel Data. Adm. Soc. 2018, 50, 527–554. [Google Scholar] [CrossRef]
- Heimstädt, M.; Dobusch, L. Transparency and Accountability: Causal, Critical and Constructive Perspectives. Organ. Theory 2020, 1, 263178772096421. [Google Scholar] [CrossRef]
- Jaeger, P.T.; Bertot, J.C. Transparency and Technological Change: Ensuring Equal and Sustained Public Access to Government Information. Gov. Inf. Q. 2010, 27, 371–376. [Google Scholar] [CrossRef]
- Kim, S. Individual-Level Factors and Organizational Performance in Government Organizations. J. Public Adm. Res. Theory 2005, 15, 245–261. [Google Scholar] [CrossRef]
- Etzioni, A. Is Transparency the Best Disinfectant? J. Political Philos. 2010, 18, 389–404. [Google Scholar] [CrossRef]
- Meijer, A.J.; Curtin, D.; Hillebrandt, M. Open Government: Connecting Vision and Voice. Int. Rev. Adm. Sci. 2012, 78, 10–29. [Google Scholar] [CrossRef]
- Lee, C.; Chang, K.; Berry, F.S. Testing the Development and Diffusion of E-Government and E-Democracy: A Global Perspective. Public Adm. Rev. 2011, 71, 444–454. [Google Scholar] [CrossRef]
- Relly, J.E.; Sabharwal, M. Perceptions of Transparency of Government Policymaking: A Cross-National Study. Gov. Inf. Q. 2009, 26, 148–157. [Google Scholar] [CrossRef]
- Park, H.; Blenkinsopp, J. The Roles of Transparency and Trust in the Relationship between Corruption and Citizen Satisfaction. Int. Rev. Adm. Sci. 2011, 77, 254–274. [Google Scholar] [CrossRef] [Green Version]
- Araujo, J.F.F.E.; Tejedo-Romero, F. Does Gender Equality Affect Municipal Transparency: The Case of Spain. Public Perform. Manag. Rev. 2018, 41, 69–99. [Google Scholar] [CrossRef]
- Lee, T.; Lee, B.K.; Lee-Geiller, S. The effects of information literacy on trust in government websites: Evidence from an online experiment. Int. J. Inf. Manag. 2020, 52. [Google Scholar] [CrossRef]
- Pasquier, M.; Villeneuve, J.P. Organizational Barriers to Transparency: A Typology and Analysis of Organizational Behaviour Tending to Prevent or Restrict Access to Information. Int. Rev. Adm. Sci. 2007, 73, 147–162. [Google Scholar] [CrossRef]
- Mazzola, P.; Ravasi, D.; Gabbioneta, C. How to Build Reputation in Financial Markets. Long Range Plan. 2006, 39, 385–407. [Google Scholar] [CrossRef] [Green Version]
- Eccles, R.G.; Grant, R.M.; van Riel, C.B.M. Reputation and Transparency: Lessons from a Painful Period in Public Disclosure. Long Range Plan. 2006, 39, 353–359. [Google Scholar] [CrossRef]
- Grimmelikhuijsen, S.G.; Piotrowski, S.J.; van Ryzin, G.G. Latent Transparency and Trust in Government: Unexpected Findings from Two Survey Experiments. Gov. Inf. Q. 2020, 37, 101497. [Google Scholar] [CrossRef]
- Del Sol, D.A. The Institutional, Economic and Social Determinants of Local Government Transparency. J. Econ. Policy Reform 2013, 16, 90–107. [Google Scholar] [CrossRef]
- Perez-Arellano, L.A.; Blanco-Mesa, F.; Leon-Castro, E.; Alfaro-Garcia, V. Bonferroni prioritized aggregation operators applied to government transparency. Mathematics 2021, 9, 24. [Google Scholar] [CrossRef]
- Guillamón, M.D.; Bastida, F.; Benito, B. The Determinants of Local Government’s Financial Transparency. Local Gov. Stud. 2011, 37, 391–406. [Google Scholar] [CrossRef]
- Pernagallo, G.; Torrisi, B. A logit model to assess the transparency of Italian public administration websites. Gov. Inf. Q. 2020, 37, 101519. [Google Scholar] [CrossRef]
- Bearfield, D.A.; Bowman, A.O.M. Can You Find It on the Web? An Assessment of Municipal E-Government Transparency. Am. Rev. Public Adm. 2017, 47, 172–188. [Google Scholar] [CrossRef]
- Grosso, A.L.; van Ryzin, G.G. How Citizens View Government Performance Reporting. Public Perform. Manag. Rev. 2011, 35, 235–250. [Google Scholar] [CrossRef]
- Reddick, C.G.; Roy, J. Business Perceptions and Satisfaction with E-Government: Findings from a Canadian Survey. Gov. Inf. Q. 2013, 30, 1–9. [Google Scholar] [CrossRef]
- Ganapati, S.; Reddick, C.G. The Use of ICT for Open Government in U.S. Municipalities: Perceptions of Chief Administrative Officers. Public Perform. Manag. Rev. 2014, 37, 365–387. [Google Scholar] [CrossRef]
- Yavuz, N.; Welch, E.W. Factors Affecting Openness of Local Government Websites: Examining the Differences across Planning, Finance and Police Departments. Gov. Inf. Q. 2014, 31, 574–583. [Google Scholar] [CrossRef]
- Kotha, S.; Rajgopal, S.; Rindova, V. Reputation Building and Performance: An Empirical Analysis of the Top-50 Pure Internet Firms. Eur. Manag. J. 2001, 19, 571–586. [Google Scholar] [CrossRef]
- Quintana-García, C.; Benavides-Chicón, C.G.; Marchante-Lara, M. Does a green supply chain improve corporate reputation? Empirical evidence from European manufacturing sectors. Ind. Mark. Manag. 2021, 92, 344–353. [Google Scholar] [CrossRef]
- Fombrun, C.J. List of Lists: A Compilation of International Corporate Reputation Ratings. Corp. Reput. Rev. 2007, 10, 144–153. [Google Scholar] [CrossRef] [Green Version]
- Boyd, B.K.; Bergh, D.D.; Ketchen, D.J. Reconsidering the Reputation--Performance Relationship: A Resource-Based View. J. Manag. 2010, 36, 588–609. [Google Scholar] [CrossRef] [Green Version]
- Carmeli, A.; Tishler, A. The Relationships between Intangible Organizational Elements and Organizational Performance. Strateg. Manag. J. 2004, 25, 1257–1278. [Google Scholar] [CrossRef] [Green Version]
- Wæraas, A.; Byrkjeflot, H. Public Sector Organizations and Reputation Management: Five Problems. Int. Public Manag. J. 2012, 15, 186–206. [Google Scholar] [CrossRef]
- Ferreira, P.; Dionísio, A. City Brand: What Are the Main Conditions for Territorial Performance? Sustainability 2019, 11, 3959. [Google Scholar] [CrossRef] [Green Version]
- Walsh, G.; Mitchell, V.W.; Jackson, P.R.; Beatty, S.E. Examining the Antecedents and Consequences of Corporate Reputation: A Customer Perspective. Br. J. Manag. 2009, 20, 187–203. [Google Scholar] [CrossRef]
- Barnett, M.L.; Jermier, J.M.; Lafferty, B.A. Corporate Reputation: The Definitional Landscape. Corp. Reput. Rev. 2003, 9, 26–38. [Google Scholar] [CrossRef]
- Podnar, K.; Tuškej, U.; Golob, U. Mapping Semantic Meaning of Corporate Reputation in Global Economic Crisis Context: A Slovenian Study. Public Relat. Rev. 2012, 38, 906–915. [Google Scholar] [CrossRef]
- Peteraf, M.A. The Cornerstones of Competitive Advantage: A Resource-Based View. Strateg. Manag. J. 1993, 14, 179–191. [Google Scholar] [CrossRef]
- Roberts, P.W.; Dowling, G.R. Corporate Reputation and Sustained Superior Financial Performance. Strateg. Manag. J. 2002, 23, 1077–1093. [Google Scholar] [CrossRef]
- Barney, J.B. How a Firm’s Capabilities Affect Boundary Decisions. Sloan Manag. Rev. 1999, 40, 137. [Google Scholar]
- Barney, J. Firm Resources and Sustained Competitive Advantage. J. Manag. 1991, 17, 99–120. [Google Scholar] [CrossRef]
- Dollinger, M.J.; Golden, P.A.; Saxton, T. The Effect of Reputation on the Decision to Joint Venture. Strateg. Manag. J. 1997, 18, 127–140. [Google Scholar] [CrossRef]
- Ali, R.; Lynch, R.; Melewar, T.C.; Jin, Z. The Moderating Influences on the Relationship of Corporate Reputation with Its Antecedents and Consequences: A Meta-Analytic Review. J. Bus. Res. 2015, 68, 1105–1117. [Google Scholar] [CrossRef] [Green Version]
- Berens, G.; van Riel, C.B.M. Corporate Associations in the Academic Literature: Three Main Streams of Thought in the Reputation Measurement Literature. Corp. Reput. Rev. 2004, 7, 161–178. [Google Scholar] [CrossRef]
- Davies, G.; Chun, R.; da Silva, R.V.; Roper, S. Corporate Reputation and Competitiveness, 1st ed.; Routledge: London, UK, 2003; ISBN 041528743X. [Google Scholar]
- Fombrun, C.; van Riel, C. The Reputational Landscape. Corp. Reput. Rev. 1997, 1, 5–13. [Google Scholar] [CrossRef] [Green Version]
- Meijer, A.J. Introduction to the Special Issue on Government Transparency. Int. Rev. Adm. Sci. 2012, 78, 3–9. [Google Scholar] [CrossRef]
- Veh, A.; Göbel, M.; Vogel, R. Corporate Reputation in Management Research: A Review of the Literature and Assessment of the Concept. Bus. Res. 2019, 12, 315–353. [Google Scholar] [CrossRef] [Green Version]
- Pham, H.S.T.; Tran, H.T. CSR Disclosure and Firm Performance: The Mediating Role of Corporate Reputation and Moderating Role of CEO Integrity. J. Bus. Res. 2020, 120, 127–136. [Google Scholar] [CrossRef]
- Fombrun, C.J.; van Riel, C.B.M. Fame & Fortune: How Successful Companies Build Winning Reputations; FT Press: New Jersey, NJ, USA, 2004. [Google Scholar]
- De Castro, G.M.; López, J.E.N.; Sáez, P.L. Business and Social Reputation: Exploring the Concept and Main Dimensions of Corporate Reputation. J. Bus. Ethics 2006, 63, 361–370. [Google Scholar] [CrossRef]
- Rindova, V.P.; Williamson, I.O.; Petkova, A.P. Reputation as an Intangible Asset: Reflections on Theory and Methods in Two Empirical Studies of Business School Reputations. J. Manag. 2010, 36, 610–619. [Google Scholar] [CrossRef]
- Carpenter, D.P.; Krause, G.A. Reputation and Public Administration. Public Adm. Rev. 2011, 72, 26–32. [Google Scholar] [CrossRef]
- Walker, K. A Systematic Review of the Corporate Reputation Literature: Definition, Measurement, and Theory. Corp. Reput. Rev. 2010, 12, 357–387. [Google Scholar] [CrossRef]
- Lange, D.; Lee, P.M.; Dai, Y. Organizational Reputation: A Review. J. Manag. 2011, 37, 153–184. [Google Scholar] [CrossRef] [Green Version]
- Clardy, A. Organizational Reputation: Issues in Conceptualization and Measurement. Corp. Reput. Rev. 2012, 15, 285–303. [Google Scholar] [CrossRef]
- Dowling, G.R. Defining and Measuring Corporate Reputations. Eur. Manag. Rev. 2016, 13, 207–223. [Google Scholar] [CrossRef]
- Money, K.; Saraeva, A.; Garnelo-Gomez, I.; Pain, S.; Hillenbrand, C. Corporate Reputation Past and Future: A Review and Integration of Existing Literature and a Framework for Future Research. Corp. Reput. Rev. 2017, 20, 193–211. [Google Scholar] [CrossRef]
- Ahmadiani, M.; Ferreira, S. Environmental Amenities and Quality of Life across the United States. Ecol. Econ. 2019, 164, 106341. [Google Scholar] [CrossRef]
- Kaplan, R.M. The Significance of Quality of Life in Health Care. Qual. Life Res. 2003, 12, 3–16. [Google Scholar] [CrossRef] [PubMed]
- Barcaccia, B.; Esposito, G.; Matarese, M.; Bertolaso, M.; Elvira, M.; de Marinis, M.G. Defining Quality of Life: A Wild-Goose Chase? Eur. J. Psychol. 2013, 9, 185–203. [Google Scholar] [CrossRef]
- Mittal, S.; Chadchan, J.; Mishra, S.K. Review of Concepts, Tools and Indices for the Assessment of Urban Quality of Life. Soc. Indic. Res. 2020, 149, 187–214. [Google Scholar] [CrossRef]
- Akande, A.; Cabral, P.; Gomes, P.; Casteleyn, S. The Lisbon Ranking for Smart Sustainable Cities in Europe. Sustain. Cities Soc. 2019, 44, 475–487. [Google Scholar] [CrossRef]
- Bérenger, V.; Verdier-Chouchane, A. Multidimensional Measures of Well-Being: Standard of Living and Quality of Life across Countries. World Dev. 2007, 35, 1259–1276. [Google Scholar] [CrossRef]
- Navarro-Azorín, J.M.; Artal-Tur, A. Foot Voting in Spain: What Do Internal Migrations Say About Quality of Life in the Spanish Municipalities? Soc. Indic. Res. 2015, 124, 501–515. [Google Scholar] [CrossRef]
- Dadashpoor, H.; Khalighi, N. Investigating Spatial Distribution of Regional Quality of Life (RQoL) in Iran between 1996 and 2011. Soc. Indic. Res. 2016, 127, 1217–1248. [Google Scholar] [CrossRef]
- Coggburn, J.D.; Schneider, S.K. The Relationship between State Government Performance and State Quality of Life. Int. J. Public Adm. 2003, 26, 1337–1354. [Google Scholar] [CrossRef]
- Massam, B.H. Quality of Life: Public Planning and Private Living. Prog. Plan. 2002, 58, 141–227. [Google Scholar] [CrossRef]
- Marans, R.W. Quality of Urban Life Studies: An Overview and Implications for Environment-Behaviour Research. Procedia-Soc. Behav. Sci. 2012, 35, 9–22. [Google Scholar] [CrossRef] [Green Version]
- Verdugo, M.A.; Navas, P.; Gómez, L.E.; Schalock, R.L. The Concept of Quality of Life and Its Role in Enhancing Human Rights in the Field of Intellectual Disability. J. Intellect. Disabil. Res. 2012, 56, 1036–1045. [Google Scholar] [CrossRef] [PubMed]
- Dasgupta, P.; Weale, M. On Measuring the Quality of Life. World Dev. 1992, 20, 119–131. [Google Scholar] [CrossRef]
- Kaklauskas, A.; Zavadskas, E.K.; Radzeviciene, A.; Ubarte, I.; Podviezko, A.; Podvezko, V.; Kuzminske, A.; Banaitis, A.; Binkyte, A.; Bucinskas, V. Quality of City Life Multiple Criteria Analysis. Cities 2018, 72, 82–93. [Google Scholar] [CrossRef]
- Morais, P.; Camanho, A.S. Evaluation of Performance of European Cities with the Aim to Promote Quality of Life Improvements. Omega 2011, 39, 398–409. [Google Scholar] [CrossRef] [Green Version]
- Zhu, J. Multidimensional Quality-of-Life Measure with an Application to Fortune’s Best Cities. Socio-Econ. Plan. Sci. 2001, 35, 263–284. [Google Scholar] [CrossRef]
- Faria, P.A.M.; Ferreira, F.A.F.; Jalali, M.S.; Bento, P.; António, N.J.S. Combining Cognitive Mapping and MCDA for Improving Quality of Life in Urban Areas. Cities 2018, 78, 116–127. [Google Scholar] [CrossRef]
- Marshall, E.; Shortle, J. Using DEA and VEA to Evaluate Quality of Life in the Mid-Atlantic States. Agric. Resour. Econ. Rev. 2005, 34, 185–203. [Google Scholar] [CrossRef] [Green Version]
- Hashimoto, A.; Ishikawa, H. Using DEA to Evaluate the State of Society as Measured by Multiple Social Indicators. Socio-Econ. Plan. Sci. 1993, 27, 257–268. [Google Scholar] [CrossRef]
- De Morais, P.A.B.T. Evaluation of Performance of European Cities with the Aim of Increasing Quality of Life; ProQuest: Ann Arbor, MI, USA, 2011. [Google Scholar]
- Liu, L. Quality of Life as a Social Representation in China: A Qualitative Study. Soc. Indic. Res. 2006, 75, 217–240. [Google Scholar] [CrossRef]
- Das, D. Urban Quality of Life: A Case Study of Guwahati. Soc. Indic. Res. 2008, 88, 297–310. [Google Scholar] [CrossRef]
- Bigerna, S.; Polinori, P. Quality of Life in Major Italian Cities: Do Local Governments Cost Efficiency Contribute to Improve Urban Life Style? An Introductory Analysis. Econ. Policy Energy Environ. 2012, 24, 121–144. [Google Scholar] [CrossRef]
- Barreira, A.P.; Amado, C.; Santos, S.; Andraz, J.; Guimarães, M.H. Assessment and Determinants of the Quality of Life in Portuguese Cities. Int. Reg. Sci. Rev. 2020, 44, 1–37. [Google Scholar] [CrossRef]
- Murias, P.; Martinez, F.; de Miguel, C. An Economic Wellbeing Index for the Spanish Provinces: A Data Envelopment Analysis Approach. Soc. Indic. Res. 2006, 77, 395–417. [Google Scholar] [CrossRef]
- González, E.; Cárcaba, A.; Ventura, J. Weight Constrained DEA Measurement of the Quality of Life in Spanish Municipalities in 2011. Soc. Indic. Res. 2018, 136, 1157–1182. [Google Scholar] [CrossRef] [Green Version]
- Goerlich, F.J.; Reig, E. Quality of Life Ranking of Spanish Cities: A Non-Compensatory Approach. Cities 2021, 109, 102979. [Google Scholar] [CrossRef]
- Rindova, V.P.; Fombrun, C.J. Constructing Competitive Advantage: The Role of Firm–Constituent Interactions. Strateg. Manag. J. 1999, 710, 691–710. [Google Scholar] [CrossRef]
- Makadok, R. Doing the Right Thing and Knowing the Right Thing to Do: Why the Whole Is Greater than the Sum of the Parts. Strateg. Manag. J. 2003, 24, 1043–1055. [Google Scholar] [CrossRef]
- Galbreath, J. Which Resources Matter the Most to Firm Success? An Exploratory Study of Resource-Based Theory. Technovation 2005, 25, 979–987. [Google Scholar] [CrossRef]
- Gómez, J.; Vargas, P. Intangible Resources and Technology Adoption in Manufacturing Firms. Res. Policy 2012, 41, 1607–1619. [Google Scholar] [CrossRef]
- Norris, P. Digital Divide: Civic Engagement, Information Poverty, and the Internet Worldwide; Cambridge University Press: Cambridge, UK, 2001. [Google Scholar]
- Ciborra, C. Interpreting E-Government and Development: Efficiency, Transparency or Governance at a Distance? Inf. Technol. People 2005, 18, 260–279. [Google Scholar] [CrossRef]
- Torres, L.; Pina, V.; Acerete, B. E-Government Developments on Delivering Public Services among EU Cities. Gov. Inf. Q. 2005, 22, 217–238. [Google Scholar] [CrossRef]
- Jaeger, P.T. Deliberative Democracy and the Conceptual Foundations of Electronic Government. Gov. Inf. Q. 2005, 22, 702–719. [Google Scholar] [CrossRef]
- Belanche, D.; Casaló, L.V. Rebuilding Public Trust in Government Administrations through E-Government Actions. Rev. Española Investig. Mark. ESIC 2015, 19, 1–11. [Google Scholar] [CrossRef] [Green Version]
- Feeney, M.K.; Welch, E.W. Electronic Participation Technologies and Perceived Outcomes for Local Government Managers. Public Manag. Rev. 2012, 14, 815–833. [Google Scholar] [CrossRef]
- Walsh, G.; Beatty, S.E. Customer-Based Corporate Reputation of a Service Firm: Scale Development and Validation. J. Acad. Mark. Sci. 2007, 35, 127–143. [Google Scholar] [CrossRef]
- Grimmelikhuijsen, S. Linking Transparency, Knowledge and Citizen Trust in Government: An Experiment. Int. Rev. Adm. Sci. 2012, 78, 50–73. [Google Scholar] [CrossRef] [Green Version]
- McDermott, P. Building Open Government. Gov. Inf. Q. 2010, 27, 401–413. [Google Scholar] [CrossRef]
- Welch, E.W. The Relationship between Transparent and Participative Government: A Study of Local Governments in the United States. Int. Rev. Adm. Sci. 2012, 78, 93–115. [Google Scholar] [CrossRef]
- Islam, R. Do More Transparent Governments Govern Better? Available online: https://openknowledge.worldbank.org/handle/10986/18169 (accessed on 15 June 2015).
- Armstrong, C.E.; Shimizu, K. A Review of Approaches to Empirical Research on the Resource-Based View of the Firm. J. Manag. 2007, 33, 959–986. [Google Scholar] [CrossRef]
- Nason, R.S.; Wiklund, J. An Assessment of Resource-Based Theorizing on Firm Growth and Suggestions for the Future. J. Manag. 2018, 44, 32–60. [Google Scholar] [CrossRef]
- Walker, R.M.; Andrews, R. Local Government Management and Performance: A Review of Evidence. J. Public Adm. Res. Theory 2015, 25, 101–133. [Google Scholar] [CrossRef] [Green Version]
- Beeri, I.; Uster, A.; Vigoda-Gadot, E. Does Performance Management Relate to Good Governance? A Study of Its Relationship with Citizens’ Satisfaction with and Trust in Israeli Local Government. Public Perform. Manag. Rev. 2019, 42, 241–279. [Google Scholar] [CrossRef]
- Termeer, C.J.A.M.; Dewulf, A.; Breeman, G.; Stiller, S.J. Governance Capabilities for Dealing Wisely With Wicked Problems. Adm. Soc. 2015, 47, 680–710. [Google Scholar] [CrossRef]
- Johnsen, Å. Impacts of Strategic Planning and Management in Municipal Government: An Analysis of Subjective Survey and Objective Production and Efficiency Measures in Norway. Public Manag. Rev. 2018, 20, 397–420. [Google Scholar] [CrossRef]
- Weiss, J. Managing Performance and Strategy: Managerial Practices in German Local Governments. Public Perform. Manag. Rev. 2020, 43, 1129–1149. [Google Scholar] [CrossRef]
- Uysal, M.; Sirgy, M.J. Quality-of-Life Indicators as Performance Measures. Ann. Tour. Res. 2019, 76, 291–300. [Google Scholar] [CrossRef]
- Cravens, K.S.; Oliver, E.G. Employees: The Key Link to Corporate Reputation Management. Bus. Horiz. 2006, 49, 293–302. [Google Scholar] [CrossRef]
- Kwon, K.; Rupp, D.E. High-Performer Turnover and Firm Performance: The Moderating Role of Human Capital Investment and Firm Reputation. J. Organ. Behav. 2013, 34, 129–150. [Google Scholar] [CrossRef]
- Makarius, E.E.; Stevens, C.E. Drivers of Collective Human Capital Flow: The Impact of Reputation and Labor Market Conditions. J. Manag. 2019, 45, 1145–1172. [Google Scholar] [CrossRef]
- Caamaño-Alegre, J.; Lago-Peñas, S.; Reyes-Santias, F.; Santiago-Boubeta, A. Budget Transparency in Local Governments: An Empirical Analysis. Local Gov. Stud. 2012, 39, 182–207. [Google Scholar] [CrossRef] [Green Version]
- Transparency International Spain Transparency Indexes of Municipalities Year 2008. Available online: http://transparencia.org.es/en/ita-2008/ (accessed on 15 June 2015).
- Monitor Empresarial Reputación Corporativa Merco Ciudad Reputada 2008. Available online: http://villafane.com/files/Reputacion_ciudad_100709.pdf (accessed on 15 June 2015).
- Goerlich Gisbert, F.J.; Reig Martínez, E.; Albert Pérez, C.; Robledo Domínguez, J.C. Las Áreas Urbanas Funcionales En España: Economía y Calidad de Vida; Fundación BBVA: Bilbao, Spain, 2019. [Google Scholar]
- Morais, P.; Miguéis, V.L.; Camanho, A.S. Quality of Life Experienced by Human Capital: An Assessment of European Cities. Soc. Indic. Res. 2013, 110, 187–206. [Google Scholar] [CrossRef]
- Hair, J.F.; Anderson, R.E.; Tatham, R.L.; Black, W.C. Análisis Multivariante, 5th ed.; Prentice Hall Iberia: Madrid, Spain, 1999. [Google Scholar]
- Lévy, J.-P.; Varela, J. Análisis Multivariable Para Las Ciencias Sociales; Pearson: Madrid, Spain, 2003. [Google Scholar]
- Bollen, K. Structural Equations with Latent Variables; John Wiley & Sons: New York, NY, USA, 1989. [Google Scholar]
- Curtin, D.; Meijer, A.J. Does Transparency Strengthen Legitimacy? A Critical Analysis of European Union Policy Documents. Inf. Polity 2006, 11, 109–122. [Google Scholar] [CrossRef] [Green Version]
- La Porte, T.M.; Demchak, C.C.; de Jong, M. Democracy and Bureaucracy in the Age of the Web: Empirical Findings and Theoretical Speculations. Adm. Soc. 2002, 34, 411–446. [Google Scholar] [CrossRef]
- Cook, F.L.; Jacobs, L.R.; Kim, D. Trusting What You Know: Information, Knowledge, and Confidence in Social Security. J. Politics 2010, 72, 397. [Google Scholar] [CrossRef]
- Welch, E.W.; Hinnant, C.C.; Moon, M.J. Linking Citizen Satisfaction with E-Government and Trust in Government. J. Public Adm. Res. Theory 2005, 15, 371–391. [Google Scholar] [CrossRef] [Green Version]


| Type of Measure | Fit Measure | Value |
|---|---|---|
| Absolute fit measures | CHI-SQUARE | 41.516 |
| df | 32 | |
| p-value | 0.121 | |
| RMSEA (Root Mean Square Error of Approximation) | 0.062 | |
| Parsimony measures | CMIN/df (Normed Chi-Square) | 1.297 |
| Incremental fit measures | CFI (Comparative Fit Index) | 0.947 |
| IFI (Incremental Fit Index) | 0.953 | |
| TLI (Tucker–Lewis Index) | 0.909 |
Publisher’s Note: MDPI stays neutral with regard to jurisdictional claims in published maps and institutional affiliations. |
© 2021 by the authors. Licensee MDPI, Basel, Switzerland. This article is an open access article distributed under the terms and conditions of the Creative Commons Attribution (CC BY) license (https://creativecommons.org/licenses/by/4.0/).
Share and Cite
Iglesias-Antelo, S.; López-López, V.; Vázquez-Sanmartín, A. Assessing the Influence of Strategic Resources on the Quality of Life in Spanish Cities. Sustainability 2021, 13, 13048. https://doi.org/10.3390/su132313048
Iglesias-Antelo S, López-López V, Vázquez-Sanmartín A. Assessing the Influence of Strategic Resources on the Quality of Life in Spanish Cities. Sustainability. 2021; 13(23):13048. https://doi.org/10.3390/su132313048
Chicago/Turabian StyleIglesias-Antelo, Susana, Vicente López-López, and Antonio Vázquez-Sanmartín. 2021. "Assessing the Influence of Strategic Resources on the Quality of Life in Spanish Cities" Sustainability 13, no. 23: 13048. https://doi.org/10.3390/su132313048