Article

Quantifying Recycled Moisture in Precipitation in Qilian Mountains

1
College of Geography and Environmental Science, Northwest Normal University, Lanzhou 730070, China
2
Shiyang River Ecological Environment Observation Station, Northwest Normal University, Lanzhou 730070, China
3
School of Pharmaceutical and Materials Engineering, Taizhou University, Taizhou 318000, China
*
Author to whom correspondence should be addressed.
Sustainability 2021, 13(23), 12943; https://doi.org/10.3390/su132312943
Submission received: 15 October 2021 / Revised: 20 November 2021 / Accepted: 20 November 2021 / Published: 23 November 2021
(This article belongs to the Topic Water Management in the Era of Climatic Change)

Abstract

:
Studies about the hydrological cycle based on basin or regional scales often ignore the uniqueness of recycling moisture in mountain areas, and little effort has been made to understand the impact of the local recycled moisture on precipitation in mountain areas. We collected and analyzed a series of samples (stable isotope of precipitation, soil water, plant water, runoff, and groundwater) in the Qilian Mountains, northwest of China. Based on the isotopic mixing model, the characteristics of recycled moisture in the Qilian Mountains were evaluated. The results showed that lateral advection moisture is the primary source of precipitation (83.5~98.38%). The contribution rate of recycled moisture to precipitation was higher in the spring, summer, and autumn (2.05~16.5%), and lower in the winter (1.62~3.32%). The contribution of recycled moisture to precipitation in the high-elevation areas (>2400 m) was higher than that in the foothills area (2100~2400 m). The contribution of vegetation transpiration (fTr) to precipitation in the east of Qilian Mountain was higher than that of the land surface evaporation (fEv). These proved that in the eastern part of Qilian Mountain, the arge-scale water cycle has a greater impact on precipitation in the area. The influence of local circulating water on precipitation dominated in the summer half of the year. Understanding the contribution of local circulating water to precipitation in the eastern part of Qilian Mountain will help us to understand the local hydrothermal conditions better and provide a basis for rationally arranging local agricultural production activities.

1. Introduction

Precipitation comes from the antecedent atmospheric moisture, lateral advection, and local evapotranspiration [1,2]. Research has shown that lateral advection is the major moisture source of precipitation globally, with fTr (proportion of plant transpiration water vapor in precipitation) and fEv (proportion of surface evaporation water vapor in precipitation) being the second and third. However, there is considerable spatiotemporal variation among the three types of moisture in the world [3,4], which profoundly affects the global and local water cycle [5]. Stable hydrogen and oxygen isotopes can play an important role in the quantitative research of the hydrologic cycle [6,7]. The contribution of different sources of moisture to precipitation has been a hot topic in isotope hydrology. In general, it is feasible to observe and calculate the antecedent atmospheric water vapor and lateral advection directly. The difficulty is to determine the contribution of recycled moisture. Recycled moisture mainly comes from fTr (proportion of plant transpiration water vapor in precipitation) and fEv (proportion of surface evaporation water vapor in precipitation) [8,9,10,11]. The linear mixing model for isotopes is an effective method to study the contribution of recycling moisture in different regions. Linear mixing model has been applied around the world [12], such as the Great Lakes region in North America [13], the Slave River Delta of Canada [14], the Amazon Basin of South America [15], the Nam Co Basin in the Qinghai-Tibetan Plateau [16], the Lake Shorty in Madagascar [17] and Lake Kasumiguara [18].
Most research on the moisture cycle focuses on the source of advected water vapor and its transport in different regions [8,19]. Recently, more studies have considered the transport and conversion of basin recycled moisture [4,6]. Research showed that the contribution of recycled moisture to precipitation varies greatly in time and space. In arid inland river basins, the contribution of recycled moisture is less than 30% [6,20], In some small oases, the recycled moisture contribution is less than 5% [21,22]. However, the contribution of recycled moisture can reach 62% in the Tibetan Plateau, but is much lower in winter than that in summer [6,23]. Some studies have focused on the causes of the spatial and temporal differences in recycled moisture, such as relative air humidity [19], soil water content [24], land use types and land cover changes [25].
Many studies have estimated the contribution rate of recycled moisture and its influencing factors in the watershed or regional scale [4,6,21,22,26]. Due to the obvious difference between climate and environment in the mountainous-oasis-desert regions in arid areas, studies based on basins or regional scales tend to overlook the uniqueness of recycling moisture in mountain areas. The upper Shiyang River in the northeast of Qilian Mountain is the transition zone between the Qinghai-Tibet Plateau and the arid zone. Precipitation affects the development of the oasis and desert in the middle and lower reaches. Clarifying the characteristics and influencing factors of upstream water resources changes will contribute to a reasonable solution to the demands of the middle and lower reaches of the water resources. Therefore, this study used the stable isotope data of precipitation, soil water, plant water, surface water, and groundwater from 2016 to 2018 in the upper Shiyang River in the eastern part of the Qilian Mountains to calculate the proportion of plant transpiration water vapor (fTr), surface evaporation water vapor (fEv) and advection water vapor (fAdv) in precipitation. We try to explore the source of moisture in precipitation in the mountain areas of the arid inland river basin, and to reveal the characteristics of the mountain water cycle, reasonable assessment of regional water resources.

2. Study Area and Observation Network
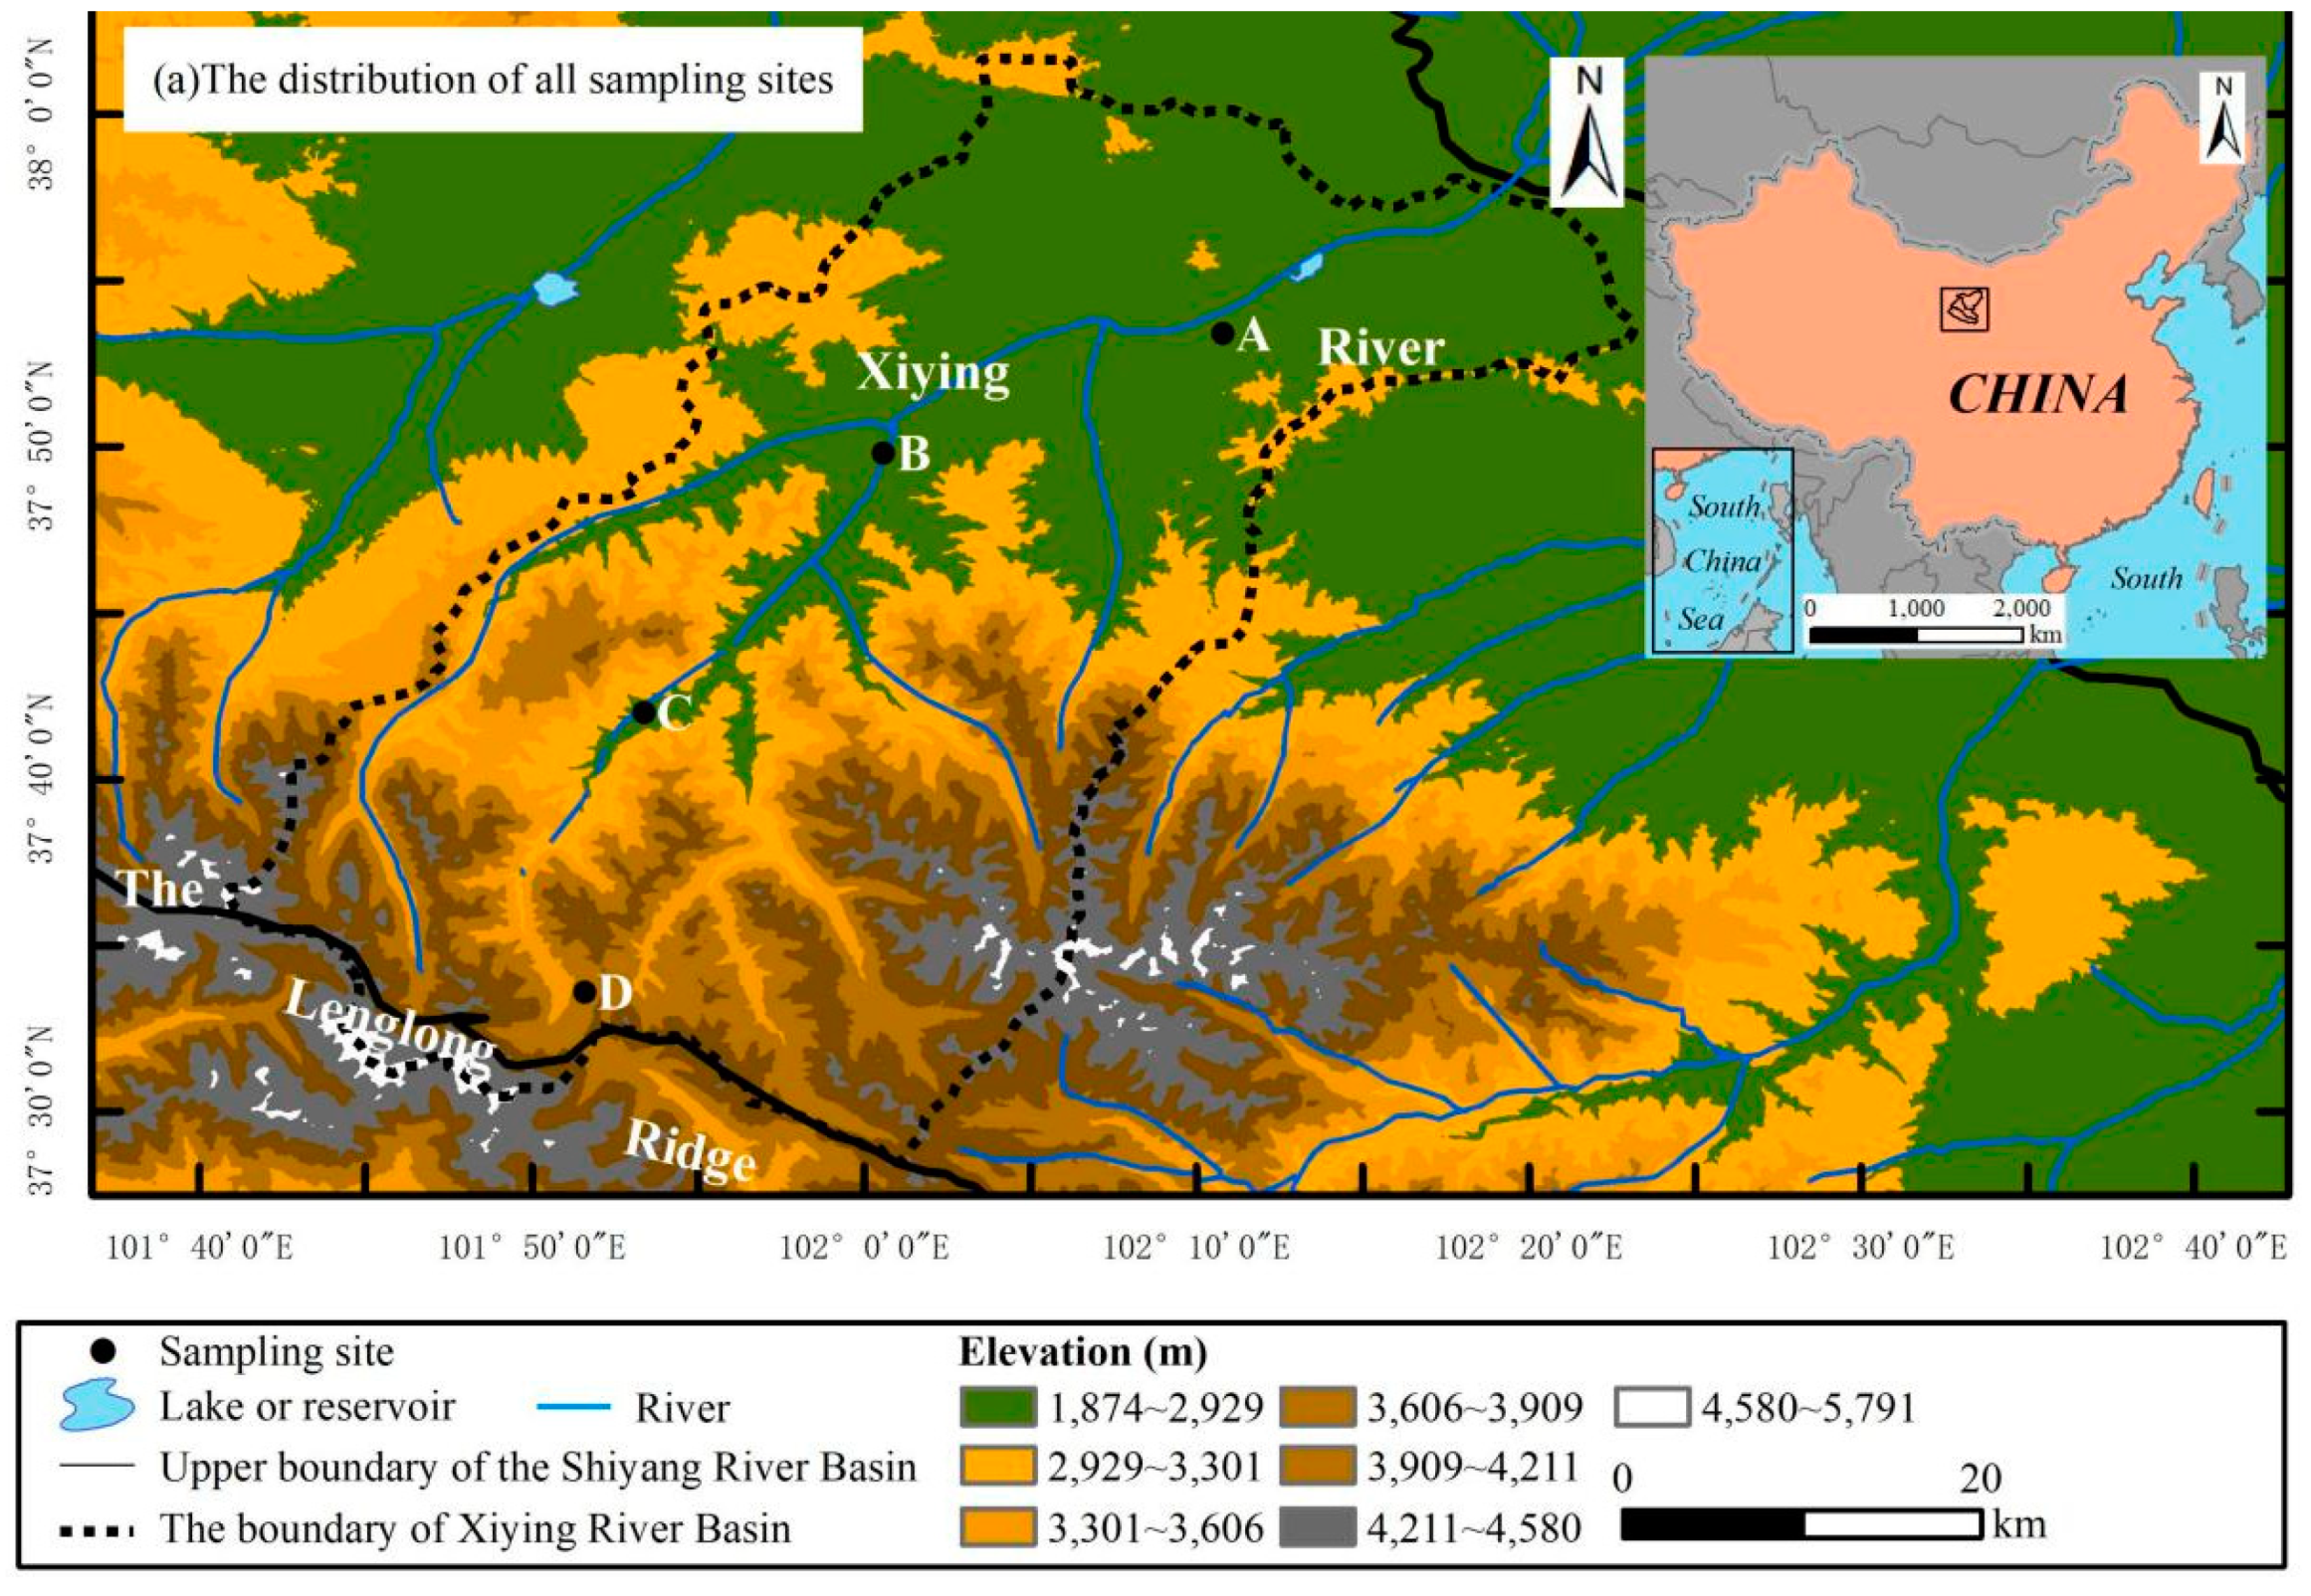
2.1. Study Area

The study area is located in the Xiying River (XYR) basin in the Qilian Mountains (Figure 1). XYR is the main tributary of the Shiyang River. It originates below the glaciers in the northern slopes of the Qilian Mountains and eventually disappears into the desert. The elevation of the XYR basin ranges from 1510 to 4874 m above sea level. The average annual temperature is 6.3 °C and the average annual precipitation ranges from 200 to 700 mm [8,27]. The upper reaches of the Shiyang River basin are located in the East Asian monsoon crisscross zone, controlled by the East Asian monsoon and plateau monsoon. Cold high pressure appears on the plateau in winter, and the air flows from the plateau to the surroundings. In summer, hot low air pressure appears on the plateau, and the air flows from all directions to the plateau [6], which is a typical continental alpine climate. Vegetation is mainly distributed in areas between 2000 m and 3600 m above sea level; the basin is affected by multiple sources of moisture [6,27].

2.2. Observation Network, Sampling, and Analysis

From April 2016 to October 2018, four sampling sites were established in the XYR Basin (Figure 1). A total of 867 samples were collected from the upstream mountain areas (Table 1). Two-hundred forty-five precipitation samples at sampling sites were collected immediately after the end of each precipitation process using a rain gauge. The precipitation samples were put into a 50 mL polyethylene sampling bottle. The bottle cap was tightened, and the bottle mouth was sealed with a sealing film and stored in cold storage until analysis. Surface water samples were sealed and stored in cold storage after each collection. Meanwhile, automatic meteorological observation instruments recorded meteorological elements such as temperature, precipitation, relative humidity and atmospheric pressure [6]. All samples were analyzed for δ2H and δ18O using liquid water. For runoff, the bottle was placed under the water surface until the container was filled. A total of 82 runoff samples were collected at different elevations (Table 1). For soil water, soil samples were collected from 10 cm to 100 cm, using soil spirals every 10 cm. All samples were placed in 100 mL polyethylene vials. A total of 450 soil samples were collected (Table 1). For plant water, typical vegetation at each sampling site was selected, and scissors were used to cut the xylem or branches of the same vegetation. A total of 90 plant samples were collected (Table 1). All samples were stored in a mobile freezer (−5 °C) and transferred to a freezer laboratory (−15 °C) within a week after collection.
The samples were melted at room temperature (20~25 °C) before further analyses. The plant and soil water were extracted using a cryogenic vacuum distillation apparatus (LI-2100, LICA United Technology Limited, China). All samples were analyzed using a liquid water isotope analyzer DLT-100 (Los Gatos Research, Inc.) in the Stable Isotope Laboratory, College of Geography and Environmental Science, Northwest Normal University. The isotope ratios of samples are expressed as parts per mil (‰) relative to the Vienna Standard Mean Ocean Water (V-SMOW) using δ notation: δ(‰) = (RS/RV-SMOW−1) × 1000, where δs is the isotope ratio of the samples relative to V-SMOW and Rs is the ratio of D/H or 18O/16O in the samples. The precision of the measurements was ±0.6% for δ2H and ±0.2% for δ18O, respectively.
Meteorological data were obtained from four weather stations of the XYR basin. These weather stations record meteorological data such as temperature, precipitation, wind speed, evaporation, relative humidity, and soil moisture every 15 min.

3. Method

3.1. Three-Component Mixing Model

Moisture from precipitation is derived from local evapotranspiration and advection [28,29]. The linear mixing model can be used to calculate the contribution rate of each water source. The three-component mixing model based on δ18O and δ2H values can be expressed as follows.
δ18OPv = δ18OEv × fTr + δ18OEv × fEv + δ18OAdv × fAdv
δDPv = δDTr × fTr + δDEv × fEv + δDAdv × fAdv
1   =   f T r + f E v + f A d v
In formula (1)–(3), the contribution rate of each moisture source is expressed in terms of f while the subscript indicates the source of moisture. Subscript Pv indicates the local atmospheric moisture. Subscripts Tr, Ev, Adv, indicate moisture from transpiration, evaporation, and advection, respectively.
The contributions of fTr, fEv, and fAdv can be calculated as follows.
f T r = δ 18 O P v × δ D E v δ 18 O P v × δ D A d v + δ 18 O E v × δ D A d v δ 18 O E v × δ D P v + δ 18 O A d v × δ D P v δ 18 O A d v × δ D E v δ 18 O T r × δ D E v δ 18 O T r × δ D A d v + δ 18 O E v × δ D A d v δ 18 O E v × δ D T r + δ 18 O A d v × δ D T r δ 18 O A d v × δ D E v
f E v = δ 18 O P v × δ D A d v δ 18 O P v × δ D T r + δ 18 O T r × δ D P v δ 18 O T r × δ D A d v + δ 18 O A d v × δ D T r δ 18 O A d v × δ D P v δ 18 O T r × δ D E v δ 18 O T r × δ D A d v + δ 18 O E v × δ D A d v δ 18 O E v × δ D T r + δ 18 O A d v × δ D T r δ 18 O A d v × δ D E v
f A d v = δ 18 O P v × δ D T r δ 18 O P v × δ D E v + δ 18 O T r × δ D E v δ 18 O T r × δ D P v + δ 18 O E v × δ D P v δ 18 O E v × δ D T r δ 18 O T r × δ D E v δ 18 O T r × δ D A d v + δ 18 O E v × δ D A d v δ 18 O E v × δ D T r + δ 18 O A d v × δ D T r δ 18 O A d v × δ D E v
The δ18Opv and δDpv value can also be derived from the value of the stable isotope from local precipitation and the equilibrium fractionation factor:
δ 18 O Pv     δ 18 O P 10 3 ×   ( α W V 18 1 )
δ D Pv     δ D P 10 3 ×   ( α W V 2 1 )
The specific formula is as follows [30,31]:
10 3 In α W V 18   =   1.137 × ( 10 6 T 2 ) 0.4156 × ( 10 3 T ) 2.0667
10 3 In α W V 2   =   24.844 × ( 10 6 T 2 ) 76.248 × ( 10 3 T ) 52.612
The δ18OEv and δDev can be expressed by the value of the stable isotope from advection (δ18OAdv and δDAdv) and local the surface water (δ18Os or δDs), mean relative humidity (h), the sum of equilibrium (εeq) and kinetic (∆ε):
δ 18 O E v = δ 18 O S h × δ 18 O A d v ε 18 1 h
δ D E v = δ D S h × δ D A d v ε 2 1 h
ε 18 = ε e q 18 + Δ ε 18
ε 2 = ε e q 2 + Δ ε 2
ε e q 18 = 1000 × ( 1 1 α W V 18 )
ε e q 2 = 1000 × ( 1 1 α W V 2 )
Δ ε 18 = 14.2 × ( 1 h )
Δ ε 2 = 12.5 × ( 1 h )
Based on previous studies on δ18OAdv and δDAdv, we used the following formula to investigate the characteristics in the XYR Basin.
δ 18 O A d v δ 18 O p v + ( a w v 18 1 ) × ln F
δ D A d v δ D p v + ( a w v 2 1 ) × ln F
In the above formulas, the F indicates the ratio between the initial and the final vapor, which is estimated by the precipitable water amount in the two sites. Previous research in the Tianshan Mountains concluded that precipitable water correlates with moisture pressure (c = 1.657e, where c indicates atmospheric moisture content in mm and e indicates surface moisture pressure in hPa, r2 = 0.94) [32]. Hence, the surface moisture pressure ratio between the two sampling sites is equal to the value of F. Since the isotope ratios in precipitating vapor at the sampling sites are much more depleted than the upwind station, the Rayleigh distillation equation was also applied. In this research, formula 6 was used to calculate the stable isotope ratios in advection vapor. If there is no significant depletion of isotopes between the sampling site and the upwind station, then the stable isotope ratios in advection vapor at the sampling site are considered to be the same as that in the precipitating vapor at the upwind station.
Because there is no fractionation during the transport of moisture from fTr to the atmosphere [33], the value of δ18OEv and δDTr is the same as that of local water used by plants (δ18OEv and δDw). This research calculated the average value of δ18O (δ2H) from the soil surface to a depth of 40cm below and xylem, to obtain δ18OEv and δDTr. The results for each sampling site in this study area are shown in Table 2.

3.2. Hysplit Model and the Upper Wind Direction

We applied the HYSPLIT model to simulate the moisture sources in the Qilan Mountains [34,35,36,37]. We found that westerly winds, southeast monsoons, and plateau monsoons all affect the Qilian Mountains in summer. In winter, westerly winds mainly affect the Qilian Mountains.
According to the clustering of air mass in different seasons, the air mass gathered at the northern foot of Qilian Mountain and then moved from a low elevation to a high elevation along the valley. Therefore, sampling site A was used as an upwind station for spring, summer, and autumn. In winter, the study area was dominated by a westerly wind, and Urumqi and Hotan (GNIP) in Central Asia were regarded as the upwind direction stations.

3.3. Method of Reducing Experimental Error

The isotope mixture model is an effective method for specific regional moisture recirculation research, but the inherent uncertainty of the model still needs to be considered. In this study, we focused on the correction of experimental errors in plant xylem moisture.
The water obtained in plant Xylem contained organic pollutants such as methanol and ethanol by the low-temperature vacuum distillation extraction technology, which caused deviations in the measurement of the laser isotope analyzer. This error has led to significant differences in the estimation of the amount of vegetation evapotranspiration. In different studies, some unreasonable calculation results of negative fTr value will appear.
In this study, deionized water was mixed with methanol and ethanol (pure chromatographical) of different concentrations. The spectral software (LWIA-Spectral Contamination Identifier v1.0, Los Gatos company) was used to determine the spectral measurement of the pollution degree of methanol (NB), and ethanol (BB), the δD and δ18O spectral pollution correction methods were established [38,39,40]. The configuration of the concentration of methanol and ethanol solutions during the calibration process is the same as the related experiments by Meng et al. (2012). For the calibration result of methanol, the logarithm of the broadband metric NB metric and Δδ2H and Δδ18O have significant quadratic curve relationships:
Δδ2H = 0.018 (ln.NB)3 + 0.092 (ln.NB)2 + 0.388ln.NB + 0.785 (R2 = 0.991, p < 0.0001)
Δδ18O = 0.017 (ln.NB)3 + 0.017 (ln.NB)2 + 0.545ln.NB + 1.356 (R2 = 0.998, p < 0.0001)
For the calibration results, the broadband metric BB metric has a quadratic curve and linear relationship with Δδ2H and Δδ18O, respectively:
Δδ2H = −85.67BB + 93.664 (R2 = 0.7447, p = 0.026)
Δδ18O = −21.421BB2 + 39.935BB−19.089 (R2 = 0.769, p = 0.012)
After correction, the calculation result of negative fTr value was eliminated. Of course, there are also other uncertainties in model research, such as driving data sampling and experimental errors, structural errors in the physical mechanism of the model, and parameter errors.

4. Results and Analysis

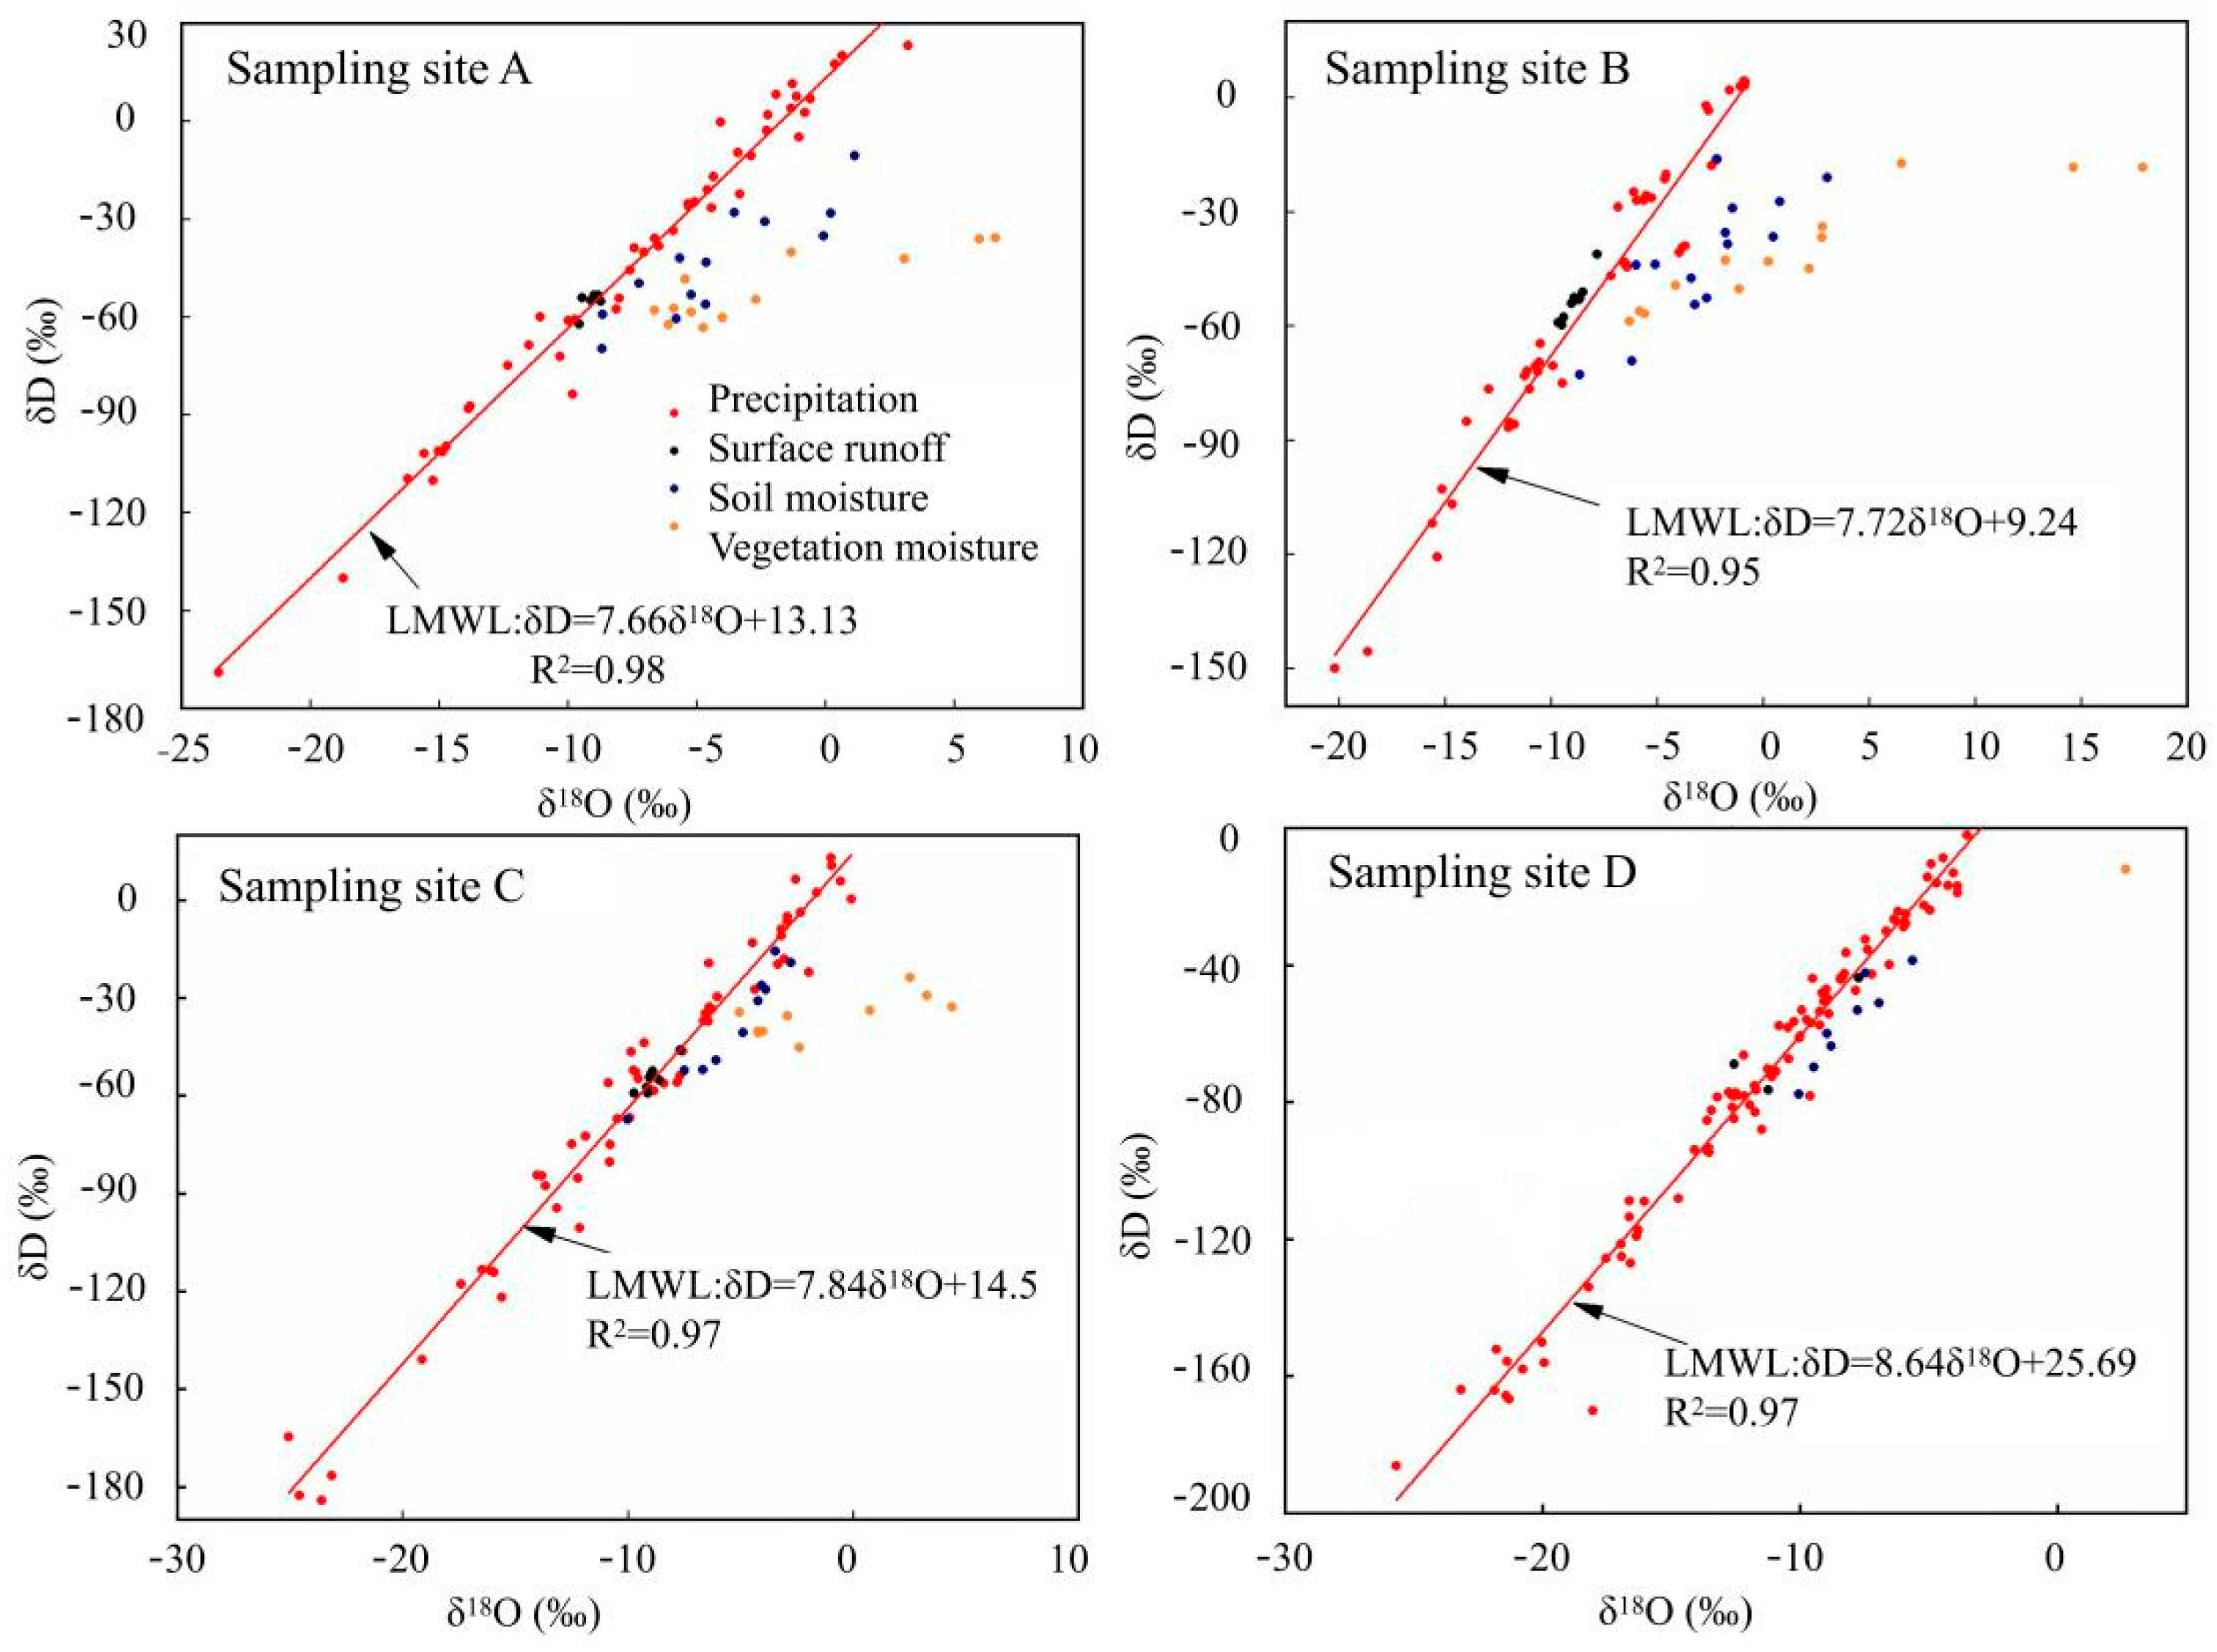
4.1. Isotopic Composition of Different Water Bodies

The differences in the Local Meteoric Water Line (LMWL) are explained by the differences in topography, underlying surface, climate, and other natural environmental factors. From sampling points A to D, both the temperature and the evaporation decrease because of the increasing elevation. The slope of the LMWL gradually increases, and the extent of soil water and plant water deviating from the LMWL also increases. These factors indicate that as the elevation increases, the evapotranspiration of soil and vegetation gradually decreases.
In sampling point D (River source), the δ2H and δ18O in different water bodies are similar. The δ2H and δ18O of soil moisture, vegetation moisture, and surface runoff of each sampling site fall to the lower right of the LMWL, indicating that different water bodies are all recharged by precipitation in the source areas, which is significantly different from sampling point A, B, and C.
The characteristics of δ2H and δ18O are similar in the different water bodies in the mountain area in sampling points A, B, and C. The δ2H and δ18O of the surface water samples plot near or above the LMWL (Figure 2), and the soil and vegetation water plot to the lower right of the LMWL (Figure 2). The distribution of samples indicates that the land surface water in the mountain area is mainly recharged by precipitation, while soil water and plant water experience different degrees of evaporation during water body migration and transformation.

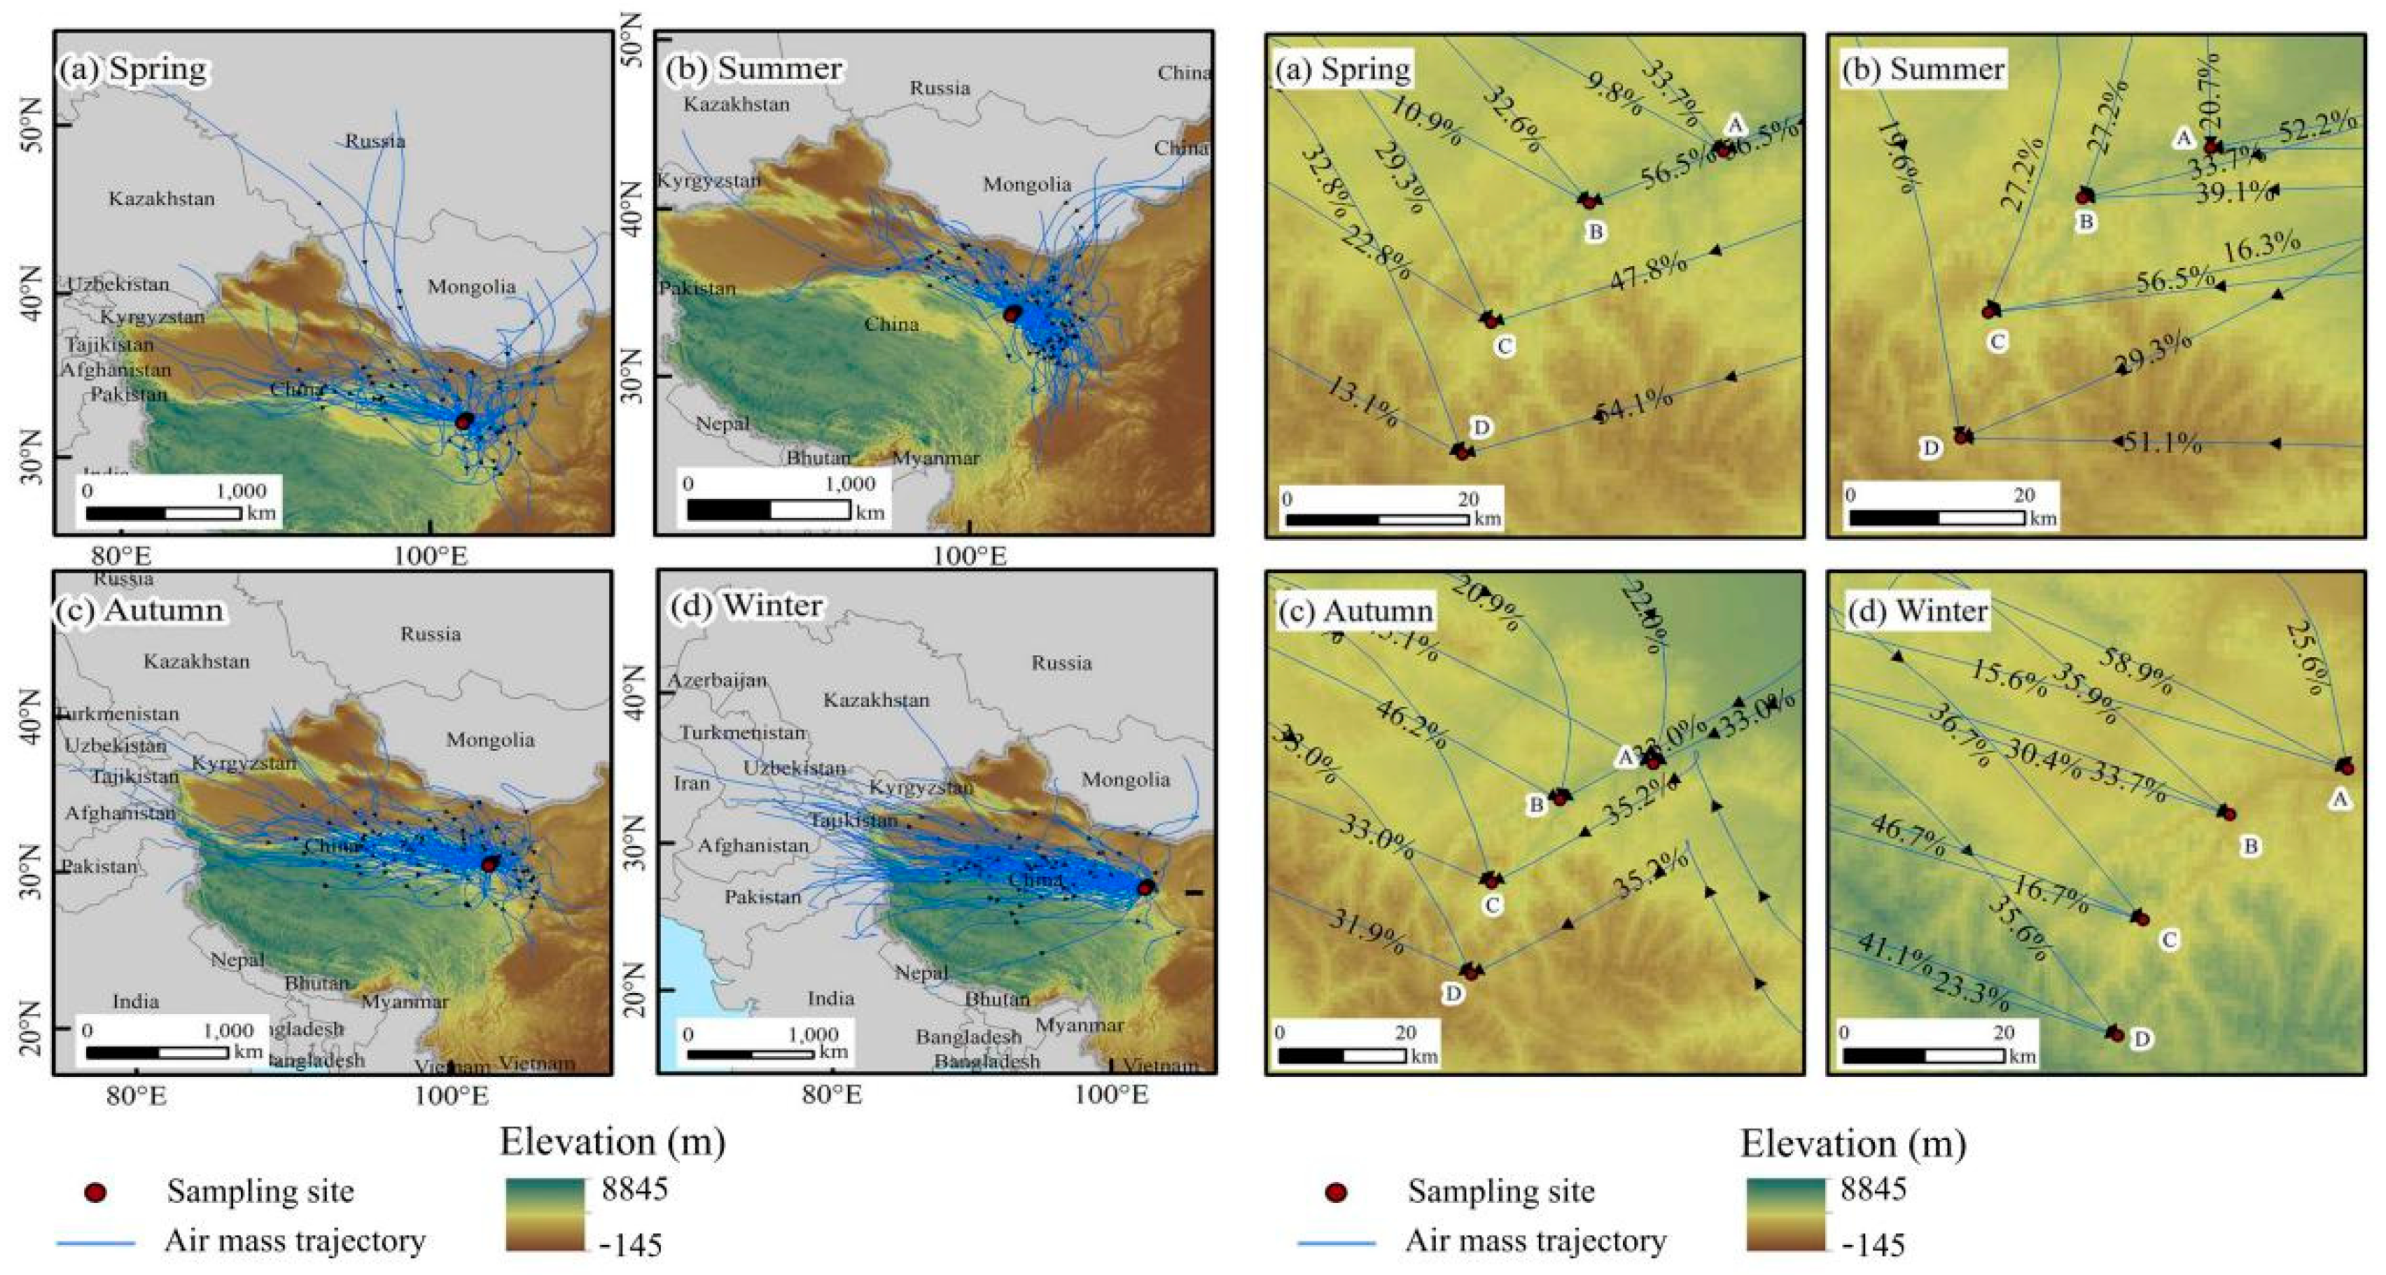
4.2. The Path of Moisture Transport

In spring, there are two main air mass movement paths moving from the western section of the study area: (1) The air mass originating from Central Asia moves along the edge of the Qinghai-Tibetan Plateau after entering the Tarim Basin; (2) The air mass originating from the West Siberian Plain, which travels the western arid region of China and then arrives at the XYR basin. In summer, the air mass mainly comes from the east of the study area, and the air mass moves from the east of the study area, similar to the pathway in spring. However, as air mass from the west of the study area decreased in occurrence, the air mass from the southeast increased and the air mass from Central Asia affects the study area along the northwest edge of the Qinghai-Tibetan plateau. In autumn, there are two main air mass movement paths in the west of the study area: (1) Air mass originating in Central Asia and the air mass originating in the Xinjiang move along the edge of the Qinghai-Tibetan Plateau; (2) The other is the air mass arises in Central Asia, crosses the Kunlun Mountains and the Qinghai-Tibetan Plateau, moves through the Qaidam basin and then reaches the study area. In winter, the air mass in the study area is controlled by the westerly wind, while the east wind of the study area has little effect on the region (Figure 3).

4.3. Spatial and Temporal Differences of Recycled Moisture

In spring (Figure 4a), the calculated contribution of recycled moisture in different sampling points was 9.9% and 16.5%, higher than that in other seasons. The contribution was largest in sampling point B (Arbor belt), and lowest in sampling point D (river source area). The melting of snow leads to higher soil moisture content in spring, which leads to higher evaporation of the soil. Plants at low elevations region begin to grow first in spring, which increases the vegetation evapotranspiration in the low elevation region. The portion of recycled moisture decreased with elevation increased (Table 2).
In summer (Figure 4b), the contribution of recycled moisture for different sampling points varied between 3.52% and 12.87%. The contribution was highest for sampling point D (River source) and the lowest for sampling point B (Arbor belt). At the sampling point D (River source), where the plant begins to grow first in July, the contribution of local transpiration fTr was 4.86%, and the contribution of evaporation fEv was 7.99%. The soil moisture content is high in the river source area, and the frozen soil has thawed in summer, so that the evapotranspiration increases rapidly, which leads to a larger fraction of recycled moisture in precipitation in the river source area. Since there is less precipitation and soil water in the low-elevation regions, the contribution of recycled moisture is higher in high-elevation areas than in low-elevation areas in summer.
In autumn (Figure 4c), the contribution of recycled moisture in the study area varied between 2.05% and 9.63%, which is lower than in spring and summer. The contribution was highest at sampling point C (Shrub belt) and lowest at sampling point B (Arbor belt) the vegetation growth in the river source stagnated, and the soil began to freeze. The sampling point C (Shrub belt) has high evapotranspiration, and the evapotranspiration was reduced due to the lack of soil moisture in sampling points A and B.
In winter, due to the influence of the cold westerly air mass, the rate of evapotranspiration weakened. The external air mass exerts a dominant influence on the moisture in winter.
Overall, the contribution rate of recycled moisture is subject to local vegetation cover, soil moisture content, and other climatic and hydrological conditions. At all sampling points, the contribution fTr moisture was higher than that of fEv moisture (Figure 4).

5. Discussion

5.1. Recycled Moisture in Inland River Basins

5.1.1. Differences between Mountainous Areas in Inland River Basins

The XYR Basin is located in the east of the Qilian Mountains and is a marginal area of the summer monsoon. Its moisture source is significantly different from that in most arid regions. The portion of moisture from the southeast and southwest in the monsoon period (June to September) is higher than in most inland river basins [6]. The sum of fTr and fEv recirculated moisture in the XYR Basin is about 10.34%, which is lower than that in Yeniugou, Hulugou, and Pailigou, which are located in the central Qilian Mountains [4], and higher than the Tianshan Mountains [21]. The main reason for the difference in the contribution of recirculated moisture in different regions is fTr. The fTr values calculated in various studies vary greatly, while the proportion of fEv is close to other stations. For XYR basin fEv is 4.81%, for bison ditch 3.6%, for Hulu ditch 5.9%, and for the dew ditch 0.9%. Controlled by meteorological factors, there are also obvious differences in recycled moisture at different elevations in the same watershed. In high elevation areas, fTr and fEv will be higher due to summer plant growth and frozen soil melting. At sampling point A (Foothill), fTr is relatively higher in spring and autumn, but soil moisture is lower due to less precipitation, resulting in a lower fEv.
In terms of spatial distribution, the vegetation cover is higher in site B and C than D. However, the recycling ratio in D is the highest in all four seasons. A possible reason accounting for this spatial pattern is that recycling ratio is scale-dependence [41]. We used site A as the unique upwind site for all sites B–D. As a result, the recycling ratio in D is the accumulated recycled moisture from site A to D and accumulated from site A to B for recycling ratio in site B. That is why recycling ratio increases with elevation rise, while vegetation and evapotranspiration are actually low in high-elevation regions due to the low air temperature. Scale-dependence is an important issue in recycling research but often is overlooked in isotope-based studies. This is also the reason why the isotope-based result is much smaller than model-based results.

5.1.2. Recycled Moisture Contribution in Mountainous, Oasis, and Desert Areas

The average contribution of fTr, fEv, and fAdv to precipitation was 5.53%, 4.8%, 90.89% in the mountains area, 21.9%, 7%, and 72% in the oasis region and 10%, 5% and 85% in the desert and gobi region [6]. In Heihe River Basin, the average contributions of fTr, fEv, and fAdv vapor to precipitation were 24.15%, 26.9%, and 51.05% in the oasis region, 15.1%, 6.3%, and 21.4% in the desert region [4]. In the Urumqi River Basin, the average contribution of oasis fTr and fEv to precipitation was 15.09% [21]. Our study mainly studies the Xiying River Basin in the eastern part of the Qilian Mountains, this area is mountainous, the fTr (proportion of plant transpiration water vapor in precipitation) and fEv (proportion of surface evaporation water vapor in precipitation) is less than 10% throughout the year. It is in line with the local water cycle characteristics of the mountain areas in arid inland river basins. In general, the proportion of recycled water in the mountain areas of arid inland river basins are lower than those in the oasis and desert areas.
With the increase in population and utilization of the oasis area, the land use has changed. The cultivated land and ecological land must be maintained by artificial irrigation in the oasis area. Since canals and flooding can affect local evaporation, the growth of crops and forests can affect fTr, which will change the contribution of recycled moisture rates in oasis areas, and this is different from the characteristics of moisture recirculation in the mountainous area.

5.2. Recycled Moisture in Precipitation in Different Regions

The contribution of recycled moisture is lowest in the North and South poles, while the highest values are found in the Tibetan Plateau, the Patagonia Plateau, and the Andes Mountains. The vast ocean provides a large amount of moisture for the moisture cycle in various regions in the world. At the same time, the latent heat from condensation absorbed and released by the vapor phase transition also promotes the flow of global energy. There is a continuous high-value area in the mid-latitudes regions [42]. In tropical coastal areas, the contribution of recirculating moisture in different landscapes is only marginally different, with a contribution around 31~37% [19]. In the marginal zone of the temperate monsoon, the source of water is complex, and the climate is changeable. The contribution of circulating water in mountainous areas, oasis and deserts, and its temporal and spatial changes are quite large [6]. In addition, lakes have a significant impact on recycled moisture, contributing 5–16% in temperate continental monsoon climate zones [13], and 10–20% in temperate marine climate zones [43], 16–50% in tropical islands [17], and 3~37.9% are in the Qinghai-Tibet Plateau [16]. Our study area is the eastern part of the Qilian Mountains. This area is on the edge of the East Asian monsoon. The temporal and spatial changes of the local water cycle are complex. The proportion of local circulating water in precipitation is smaller than that in mid-latitude regions and tropical coastal regions. However, for small areas, the circulating water in mountain areas is greater than in oasis and desert areas.
The δ2H was used in the ice core to estimate that the contribution of recycled moisture in the Qinghai-Tibet Plateau has increased in the past few decades [44,45]. It is believed that the increase in the global temperature leads to strong local surface moisture evaporation and local moisture recycling [46]. Secondly, any increase in the vegetation coverage on the land surface and the evapotranspiration associated with this increase also has a particularly strengthening effect on local moisture recycling [6]. When we study the local water cycle, we should also consider the effects of long-term climate change and local human activities.

6. Conclusions

The contribution of recycled moisture to precipitation was estimated using the linear mixing model in different seasons for different elevations. The results showed that the contribution rate of recycled moisture to precipitation was higher in the spring, summer, and autumn (2.05~16.5%) and low in winter (1.62~3.32%). In the high-elevation areas (>2400 m), the contribution rate of recycled moisture to precipitation was higher than the foothills area (2100~2400 m). The contribution of the fTr moisture was higher than that of the fEv to precipitation in the mountain areas. The contribution of recycled moisture increased with the elevation in the Qilian mountains. The water obtained from the xylem of plants contains organic pollutants (methanol and ethanol) that may cause of greater uncertainty in fTr in different studies. The quantification of the contribution rate of recycled moisture requires the cooperation of multi-source data, but the high-elevation regions often lack systematic mufti-element observation data. To better understand the contribution mechanism and influencing factors of recycled moisture, a long-term field monitoring system should be established to obtain comprehensive first-hand data. This study can provide a reference for the study of recycled moisture in other mountain areas.

Author Contributions

Conceptualization, G.Z., Z.Z. and H.P.; methodology, Z.Z. and H.P.; software, Z.Z. and H.P.; validation, Z.Z., G.Z. and H.P.; formal analysis, Z.Z.; investigation, H.P.; resources, G.Z.; data curation, H.P.; writing—original draft preparation, Z.Z., G.Z. and H.P.; writing—review and editing, Z.Z., G.Z. and H.P.; visualization, Z.S., L.S. and Y.L.; supervision, Z.Z., G.Z. and H.P.; project administration, G.Z.; funding acquisition, G.Z. All authors have read and agreed to the published version of the manuscript.

Funding

This research was funded by National Natural Science Foundation of China (41867030, 41661005, 41971036).

Institutional Review Board Statement

Not applicable.

Data Availability Statement

We have made public the stable isotope data of precipitation that support the results of this study (Zhu, Guofeng, 2020. Data sets of isotopes of different water bodies at different altitudes in Qilian Mountains, Mendeley Data, V2, doi:10.17632/bhxp9mjtv4.2) and Meteorological datasets can be found at http://data.cma.cn.

Acknowledgments

The work was supported by the National Natural Science Foundation of China (41867030, 41661005, 41971036). We thank Hanxiong Pan, Xinggang Ma, Dongdong Chen, Kai Wang, Yang Shi, Zhiyuan Zhang, Leilei Yong for assistance during fieldwork. We sincerely thank Marit Greenwood for the writing suggestions.

Conflicts of Interest

The authors declare no conflict of interest.

References

  1. Balagizi, C.M.; Kasereka, M.M.; Cuoco, E.; Liotta, M. Influence of moisture source dynamics and weather patterns on stable isotopes ratios of precipitation in Central-Eastern Africa. Sci. Total Environ. 2018, 628, 1058–1078. [Google Scholar] [CrossRef]
  2. Zannoni, D.; Steen-Larsen, H.C.; Rampazzo, G.; Dreossi, G.; Stenni, B.; Bergamasco, A. The atmospheric water cycle of a coastal lagoon: An isotope study of the interactions between water vapor, precipitation and surface waters. J. Hydrol. 2019, 572, 630–644. [Google Scholar] [CrossRef]
  3. Gibson, J.J.; Reid, R. Water balance along a chain of tundra lakes: A 20-year isotopic perspective. J. Hydrol. 2014, 519, 2148–2164. [Google Scholar] [CrossRef]
  4. Zhao, L.; Liu, X.; Wang, N.; Kong, Y.; Wang, L. Contribution of recycled moisture to local precipitation in the inland Heihe River Basin. Agric. For. Meteorol. 2019, 271, 316–335. [Google Scholar] [CrossRef]
  5. Zemp, D.C.; Schleussner, C.F.; Barbosa, H.M.J.; Van der Ent, R.J.; Donges, J.F.; Heinke1, J.; Sampaio, G.; Rammig, A. On the importance of cascading moisture recycling in South America. Atmos. Chem. Phys. 2014, 14, 13337–13359. [Google Scholar] [CrossRef] [Green Version]
  6. Zhu, G.F.; Guo, H.W.; Qin, D.H.; Pan, H.Q.; Zhang, Y.; Jia, W.X.; Ma, X.G. Contribution of recycled moisture to precipitation in the monsoon marginal zone: Estimate based on stable isotope data. J. Hydrol. 2019, 569, 423–435. [Google Scholar] [CrossRef]
  7. Cui, J.; Tian, L.; Biggs, T.W.; Wen, R. Deuterium-excess determination of evaporation to inflow ratios of an alpine lake: Implications for water balance and modeling. Hydrol. Process. 2017, 31, 1034–1046. [Google Scholar] [CrossRef]
  8. Zhu, G.F.; Zhang, Z.X.; Guo, H.W.; Zhang, Y.; Yong, L.L.; Wan, Q.Z.; Sun, Z.G.; Ma, H.Y. Below-Cloud Evaporation of Precipitation Isotope over Mountain-oasis-desert in Arid Area. J. Hydrometeorol. 2021, 22, 2533–2545. [Google Scholar] [CrossRef]
  9. Attar, A. Global environment: Water, air and geochemical cycles. Int. J. Environ. Stud. 2013, 70, 155–156. [Google Scholar] [CrossRef]
  10. Pokam, W.M.; Djiotang, L.A.T.; Mkankam, F.K. Atmospheric water vapor transport and recycling in Equatorial Central Africa through NCEP/NCAR reanalysis data. Clim. Dyn. 2014, 38, 553. [Google Scholar] [CrossRef] [Green Version]
  11. Trzeciak, T.M.; Garcia Carreras, L.; Marsham, J.H. Cross-Saharan transport of water vapor via recycled cold pool outflows from moist convection. Geophys. Res. Lett. 2017, 44, 1554–1563. [Google Scholar] [CrossRef]
  12. An, W.L.; Hou, S.G.; Zhang, Q.; Wu, W.B.; Xu, S.Y.; Pang, H.X.; Wang, Y.T.; Liu, Y.P. Enhanced recent local moisture recycling on the northwestern Tibetan Plateau deduced from ice core deuterium excess records. J. Geophys. Res. Atmos. 2017, 122, 12541–12556. [Google Scholar] [CrossRef] [Green Version]
  13. Gat, J.R.; Bowser, C.J.; Kendall, C. The contribution of evaporation from the Great Lakes to the continental atmosphere: Estimate based on stable isotope data. Geophys. Res. Lett. 1994, 21, 557–560. [Google Scholar] [CrossRef]
  14. Brock, B.E.; Yi, Y.; Clogg-Wright, K.P.; Edwards, T.W.D.; Wolfe, B.B. Multi-year landscape-scale assessment of lakewater balances in the Slave River Delta, NWT, using water isotope tracers. J. Hydrol. 2009, 379, 81–91. [Google Scholar] [CrossRef]
  15. Gat, J.R.; Matsui, E. Atmospheric water balance in the Amazon basin: An isotopic evapotranspiration model. J. Geophys. Res. 1991, 96, 13179. [Google Scholar] [CrossRef]
  16. Xu, Y.; Kang, S.; Zhang, Y.; Zhang, Y. A method for estimating the contribution of evaporative vapor from Nam Co to local atmospheric vapor based on stable isotopes of water bodies. China Sci. Bull. 2011, 56, 1511–1517. [Google Scholar] [CrossRef] [Green Version]
  17. Vallet-Coulomb, C.; Gasse, F.; Sonzogni, C. Seasonal evolution of the isotopic composition of atmospheric water vapour above a tropical lake: Deuterium excess and implication for water recycling. Geochim. Et Cosmochim. Acta 2008, 72, 4661–4674. [Google Scholar] [CrossRef]
  18. Yamanaka, T.; Ma, W. Runoff prediction in a poorly gauged basin using isotope-calibrated models. J. Hydrol. 2017, 544, 567–574. [Google Scholar] [CrossRef] [Green Version]
  19. Peng, T.R.; Liu, K.K.; Wang, C.H.; Chuang, K.H. A water isotope approach to assessing moisture recycling in the island-based precipitation of Taiwan: A case study in the western Pacific. Water Resour. Res. 2011, 47, 2168–2174. [Google Scholar] [CrossRef]
  20. Li, Z.X.; Feng, Q.; Wang, Q.J.; Kong, Y.L.; Cheng, A.F.; Yong, S.; Li, Y.G.; Li, J.G.; Guo, X.Y. Contributions of local terrestrial evaporation and transpiration to precipitation using δ18O and D-excess as a proxy in Shiyang inland river basin in China. Glob. Planet. Chang. 2016, 146, 140–151. [Google Scholar]
  21. Kong, Y.L.; Pang, Z.H.; Froehlich, K. Quantifying recycled moisture fraction in precipitation of an arid region using deuterium excess. Tellus B Chem. Phys. Meteorol. 2013, 65, 19251. [Google Scholar] [CrossRef]
  22. Wang, S.J.; Zhang, M.J.; Che, Y.J.; Chen, F.L.; Qiang, F. Contribution of recycled moisture to precipitation in oases of arid central Asia: A stable isotope approach. Water Resour. Res. 2016, 52, 3246–3257. [Google Scholar] [CrossRef] [Green Version]
  23. Gao, J.; Masson-Delmotte, V.; Yao, T.D.; Tian, L.D.; Risi, C.; Hoffmann, G. Precipitation Water Stable Isotopes in the South Tibetan Plateau: Observations and Modeling. J. Clim. 2011, 24, 3161–3178. [Google Scholar] [CrossRef] [Green Version]
  24. Deng, H.J.; Chen, Y.N.; Wang, H.J.; Zhang, S.H. Climate change with elevation and its potential impact on water resources in the Tianshan Mountains, Central Asia. Glob. Planet. Chang. 2015, 135, 28–37. [Google Scholar] [CrossRef]
  25. Yao, T.C.; Zhang, X.P.; Guan, H.D.; Zhou, H.; Hua, M.Q.; Wang, X.J. Climatic and environmental controls on stable isotopes in atmospheric water vapor near the surface observed in Changsha, China. Atmos. Environ. 2018, 189, 252–263. [Google Scholar] [CrossRef] [Green Version]
  26. Sugimoto, A.; Numaguti, A.; Tsujimura, M.; Fujita, K.; Nakawo, M. Water vapor transport to the Tibetan Plateau revealed with stable isotopes of precipitation: A new hypothesis for unusual isotope signals. In Proceedings of the AGU Fall Meeting Abstracts, San Francisco, CA, USA, 8–12 December 2003. [Google Scholar]
  27. Sun, Z.G.; Zhu, G.F.; Zhang, Z.X.; Xu, Y.X.; Yong, L.L.; Wan, Q.Z.; Ma, H.Y.; Sang, L.Y.; Liu, Y.W. Identifying surface water evaporation loss of inland river basin based on evaporation enrichment model. Hydrol. Process. 2021, 35, e14093. [Google Scholar] [CrossRef]
  28. Brubaker, K.L.; Entekhabi, D.; Eagleson, P.S. Estimation of Continental Precipitation Recycling. J. Clim. 1993, 6, 1077–1089. [Google Scholar] [CrossRef] [Green Version]
  29. Stechmann, S.N.; Hottovy, S. A spatiotemporal stochastic model for tropical precipitation and water vapor dynamics. J. Atmos. Sci. 2015, 72, 4721–4738. [Google Scholar]
  30. Friedman, I. Compilation of stable isotope fractionation factors of geochemical interest. In Data of Geochemistry; United States Government Printing Office: Washington, DC, USA, 1977; Volume 440kk, pp. KK1–KK2. [Google Scholar]
  31. Criss, R.E. Principles of Stable Isotope Distribution; Oxford University Press: Oxford, MS, USA, 1999. [Google Scholar]
  32. Hu, W.F.; Yao, J.Q.; He, Q.; Yang, Q. Spatial and Temporal Variability of Water Vapor Content during 1961-2011 in Tianshan Mountains, China. J. Mt. Sci. 2015, 12, 571–581. [Google Scholar] [CrossRef]
  33. Flanagan, L.B.; Comstock, J.P.; Ehleringer, J.R. Comparison of Modeled and Observed Environmental Influences on the Stable Oxygen and Hydrogen Isotope Composition of Leaf Water inPhaseolus vulgaris. Plant Physiol. 1991, 96, 588–596. [Google Scholar] [CrossRef] [PubMed] [Green Version]
  34. Ali, M.A.; Islam, M.M.; Islam, M.N.; Almazroui, M. Investigations of MODIS AOD and cloud properties with CERES sensor based net cloud radiative effect and a NOAA HYSPLIT Model over Bangladesh for the period 2001–2016. Atmos. Res. 2019, 215, 268–283. [Google Scholar] [CrossRef]
  35. Bagheri, R.; Bagheri, F.; Karami, G.H.; Jafari, H. Chemo-isotopes (18O & 2H) signatures and HYSPLIT model application: Clues to the atmospheric moisture and air mass origins. Atmos. Environ. 2019, 215, 116892. [Google Scholar]
  36. Connan, O.; Smith, K.; Organo, C.; Solier, L.; Maro, D.; Hebert, D. Comparison of rimpuff, hysplit, adms atmospheric dispersion model outputs, using emergency response procedures, with 85kr measurements made in the vicinity of nuclear reprocessing plant. J. Environ. Radioact. 2013, 124, 266–277. [Google Scholar] [CrossRef]
  37. Michelsen, N.; Reshid, M.; Siebert, C.; Schulz, S.; Knöller, K.; Weise, S.M.; Rausch, R.; Al-Saud, M.; Schüth, C. Isotopic and chemical composition of precipitation in Riyadh, Saudi Arabia. Chem. Geol. 2015, 413, 51–62. [Google Scholar] [CrossRef]
  38. Wu, H.; Li, X.Y.; Jiang, Z.; Chen, H.; Zhang, C.; Xiao, X. Contrasting water use pattern of introduced and native plants in an alpine desert ecosystem, Northeast Qinghai–Tibet Plateau, China. Sci. Total Environ. 2016, 542, 182–191. [Google Scholar] [CrossRef] [PubMed]
  39. Liu, W.R.; Peng, X.H.; Sheng, Y.X.; Chen, Y.M. Determination of Hydrogen and Oxygen Isotopes in Liquid Water by Laser Isotope Analyzer and Spectral Pollution Correction. J. Ecol. 2013, 32, 1181–1186. [Google Scholar]
  40. Meng, X.J.; Wen, X.F.; Zhang, X.Y.; Han, J.Y.; Sun, X.M.; Li, X.B. The effect of organic matter on the determination of δ18O and δD in plant leaf and stem water by infrared spectroscopy. Chin. J. Eco-Agric. 2012, 20, 1359–1365. [Google Scholar] [CrossRef]
  41. Van der Ent, R.J.; Savenije, H.H.G.; Schaefli, B.; Steele-Dunne, S.C. Origin and fate of atmospheric moisture over continents. Water Resour. Res. 2010, 46, 1–12. [Google Scholar] [CrossRef] [Green Version]
  42. Su, T.; Lu, Z.Y.; Zhou, J.; Hou, W.; Tu, G. Spatial distribution and seasonal variation characteristics of global atmospheric moisture recycling. Acta Physica Sinica Chin. Ed. 2014, 63, 099201-972. [Google Scholar]
  43. Yamanaka, T.; Shimizu, R. Spatial distribution of deuterium in atmospheric water vapor: Diagnosing sources and the mixing of atmospheric moisture. Geochim. Cosmochim. Acta 2007, 71, 3162–3169. [Google Scholar] [CrossRef] [Green Version]
  44. Aizen, V.B. Climatic and atmospheric circulation pattern variability from ice-core isotope/geochemistry records. Ann. Glaciol. 2006, 43, 49–60. [Google Scholar] [CrossRef] [Green Version]
  45. Tian, L.D.; Yao, T.D. High-resolution climatic and environmental records from the Tibetan Plateau ice cores. Chin. Sci. Bull. 2016, 61, 926–937. [Google Scholar] [CrossRef]
  46. Conroy, J.L.; Noone, D.; Cobb, K.M.; Moerman, J.W.; Konecky, B.L. Paired stable isotopologues in precipitation and vapor: A case study of the amount effect within western tropical Pacific storms. J. Geophys. Res. Atmos. 2016, 121, 3290–3303. [Google Scholar] [CrossRef] [Green Version]
Figure 1. The distribution of all sampling sites. A: Xiyingwugou (Foothill), B: Huajian (Arbor belt), C: Ningchan (Shrub belt), D: Lenglongling (River source).
Sustainability 13 12943 g001
Figure 2. The relationship between δ2H and δ18O in different water bodies in the Xiying River. Basin.
Sustainability 13 12943 g002
Figure 3. Movement path and cluster of the Xiying River basin sampling station (A, B, C, D from April 2016 to October 2018).
Sustainability 13 12943 g003
Figure 4. Schematic diagram of recycled water vapor contribution rates for each season.
Sustainability 13 12943 g004
Table 1. Basic information for each sampling site.
Sampling SiteAbbreviationLon
(°E)
Lat
(°N)
Alt
(m)
Number and Species of Sample
PrecipitationSurfaceSoilPlantVegetation Species
XiyingwugouA102.1837.892097473013024Forests
(Populus L.)
HuajianB102.0137.832323472414026Shrubs (Caragana sinica Rehder)
NingchanC101.8937.72721561610020Forests (Picea asperata Mast.)
LenglonglingD101.8637.56364795128020——
Table 2. The data needed to calculate the recycled water vapor contribution rate and the calculation results.
SeasonSitee(hPa) T(K) h (%) δ18OP
(‰)
δ18OPv
‰)
δ18OEv
(‰)
δ18OEv
(‰)
δ18OAdv
(‰)
δ2Hp
(‰)
δ2Hpv
(‰)
δ2HTr
(‰)
δ2HEv
(‰)
δ2HAdv
(‰)
fTr
(%)
fEv
(%)
fAdv
(%)
SpringA17.47288.5241.1−7.58−17.79−6.63————−49−139.66−58.1——————————
B15.94287.1138.7−5.00−15.3314.64−28.49−17.79−34.91−127.37−18.39−133.36−139.669.86.783.5
C12.3283.1751.1−6.92−17.63−2.39−33.17−18.11−46.12−143.78−45.25−147.18−152.758.15.286.7
D8.194277.2660.3−9.59−20.88——−34.59−22.21−57.2−163.25——−155.43−186.81 9.990.1
SummerA20.48291.0369.66−4.449−14.43−4.735————−23.87−111.4−63.29——————————
B20.4529162.23−4.53−14.51−1.123−30.01−14.45−23.21−110.8−50.42−158.5−111.43.963.8192.23
C16.87287.9870.64−6.225−16.48−4.014−35.87−16.48−35.64−127−40.24−166.2−128.42.161.3696.48
D11.33281.9578.42−9.109−19.932.6452−24.3−20.79−52.19−151.5−12.14−72.34−166.64.867.9987.15
AutumnA16.52287.6665.77−4.232−14.51−4.869————−27.57−119.3−63.2——————————
B15.99287.1560.85−4.34−14.67−0.359−30.32−14.85−28.79−121.2−47.12−148.2−122.31.670.3897.95
C12.10282.9371.88−6.049−16.77−4.035−33.18−17.66−41.31−139.3−40.24−122.6−148.58.171.4690.37
D8.816278.376.29−8.976−20.16——−28.25−20.31−56.62−161.1——−80.9−172.4——6.4593.55
— It cannot be calculated because the data are missing.
Publisher’s Note: MDPI stays neutral with regard to jurisdictional claims in published maps and institutional affiliations.

