Article

A Field Study on Thermal Comfort in Multi-Storey Residential Buildings in the Karst Area of Guilin

1
Guangxi Key Laboratory of New Energy and Building Energy Saving, College of Civil Engineering and Architecture, Guilin University of Technology, Guilin 541004, China
2
State Key Laboratory of Subtropical Building Science, South China University of Technology, Guangzhou 510640, China
3
The Design School, Herberger Institute for Design and the Arts, Arizona State University, Tempe, AZ 85281, USA
*
Author to whom correspondence should be addressed.
Sustainability 2021, 13(22), 12764; https://doi.org/10.3390/su132212764
Submission received: 30 August 2021 / Revised: 4 November 2021 / Accepted: 8 November 2021 / Published: 18 November 2021

Abstract

:
It is important to consider reducing energy use while improving occupants’ indoor thermal comfort. The actual thermal comfort needs and demands should be considered to determine the indoor thermal environment design. In previous studies, research has not been carried out on thermal comfort in karst areas. Thus, a long-term field investigation was carried out on multi-storey residential buildings in the karst area of Guilin city centre during summer (from August 2019 to September 2019) and winter (from December 2019 to January 2020). In this study, the indoor thermal environments of three categories of dwellings were analysed. A total of 77 residential buildings with 144 households were randomly selected, and 223 occupants from 18 to 80 years old participated. A total of 414 effective questionnaires were collected from the subjects. The results show that there was an obvious conflict between the predicted mean vote (PMV) and the thermal sensation vote (TSV). The neutrality temperatures calculated by the regression method were 24.2 °C in summer and 16.2 °C in winter. The thermal comfort range was observed at operative temperatures of 20.9–27.5 °C in summer and 12.2–20.1 °C in winter. The desired thermal sensation for people in the Guilin karst area was not always reflected in the thermal neutrality range. A preference for warmness was identified in the survey.

1. Introduction

Thermal comfort research has been a hot topic in recent years [1]. It is important to consider reducing energy use while improving occupants’ indoor thermal comfort. Due to economic growth, there has been a continued and growing demand for the improvement of indoor thermal environments and, consequently, the growth of energy demand for both heating and cooling [2]. In residential buildings, varieties of thermal sensation and comfort requirements significantly impact energy consumption [3]. There would be a potential waste of energy to maintain the indoor thermal comfort thresholds using the thermal comfort standards directly [4] because of the different thermal comfort characteristics in different outdoor climates and areas [5]. The indoor thermal environment should be carefully analysed and controlled with consideration for the actual thermal comfort threshold needs and requirements.
Thermal comfort standardisation and modelling have been widely used. The predicted mean vote (PMV) model is now most commonly used to predict and evaluate environmental thermal comfort [6]. The international standards of ISO 7730:2005 [7], ASHRAE 55:2017 [8], and EN16798:2019 [9] adopted the PMV model to evaluate indoor thermal environments. The physiological and physical parameters, including air temperature (Ta), mean radiant temperature (Tr), air velocity (va), relative humidity (HR), activity level (met), and clothing insulation (clo), were regarded as the main influential variables for thermal comfort in the PMV model. In this model, the neutral temperature is defined as the optimum condition where habitants do not want a warmer or colder environment.
However, many previous studies have found discrepancies between the PMV and the actual thermal sensation vote (TSV). Habitants have a wider acceptable temperature range in naturally ventilated buildings than that in air-conditioned buildings because of the dynamic response of thermal sensations to the outdoor microclimate [10,11]. There is a potential interaction between microclimates and human habitual adaptive behaviour, which adjusts to a comfortable indoor environment according to the occupants’ thermal expectations [12]. The physical, physiological, and psychological parameters, as well as thermal preference, should be considered in the reaction description of the human body to the variable indoor thermal environment [13]. The authors of plenty of field studies have claimed that occupants’ thermal comfort changes with block type, the indoor environment, and living habits [14,15,16,17,18,19]. Many studies have also found that differences exist in occupants’ thermal sensations in different areas and local microclimates [20,21,22,23]. Although previous field studies have been conducted on diverse building types in various locations and climates, each study has had unique sample characteristics.
Guilin (109°36′50″–111°29′30″ E, 24°15′23″–26°23′30″ N) is located on areas of alluvial plains between the limestone towers in western China. The tower-shaped karsts of Guilin are the most beautiful landforms in China and the world [24]. Along both sides of the Lijiang River in the city centre of Guilin, many limestone towers of its well-known fenglin karst are lined up in an orderly formation and covered with verdant bush. In the city centre of Guilin, the residential buildings are mainly multi-storey houses that are no taller than seven storeys due to a height restriction policy of the Guilin government. Therefore, a unique architectural microclimate environment that potentially influences the occupants’ thermal sensations was formed amongst the residential buildings, fenglin karst, plains, and rivers. However, most field studies performed on residential thermal comfort in China have focused on the developed plain cities in southern and central China and there has been no research done on thermal comfort in the karst areas. There are no generally recommended acceptable comfort range and specific thermal comfort prediction models for the existing residential buildings in undeveloped areas in western China, particularly in Guilin City.
In this study, we researched the possible correlations between the occupants’ thermal sensations to on-site environmental monitoring and in situ measurements of multi-storey residential buildings under natural ventilation in the Guilin karst area in order to analyse the effect of the fenglin karst and river factors on the thermal comfort results and to develop a rigorous database for designing an optimal indoor thermal environment.

2. Field Study Situation and Method

2.1. Climate

Our study took place in the Guilin karst area. Guilin is located in a hot summer and cold winter climate (HSCW) zone in China. The Guilin area is characterised by a subtropical monsoon climate, which is dominated by the East Asian monsoon and characterised by two distinct seasons of a cold and rainy winter and a hot and rainy summer. The annual mean air temperature of Guilin City is 18.9 °C. The hottest months are July and August, with an average outdoor temperature of 28.2 °C, while the coldest month is January, the mean temperature of which was 8.1 °C from 1951 to 2020. The average annual rainy days and the average annual rainfall are 172.5 days and 1886 mm, respectively. The rainy season lasts from April to August and accounts for 77.4% of the total rainfall. The maximum mean monthly outdoor relative humidity is 81% in June, while the minimum relative humidity is 66% in December. Figure 1 shows the meteorological data of a typical year in Guilin City.

2.2. Location and Description of the Buildings Surveyed

To investigate neutral thermal comfort level and thermal preference, this study employed a questionnaire survey, in situ measurements, and environmental monitoring of 77 residential buildings in 20 residential sub-districts in Guilin city centre. In this study, the 20 residential sub-districts were divided into 3 categories: 4 residential sub-districts near fenglin karst (NF), 8 residential sub-districts near river (NR), and 8 residential sub-districts neither near fenglin karst nor near river (NN). The dwellings investigated in the 3 categories of residential sub-districts were abbreviated to dwelling NF, dwelling NR, and dwelling NN, respectively. Among the buildings surveyed in the study, brick-concrete structure and frame structure accounted for 42.5% and 55.5%, respectively. Only 3.9% of buildings used external wall insulation; however, buildings with sun-shading accounted for about 76.9%.
The surveys were conducted over 61 days during summer (from 1 August 2019 to 30 September 2019) and 42 days during winter (from 20 December 2019 to 31 January 2020). In total, 144 households and their dwellings were surveyed, 96 during summer (22 for NF, 35 for NR, and 39 for NN) and 48 during winter (12 for NF, 17 for NR, and 19 for NN). Indoor thermal environmental parameters were monitored concurrently when the questionnaire surveys were carried out with occupants sampled. One or two occupants in a dwelling were chosen. In summer, 145 occupants from 20 to 80 years of age participated in the study, 62.8% female and 37.2% male. The distribution of the participants in summer was as follows: 38 occupants from the dwelling NF (near fenglin karst), 45 occupants from the dwelling NR (near river), and 62 occupants from the dwelling NN (neither near fenglin karst nor near river). In winter, 78 occupants from 18 to 80 years of age participated in the study, 61.5% female and 38.5% male. The distribution of the participants in winter was as follows: 20 occupants from the dwelling NF, 25 occupants from the dwelling NR, and 33 occupants from the dwelling NN. Table 1 shows the characteristics of the participants in our study. The clothing insulation was calculated based on the standard ASHRAE 55 and individual survey.
The thermal environment for the main space for daily life (bedroom and living room) of each household was chosen as the research environment for both indoor physical parameters and questionnaire. The environment measurement and questionnaire survey were in the natural ventilation state. The air conditioning or heating equipment was not turned on.

2.3. Environmental Parameters Measurements

In the field study, the outdoor environmental conditions, including the outdoor air temperature (ta) and relative humidity (RH), were monitored with a thermometer of a HOBO MX2300 series data logger (resolution 0.04 °C, RH 0.05%) to investigate the neutral thermal comfort for the climate of Guilin. The indoor environmental conditions were recorded using a thermometer of an AZ8829S data logger (resolution 0.1°C, RH 0.1%) and a hot-wire anemometer of ST733. The globe temperature (tg) was recorded with a 150 mm diameter globe thermometer (resolution 0.1 °C). Table 2 shows the variables monitored and information about the devices used, based on the conditions of instruments for measuring physical quantities in the standard of ISO 7726:1998 [25].
The assessment and analysis processes of the indoor thermal environment were according to the standards of ASHRAE 55 and GB 50785-2012 [26]. Data were measured at one central point if the indoor area was less than 16 m2. If the indoor area was between 16 m2 and 30 m2, data were measured at the two dividing points that divided the diagonal line of the space into three equal parts. Data were measured at three points when the indoor area was more than 30 m2. All instruments were checked, as required, before testing. They were placed far away from heat sources. The height of 1.1 m above the floor was selected at each point [27], and the measurement intervals were 1 min.

2.4. Thermal Comfort Surveys

The horizontal and longitudinal surveys were conducted simultaneously in the dwellings NF, NR, and NN. The participants were asked to complete the longitudinal questionnaire at least twice. The interval between two questionnaires should be more than 20 min. Participants were asked to sit indoors for at least 15 min before the survey and then completed questionnaires. A total of 242 effective responses were collected over the summer survey period, 64 responses in the dwelling NF, 78 responses in the dwelling NR, and 100 responses in the dwelling NN, while a total of 172 effective responses were collected over the winter survey period, 40 responses in the dwelling NF, 59 responses in the dwelling NR, and 73 responses in the dwelling NN.
The content of the questionnaire was explained by the surveyor face-to-face. If the participant (such as the elderly) was unable to write, the survey was conducted through an interview. The questionnaire included:
(1)
Basic information of buildings and participants, e.g., surroundings environment, carpet area, insulation strategies, sun-shading, gender, age, clothing, height and weight, time living in Guilin, annual family income;
(2)
Thermal subjective sensation vote: questionnaire options with 2 to 7 scales are listed in Table 3.
This study respects the fundamental principles established in the Declaration of Helsinki and was approved by the ethics committee of the Guilin University of Technology.

3. Results and Discussion

3.1. Thermal Environmental Conditions

Table 4 shows the average, minimum, and maximum values and their standard deviation of the indoor and outdoor variables recorded during the field study. As shown in Table 4, the indoor air temperature (ta,in) varied between 26.5 °C and 33.3 °C with the mean value of 30.0 ± 1.7 °C during the summer survey and between 10.4 °C and 22.8 °C with the mean value of 16.1 ± 2.6 °C during the winter. The average indoor relative humidity (RHin) was about 46.0% and 63.6% during summer and winter, respectively. The maximum outdoor air temperature (ta,out) was 33.3 ± 1.9 °C during summer, while it was about 20.8 ± 3.1 °C during the cold period.
The variations of the indoor thermal environment in the dwellings NF, NR, and NN are shown in Figure 2. In summer, regarding the ta,in and the globe temperature (tg), similar values were monitored in the dwellings NF, NR, and NN, although the ta,in fluctuation was larger in the dwelling NN. The average RHin in the dwelling NF was the lowest at about 30.5%, which was approximately 20% lower than that in the dwellings NR and NN. In winter, the average ta,in and the average tg in the dwelling NF were the lowest, and those in the dwelling NR were the highest. No significant diversity was observed in the average RHin in the spaces. The most unstable indoor thermal environment occurred in the dwelling NN.

3.2. Thermal Comfort Survey Response

3.2.1. Distribution of Thermal Sensation Votes (TSV)

In the surveys, the thermal sensation votes (TSV) were applied to respond and evaluate how comfortable the subjects found the temperature in their home according to the widely used ASHRAE thermal comfort scale (as shown in Table 3).
The distribution of TSV is shown in Figure 3. The majority of the participants reported a hot thermal sensation accounting for 43.7% in summer, and a neutral thermal sensation accounting for 49.1% in winter during the interviews. It is generally the case that people voting within the central three categories of thermal sensation (−1, 0, and +1) are considered comfortable [28]. In the survey, more than 81% of the votes in winter were within the comfort range of TSV (−1, 0, and +1), while only 53% of the votes of comfort were in summer.

3.2.2. Predicted Mean Votes (PMV) and TSV

The mathematical equations for PMV were determined by the principle of human body heating balance [6,7] (Equations (1) and (2)). We computed the PMV value with the code edited by the statistical programming language VB and validated it by the known input-outputs. For the dwellings in the Guilin karst area, the average TSV and PMV values were 1.42 and 1.60, respectively, in summer and −0.50 and −0.31, respectively, in winter, as shown in Figure 4.
PMV = [ 0.303 e 0.036 M + 0.028 ] L
where L is the body thermal load (W/m2).
L = ( M W ) 3.05 × [ 5.733 0.007 ( M W ) P a ] 0.42 ( M W 58.15 ) 0.0173 M ( 5.87 P a ) 0.0014 ( 34 t a ) 3.96 × 10 8 f cl [ ( t cl + 273 ) 4 ( t mrt + 273 ) 4 ] f cl h c ( t cl t a )
where M is the metabolic rate (W/m2); W is useful work (W/m2); Pa is partial pressure of water vapour (mmHg); ta is air temperature (°C); fcl is dressing area coefficient determined by the clothing thermal resistance Icl (fcl = 1 + 0.3Icl); tcl is surface temperature of clothing (°C); tmrt is mean radiant temperature (°C); and hc is convective heat transfer coefficient (W/m2 °C).
The violin plots in Figure 5 show the probability density of the data for both PMV and TSV for the range of possible values on the vote scale (from −3 to +3) in the dwellings NF, NR, and NN. In summer, percentages of the TSV in the interval [−1, +1] in the dwellings NF, NR, and NN were 35%, 35%, and 29%, respectively. In winter, their percentages were 87%, 90%, and 74%, respectively. The classical PMV model under-predicted the true comfort of participants due to the significant differences between TSV and PMV. Additionally, the TSV showed a much narrower range.

3.3. Comfort and Preferred Temperature

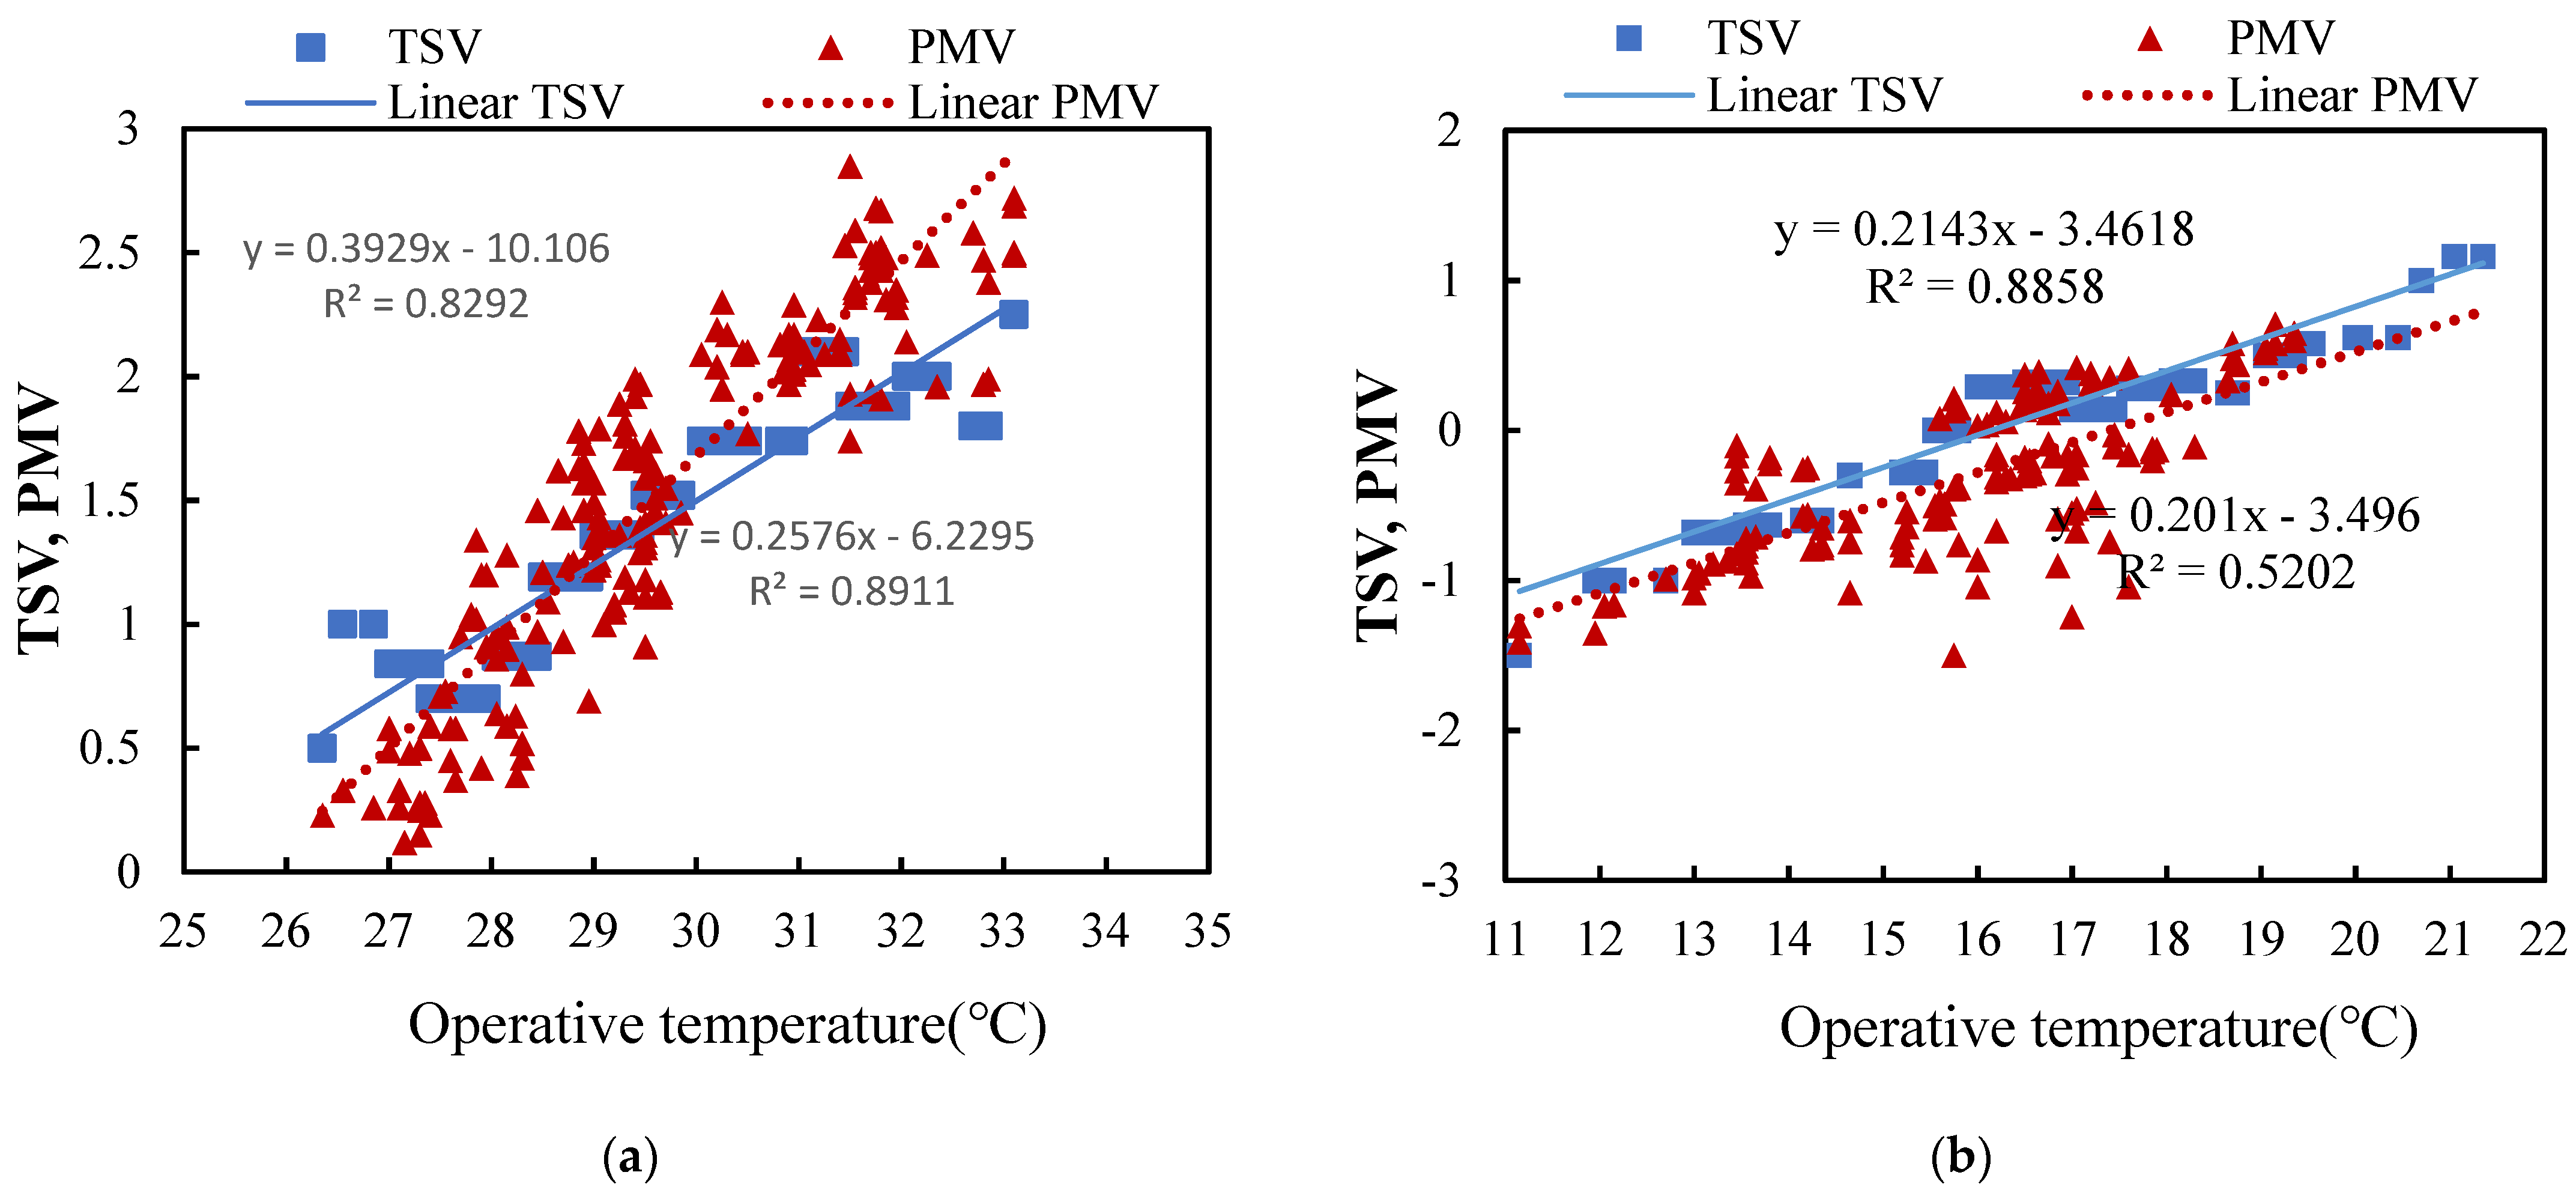
3.3.1. Regression Method and Comparison between TSV and PMV

As is confirmed by references [29,30], the mean radiant temperature (tmrt) and the air temperature (ta) influence the uncertainty in thermal comfort evaluation. It was non-uniform that the radiant temperature distributed on the globe thermometers [31]. In order to reduce the uncertainty, the operative temperature (top), which is a synthetic temperature comprehensively being considered as the effects of ta and tmrt on the thermal perception of the human body, was recommended for use [29]. The top is calculated as in Equation (3) [32]:
top = A × ta + (1 − A) × tmrt
where top is operative temperature (°C); ta is air temperature (°C); tmrt is mean radiant temperature (°C); and A is the average weight factor of the ta and tmrt.
Under the natural convection condition, the tmrt was calculated as in Equation (4) [33]:
t mrt = [ ( t g + 273 ) 4 + 0.4 × 10 8 | t g t a | 1 4 × ( t g t a ) ] 1 4 273
where tmrt is mean radiant temperature (°C); tg is globe temperature (°C); and ta is air temperature (°C).
To compare the TSV and the PMV, the whole range of top was used to analyse the variation of the data. A scatter diagram of top and TSV and PMV for dwellings surveyed in the Guilin karst area was planned and equations of linear regression were established, as shown in Figure 6. The intervals of 1 °C were defined for the top.
In summer, the linear regression equation for the mean TSV was TSV = 0.2576top − 6.2295 (R2 = 0.8911) and for the PMV was PMV = 0.3929top − 10.106 (R2 = 0.8292), as shown in Figure 6a. Additionally, as top increased at the interval of top < 28.7 °C, the difference between PMV and TSV decreased gradually. While top increased at the interval of top > 28.7 °C, the difference between PMV and TSV increased. In winter, the linear regression equations were TSV = 0.2143top − 3.4618 (R2 = 0.8858) and PMV = 0.201top − 3.496 (R2 = 0.5202) for the TSV and PMV, respectively, as shown in Figure 6b. The two regression lines of TSV and PMV were almost parallel.
To further investigate the effect of the fenglin karst and river factors on the results, the data were analysed independently for TSV and PMV in the dwellings NF, NR, and NN, respectively, as shown in Figure 7. In summer, six regression lines were found to intersect at around the point value of top = 29 °C. At the interval of top < 29 °C, the three regression lines of TSV in dwellings NF, NR, and NN were higher than the PMV, while at the interval of top > 29 °C, the TSV was overestimated in the PMV values. In winter, the TSV always was underestimated in the PMV values. Similarly, Yang [34] found that the PMV for the elderly was lower than the TSV in winter and was higher than the TSV in summer under a naturally ventilated condition. Alike results were also confirmed in surveys for naturally ventilated residential and office buildings by Dhaka [35].
The regression and Griffiths’ methods are the two main methods to identify thermal comfort temperature. In this study, occupants’ acceptance of the indoor thermal environment and their neutral estimates were calculated by the linear regression method, as shown in Figure 6 and Figure 7. All the regression equations passed the goodness of fit (R2 > 0.5). When the regression equation equals zero, the calculated temperature can be considered as the neutral temperature (tn) of participants. Their accepted temperature (tac) range of 80% is −0.85 < TSV < +0.85 [36].
Table 5 shows the actual and predicted tn and tac in the dwellings NF, NR, and NN during summer and winter. The actual tn was lower than the predicted tn in the dwellings NF, NR, and NN, respectively. Yao [37] and Yu [38] proposed similar results in different buildings and different climates by their previous research. In summer, there was no significant difference of the tn between the dwellings NF, NR, and NN. In winter, the tn in the dwelling NF was the lowest in all of the dwellings. The range of actual tac (80%) calculated by the regression method in summer and winter was from 20.9 to 27.5 °C and from 12.2 to 20.1 °C, respectively, as shown in Table 5.

3.3.2. Preferred Temperature

The occupants’ preferred temperature (tp) was explored to be compared with their actual tn. For the purpose, the “probit” analysis was conducted for the thermal preferred votes (TPV) and their corresponding top. Probit regression analysis was first presented by Webb [39]. It is generally applied to illustrate the probability of an objective for data with binary response variables. Based on the investigation, the overall TPV were divided into two parts as preferences for cooler (assigned “−1”) and preferences for warmer (assigned “+1”) surroundings. The result of cumulation of TPV was set as “1” according to the Probit analysis. The tp was identified as the intersection point of the curve with “cooler” preference and the curve with “warmer” preference [40], as shown in Figure 8.
The tp in summer and winter were 25.8 °C and 18.6 °C, respectively. The result displayed an obvious difference between the tp and the actual tn. In accordance with the analysis, tp was around 1.6 °C higher than the actual tn in summer and 2.4 °C in winter. The analysis result clarified that occupants have a tendency towards warmer indoor environments for their tp in Guilin.

3.3.3. Thermal Comfort Characteristics Comparison with Previous Studies

Table 6 summarises the discrepancy of tn, tac (80%), and TSV equations in the previous field studies [4,41,42,43,44,45,46,47,48,49] which were conducted in naturally ventilated buildings of various climates and locations in China. As the results of comparison among the SC/C (severe cold/cold), HSCW (hot summer and cold winter), and HSWW (hot summer and warm winter) zones, occupants’ tn and the maximum of tac generally increased when the outdoor atmosphere became warmer. In the HSCW zone, both tn and tac were higher in other cities than those in the Guilin karst area in summer due to the potential impact of the fenglin karst and the unique microclimate of the surroundings in Guilin. The results also presented that the occupants’ tac ranges of indoor thermal environment under natural convection in a HSCW climate zone were different. Hence, the design tac range of different locations in the HSCW zone should be varied, which was in contradiction with the Chinese standard [26].

3.4. Clothing Insulation

The clothing has the insulating property which is a key factor for adjusting the heat loss and thermal comfort of human body. In this investigation, clothing insulation (clo) data were collected through questionnaires and estimated in the light of the standard ASHRAE 55.
The raw data in the scatter diagram was used to illustrate the relationship between the clo and indoor top, as well as their linear regression results, as shown in Figure 9. In summer, most of the clo levels were concentrated in the range between 0.3 and 0.51 with the mean value of clo around 0.45. In winter, most of the clo levels were from 0.83 to 1.31 with the mean value of 1.03. The clo level decreases in both summer and winter as the top increases.

4. Conclusions

This paper analyses the data of a thermal comfort field study conducted in three types of naturally ventilated dwellings NF, NR, and NN in the Guilin karst area, China, during summer (61 days) and winter (42 days). The results are derived from environmental measurements, indoor and outdoor, taken in 144 dwellings and thermal comfort questionnaires collected for 414 responses of 223 participants, which could be extrapolated to karst areas in the hot summer and cold winter zone of China. The main conclusions are as follows:
  • In summer, an indoor thermal environment in dwelling NF was on average 1 °C cooler compared with that in dwelling NR and 0.5 °C cooler than that in dwelling NN. In winter, average indoor temperature in dwelling NR was 2.7 °C warmer than that in dwelling NF and 1 °C warmer than that in dwelling NN. During both summer and winter, the fluctuations of indoor temperature and relative humidity in dwelling NN were the largest;
  • According to the TSVs, most occupants at about 81% were comfortable in winter, however, only 53% of the votes were comfortable in summer. The average TSV and PMV values were 1.42 and 1.60, respectively, in summer and −0.50 and −0.31, respectively, in winter. The actual thermal comfort of occupants could not be precisely predicted by the classical PMV model, in most cases, as shown by the significant differences between TSV and PMV;
  • Although the most desired sensation was “neutral”, the desired temperature was not always the thermal neutral temperature for occupants. As seen in the results of this study on thermal comfort, a negative relationship between thermal sensation votes and thermal preference votes suggested that occupants preferred warmness in the Guilin karst area of the HSCW zone during both summer and winter;
  • The range of actual accepted temperature (80%) in summer and in winter was 20.9–27.5 °C and 12.2–20.1 °C, respectively. The actual thermal Tn of 24.2 °C and 16.2 °C in summer and in winter, respectively, was lower than the predicted thermal Tn of 25.7 °C and 17.4 °C in summer and in winter, respectively.

Author Contributions

Conceptualization, X.G. and Q.M.; methodology, X.G. and Q.M.; software, Y.Y.; formal analysis, X.G.; investigation, X.G.; resources, Q.M.; data curation, X.G. and Y.Y.; writing—original draft preparation, X.G.; writing—review and editing, X.G.; supervision, Q.M. All authors have read and agreed to the published version of the manuscript.

Funding

This research was funded by the Natural Science Foundation of Guangxi Province, China (Grant No. 2020GXNSFBA297102); the project of the Foundation of State Key Laboratory of Subtropical Building Science, South China University of Technology (Grant No. 2021ZB05).

Institutional Review Board Statement

Not applicable.

Informed Consent Statement

Informed consent was obtained from all participation in the study.

Data Availability Statement

Not applicable.

Acknowledgments

The authors thank the subjects who volunteered for this survey. The authors thank J.C., L.H., C.C. and Z.W. for survey support.

Conflicts of Interest

The authors declare no conflict of interest.

References

  1. Culic, A.; Nizetic, S.; Solic, P.; Perkovic, T.; Congradac, V. Smart monitoring technologies for personal thermal comfort: A review. J. Clean. Prod. 2021, 312, 127685. [Google Scholar] [CrossRef]
  2. Tsinghua University Building Energy Research Centre (TUBERC). 2020 Annual Report on China Building Efficiency; Architecture and Building Press: Beijing, China, 2020. (In Chinese) [Google Scholar]
  3. Kwong, Q.J.; Adam, N.M.; Sahari, B.B. Thermal comfort assessment and potential for energy efficiency enhancement in modern tropical buildings: A review. Energy Build. 2014, 68, 547–557. [Google Scholar] [CrossRef]
  4. Liu, H.; Wu, Y.; Li, B.; Cheng, Y.; Yao, R. Seasonal variation of thermal sensations in residential buildings in the Hot Summer and Cold Winter zone of China. Energy Build. 2017, 140, 9–18. [Google Scholar] [CrossRef]
  5. Ozel, M. Effect of indoor design temperature on the heating and cooling transmission loads. J. Build. Eng. 2016, 7, 46–52. [Google Scholar] [CrossRef]
  6. Fanger, P.O. Thermal Comfort: Analysis and Applications in Environmental Engineering; Danish Technical Press: Copenhagen, Denmark, 1970. [Google Scholar]
  7. ISO. ISO 7730: Ergonomics of the Thermal Environment—Analytical Determination and Interpretation of Thermal Comfort Using Calculation of the PMV and PPD Indices and Local Thermal Comfort Criteria; International Standards Organization: Geneva, Switzerland, 2005. [Google Scholar]
  8. ASHRAE Standards Committee. ANSI/ASHRAE55-2017, Thermal Environmental Conditions for Human Occupancy; American Society of Heating, Refrigerating and Air Conditioning Engineers, Inc.: Atlanta, GA, USA, 2017. [Google Scholar]
  9. EN 16798-1:2019, Energy Performance of Buildings. Ventilation for Buildings. Indoor Environmental Input Parameters for Design and Assessment of Energy Performance of Buildings Addressing Indoor Air Quality, Thermal Environment, Lighting and Acoustics. 2019. Available online: https://shop.bsigroup.com/products/energy-performance-of-buildings-ventilation-for-buildings-indoor-environmental-input-parameters-for-design-and-assessment-of-energy-performance-of-buildings-addressing-indoor-air-quality-thermal-environment-lighting-and-acoustics-module (accessed on 8 November 2021).
  10. Rupp, R.F.; Vásquez, N.G.; Lamberts, R. A review of human thermal comfort in the built environment. Energy Build. 2015, 105, 178–205. [Google Scholar] [CrossRef]
  11. Yao, R.; Liu, J.; Li, B. Occupants’ adaptive responses and perception of thermal environment in naturally conditioned university classrooms. Appl. Energy 2010, 87, 1015–1022. [Google Scholar] [CrossRef]
  12. Dear, R.D.; Brager, G.S. The adaptive model of thermal comfort and energy conservation in the built environment. Int. J. Biometeorol. 2001, 45, 100–108. [Google Scholar] [CrossRef] [Green Version]
  13. Nicol, F.; Humphreys, M. Derivation of the adaptive equations for thermal comfort in free-running buildings in European standard EN15251. Build. Environ. 2010, 45, 11–17. [Google Scholar] [CrossRef]
  14. Carlucci, S.; Bai, L.; Dear, R.D.; Yang, L. Review of Adaptive Thermal Comfort Models in Built Environmental Regulatory Documents. Build. Environ. 2018, 137, 73–89. [Google Scholar] [CrossRef] [Green Version]
  15. Dear, R.D.; Xiong, J.; Kim, J.; Cao, B. A review of adaptive thermal comfort research since 1998. Energy Build. 2020, 214, 1–10. [Google Scholar] [CrossRef]
  16. Karyono, K.; Abdullah, B.M.; Cotgrave, A.J.; Bras, A. The adaptive thermal comfort review from the 1920s, the present, and the future. Dev. Built Environ. 2020, 4, 100032. [Google Scholar] [CrossRef]
  17. Xiong, Y.; Liu, J.; Kim, J. Understanding differences in thermal comfort between urban and rural residents in hot summer and cold winter climate. Build. Environ. 2019, 165, 106393. [Google Scholar] [CrossRef]
  18. Cao, B.; Zhu, Y.; Ouyang, Q.; Zhou, X.; Huang, L. Field study of human thermal comfort and thermal adaptability during the summer and winter in Beijing. Energy Build. 2011, 43, 1051–1056. [Google Scholar] [CrossRef]
  19. Wu, Z.; Li, N.; Wargocki, P.; Peng, J.; Li, J.; Cui, H. Adaptive thermal comfort in naturally ventilated dormitory buildings in Changsha, China. Energy Build. 2019, 186, 56–70. [Google Scholar] [CrossRef]
  20. Manu, S.; Shukla, Y.; Rawal, R.; Thomas, E.L.; Dear, R.D. Field studies of thermal comfort across multiple climate zones for the subcontinent: India Model for Adaptive Comfort (IMAC). Build. Environ. 2016, 98, 55–70. [Google Scholar] [CrossRef] [Green Version]
  21. Rupp, R.F.; Kim, J.; Ghisi, E.; Dear, R.D. Thermal sensitivity of occupants in different building typologies: The Griffiths Constant is a Variable. Energy Build. 2019, 200, 11–20. [Google Scholar] [CrossRef]
  22. Maykot, J.K.; Rupp, R.F.; Ghisi, E. A field study about gender and thermal comfort temperatures in office buildings. Energy Build. 2018, 178, 254–264. [Google Scholar] [CrossRef]
  23. Wang, Z.; Dear, R.D.; Luo, M.; Lin, B.; He, Y.; Ghahramani, A.; Zhu, Y. Individual difference in thermal comfort: A literature review. Build. Environ. 2018, 138, 181–193. [Google Scholar] [CrossRef]
  24. Williams, P. Geomorphic inheritance and the development of tower karst. Earth Surf. Process. Landf. 1987, 12, 453–465. [Google Scholar] [CrossRef]
  25. ISO. ISO 7726-1998, Ergonomics of the Thermal Environment—Instruments for Measuring Physical Quantities; International Standards Organization: Geneva, Switzerland, 1998. [Google Scholar]
  26. Ministry of Housing and Urban-Rural Development of the People’s Republic of China. GB/T 50785-2012, Evaluation Standard for Indoor Thermal Environment in Civil Buildings; Ministry of Housing and Urban-Rural Development of the People’s Republic of China: Beijing, China, 2012. (In Chinese) [Google Scholar]
  27. Ministry of Housing and Urban-Rural Development of the People’s Republic of China. JGJ/T 347-2014, Standard of Test Methods for Thermal Environment of Building; Ministry of Housing and Urban-Rural Development of the People’s Republic of China: Beijing, China, 2014. (In Chinese) [Google Scholar]
  28. Brager, G.S.; Dear, R.D. Thermal adaption in the built environment: A literature review. Energy Build. 1998, 27, 83–96. [Google Scholar] [CrossRef] [Green Version]
  29. Broday, E.E.; Ruivo, C.R.; da Silva, M.G. The use of Monte Carlo method to assess the uncertainty of thermal comfort indices PMV and PPD: Benefits of using a measuring set with an operative temperature probe. J. Build. Eng. 2021, 35, 101961. [Google Scholar] [CrossRef]
  30. Ekici, C. Measurement uncertainty budget of the PMV thermal comfort equation. Int. J. Thermophys. 2016, 37, 48. [Google Scholar] [CrossRef]
  31. Xing, D.; Li, N. Three-dimensional heat transfer of globe thermometers in indoor environments controlled by radiant systems. Build. Environ. 2021, 15, 107505. [Google Scholar] [CrossRef]
  32. Peng, T.; Zhang, Y.; Jiang, X.; Yang, Y.; Fang, Z.; Zheng, Z. Investigation of pregnant women thermal comfort in the waiting area of the hospital in South China, Guangzhou. J. Build. Eng. 2021, 44, 103254. [Google Scholar] [CrossRef]
  33. Ficco, G.; Palella, B.I.; Riccio, G. On the measurement of the mean radiant temperature by means of globes: An experimental investigation under black enclosure conditions. Build. Environ. 2021, 193, 107655. [Google Scholar] [CrossRef]
  34. Yang, J.; Nam, I.; Sohn, J.R. The influence of seasonal characteristics in elderly thermal comfort in Korea. Energy Build. 2016, 128, 583–591. [Google Scholar] [CrossRef]
  35. Dhaka, S.; Mathur, J.; Brager, G.S.; Honnekeri, A. Assessment of thermal environmental conditions and quantification of thermal adaptation in naturally ventilated buildings in composite climate of India. Build. Environ. 2015, 86, 17–28. [Google Scholar] [CrossRef] [Green Version]
  36. Jiao, Y.; Yu, H.; Yu, Y.; Wang, Z.; Wei, Q. Adaptive thermal comfort models for homes for older people in Shanghai, China. Energy Build. 2020, 215, 109918. [Google Scholar] [CrossRef]
  37. Yao, R.; Li, B.; Liu, J. A theoretical adaptive model of thermal comfort-adaptive predicted mean vote (aPMV). Build. Environ. 2009, 44, 2089–2096. [Google Scholar] [CrossRef]
  38. Jiao, Y.; Yu, H.; Wang, T.; An, Y.; Yu, Y. Thermal comfort and adaptation of the elderly in free-running environments in Shanghai, China. Build. Environ. 2017, 118, 259–272. [Google Scholar] [CrossRef]
  39. Webb, C. An analysis of some observations of thermal comfort in an equatorial climate. Br. J. Ind. Med. 1959, 16, 297–310. [Google Scholar] [CrossRef] [Green Version]
  40. Chen, X.; Gao, L.; Xue, P.; Du, J.; Liu, J. Investigation of outdoor thermal sensation and comfort evaluation methods in severe cold area. Sci. Total. Environ. 2020, 749, 141520. [Google Scholar] [CrossRef]
  41. Shao, T.; Jin, H. A field investigation on the winter thermal comfort of residents in rural houses at different latitudes of northeast severe cold regions, China. J. Build. Eng. 2020, 32, 101476. [Google Scholar] [CrossRef]
  42. Zhu, P.; Guo, F.; Zhu, T.; Liu, S. Field investigation of indoor thermal environment and thermal adaption of Dalian residences in winter. Appl. Mech. Mater. 2013, 361–363, 458–463. [Google Scholar] [CrossRef]
  43. Xu, C.; Li, S.; Zhang, X.; Shao, S. Thermal comfort and thermal adaptive behaviours in traditional dwellings: A case study in Nanjing, China. Build. Environ. 2018, 142, 153–170. [Google Scholar] [CrossRef]
  44. Yan, H.; Mao, Y.; Yang, L. Thermal adaptive models in the residential buildings in different climate zones of Eastern China. Energy Build. 2017, 141, 28–38. [Google Scholar] [CrossRef]
  45. Li, B.; Yu, W.; Liu, M.; Li, N. Climatic strategies of indoor thermal environment for residential buildings in Yangtze River Region, China. Indoor Built Environ. 2011, 20, 101–111. [Google Scholar] [CrossRef]
  46. Wu, Z.; Li, N.; Wargocki, P.; Peng, J.; Li, J.; Cui, H. Field study on thermal comfort and energy saving potential in 11 split air-conditioned office buildings in Changsha, China. Energy 2019, 182, 471–482. [Google Scholar] [CrossRef]
  47. Zhang, Y.; Chen, H.; Wang, J.; Meng, Q. Thermal comfort of people in the hot and humid area of China-impacts of season, climate, and thermal history. Indoor Air 2016, 26, 820–830. [Google Scholar] [CrossRef]
  48. Lu, S.; Pang, B.; Qi, Y.; Fang, K. Field study of thermal comfort in non-air-conditioned buildings in a tropical island climate. Appl. Ergon. 2018, 66, 89–97. [Google Scholar] [CrossRef] [PubMed]
  49. Hwang, R.L.; Chen, C.P. Field study on behaviors and adaptation of elderly people and their thermal comfort requirements in residential environments. Indoor Air 2010, 20, 235–245. [Google Scholar] [CrossRef] [PubMed]
Figure 1. The meteorological data of typical year in Guilin City.
Sustainability 13 12764 g001
Figure 2. Variations of indoor thermal environment in the dwellings NF, NR, and NN. (a) Summer; (b) Winter.
Sustainability 13 12764 g002
Figure 3. The percentage of occupants’ thermal sensation votes in Guilin karst area.
Sustainability 13 12764 g003
Figure 4. Thermal sensation votes (TSV) and predicted mean votes (PMV) in summer and winter.
Sustainability 13 12764 g004
Figure 5. Density plots for TSV and PMV of the dwellings NF, NR, and NN. (a) Summer; (b) Winter.
Sustainability 13 12764 g005
Figure 6. Relationship between participants’ TSV/PMV and operative temperature in the survey dwellings in Guilin karst area. (a) Summer; (b) Winter.
Sustainability 13 12764 g006
Figure 7. Relationship between participants’ TSV/PMV and operative temperature in the dwellings NF, NR, and NN spaces. (a) Summer; (b) Winter.
Sustainability 13 12764 g007
Figure 8. Preferred temperature for the dwellings. (a) Summer; (b) Winter.
Sustainability 13 12764 g008
Figure 9. Relationship between clothing insulation and Top. (a) Summer; (b) Winter.
Sustainability 13 12764 g009
Table 1. The characteristics of the participants in our study.
SeasonParameterMaximumMinimumMeanStandard Deviation
SummerAge (years)Male692043.8716.68
Female802048.1018.77
Height (m)Male1.81.51.679.75
Female1.781.451.596.63
Weight (kg)Male804863.5011.27
Female754054.478.20
Clothing insulation (clo)Male0.790.210.430.10
Female0.820.100.460.16
Time living in Guilin (years)Male65331.9119.41
Female80336.2821.61
WinterAge (years)Male721848.5015.22
Female802045.4816.55
Height (m)Male1.821.561.706.70
Female1.701.501.595.08
Weight (kg)Male498062.977.90
Female824254.137.79
Clothing insulation (clo)Male1.680.581.030.27
Female1.680.581.050.24
Time living in Guilin (years)Male72443.619.93
Female80337.5120.19
Table 2. Monitoring instruments used in the survey.
Measurement InstrumentParameterMeasuring RangeAccuracyResolutionSampling Interval
HOBO MX2300Outdoor temperature−40 to +70 °C±0.2 °C0.04 °C1 min.
Outdoor RH0 to 100%±2.5%0.05%1 min.
AZ8829SIndoor temperature−40 to +85 °C±0.6 °C0.1 °C1 min.
Indoor RH0 to 100%±3%0.1%1 min.
SENTRY ST733Air velocity0 to 40 m/s±0.03 m/s0.01 m/s1 min.
JTSOFT-Meter JTR04Globe temperature−20 to 125 °C±0.5 °C0.1 °C1 min.
Table 3. Survey questionnaire options.
Thermal SensationPreferenceAcceptability
Cold (−3)Warmer (+1)Acceptable (+1)
Cool (−2)No change (0)Unacceptable (−1)
Slightly cool (−1)Cooler (−1)
Neutral (0)
Slightly warm (+1)
Warm (+2)
Hot (+3)
Table 4. Thermal physical variables during the field study.
SeasonStatistical Informationta,in (°C)RHin (%)ta,in (m/s)tg (°C)top (°C)ta,out (°C)RHout (°C)
SummerMaximum33.374.30.5833.133.133.388.8
Minimum26.523.50.0025.626.425.432.0
Mean30.046.00.0229.529.729.362.0
S.D.1.715.30.091.61.61.912.8
WinterMaximum22.876.50.1621.221.420.894.3
Minimum10.448.60.0011.511.25.640.8
Mean16.163.60.0016.516.410.272.9
S.D.2.67.80.032.22.33.113.0
Note: ta,in—Indoor air temperature, RHin—Indoor relative humidity, va,in—Indoor air speed, tg—Globe temperature, top—Operative temperature, ta,out—Outdoor air temperature, RHout—Outdoor relative humidity, S.D.—Standard deviation.
Table 5. Neutral temperatures calculated by the regression method.
SeasonParameterTSVPMV
TotalNFNRNNTotalNFNRNN
Summertn 1 (°C)24.223.724.425.125.726.126.225.8
tac 2 (°C)20.9–27.520.2–27.121.3–27.522.4–27.923.6–27.924.3–27.824.2–28.223.6–28.0
Wintertn (°C)16.215.017.316.217.417.317.817.7
tac (°C)12.2–20.112.6–17.414.0–20.613.2–19.213.2–21.613.7–20.913.3–22.212.2–23.3
1 tn—Neutral temperature.2 tac—Accepted temperature (80%).
Table 6. Thermal comfort characteristics in different locations.
AuthorLocationZoneSeasontn (°C)tac (°C)TSV Equations
Shao et al. [41]HarbinSC/C 1Winter16.814.6–19.1TSV = 0.2203top − 3.7013, R2 = 0.9568
ChangchunSC/CWinter16.414.4–18.6TSV = 0.2467top − 4.0579, R2 = 0.9625
ShenyangSC/CWinter16.013.9–18.2TSV = 0.2322top − 3.715, R2 = 0.9438
Zhu et al. [42]DalianSC/CWinter20.417.4–24.2TSV = 0.451top − 9.217, R2 = 0.946
This studyGuilinHSCW 2Summer24.220.9–27.5TSV = 0.2576top − 6.2295, R2 = 0.8911
Winter16.212.2–20.1TSV = 0.2143top − 3.4618, R2 = 0.8858
Liu et al. [4]Chongqing,
etc.
HSCWSummer24.3/TSV = 0.155top − 3.76, R2 = 0.93
Winter21.0TSV = 0.066top − 1.39, R2 = 0.93
Xu et al. [43]NanjingHSCWSummer28.022.0–30.1TSV = 0.2347top − 6.5646, R2 = 0.19323
Winter15.810.6–28.5TSV = 0.0949top − 1.5039, R2 = 0.1284
Yan et al. [44]Shanghai,
etc.
HSCWSummer27.6/TSV = 0.3552top − 9.8026, R2 = 0.96
Winter18.2TSV = 0.1477top − 2.6905, R2 = 0.86
Li et al. [45]Wuhan,
etc.
HSCWSummer27.616.3–28.1TSV = 0.3485top − 9.6190, R2 = 0.8309
Winter17.5TSV = 0.2235top − 3.9113, R2 = 0.6290
Wu et al. [46]ChangshaHSCWSummer26.7≤29.4TSV = 0.18top − 4.86, R2 = 0.74
Zhang et al. [47]GuangzhouHSWW 3Summer27.124.5–29.0/
Lu et al. [48]HainanHSWWSummer26.123.1–29.1TSV = 0.2855top − 7.4513, R2 = 0.9683
Hwang et al. [49]TaiwanHSWWSummer25.223.2–27.1TSV = 0.39top − 9.84, R2 = 0.91
1 SC/C—Severe cold zone/Cold zone. 2 HSCW—Hot summer and cold winter zone. 3 HSWW—Hot summer and warm winter zone.
Publisher’s Note: MDPI stays neutral with regard to jurisdictional claims in published maps and institutional affiliations.

