Article

Barriers and Facilitators for the Romanian Older Adults in Enjoying Physical Activity Health-Related Benefits

1
Sports and Motor Performance Department, National University of Physical Education and Sports in Bucharest, 060057 Bucharest, Romania
2
Faculty of Physical Education and Sports, “A.I. Cuza” University of Iaşi, 700554 Iași, Romania
3
Laboratory of the Metabolic Adaptations to Exercise in Physiological and Pathological Conditions (AME2P), Clermont Auvergne University, 63171 Clermont-Ferrand, France
4
Department of Teaching Staff Training, Faculty of Physical Education and Sports, National University of Physical Education and Sports in Bucharest, 060057 Bucharest, Romania
5
Department of Psychology, Faculty of Psychology and Education Sciences, University of Bucharest, 050663 Bucharest, Romania
6
Department of Doctoral Studies, National University of Physical Education and Sports in Bucharest, 060057 Bucharest, Romania
*
Author to whom correspondence should be addressed.
Sustainability 2021, 13(22), 12511; https://doi.org/10.3390/su132212511
Submission received: 14 October 2021 / Revised: 4 November 2021 / Accepted: 9 November 2021 / Published: 12 November 2021
(This article belongs to the Collection Physical Activity and Sustainable Health)

Abstract

:
Older adults are considered a vulnerable category within the population, which is exposed to an accelerated risk of functional degeneration. The purpose of this study was to explore different facilitating factors and possible existing barriers to being physically active in older age in urban areas of Romania. A cross-sectional survey was conducted among 172 participants who were asked to assess their health, on a scale from 1 to 3, and to fill out two questionnaires: 1. Physical Activity Scale for the Elderly; 2. Depression, Anxiety, and Stress Scale. Participants were also asked to specify to what extent they performed different leisure activities during the last week. SPSS was used for data analysis. The chi-squared test, t-test, ANOVA, and MANOVA emphasised the differences between participants, at p < 0.05. Regarding health condition, 27.3% of participants responded that their health was good, 53.5%—satisfactory, and 19.2%—not so good. The results showed significant differences between older adults participating in Elderly Clubs and non-participants, only in terms of PASE leisure. There were significant multivariate effects of the variables Gender and Stable life partner regarding PASE leisure. Weak negative correlations were identified between leisure physical activities and emotional state. Among the proposed leisure activities, watching TV and listening to music represented the most frequent preferences of the participants. The older adults participating in this study preferred to become involved with different physical activities, in conjunction with their habits, health, age, sex, stable life partner, and Elderly Club participation.

1. Introduction

Older adults are considered a vulnerable category of the population, who are exposed to an accelerated risk of functional degeneration and health deterioration. The World Health Organization (2011) points out that the number of people in this age group (65+ years old) is increasing and estimates that by 2050, they will represent 16% of the global population, these individuals being at higher risk of non-communicable diseases [1]. Global AgeWatch Index emphasises a 96-country ranking, which is based on the number of people aged 60+ [2]. Thus, Switzerland ranks first, and Romania 45th, almost in the middle of this ranking. According to this statistical report, the global population over the age of 60 will reach 21.5% worldwide by 2050. In 2016, according to the National Institute of Statistics [3], there were more than 3.4 million older people (60+ years) in Romania. The European Union assumed an increase in their number to more than 5.8 million by 2050, based on Eurostat projections [4]. Unfortunately, this trend is not accompanied by an important improvement in the life expectancy of Romanian older adults, as international migration and birth rate affected the young population [5], an important economic pillar for pensions. In many countries, the retirement of the baby boomers [6,7] raises major financial concerns related to pensions, healthcare, and life insurances. According to Eurostat, in 2018, the expenditure for social protection benefits addressing Romanian older adults was EUR 14,771.34 million [8], whereas pensions represented 8% of GDP [9]. In 2020, the National Institute of Statistics mentioned an amount of RON 1500 (EUR 300) per month for the medium pension [10]. The reports of the European Commission show that the duration of pension granting in Romania is around 16.5 years, being necessary to always correlate the amount with the sustainability, when assessing the costs. However, the rate of spending on public pension systems is expected to remain stable in the coming years at the national level [11]. Unless the economic level will enhance considerably, the living standard of the elderly population remains precarious, accentuating the vulnerability resulting from financial insecurity [12], access to health care providers [13], decline of health status (e.g., motor limitations, mental health, chronic diseases), and social interactions [14], ageism [15], abuse and maltreatment [16], etc.
In order to face these challenges, older people should embrace the process of active ageing. Active ageing emerges from the continued participation of individuals aged over 55 in activities corresponding to four main fields: employment; social participation; independent, healthy, and secure living (including physical activity in this field); capacity and enabling environment [17]. Among these topics, physical activity plays a crucial role as a facilitator for a healthy lifestyle. According to the Active Ageing Index Report, Romania is placed among the Member States of the European Union that have the lowest scores recorded in the four fields considered, whereas the Nordic countries are at the top of the ranking, along with the United Kingdom [18].
Despite the health-related benefits of exercise, older adults neglect to participate in physical activities. Statistics show that approximately 45% of people aged 65 or above do not include exercise in their lifestyle behaviour [19], physical inactivity being a major concern of the public healthcare representatives worldwide [20,21]. According to Baert et al. (2011) and Bauman et al. (2012), there are different intrapersonal, interpersonal, community, and policy-based barriers that prevent older adults from participating in physical activities [22,23].
Evidence has shown that older adults avoid participating in sports activities due to fear of losing balance and falling, muscle weakness, poor coordination, low exercise capacity, and lack of a suitable activity [24,25]. Their level of physical fitness and the appropriateness of the physical activity programs act as barriers to being physically active. Coping with these reluctances may help older adults benefit from the positive effects of physical activity, such as: improved cardiovascular system, metabolic regulation, strengthened muscles and thus lower risk of falls, maintaining muscle flexibility, and fighting cognitive dysfunction [26,27,28,29,30]. Furthermore, older adults’ involvement in leisure exercises is associated with good mental health [31] and improved physical fitness. It has been demonstrated that the individuals engaged in leisure activities register a lower risk of dementia [32] and improve their health [33]. Regarding emotions, studies have shown that older adults are more likely to suffer from depression, an important factor affecting their health condition [34,35]. Depression is considered to induce increased psychological distress for this population [36]. Moreover, the overlap between depression and anxiety as a double jeopardy that affects older adults’ quality of life should be taken into account [37,38]. Older adults tend to minimise anxiety symptoms and explain them through their physical weaknesses [39], avoiding physical activities due to this negative condition. Additionally, they are prone to anxiety due to low self-confidence and reduced motor ability, as well as lack of social life, financial resources, and the possibility of being independent, along with various chronic conditions [40]. Aspects such as self-perception, self-efficacy, access, and availability will influence older adults’ motivation to be physically active [41].
Since 2000, Romanian institutions have been interested in attracting older adults to leisure activities in an organised framework, in day-care centres such as Elderly Clubs. These centres are operational within the social assistance and protection directorates, offering various activities, similar to those performed in such centres abroad (cultural, educational and physical activities, occupational therapy, volunteering, socialising, games, outdoor activities, etc.). Elderly Clubs promote social interaction between beneficiaries, which is particularly important because community support plays a facilitator role in engaging older adults in leisure activities [42].
The development of a social network reduces loneliness, depression, isolation [43], fact that provides older adults with a good health condition [44]. Regarding the psychological wellbeing of older adults generated by their intimate relationships, cohabitation and marriage were proved to bring similar positive effects [45]. The role of a stable life partner is reflected in the powerful emotional support exchanged between the two older adults, even if caring out for one partner’s health condition requires help from outside the couple [46]. The partner responsive support acts as an important determinant for the personal wellbeing, facilitating the older adult both the alleviation of stressing situations and the enjoyment of positive life experiences [47]. Moreover, self-reported poor health condition was demonstrated in single older adults, physically inactive and with lower income [48].
In this context, the main purpose of this study was to explore different facilitating factors and possible existing barriers to being physically active in older age, in urban areas of Romania.
We hypothesised that significant differences would be found between the Romanian older adults participating in Elderly Clubs and the non-participants, in terms of socio-demographic characteristics, perceived health, physical activity, and emotional states. Furthermore, we were interested in finding out if any relationships among these outcomes could be identified, as relevant cues for older adults’ lifestyle.

2. Materials and Methods
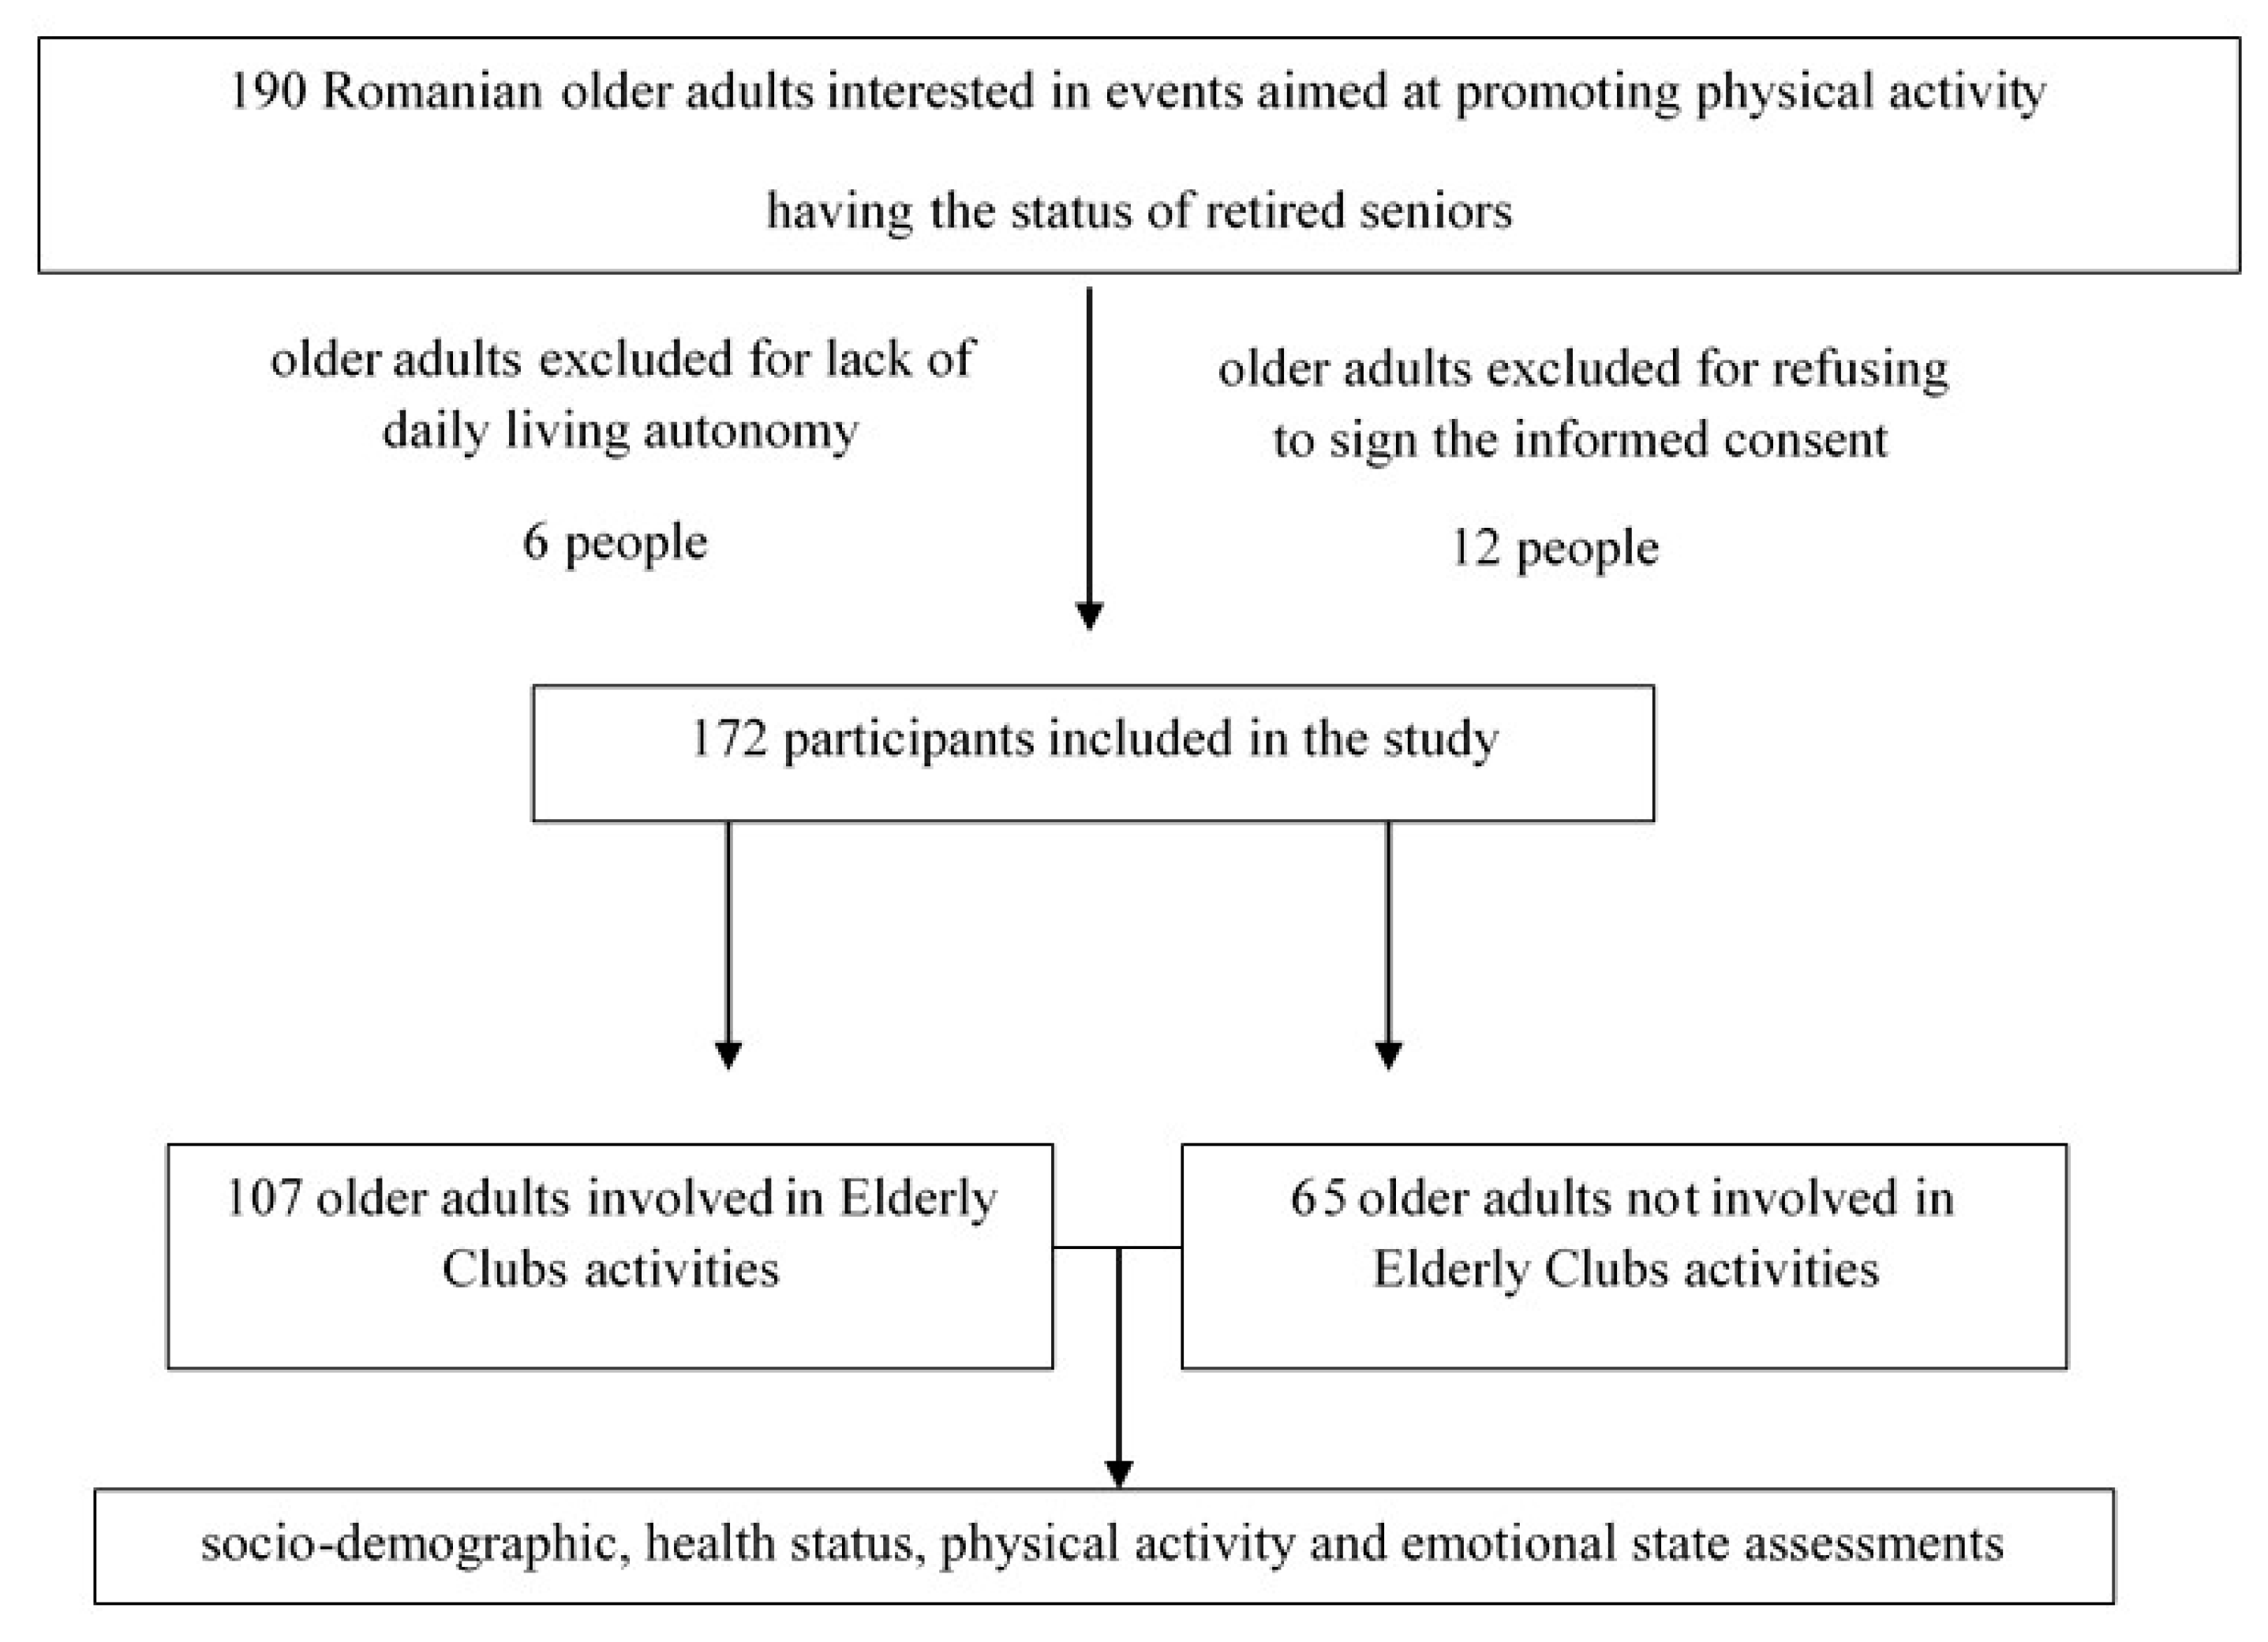
2.1. Participants

The research included 190 Romanian older adults from urban areas who were asked to participate in a study on the level of involvement of older people in physical activities. The participants were recruited during different sport promotion events organised by the research team.
The inclusion criteria were: voluntary adherence to this research, the status of retired professionals, functional autonomy, and capacity to understand the items meaning based on the explanations given by the researchers. No cognitive assessments were previewed for this research. Among the participants, 110 older adults participated in the programmes of Elderly Clubs in Bucharest (PEC—Participants in Elderly Clubs), and 80 were non-participants in such activities (NPEC—Non-Participants in Elderly Clubs).
At the time of implementing this study, the Elderly Clubs in Bucharest offered beneficiaries a wide range of cultural and social activities, but also physical activity programmes, including dance, gymnastics, physical therapy, walks, and other outdoor activities, depending on the weather conditions. Older adults had the opportunity to choose in which of them to participate, being permanently advised by physicians and PA specialists to attend at least two of the proposed physical activities during one week.
Adults who refused to sign the informed consent (12 individuals) and functionally dependent people due to health problems (6 individuals) were not included in this research. Thus, the assessment tools were applied to a group of 107 PEC and a group of 65 NPEC, all independent in their daily living activities (Figure 1).
The collection of data was anonymous and the regulations in force about the confidentiality and publication were implemented. The investigation complied with the Declaration of Helsinki concerning research on human subjects. The Local Ethics Committee (938/8 April 2019) approved the research protocol. The participants voluntarily enrolled in this study, being previously informed about their right to refuse to participate free of consequences, and of their right to withdraw from the research for whatever reason. They signed an informed consent, and the data were anonymised and amalgamated before statistics analysis.

2.2. Procedure

This cross-sectional survey was conducted as part of a broader research on the lifestyle of Romanian older adults, including investigations on their socio-demographic characteristics, health condition, eating habits, emotional states, and quality of life, along with physical activity which represents a key component. The research was carried out in urban areas, between March and December 2019.
For reaching the aim of this study, several directions of investigation were established: the challenge of becoming involved with PA, as lifestyle behaviour; the challenge of engaging in PA despite different socio-demographic characteristics; the challenge of participating in PA in accordance with the self-reported health condition; the challenge of fighting negative emotional states throughout PA participation.
Socio-demographic data such as age, sex, marital status, and stable life partner, level of education and level of monthly income were taken into account. Regarding participants’ relationship status, only the data related to a stable life partner were taken into consideration, referring to this aspect as both cohabitation and marriage.
Participants were then asked to self-report their health condition by choosing one of the following ratings: (one) good, (two) satisfactory, (three) not so good. Participants were also questioned about any medication administered for chronic conditions, the physician’s recommendations to make changes in their lifestyle behaviour, and the recommendations followed by them. These items were closed-ended (yes, no), without analysing the administrated medication and the type of chronic disease.
To identify the level of older adults’ involvement in physical activity, two assessment tools were used: one item regarding the respondents’ preferences for spending their spare time and the Physical Activity Scale for the Elderly (PASE) questionnaire. Participants were asked to specify to what extent they included among their activities during the last week, the following ones: meeting friends, neighbours; reading, studying; watching TV, listening to music; going to the theatre, cinema, concerts, or expositions; walks, trips; sports; and hobbies. They had two options for answering each variable: poor/ almost no participation and high participation.
Regarding PASE, different specialists stated that the reliability and validity of this assessment tool applied especially to older people with various musculoskeletal conditions [49,50,51]. PASE [52] includes self-reported items about leisure physical activity, household physical activity and occupational physical activity carried out during the previous week. Thus, the research participants had to fill in ten items grouped as follows: items one–six, leisure physical activity, static or dynamic activity (number of days per week and duration); items seven–nine, household physical activity (yes/no answer); item ten, occupational physical activity (paid or voluntary work). The scoring was calculated according to the PASE Manual. In this study, PASE was applied for the first time to Romanian individuals after being translated from English into Romanian by two sworn translators. Additionally, authors S.T. and C.U. refined the items according to PA-specific terminology in Romanian language. The Romanian version of the questionnaire was reversed translated in English, in order to verify the exact meaning of the items.
To investigate the participants’ emotional states, the 21-item Depression, Anxiety, and Stress Scale (DASS) [53] questionnaire was applied. This is a self-report tool for assessing three emotional states, namely depression, anxiety, and stress. The items consist of 21 statements for which participants chose an answer, thus expressing the extent to which that statement seemed more or less appropriate to them. Answers ranged from zero to three, as follows: zero—the statement never suited them, one—the statement suited them to some extent or from time to time, two—the statement suited them quite a lot or quite often, three—the statement suited them very much or almost all the time. The scoring was carried out according to the DASS Manual.
All questionnaires were filled out directly by pencil on paper, lasting between 40 min and one hour, and aimed at older adults’ lifestyle behaviour during the previous week. All administrated questionnaires were returned. The researchers offered support to the participants when answering, without any intervention on their filling, but providing them additional information when necessary. As the questionnaires were anonymous, with no consequences upon the participants’ lives, the researchers encouraged them to be sincere.

2.3. Statistics

The statistical analysis was performed using the SPSS software v20 (IBM, Armonk, NY, USA). The t-test for independent samples was used to compare PEC and NPEC, the analysed variables having a normal distribution. The normality of data distribution implied the Skewness and Kurtosis coefficients [54]. The absolute Skewness coefficient was below one [55] or the values of symmetry (Skewness) and flatness (Kurtosis) indicators were within the limits considered as normal (they do not exceed the value three for Skewness and the value eight for Kurtosis). The tests were two-sided, with a type one error set at p < 0.05 (sig.). According to Cohen, the effect size is strong when d = 0.8, medium when d = 0.5, and small when d = 0.2 [56]. Spearman’s correlations between paired data were used to analyse the relationship between the health condition items, between DASS and socio-demographic characteristics, DASS and health condition, PASE and health condition, DASS and PASE. Levene’s test allowed verifying whether the groups had equal or different variances. The analysis of variance (ANOVA) was performed to identify the differences between older adults in terms of lifestyles: PASE leisure, PASE household, and PASE total score.
In order to find out whether different variables were associated or independent, the chi-squared test was applied between the socio-demographic characteristics and participation/non-participation in Elderly Clubs. The standard values of −2 and 2 were taken into account [57].
In order to identify whether the age and sex had an impact on their participation in physical activities, Pearson’s correlations were analysed. In order to thoroughly investigate the sex influence on the level of participants’ involvement in physical activities, the group was divided into four subcategories: Men Participating in Elderly Clubs (MPEC), Women Participating in Elderly Clubs (WPEC), Men Not Participating in Elderly Clubs (MNPEC), and Women Not Participating in Elderly Clubs (WNPEC).
In order to identify the extent to which the existence of a stable partner in participants’ lives had an influence on their engagement in physical activity, the group was also divided into four subgroups: Stable Life Partner, with Club Participation; Stable Life Partner Without Club Participation; Without Stable Life Partner, but With Club Participation; Without Stable Life Partner and Without Club Participation. MANOVA was used for multiple comparisons between the subgroups of participants. Given the size of the resulting subgroups, the Gabriel’s post hoc test was used. Additionally, the Games-Howell post hoc test was applied as a nonparametric tool for comparing the created combinations of groups that had unequal variances [57]. The Waller-Duncan k-ratio t-test was also used in order to incorporate data into homogeneous groups [58].
The regression model was used to estimate which of the analysed variables would influence the challenge of being physically active, as a dependent variable. Thus, the backward analysis was applied, including all variables, testing each possible model, and eliminating one by one the irrelevant ones based on significance as a necessary condition to incorporate the variables into the model [59].

3. Results

3.1. Socio-Demographic Analysis

The socio-demographic characteristics are shown in Table 1.
The chi-squared test showed that PEC and NPEC were different depending on sex [χ2 (1) = 6.825, p = 0.009. The indicator of the effect size, the coefficient phi = 0.199 showed that the relationship between the two variables was modest. It was more likely for women to participate in Elderly Clubs. Additionally, the involvement in Elderly Clubs was different depending on Marital status [χ2(4) = 24.854, p = 0.001, indicator of effect size, coefficient phi = 0.380, showing that the relationship between the two variables was moderate. PEC and NPEC differed depending on the stable life partner [χ2(1) = 19,548, p = 0.001, the coefficient phi = 0.337 proving that the relationship between the two variables was moderate. Most of the participants involved in Elderly Clubs did not have a stable life partner. PEC and NPEC were not differing depending on Education [χ2(4) = 2.072, p = 0.558, the coefficient phi = 0.110 highlighting a weak relationship between the two variables. There were no differences between PEC and NPEC depending on personal monthly income [χ2(4) = 8.162, p = 0.086, the coefficient phi = 0.218, showing a modest relationship between the two variables.

3.2. Health Condition Analysis

In terms of health condition, 27.3% of participants responded that their health was good, 53.5%—satisfactory, and 19.2%—not so good. A total of 73.8% of older adults declared that they were receiving treatment for chronic conditions.
Regarding the self-reported health condition for the PEC group members, 32.7% of them stated that their health was good, 51.4% satisfactory, and 15.9% not so good. With reference to the treatment received for chronic conditions, the data showed that 71% were taking long-term medication, whereas 29% gave negative answers. Lifestyle change was recommended by the physician for 43% of the PEC members, and 38.2% of them said they were following this advice.
As for the NPEC group members, 18.5% stated that their health was good, 56.9% satisfactory, and 24.6% not so good. As regards the medication administered for chronic conditions, 78.5% of the NPEC members were receiving treatment, whereas 21.5% gave negative answers. Lifestyle change was recommended by the physician for 53.8% of the NPEC members, and 40% of them admitted they were following this advice.
Spearman’s correlations of the health condition items were then analysed and presented in Table 2.

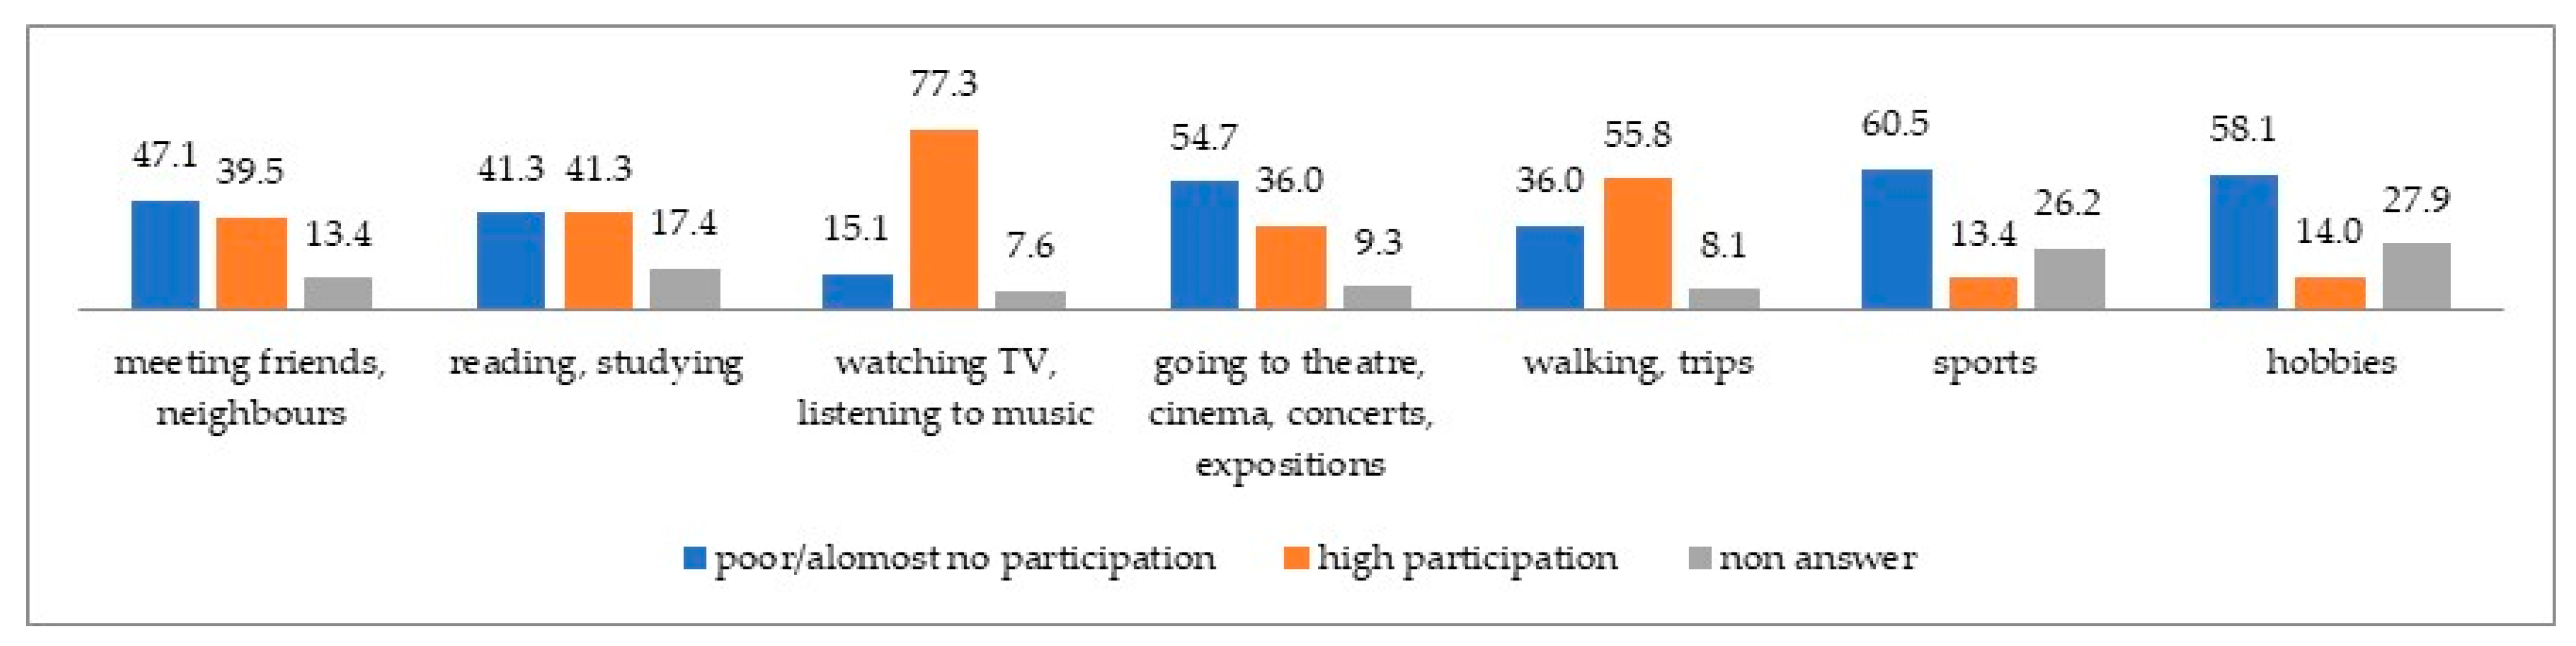
3.3. Leisure Preferences

The participants’ preferences for spending their spare time are presented in Figure 2.
It was shown that there was a positive average correlation between the habit of reading during spare time and the level of education of participants (r = 0.312, p < 0.01), other correlations between socio-demographic indices and leisure being insignificant or small.
Spearman correlations demonstrated that PEC/NPEC correlates poorly with meetings with friends (r = 0.194, p < 0.05), with practicing a sport (r = 0.274, p < 0.01), with hobbies (r = 0.198, p < 0.05). The values of those who participate in the activities of a club are slightly higher than those of respondents who do not participate. PEC/NPEC correlates moderately positively with going to the theatre, exhibitions (r = 0.409, p < 0.01), taking walks, and going on trips (r = 0.325, p < 0.01). The values of those who participate in the activities of a club are higher than those of respondents who do not participate.

3.4. PASE Analysis

The questionnaire items allowed both the analysis of the two main directions of activity (leisure and household) and the calculation of PASE total score. Regarding the occupational area, 100% of the retired older adults participating in this study stated they had not been engaged in paid or volunteer professional activity during the previous week and therefore received no points for item ten. Below, only the analysis of PASE leisure, PASE household, and PASE total score subscales is presented.
The descriptive analysis for the whole group revealed that the mean score for the participation in the PASE leisure was 18.41 ± 21.09; for the PASE household subscale, the mean score was 71.88 ± 40.24, whereas for the PASE total score, a mean of 90.28 ± 50.41 was calculated.
Spearman’s correlations highlighted a weak negative relationship (r = −0.153, p < 0.05) between age and PASE leisure, and no relationship (p > 0.05) between age and PASE household. There were weak negative correlations between the self-reported health condition and PASE leisure (r = −0.191, p < 0.05) as well as between the treatment received for chronic conditions and PASE leisure (r = −0.153, p < 0.05). PASE household and PASE total score did not correlate with the treatment for chronic conditions or with the recommendations received/followed to make lifestyle changes.
As for the differentiation of older adults in the two groups depending on their participation in the activities of Elderly Clubs, the following were observed: regarding the PASE leisure subscale, descriptive statistics showed that the mean score for the PEC group participation was 22 ± 24.05; for the NPEC group, PASE leisure in the previous week recorded a mean score of 12.48 ± 13.15. Regarding the PASE household subscale, the mean score for the PEC group participation was 72.08 ± 41.77. For the NPEC group, PASE household in the previous week recorded a mean score of 71.54 ± 37.91. As for the PASE total score, the statistical analysis indicated a mean score of 94.09 ± 54.80 for the PEC group. For the NPEC group, the mean score was 84.02 ± 41.84. Significant differences between PEC and NPEC were recorded only in terms of PASE leisure (Table 3).
ANOVA for the four subcategories of participants established according to their sex and involvement in the activities of Elderly Clubs revealed the following differences. For the PASE leisure subscale, even if the condition of variance homogeneity was not satisfied, with Levene’s test indicating: F(3.168) = 11.278, p = 0.000l, the ANOVA test was applied and highlighted a significant overall difference [F(3.168) = 4.58, p = 0.004] between the four subcategories of seniors, with an average effect size (η2p = 0.076). The Games-Howell test showed that there were significant differences in PASE leisure for WNPEC compared with MPEC and WPEC. The mean score of PASE leisure for WNPEC (9.86 ± 11.59) was lower than for MPEC (28.20 ± 29.87) and WPEC (19.59 ± 21.10).
For the PASE household subscale, the condition of variance homogeneity was satisfied, Levene’s test indicating: F(3.168) = 1.899, p = 0.132. ANOVA revealed no difference [F(3.168) = 0.385, p = 0.764] between the 4 subcategories of seniors. Gabriel’s test showed that a higher score was achieved by WNPEC (76.03 ± 36.83), and the lowest score by MNPEC (66.61 ± 39.07).
Regarding the PASE total score, the condition of variance homogeneity was not satisfied, Levene’s test indicating: F(3.168) = 4.982, p = 0.002, but it was possible to apply ANOVA, which revealed no difference [F(3.168) = 1.059, p = 0.368], with a small effect size (η2p = 0.019). Gabriel’s test showed that, even if there were no statistically significant differences in the PASE total score between the four subcategories, higher values were achieved by MPEC (103.53 ± 71.36) and WPEC (90.4 ± 46.87), and lower values by MNPEC (81.97 ± 0.73) and WNPEC (85.89 ± 41.59). Additionally, the Games-Howell test was applied for all PASE subscales, and the results are included in Table A1.
The relationships between the presence of a stable life partner, the participation in the activities of Elderly Clubs, and PASE will be further analysed. For the PASE leisure subscale, even if the condition of variance homogeneity was not satisfied, Levene’s test indicating: F(3.168) = 6.926, p = 0.001, ANOVA was applied. It was shown that there was a significant statistical effect of the Stable Club Partner variable (Participation/Non-participation) on PASE leisure, F(3.168) = 4,880, p = 0.003, with a towards-medium effect size (η2p = 0.080). For the PASE household subscale, the condition of variance homogeneity was satisfied, Levene’s test indicating: F(3.168) = 1.983, p = 0.118. However, ANOVA showed that there was no significant effect of the Stable Club Partner variable (Participation/Non-participation) on PASE household, F(3.168) = 2.363, p = 0.073, with a small effect size (η2p = 0.040). Regarding the PASE total score, the condition of variance homogeneity was not satisfied, Levene’s test indicating: F(3.168) = 6.470, p =0.001, but the ANOVA test was applied. It was shown that there was a significant statistical effect of the Stable Club Partner variable (Participation/Non-participation) on the PASE total score, F(3.168) = 3.503, p = 0.017, with a small effect size (η2p = 0.059). The Waller-Duncan test revealed that NPEC having stable partners recorded the highest scores for both PASE leisure (28.68 ± 26.35) and PASE household (83.61 ± 47.82). They also recorded the highest PASE total score (112.29 ± 69.60). MANOVA (Table A2) indicated that there was a significant multivariate effect of the Stable Club Partner variable (Participation/Non-participation) on the three dependent variants (Pillai coefficient F(6.336) = 3.373, p = 0.003, η2p = 0.057).
Regarding the correlations between PASE and the participants’ preferences for leisure, the following were demonstrated: a positive average correlation between PASE leisure and walks and trips (r = 0.419, p < 0.01); a negative average correlation between household PASE and reading (r = −0.300, p < 0.01).

3.5. DASS Analysis

The descriptive statistical analysis of answers to the DASS questionnaire showed that the DASS Depression score recorded a mean of 4.90 ± 2.69. Regarding the DASS Anxiety score, the mean was 4.94 ± 3.33, and for the DASS Stress score, the calculated mean was 6.48 ± 3.29. The DASS total score recorded a mean of 16.32 ± 7.94.
Spearman’s correlations revealed that the DASS Depression score had weak negative correlations with the level of income (r = −0.220, p < 0.01). The DASS Anxiety score had weak negative correlations with the level of education (r = −0.152, p < 0.05) and the level of income (r = −0.224, p < 0.01). The DASS total score had weak negative correlations with the level of education (r = −0.166, p < 0.05) and the level of income (r = −0.182, p < 0.05). No correlations were found between DASS and stable life partner.
The DASS Depression score showed statistically significant weak positive correlations with the self-reported health condition (r = 0.262, p < 01) and medication/treatment for chronic conditions (r = 0.228, p < 01). There was also a weak negative correlation between depression and recommendations followed to make lifestyle changes (r = −0.208, p < 01). The DASS Anxiety score showed significant weak positive correlations with the self-reported health condition (r = 0.277, p < 01) and recommendations received to make lifestyle changes (r = 0.247, p < 01). Anxiety had weak negative correlations with recommendations followed to make lifestyle changes (r = −0.287, p < 01). The DASS total score showed significant weak positive correlations with the self-reported health condition (r = 0.246, p < 01), medication/treatment for chronic conditions (r = 0.167, p < 05), and recommendations received to make lifestyle changes (r = 0.220, p < 01). There was a weak negative correlation between the DASS total score and recommendations followed to make lifestyle changes (r = −0.265, p < 01).
Regarding the leisure preferences of the participants, the DASS anxiety score weakly negatively correlated with walks, trips (r = −0.179, p < 0.05) and with sports (r = −0.187, p < 0.05). Additionally, the DASS stress score weakly negatively correlated with walks, trips (r = −0.158, p < 0.05), and with sports (r = −0.188, p < 0.05). The DASS total score weakly negatively correlated with walks, trips (r = −0.192, p < 0.05), with sports (r = −0.198, p < 0.05), and with older adults’ hobbies (r = −0.211, p < 0.05).
Statistically significant weak negative correlations were identified between leisure physical activities and the level of emotional states, as follows: with depression level (r = −0.176), anxiety level (r = −0.158), and DASS total score (r = −0.179), at p < 0.05. The involvement of older adults in leisure physical activities did not correlate with their levels of stress. Their engagement in household activity indicated weak statistically significant correlations with depression (r = −0.158), stress (r = −0.165), and DASS total score (r = −0.150), at p < 0.05. The relationship between the involvement of participants in this study and their levels of anxiety was not statistically confirmed. The PASE total score showed weak negative correlations with depression (r = −0.199, at p < 0.01), stress (r = −0.185, at p < 0.05), and DASS total score (r = −0.194, at p < 0.05).
In the case of NPEC, weak negative correlations were found between leisure physical activities and stress (r = −0.288), but also between PASE leisure and DASS total score (r = −0.253), at p < 0.05. In the case of PEC, weak negative correlations were found between PASE leisure and depression (r = −0.222), but also between PASE total score and depression (r = −0.241), at p < 0.05.

3.6. Regression Model

Starting from the existing correlations among variables, nine regression models were created, following the R2adjusted value which indicated the model relevance. The normal distribution of the residuals was also confirmed, as another relevant condition for multiple regression analysis. The F coefficients were all significant at p < 0.01, but the greatest value was found for the last model (F = 11.190, p < 0.001) (Table A3).
Thus, the model number nine (R2adjusted = 0.229) was taken into account, including the variables walks, trips, age, and participation or non-participation in Elderly Clubs, as relevant for the PASE leisure-dependent variable. Based on this model, it could be explained that 22.9% come from the PASE leisure variance, with a small global effect. It can be noticed that among variables for this model, the greatest value corresponded to walks and trips (rsp = 0.422 for walks, trips; rsp = −0.216 for age; rsp = −0.184 for Participation or non-participation in Elderly Clubs). The other variables have no effect on PASE leisure.
The corresponding multiple regression equation was as follows:
PASE_leisure = 26.33 − 0.640 × Age + 6.734 × Participation or non-participation in Elderly Clubs + 16.594 × Walks, trips.

4. Discussion

The results obtained showed that the research purpose has been achieved; this survey allowed us to identify the facilitating factors and possible existing barriers to being physically active at an older age in urban areas of Romania. The older adults participating in this study preferred to become involved with different PA, in conjunction with their habits, health, age, sex, social network, stable life partner, and emotional states. In order to avoid the decline of the health condition while ageing, any risk-free physical activity should be considered as “medicine” in late life [60]. Thus, leisure and household activities were underlined in this research as the PA of the participants.
The research hypotheses were validated, emphasising several differences between the Romanian older adults who participated in activities in Elderly Clubs and the non-participants, in terms of perceived health, physical activity, and emotional states. A significant association between Participation/Non-participation in Elderly Clubs and several socio-demographic characteristics were demonstrated, such as: sex, marital status, and stable life partner. There was no association between Participation/Non-participation in Elderly Clubs and the education level or the personal monthly income.
Additionally, certain relationships were revealed between physical activity, perceived health, and emotional states, relevant for the prevention of physical disability and for the management of active ageing.
Among the proposed leisure activities, watching TV and listening to music represented the most frequent preferences of the participants (77.3%) during their spare time. The next leisure that the respondents preferred in a large extent were: walks, trips, reading, studying, meeting friends and neighbours, going to cultural events, hobbies, and sports, in this ranking order. Authors such as Rada (2018) also revealed that the leisure activities of Romanian older adults tend to be sedentary in nature, given that they mainly choose watching TV and, to a small extent, meeting friends or neighbours [21]. Similar results were emphasised in the Spanish older population, characterised by low education level, an unhealthy manner of living, and chronic diseases, who used to watch TV most of the time [61]. One could notice that the older adults’ lifestyle habits could represent a barrier to being physically active. Further research should be conducted to refine the motivational factors involved in embracing an active lifestyle, knowing that the habit of exercising is formed during the first part of ontogenesis and is transferred throughout life. However, older adults who are used to a sedentary lifestyle would need powerful resilience mechanisms to become physically active. Thus, this study opens new horizons for a cluster analysis of the cultural factors and family influences on active ageing within the Romanian population.
The results emphasised the extent to which participants engaged in a physical activity, addressing the challenge of having an active lifestyle and enjoying sustainable health-related benefits. There are studies that have demonstrated the importance of the assessment of older adults’ lifestyle factors that they can manage to a certain extent [62], but in Romania, few approaches were focused on identifying older adults’ active lifestyle. Our study highlighted that the involvement of Romanian older adults in leisure physical activities declines as they grow older. A study on UK population indicated that 62.1% of people aged between 64 and 74 years preferred walks and trips as recreational activity, whereas 37.5% of people aged 75+ became involved with the same physical activity [63]. Thus, age should be considered a barrier to being physically active for Romanian older adults participating in this study.
However, the participation of Romanian older adults in Elderly Clubs was associated with an increased level of engagement in physical activity as leisure, including walks, trips, and sports. Valuable results were found in Vietnam Elderly Clubs, where the efficacy of the proposed programs was demonstrated in terms of beneficiaries’ active lifestyle [64]. Consequently, participating in Elderly Clubs should be considered a facilitating factor for having an active lifestyle when ageing.
Overall, when comparing women to men, the differences were not statistically significant, but a slightly tendency in men to be more likely involved in leisure and physical activities has been noticed compared with women, whereas for the household activities, women recorded higher scores. According to Notthoff, Reisch, and Gerstorf (2017), it is essential to compare the physical activity of men and women in terms of different fields [65]. Their evidence-based research showed the predominance of men in most PA types, whereas women are usually involved in household chores and gardening. Additionally, a study implemented in China, addressing older adults, emphasised that women preferred mostly group exercises, whereas men predominantly participated in individual physical activities or intellectual leisure [66]. However, for the participants in our study, sex was not statistically proved to be a barrier for being physically active.
The chance to socialise and to interact with peers, as a premise for fighting loneliness, was offered to the participants in Elderly Clubs. Loneliness of older adults was shown to have a negative influence on their mental health [67], acting in the long run as a risk factor for life expectancy [68]. In our study, a significant relationship was identified between the existence of a life partner and the level of engagement of Romanian older adults in leisure physical activities. The life partner could be a strong facilitating factor and a psychological support element in the couple, especially since studies have demonstrated that loneliness in older adults is associated with loss of interest in physical activities [69], and the presence of family members with a low level of fragility [70].
In 91.9%, the participants in this study ended their professional careers according to the laws in force, i.e., men at the age of 65 and women at the age of 62, and they had a similar level of education. Most of them were receiving a monthly income between RON 1001 and RON 2000 (EUR 209—418). The challenge to deal with such a low income for their daily living did not influence the participants’ involvement in a physical activity and/or the activities of Elderly Clubs. Nonetheless, the Elderly Clubs represents one of the social programmes addressed to retired individuals, fee-free. Thus, it was not possible to identify if the pension amount represented a barrier to being physically active for the participants in this study.
Regarding the correlation between the socio-demographic indices and emotional states, it has been demonstrated that older adults with a higher monthly income tend to have lower levels of depression and anxiety. Considered as a life-threatening condition, the economic status of an older person is linked to depression symptoms. Another study carried out in Japan demonstrated that the socio-economic constraints during life were directly linked to the decline of the health condition at an older age [71]. Thus, a lower income for older adults would act as a barrier in benefiting from positive emotional states.
Studies showed that self-reported health condition was associated with longevity and the prediction of possible health issues [72]. In our research, the subjective perception of the health condition highlighted the connection between the mental and physical condition, older adults with a better self-reported health condition having the most active lifestyle and the least negative emotional states. This psychological construct of the individual’s self-image is influenced by socio-educational and cultural factors [73]. However, no correlations were found between the perception of the health condition and the investigated level of education in case of our participants. Even so, the self-reported health condition could be seen as a facilitating factor for being physically active, referring to self-confidence.
The subjective perception of the health condition determines older adults to adopt a more or less active lifestyle [74]. The challenge of participating in PA in accordance with the self-reported health condition was emphasised by the older adults involved in Elderly Clubs. The percentage of participants in the activities of Elderly Clubs who self-reported good health was higher than that of non-participants. Additionally, the participants in the activities of Elderly Clubs who did not follow treatments for chronic conditions were fewer than the non-participants in such clubs. Obviously, health condition influenced the participation of the surveyed older adults in physical activity. Physical activity guidelines for older adults include generally valid recommendations on the type, the load, and the frequency of practice [75]. Based on these landmarks, it is necessary for older adults to have their physician’s approval to perform a physical activity so that exercise does not turn into a risk factor for their health. The diagnosis of certain chronic conditions might have influenced the participation of Romanian older adults in various activities, including those performed within the Elderly Clubs. For these persons, the health condition represented a barrier in embracing an active lifestyle. The health condition could be considered both a facilitating factor and a possible barrier for being physically active at older age. Thus, the challenge of managing older adults’ health condition related to PA is still to be addressed in future research papers.
Furthermore, participants in Elderly Clubs who received medical recommendations to make lifestyle changes were less in number than individuals non-participating in such activities. However, less than 40% of the participants in this research admitted that they had not followed the physician’s recommendations to make changes in their lifestyles. A study investigating the relationship between older adults’ daily habits (including physical activity) and sleep quality on a group of 162 participants demonstrated that lifestyle adjustments have contributed to the improvement of the health condition [76]. The importance of physician’s recommendations to make lifestyle changes was also analysed by Bardach and Schoenberg (2018) who interviewed 104 older adults in this regard [77]. Their study emphasised that primary care professionals were among the main players that could trigger a lifestyle change in older adults, even though authors such as Vasiliadis et al. (2021) consider that primary care specialists need more support in order to assure consistency and build-up interventions while addressing older adults [78]. The challenge of inducing any change in our participants’ habits remains another topic to be addressed.
The level of depression in older adults participating in this research was lower as their health condition was higher and they did not follow medical treatments for chronic conditions. The fact that physical health problems disrupt the mental health of older adults by inducing states of depression and anxiety was also highlighted in other studies [79].
The level of anxiety in the investigated Romanian older adults was lower for those who self-reported good health condition and higher for those who received recommendations to change their lifestyle behaviour. Additionally, non-compliance with the physician’s recommendations to make lifestyle changes was associated with a slight increase in the levels of depression and anxiety. Authors such as Petkus et al. (2018) demonstrated that physical health, social support, and comorbidities had an influence on the levels of anxiety in older people, and thus intervention programmes for helping them to cope with this negative emotional state were recommended [80].
The results obtained demonstrated a negative association between the level of involvement in physical activities and certain negative emotional states, such as depression and anxiety. Moreover, the active habits of the participants for spending their spare time (walks, trips, sports) were associated with the emotional states. On the one hand, it was revealed that the participants involved in leisure physical activities had lower levels of depression and anxiety, benefiting from the advantages of exercise, which have already been proven in other studies [34,81]. Thus, the PA could be considered a facilitator for fighting negative emotional states. On the other hand, as this study was a cross-sectional one, based on only one snapshot assessment, it still remains to demonstrate if the already installed negative emotional state acted as a barrier to being physically active.
Furthermore, an association between the participation of older adults in Elderly Clubs, including PA leisure, and their depression level was found. Similar results were reported for the older population in Thailand [82]. This study also showed that the involvement of older adults in household activities was associated with lower levels of depression and stress. Another recent study conducted on 553 older people shows that depression is associated with the ability to independently manage the activities of daily living [83].
Overall, the regression model revealed that the challenge of being physically active, as expressed by the PASE leisure score, was addressed to a certain extent by the Romanian older adults, depending on their age, on their leisure habits such as walks, trips, and participation or non-participation in Elderly Clubs. Future research is needed in order to identify other variables to be included in this model.

Limitations

The involvement of a relatively small number of participants in this research influences the extrapolation of the results. In addition, investigating individuals from rural areas can complement in the future the analysis of the lifestyle behaviour of Romanian older adults. The method for recruiting the participants might generate a potential research bias, as the older adults involved in this study were more likely to be active individuals due to their interest towards attending different events linked to physical activity promotion.
Given that this was a snapshot assessment, the correlations between the outcomes are obviously not evidence of causal relationships. Thus, special attention should be paid to the generalisation of findings for this category of population and to the reproducibility of the research protocol.
Health condition was assessed through the participants’ own perceptions, which induced a touch of subjectivism in the assessment. The correlation at least with the information from the most recent check-up performed by the physician could remove this limit, favouring the participation of older adults in physical activities. Furthermore, future research is needed in order to identify older adults’ attitudes toward physical activities, a variable that could be also included into the regression model.

5. Conclusions

This research on Romanian older adults represents an attempt in capturing the main aspects of the phenomenon, starting from the need to fight a sedentary lifestyle and to enjoy the health-related benefits of physical activities.
Removing the barriers related to age and habits will allow Romanian older adults to explore the lifelong benefits of physical activities and successful ageing. Self-reported health revealing older adults’ self-confidence should be addressed as a baseline for providing them with physical exercises programs. Nonetheless, the relation between self-reported health and emotional states might be considered a valuable cue for engaging older adults in physical activity programs.
The social support enabled Romanian older adults’ involvement in physical activities such as for leisure. Consequently, a shared responsibility for addressing the challenge of social network and inactive lifestyle in older adults should be developed among citizens of all ages.
The participation in Elderly Clubs was associated with emotional states and active leisure preferences such as physical activity programs, sports, taking walks, going on trips, and attending exhibitions and theatre performances. Additionally, having a stable life partner might represent a facilitating factor for becoming involved in active leisure as it was demonstrated by this study.
This study underlined that the older adults’ monthly income was associated with certain negative emotions. Nonetheless, embracing an active lifestyle was negatively associated with depression and anxiety in Romanian older adults from urban areas. Therefore, older adults should address more physical activities with fee-free participation or based on any kind of discounts so that they can enjoy sustainable health-related benefits.
The current results can be viewed as efficient feedback in supporting stakeholders and policy makers involved in planning and providing social services. Elderly Clubs referred to in this study should be considered examples of good practice for helping older adults to face the challenges of being physically active.

Author Contributions

All authors contributed equally to this paper. Conception and design: C.U., S.T., M.R., V.P.; Analysis and interpretation of data: C.U., D.C., G.M.; Article drafting: C.U., G.M., D.C.; Article revision: M.R., S.T., V.P.; Approval of the version to be published: C.U., V.P., G.M., D.C., M.R., S.T. All authors have read and agreed to the published version of the manuscript.

Funding

This research received no external funding.

Institutional Review Board Statement

The study was conducted according to the guidelines of the Declaration of Helsinki, and approved by the or Ethics Committee of the National University of Physical Education and Sports in Bucharest (protocol code 938/8th of April 2019).

Informed Consent Statement

Informed consent was obtained from all subjects involved in the study.

Data Availability Statement

The data presented in this study are available on request from the corresponding author. The data are not publicly available due to privacy and ethical restrictions.

Acknowledgments

The authors express their thanks to researcher Cornelia Rada representing the “Francisc I. Rainer” Anthropology Institute of the Romanian Academy, for her involvement and expertise. Additionally, the researchers would like to thank both older adults participating in this research and the representatives of Elderly Clubs in Bucharest, who are dedicated and deeply involved in providing their beneficiaries with an active lifestyle.

Conflicts of Interest

The authors declare no conflict of interest.

Appendix A

Table A1. PASE multiple post hoc comparisons between the 4 subcategories of participants depending on Gender variable by use of Games-Howell test.
Variables and Subgroups of Participants Mean DifferenceStd. ErrorSig.95% Confidence Interval
Lower BoundUpper Bound
PASE leisure activity
MPECWPEC8.615.960.479−7.3524.58
MNPEC12.846.030.161−3.3028.98
WNPEC18.34 *5.810.0162.71333.96
WPECMPEC−8.615.960.479−24.587.35
MNPEC4.233.520.628−5.0113.46
WNPEC9.72 *3.120.0121.5817.87
MNPECMPEC−12.846.030.161−28.983.30
WPEC−4.233.520.628−13.465.01
WNPEC5.493.250.338−3.1114.09
WNPECMPEC−18.34 *5.810.016−33.96−2.71
WPEC−9.72 *3.120.012−17.87−1.58
MNPEC−5.493.250.338−14.093.11
PASE household activity
MPECWPEC4.529.940.968−22.0131.04
MNPEC8.7211.320.868−21.2738.71
WNPEC−0.7010.901.000−29.6028.21
WPECMPEC−4.529.940.968−31.0422.01
MNPEC4.218.310.957−17.8026.21
WNPEC−5.217.730.906−25.5715.15
MNPECMPEC−8.7211.320.868−38.7121.27
WPEC−4.218.310.957−26.2117.80
WNPEC−9.429.440.751−34.3515.51
WNPECMPEC0.7010.901.000−28.2129.60
WPEC5.217.730.906−15.1525.57
MNPEC9.429.440.751−15.5134.35
PASE total score
MPECWPEC13.1314.080.788−24.6550.91
MNPEC21.5615.120.490−18.7161.83
WNPEC17.6414.850.638−21.9757.25
WPECMPEC−13.1314.080.788−50.9124.65
MNPEC8.439.350.804−16.2633.13
WNPEC4.518.910.957−18.9427.96
MNPECMPEC−21.5615.120.490−61.8318.71
WPEC−8.439.350.804−33.1316.26
WNPEC−3.9210.480.982−31.5823.73
WNPECMPEC−17.6414.850.638−57.2521.97
WPEC−4.518.910.957−27.9618.94
MNPEC3.9210.480.982−23.7331.58
*. The mean difference is significant at the 0.05 level.
Table A2. PASE multiple post hoc comparisons between the 4 subcategories of participants depending on the Stable Partner variable by use of Games-Howell test.
Variables and Subgroups of Participants Mean DifferenceStd. ErrorSig.95% Confidence Interval
Lower BoundUpper Bound
PASE leisure
PEC Stable PartnerPEC without Stable Partner−1.023.100.988−9.217.18
NPEC Stable Partener−16.57 *4.960.008−29.71−3.42
NPEC without Stable Partener−6.513.500.252−15.642.62
PEC without Stable PartnerPEC Stable Partner1.023.100.988−7.189.21
NPEC Stable Partner−15.55 *4.860.013−28.49−2.62
NPEC without Stable Partner−5.493.360.366−14.313.33
NPEC Stable PartnerPEC Stable Partner16.57 *4.960.0083.4229.71
PEC without Stable Partner 15.55 *4.860.0132.6228.49
NPEC without Stable Partner10.065.120.213−3.4723.60
NPEC without Stable PartnerPEC Stable Partner6.513.500.252−2.6215.64
PEC without Stable Partner5.493.360.366−3.3314.31
NPEC Stable Partner−10.065.120.213−23.603.47
PASE household
PEC Stable PartnerPEC without Stable Partner16.249.170.298−8.0540.54
NPEC Stable Partener−6.0710.090.931−32.6420.49
NPEC without Stable Partener11.307.600.451−8.6631.26
PEC without Stable PartnerPEC Stable Partner−16.249.170.298−40.548.05
NPEC Stable Partner−22.3210.460.155−49.995.35
NPEC without Stable Partner−4.958.100.928−26.5716.67
NPEC Stable PartnerPEC Stable Partner6.0710.090.931−20.4932.64
PEC without Stable Partner 22.3210.460.155−5.3549.99
NPEC without Stable Partner17.379.120.238−6.7641.50
NPEC without Stable PartnerPEC Stable Partner−11.307.610.451−31.268.66
PEC without Stable Partner4.958.100.928−16.6726.57
NPEC Stable Partner−17.379.120.238−41.506.76
PASE Total
PEC Stable PartnerPEC without Stable Partner15.239.860.418−10.8341.28
NPEC Stable Partener−22.6413.600.351−58.6113.32
NPEC without Stable Partener4.808.760.947−18.2027.79
PEC without Stable PartnerPEC Stable Partner−15.239.860.418−41.2810.83
NPEC Stable Partner−37.87 *13.460.034−73.57−2.17
NPEC without Stable Partner−10.448.550.616−33.1312.26
NPEC Stable PartnerPEC Stable Partner22.6413.600.351−13.3258.61
PEC without Stable Partner 37.87 *13.460.0342.1773.57
NPEC without Stable Partner27.4312.680.148−6.3061.17
NPEC without Stable PartnerPEC Stable Partner−4.808.760.947−27.7918.20
PEC without Stable Partner10.448.550.616−12.2633.13
NPEC Stable Partner−27.4312.690.148−61.76.30
*. The mean difference is significant at the 0.05 level.
Table A3. Backward elimination of all independent variables for PASE leisure as dependent variable.
ModelUnstandardised CoefficientsStandardised CoefficientstSig.
BStd. ErrorBeta
1(Constant)18.66925.872 0.7220.472
Age−0.4690.329−0.141−1.4250.158
DASS depresion 0.2950.7780.0380.3800.705
EC Participation/non participation4.4744.3420.1121.0310.305
Sex−1.9203.767−0.047−0.5100.612
Friends4.6914.0080.1141.1700.245
Reading, studying−2.3243.909−0.058−0.5950.554
Watching TV, listening to music−5.9825.932−0.099−1.0080.316
Going to cultural events1.2704.8090.0300.2640.792
Walks, trips13.4624.2950.3363.1340.002
Sports1.5815.8660.0260.2690.788
Hobbies8.7456.0530.1531.4450.152
2(Constant)19.29925.632 0.7530.453
Age−0.4790.325−0.145−1.4750.144
DASS depresion 0.2890.7740.0370.3740.709
EC Participation/non participation4.9593.9160.1241.2660.209
Sex−1.8913.746−0.046−0.5050.615
Friends4.7303.9850.1151.1870.238
Reading, studying−2.0493.748−0.051−0.5470.586
Watching TV, listening to music−5.8835.891−0.097−0.9990.321
Walks, trips13.7644.1190.3433.3420.001
Sports1.5345.8340.0250.2630.793
Hobbies8.7466.0220.1531.4520.150
3(Constant)20.12025.315 0.7950.429
Age−0.4770.323−0.144−1.4750.144
DASS depresion 0.2750.7680.0360.3580.721
EC Participation/non participation5.1003.8600.1271.3210.190
Sex−2.0003.705−0.049−0.5400.591
Friends4.7293.9660.1151.1930.236
Reading, studying−1.9593.714−0.049−0.5280.599
Watching TV, listening to music−5.8265.857−0.096−0.9950.322
Walks, trips13.9594.0320.3483.4620.001
Hobbies8.9405.9470.1571.5030.136
4(Constant)23.25223.642 0.9840.328
Age−0.5080.310−0.153−1.6380.105
EC Participation/non participation5.3693.7680.1341.4250.157
Sex−1.9363.684−0.048−0.5260.600
Friends4.4473.8680.1081.1500.253
Reading, studying−1.9183.695−0.048−0.5190.605
Watching TV, listening to music−5.2365.594−0.086−0.9360.352
Walks, trips13.7393.9660.3433.4640.001
Hobbies8.3965.7230.1471.4670.146
5(Constant)23.55123.545 1.0000.320
Age−0.5410.302−0.163−1.7920.076
EC Participation/non participation5.2513.7470.1311.4010.164
Sex−1.9703.669−0.048−0.5370.593
Friends4.3433.8490.1061.1280.262
Watching TV, listening to music−5.0575.562−0.083−0.9090.366
Walks, trips13.7453.9510.3433.4790.001
Hobbies7.7545.5670.1361.3930.167
6(Constant)20.32222.680 0.8960.372
Age−0.5390.301−0.163−1.7920.076
EC Participation/non participation5.0623.7170.1261.3620.176
Friends3.9573.7670.0971.0510.296
Watching TV, listening to music−4.7525.513−0.078−0.8620.391
Walks, trips14.1153.8760.3523.6420.000
Hobbies7.4625.5200.1311.3520.180
7(Constant)15.72022.014 0.7140.477
Age−0.5910.294−0.178−2.0090.047
EC Participation/non participation5.6223.6550.1401.5380.127
Friends3.5393.7310.0860.9490.345
Walks, trips14.2633.8670.3563.6880.000
Hobbies6.4815.3940.1141.2020.232
8(Constant)17.40121.931 0.7930.429
Age−0.5740.294−0.173−1.9530.054
EC Participation/non participation6.0563.6240.1511.6710.098
Walks, trips15.0983.7640.3774.0110.000
Hobbies6.5625.3910.1151.2170.226
9(Constant)26.33020.718 1.2710.207
Age−0.6400.289−0.193−2.2140.029
EC Participation/non participation6.7343.5900.1681.8760.064
Walks, trips16.5943.5660.4144.6530.000
Dependent Variable: PASE_leisure.

References

  1. World Health Organization. Global Health and Aging. 2021. Available online: https://www.who.int/ageing/publications/global_health.pdf (accessed on 3 July 2021).
  2. HelpAge International Network. Global AgeWatch Index 2015. Insight Report. 2015. Available online: https://www.helpage.org/global-agewatch/reports/global-agewatch-index-2015-insight-report-summary-and-methodology/ (accessed on 3 July 2021).
  3. Rădoi, S.; Mondiru, D.; Logofătu, G. Projection of the Romanian Elderly Population, at Territorial Level, at the Horizon of 2060. Iagar EM, Edition Coord: Pisică, S.; Ioniță, A., Institutul National de Statistică. 2018. National Institute of Statistics, Bucharest. Available online: https://insse.ro/cms/ro/content/proiectarea-popula%C8%9Biei-v%C3%A2rstnice-rom%C3%A2niei-%C3%AEn-profil-teritorial-la-orizontul-anului-2060 (accessed on 3 July 2021).
  4. Eurostat. Populations Projections. Europop 2019. Population on 1 January by Age, Sex and Type of Projection. European Commission. 2019. Available online: https://ec.europa.eu/eurostat/data/database?node_code=proj (accessed on 3 July 2021).
  5. Matei, R.; Saghin, D.; Dumitrache, L.; Nae, M. Multidimensional Approach on Sustainability of Ageing in Romanian Residential Care Centres for Elders. Sustainability 2018, 10, 3336. [Google Scholar] [CrossRef] [Green Version]
  6. Hunter, W.; Wang, W.; Worsley, A. Retirement planning and expectations of Australian babyboomers: Are they ready to retire? Ann. N. Y. Acad. Sci. 2007, 1114, 267–278. [Google Scholar] [CrossRef]
  7. Park, J.-A.; Choi, B. Factors Affecting the Intention of Multi-Family House Residents to Age in Place in a Potential Naturally Occurring Retirement Community of Seoul in South Korea. Sustainability 2021, 13, 8922. [Google Scholar] [CrossRef]
  8. Eurostat. Tables by Benefits—Old Age Function. 2021. Available online: https://ec.europa.eu/eurostat/databrowser/view/spr_exp_fol/default/table?lang=en (accessed on 25 September 2021).
  9. Eurostat. Social Protection Statistics—Pension Expenditure and Pension Beneficiaries. 2020. Available online: https://ec.europa.eu/eurostat/statistics-explained/index.php?title=Social_protection_statistics_-_pension_expenditure_and_pension_beneficiaries (accessed on 26 September 2021).
  10. Institutul National de Statistica [National Institut of Statistics]. Numarul de Pensionari si Pensia Medie Lunara in Anul 2020 [The Number of Pensionars and the Medium Pension per Month in 2020]. 2021. Available online: insse.ro/cms/ro/tags/comunicat-numarul-de-pensionari-si-pensie-medie-lunara (accessed on 25 September 2021).
  11. European Commission. Semestrul European—Fisa Tematica. Adecvarea si Sustenabilitatea Pensiilor [European Semester—Thematic Factsheet. Adequacy and Sustainability of Pensions]. 2017. Available online: https://ec.europa.eu/info/sites/default/files/file_import/european-semester_thematic-factsheet_adequacy-sustainability-pensions_ro.pdf (accessed on 26 September 2021).
  12. Animasahun, V.J.; Chapman, H.J. Psychosocial health challenges of the elderly in Nigeria: A narrative review. Afr. Health Sci. 2017, 17, 575–583. [Google Scholar] [CrossRef]
  13. Mondor, L.; Maxwell, C.J.; Hogan, D.B.; Bronskill, S.E.; Gruneir, A.; Lane, N.E.; Wodchis, W.P. Multimorbidity and healthcare utilization among home care clients with dementia in Ontario, Canada: A retrospective analysis of a population-based cohort. PLoS Med. 2017, 14, e1002249. [Google Scholar] [CrossRef] [PubMed] [Green Version]
  14. National Research Council. Grand Challenges of Our Aging Society: Workshop Summary; Smith, A., Ed.; Center for Economic, Governance, and International Studies, Division of Behavioral and Social Sciences and Education; The National Academies Press: Washington, DC, USA, 2010. [Google Scholar]
  15. Lyons, A.; Alba, B.; Heywood, W.; Fileborn, B.; Minichiello, V.; Barrett, C.; Hinchliff, S.; Malta, S.; Dow, B. Experiences of ageism and the mental health of older adults. Aging Ment. Healths 2018, 22, 1456–1464. [Google Scholar] [CrossRef]
  16. Martins, R.; Neto, M.J.; Andrade, A.; Albuquerque, C. Abuse and maltreatment in the elderly. Aten. Primaria 2014, 46 (Suppl. 5), 206–209. [Google Scholar] [CrossRef] [Green Version]
  17. Zaidi, A.; Gasior, K.; Hofmarcher, M.M.; Lelkes, O.; Marin, B.; Rodrigues, R.; Schmidt, A.; Vanhuysse, P.; Zólyomi, E. Active Ageing Index 2012. Concept, Methodology and Final Results. 2012. Available online: https://www.euro.centre.org/downloads/detail/1542 (accessed on 3 July 2021).
  18. United Nations Economic Commission of Europe (2018) Active Ageing Index. Analytical Report. Available online: https://unece.org/fileadmin/DAM/pau/age/Active_Ageing_Index/ACTIVE_AGEING_INDEX_TRENDS_2008-2016_web_with_cover.pdf (accessed on 3 July 2021).
  19. Hallal, P.C.; Andersen, L.B.; Bull, F.C.; Guthold, R.; Haskell, W.; Ekelund, U.; Group LPASW. Global physical activity levels: Surveillance progress, pitfalls, and prospects. Lancet 2012, 380, 247–257. [Google Scholar] [CrossRef]
  20. Franco, M.R.; Tong, A.; Howard, K.; Sherrington, C.; Ferreira, P.H.; Pinto, R.Z.; Ferreira, M.L. Older people’s perspectives on participation in physical activity: A systematic review and thematic synthesis of qualitative literature. Br. J. Sports Med. 2015, 49, 1268–1276. [Google Scholar] [CrossRef]
  21. Rada, C. Spending leisure time when approaching retirement and during retirement. J. Phychol. 2018, 64, 15. [Google Scholar]
  22. Baert, V.; Gorus, E.; Mets, T.; Geerts, C.; Bautmans, I. Motivators and barriers for physical activity in the oldest old: A systematic review. Ageing Res. Rev. 2011, 10, 464–474. [Google Scholar] [CrossRef] [PubMed]
  23. Bauman, A.E.; Reis, R.S.; Sallis, J.F.; Wells, J.C.; Loos, R.J.; Martin, B.W.; Lancet Physical Activity Series Working Group. Correlates of physical activity: Why are somes people physically active and others not? Lancet 2012, 380, 258–271. [Google Scholar] [CrossRef]
  24. Moschny, A.; Platen, P.; Klaassen-Mielke, R.; Trampisch, U.; Hinrichs, T. Barriers to physical activity in older adults in Germany: A cross-sectional study. Int. J. Behav. Nutr. Phys. Act. 2011, 8, 121. [Google Scholar] [CrossRef] [Green Version]
  25. Chávez-Moreno, D.V.; Infante-Sierra, H.; Serralde-Zúñiga, A.E. Sarcopenia y funcionalidad en el adulto mayor hospitalizado [Sarcopenia and functionality in elderly inpatient]. Nutr. Hosp. 2015, 31, 1660–1666. [Google Scholar] [CrossRef] [PubMed]
  26. Bembom, O.; van der Laan, M.; Haight, T.; Tager, I. Leisure-time physical activity and all-cause mortality in an elderly cohort. Epidemiology (Cambridge Mass.) 2009, 20, 424–430. [Google Scholar] [CrossRef] [Green Version]
  27. Chodzko-Zajko, W.J.; Proctor, D.N.; Fiatarone Singh, M.A.; Minson, C.T.; Nigg, C.R.; Salem, G.J.; Skinner, J.S. Exercise and Physical Activity for Older Adults. Med. Sci. Sports Exerc. 2009, 41, 1510–1530. [Google Scholar] [CrossRef]
  28. McPhee, J.S.; French, D.P.; Jackson, D.; Nazroo, J.; Pendleton, N.; Degens, H. Physical activity in older age: Perspectives for healthy ageing and frailty. Biogerontology 2016, 17, 567–580. [Google Scholar] [CrossRef]
  29. Thomas, E.; Battaglia, G.; Patti, A.; Brusa, J.; Leonardi, V.; Palma, A.; Bellafiore, M. Physical activity programs for balance and fall prevention in elderly: A systematic review. Medicine 2019, 98, e16218. [Google Scholar] [CrossRef] [PubMed]
  30. Fernández-Argüelles, E.L.; Rodríguez-Mansilla, J.; Antunez, L.E.; Garrido-Ardila, E.M.; Muñoz, R.P. Effects of dancing on the risk of falling related factors of healthy older adults: A systematic review. Arch. Gerontol. Geriatr. 2015, 60, 1–8. [Google Scholar] [CrossRef]
  31. Li, J.; Hsu, C.C.; Lin, C.T. Leisure Participation Behavior and Psychological Well-Being of Elderly Adults: An Empirical Study of Tai Chi Chuan in China. Int. J. Environ. Res. Public Health 2019, 16, 3387. [Google Scholar] [CrossRef] [PubMed] [Green Version]
  32. Verghese, J.; Lipton, R.B.; Katz, M.J.; Hall, C.B.; Derby, C.A.; Kuslansky, G.; Ambrose, A.F.; Sliwinski, M.; Buschke, H. Leisure activities and the risk of dementia in the elderly. N. Engl. J. Med. 2003, 348, 2508–2516. [Google Scholar] [CrossRef] [Green Version]
  33. Nilsson, I.; Häggström Lundevaller, E.; Fisher, A.G. The Reationship between Engagement in Leisure Activities and Self-Rated Health in Later Life. Act. Adapt. Aging 2017, 41, 175–190. [Google Scholar] [CrossRef]
  34. Almeida, O.P. Prevention of depression in older age. Maturitas 2014, 79, 136–141. [Google Scholar] [CrossRef]
  35. Casey, D.A. Depression in Older Adults: A Treatable Medical Condition. Prim. Care 2017, 44, 499–510. [Google Scholar] [CrossRef]
  36. De Oliveira, L.; Souza, E.C.; Rodrigues, R.; Fett, C.A.; Piva, A.B. The effects of physical activity on anxiety, depression, and quality of life in elderly people living in the community. Trends Psychiatry Psychother. 2019, 41, 36–42. [Google Scholar] [CrossRef]
  37. Beattie, E.; Pachana, N.; Franklin, S.J.; Franklin, S.J. Double jeopardy: Comorbid anxiety and depression in late life. Res. Gerontol. Nurs. 2010, 3, 209–220. [Google Scholar] [CrossRef] [PubMed]
  38. Uchmanowicz, I.; Gobbens, R.J. The relationship between frailty, anxiety and depression, and health-related quality of life in elderly patients with heart failure. Clin. Interv. Aging 2015, 10, 1595–1600. [Google Scholar] [CrossRef] [Green Version]
  39. Andreescu, C.; Lee, S. Anxiety Disorders in the Elderly. Adv. Exp. Med. Biol. 2020, 1191, 561–576. [Google Scholar]
  40. Mohammadpour, A.; Sadeghmoghadam, L.; Shareinia, H.; Jahani, S.; Amiri, F. Investigating the role of perception of aging and associated factors in death anxiety among the elderly. Clin. Interv. Aging 2018, 13, 405–410. [Google Scholar] [CrossRef] [PubMed] [Green Version]
  41. Billot, M.; Calvani, R.; Urtamo, A.; Sánchez-Sánchez, J.L.; Ciccolari-Micaldi, C.; Chang, M.; Roller-Wirnsberger, R.; Wirnsberger, G.; Sinclair, A.; Vaquero-Pinto, N.; et al. Preserving Mobility in Older Adults with Physical Frailty and Sarcopenia: Opportunities, Challenges, and Recommendations for Physical Activity Interventions. Clin. Interv. Aging 2020, 15, 1675–1690. [Google Scholar] [CrossRef] [PubMed]
  42. Böhm, A.W.; Mielke, G.I.; da Cruz, M.F.; Ramirez, V.V.; Wehrmesister, F.C. Social Support and Leisure-Time Physical Activity Among the Elderly: A Population-Based Study. J. Phys. Act. Health 2016, 13, 599–605. [Google Scholar] [CrossRef]
  43. Fulbright, S.A. Rates of depression and participation in senior centre activities in community-dwelling older persons. J. Psychiatr. Ment. Health Nurs. 2010, 17, 385–391. [Google Scholar] [CrossRef]
  44. Hadley, R. It’s most of my life—going to the pub or the group: The social networks of involuntarily childless older men. Ageing Soc. 2021, 41, 51–76. [Google Scholar] [CrossRef] [Green Version]
  45. Wright, M.R.; Brown, S.L. Psychological Well-Being among Older Adults: The Role of Partnership Status. J. Marriage Fam. 2017, 79, 833–849. [Google Scholar] [CrossRef]
  46. Broese van Groenou, M.; te Riele, S.; de Jong Gierveld, J. Receiving Support and Care in Older Age: Comparing LAT Relationships With First Marriages, Remarriages, and Cohabitation. J. Fam. Issues 2019, 40, 1786–1807. [Google Scholar] [CrossRef]
  47. Tasfiliz, D.; Selcuk, E.; Gunaydin, G.; Slatcher, R.B.; Corriero, E.F.; Ong, A.D. Patterns of perceived partner responsiveness and well-being in Japan and the United States. J. Fam. Psychol. 2018, 32, 355–365. [Google Scholar] [CrossRef] [Green Version]
  48. Caicedo-Velásquez, B.; Restrepo-Méndez, M.C. The role of individual, household, and area of residence factors on self-rated health in Colombian adults: A multilevel study. Efecto de las condiciones individuales, del hogar y del área de residencia en la autopercepción de su salud en adultos colombianos: Un estudio multinivel. Biomédica 2020, 40, 296–308. [Google Scholar] [CrossRef] [PubMed]
  49. Bolszak, S.; Casartelli, N.C.; Impellizzeri, F.M.; Maffiuletti, N.A. Validity and reproducibility of the Physical Activity Scale for the Elderly (PASE) questionnaire for the measurement of the physical activity level in patients after total knee arthroplasty. BMC Musculoskelet. Disord. 2014, 15, 46. [Google Scholar] [CrossRef] [Green Version]
  50. Curcio, F.; Liguori, I.; Cellulare, M.; Sasso, G.; Della-Morte, D.; Gargiulo, G.; Testa, G.; Cacciatore, F.; Bonaduce, D.; Abete, P. Physical Activity Scale for the Elderly (PASE) Score Is Related to Sarcopenia in Noninstitutionalized Older Adults. J. Geriatr. Phys. Ther. 2019, 42, 130–135. [Google Scholar] [CrossRef] [PubMed]
  51. Svege, I.; Kolle, E.; Risberg, M.A. Reliability and validity of the Physical Activity Scale for the Elderly (PASE) in patients with hip osteoarthritis. BMC Musculoskelet. Disord. 2012, 13, 26. [Google Scholar] [CrossRef] [Green Version]
  52. New England Research Institutes. Physical Activity Scale for the Elderly. Administration and Scoring Instruction Manual. NERI. 1991. Available online: https://meetinstrumentenzorg.nl/wp-content/uploads/instrumenten/PASE-handl.pdf (accessed on 25 January 2021).
  53. Psychology Fundation of Australia. Depression, Anxiety and Stress Scale. 2018. Available online: http://www2.psy.unsw.edu.au/dass/ (accessed on 25 January 2021).
  54. Howell, D.C. Statistical Methods for Psychology, 8th ed.; Chapter 2.5. Describing Distributions; Cengage Learning: Wadsworth, OH, USA, 2013; pp. 27–29. [Google Scholar]
  55. Morgan, G.A.; Leech, N.L.; Gloeckner, G.W.; Barrett, K.C. IBM SPSS for Introductory Statistics: Use and Interpretation; Chapter 3. Measurement and descriptive statistics; Routledge: New York, NY, USA, 2011; p. 52. [Google Scholar]
  56. Kline, R.B. Beyond Significance Testing. STATISTICS Reform in the Behavioral Sciences, 2nd ed.; Part II. Effect size estimation, Chapter 5. Continuous outcomes; American Psychological Association: Washington, DC, USA, 2013; p. 152. [Google Scholar]
  57. Field, A. Discovering Statistics Using SPSS, 5th ed; Chapter 12.5. Post hoc Procedures, Chapter 19.3 2. Pearson’s Chi-Square Test; Sage Publication Ltd.: London, UK, 2018; pp. 717, 1064. [Google Scholar]
  58. Matthews-López, L. Best Practices and Technical Issues in Cross-Lingual, Crosscultural Assessments: An Evaluation of a Test Adaptation; Chapter 3. Post-hoc Procedures; Ohio University: Athens, OH, USA, 2003; p. 99. [Google Scholar]
  59. Dunkler, D.; Plischke, M.; Leffondré, K.; Heinze, G. Augmented Backward Elimination: A Pragmatic and Purposeful Way to Develop Statistical Models. PLoS ONE 2014, 9, e113677. [Google Scholar]
  60. Taylor, D. Physical activity is medicine for older adults. Postgrad. Med. J. 2014, 90, 26–32. [Google Scholar] [CrossRef] [Green Version]
  61. Andrade-Gómez, E.; García-Esquinas, E.; Ortolá, R.; Martínez-Gómez, D.; Rodríguez-Artalejo, F. Watching TV has a distinct sociodemographic and lifestyle profile compared with other sedentary behaviors: A nationwide population-based study. PLoS ONE 2017, 12, e0188836. [Google Scholar] [CrossRef] [PubMed] [Green Version]
  62. Deluga, A.; Kosicka, B.; Dobrowolska, B.; Chrzan-Rodak, A.; Jurek, K.; Wrońska, I.; Ksykiewicz-Dorota, A.; Jędrych, M.; Drop, B. Lifestyle of the elderly living in rural and urban areas measured by the FANTASTIC Life Inventory. Ann. Agric. Environ. Med. AAEM 2018, 25, 562–567. [Google Scholar] [CrossRef] [PubMed] [Green Version]
  63. Department for Culture MaS. Adult Participation in Sport: Analysis of the Taking Part Survey. 2011. Available online: https://www.gov.uk/government/publications/adult-participation-in-sport-analysis-of-the-taking-part-survey (accessed on 3 July 2021).
  64. Nguyen, T.X.; Nguyen, T.X.; Pham, T.; Nguyen, C.T.; Vu, G.T.; Nguyen, L.H.; Tran, B.X.; Vu, H.; Latkin, C.A.; Ho, C.S.H.; et al. Establishing activity centers for elderly people in metropolitan areas of Vietnam: Preference and willingness-to-pay. J. Multidiscip. Healthc. 2019, 12, 795–802. [Google Scholar] [CrossRef] [Green Version]
  65. Notthoff, N.; Reisch, P.; Gerstorf, D. Individual Characteristics and Physical Activity in Older Adults: A Systematic Review. Gerontology 2017, 63, 443–459. [Google Scholar] [CrossRef] [Green Version]
  66. Xu, H.; Wang, Y. The impacts of gender on seasonal retirement mobility and wellbeing. Ageing Soc. 2021, 41, 187–207. [Google Scholar] [CrossRef]
  67. Ong, A.D.; Uchino, B.N.; Wethington, E. Loneliness and Health in Older Adults: A Mini-Review and Synthesis. Gerontology 2016, 62, 443–449. [Google Scholar] [CrossRef]
  68. Holt-Lunstad, J.; Smith, T.B.; Baker, M.; Harris, T.; Stephenson, D. Loneliness and social isolation as risk factors for mortality: A meta-analytic review. Perspect. Psychol. Sci. A J. Assoc. Psychol. Sci. 2015, 10, 227–237. [Google Scholar] [CrossRef] [PubMed] [Green Version]
  69. Kharicha, K.; Iliffe, S.; Harari, D.; Swift, C.; Gillmann, G.; Stuck, A.E. Health risk appraisal in older people 1: Are older people living alone an ‘at-risk’ group? Br. J. Gen. Pract. 2007, 57, 271–276. [Google Scholar]
  70. Ožic, S.; Vasiljev, V.; Ivkovic, V.; Bilajac, L.; Rukavina, T. Interventions aimed at loneliness and fall prevention reduce frailty in elderly urban population. Medicine 2020, 99, e19145. [Google Scholar] [CrossRef] [PubMed]
  71. Sugisawa, H.; Sugihara, Y.; Kobayashi, E.; Fukaya, T.; Liang, J. The influence of lifecourse financial strains on the later-life health of the Japanese as assessed by four models based on different health indicators. Ageing Soc. 2019, 39, 2631–2652. [Google Scholar] [CrossRef] [Green Version]
  72. Westerhof, G.J.; Miche, M.; Brothers, A.F.; Barrett, A.E.; Diehl, M.; Montepare, J.M.; Wahl, H.W.; Wurm, S. The influence of subjective aging on health and longevity: A meta-analysis of longitudinal data. Psychol. Aging 2014, 29, 793–802. [Google Scholar] [CrossRef] [PubMed]
  73. Jylhä, M. What is self-rated health and why does it predict mortality? Towards a unified conceptual model. Soc. Sci. Med. 2009, 69, 307–316. [Google Scholar] [CrossRef]
  74. Benyamini, Y.; Blumstein, T.; Murad, H.; Lerner-Geva, L. Changes over time from baseline poor self-rated health: For whom does poor self-rated health not predict mortality? Psychol. Health 2011, 26, 1446–1462. [Google Scholar] [CrossRef]
  75. Elsawy, B.; Higgins, K.E. Physical activity guidelines for older adults. Am. Fam. Physician 2010, 81, 55–59. [Google Scholar]
  76. Nguyen-Michel, V.H.; Pallanca, O.; Brion, A.; Vecchierini, M.F. Les habitudes de vie et de sommeil chez les patients âgés insomniaques [Sleep habits and lifestyle of elderly patients with insomnia] [Les habitudes de vie et de sommeil chez les patients âgés insomniaques]. Soins. Gerontol. 2019, 24, 38–42. [Google Scholar] [CrossRef]
  77. Bardach, S.H.; Schoenberg, N.E. The Role of Primary Care Providers in Encouraging Older Patients to Change Their Lifestyle Behaviors. Clin. Gerontol. 2018, 41, 326–334. [Google Scholar] [CrossRef]
  78. Vasiliadis, H.M.; Gontijo Guerra, S.; Berbiche, D.; Pitrou, I.E. The Factors Associated with 3-Year Mortality Stratified by Physical and Mental Multimorbidity and Area of Residence Deprivation in Primary Care Community-Living Older Adults. J. Aging Health 2021, 33, 545–556. [Google Scholar] [CrossRef]
  79. Moussavi, S.; Chatterji, S.; Verdes, E.; Tandon, A.; Patel, V.; Ustun, B. Depression, chronic diseases, and decrements in health: Results from the World Health Surveys. Lancet 2007, 370, 851–858. [Google Scholar] [CrossRef]
  80. Petkus, A.J.; Wetherell, J.L.; Stein, M.B.; Chavira, D.A.; Craske, M.G.; Sherbourne, C.; Sullivan, G.; Bystritsky, A.; Roy-Byrne, P. Age Differences in Death and Suicidal Ideation in Anxious Primary Care Patients. Clin. Gerontol. 2018, 41, 271–281. [Google Scholar] [CrossRef] [PubMed]
  81. Byeon, H. Relationship between Physical Activity Level and Depression of Elderly People Living Alone. Int. J. Environ. Res. Public Health 2019, 16, 4051. [Google Scholar] [CrossRef] [PubMed] [Green Version]
  82. Kosulwit, L. Mental health status, including depression and quality of life among members of an elderly club in suburban Bangkok. J. Med. Assoc. Thail. 2012, 95 (Suppl. 1), S92–S101. [Google Scholar] [CrossRef]
  83. Coventry, P.A.; McMillan, D.; Clegg, A.; Brown, L.; van der Feltz-Cornelis, C.A.O.; Gilbody, S.; Ali, S. Frailty and depression predict instrumental activities of daily living in older adults: A population-based longitudinal study using the CARE75+ cohort. PLoS ONE 2020, 15, e0243972. [Google Scholar]
Figure 1. Research flow chart.
Sustainability 13 12511 g001
Figure 2. Participants’ involvement in different leisure activities (%).
Sustainability 13 12511 g002
Table 1. Socio-demographic characteristics.
Socio-Demographic DataWhole Group
N = 172
PEC
N = 107
NPEC
N = 65
Age71 [56–86] years71.1 [58–86] years69.66 [56–83] years
Sex *
Female65.77252.3
Male34.32847.7
Residence *
Urban100100100
Marital status *
Married39.027.366.7
Divorced15.118.27.8
Widowed39.547.919.6
Single3.54.12.0
Concubine2.92.53.9
Stable life partner44.833.970.6
Without stable life partner55.266.129.4
Education *
Primary school1.70.83.9
Lower secondary school 26.728.921.6
Upper secondary school23.324.819.6
Foreman school in a profession/post-secondary19.216.525.5
University degree27.327.327.5
Other1.71.72.0
Personal monthly income **
Less than or equal to RON 1000 (EUR 209)17.421.57.8
Between RON 1001–2000 (EUR 209–418)54.753.756.9
Between RON 2001–3000 (EUR 418–628)20.317.427.5
Between RON 3001–4000 (EUR 628–837)1.70.83.9
Above RON 4000 (Above EUR 837)2.32.52.0
Non answer3.54.12.0
* %. ** RON to EUR conversion according to the National Bank of Romania exchange rate as at 10 December 2019.
Table 2. Spearman’s correlations of the health-related items, for PEC and NPEC groups.
Health-Related ItemsTreatment Received for Chronic ConditionRecommended Changes in LifestyleImplemented Recommended Changes
PEC
Spearman’s rhoSelf-reported health 0.237 *0.216 *−0.274 **
p0.0140.0250.004
N107107107
Treatment received for chronic condition 0.263 **−0.265 **
p 0.0060.003
N 107107
Recommended changes in lifestyle −0.837 **
p 0.000
N 107
NPEC
Spearman’s rhoSelf-reported health 0.508 **0.276 *−0.277 *
p0.0000.0260.025
N656565
Treatment received for chronic condition 0.416 **−0.397 **
p 0.0010.001
N 6565
Recommended changes in lifestyle −0.890 **
p 0.000
N 65
* p < 0.05, ** p < 0.01.
Table 3. T-test for PASE variables of PEC and NPEC groups.
Levene’s Test for Equality of Variancest-Test for Equality of Means
FSig.tdfSig. (2-tailed)Mean DifferenceStd. Error Difference95% Confidence Interval of the Difference
LowerUpper
PASE_leisure21.0290.000−2.9321700.004−9.513.242−15.925−3.12
−3.350168.4500.001−9.512.842−15.125−3.902
PASE_household1.7880.183−0.0861700.932−0.556.342−13.07211.982
−0.088145.4330.930−0.556.192−12.79211.702
PASE_Total4.3710.038−1.2721700.205−10.067.913−25.6835.558
−1.357161.1880.177−10.067.417−24.7094.584
Publisher’s Note: MDPI stays neutral with regard to jurisdictional claims in published maps and institutional affiliations.

