Article

Energy/Economic Analysis and Optimization of On-Grid Photovoltaic System Using CPSO Algorithm

by
Reza Alayi
1,
Mahdi Mohkam
2,
Seyed Reza Seyednouri
3,
Mohammad Hossein Ahmadi
4,* and
Mohsen Sharifpur
5,6,*
1
Department of Mechanics, Germi Branch, Islamic Azad University, Germi 5651763764, Iran
2
Department of Renewable Energy and Energy Conversion, Institute of Science and High Technology and Environmental Sciences, Graduate University of Advanced Technology, Kerman 7631885356, Iran
3
Young Researchers and Elite Club, Germi Branch, Islamic Azad University, Germi 5651763764, Iran
4
Faculty of Mechanical Engineering, Shahrood University of Technology, Shahrood 3619995161, Iran
5
Department of Mechanical and Aeronautical Engineering, University of Pretoria, Pretoria 0002, South Africa
6
Department of Medical Research, China Medical University Hospital, China Medical University, Taichung 404, Taiwan
*
Authors to whom correspondence should be addressed.
Sustainability 2021, 13(22), 12420; https://doi.org/10.3390/su132212420
Submission received: 25 September 2021 / Revised: 4 November 2021 / Accepted: 4 November 2021 / Published: 10 November 2021

Abstract

:
Today, the use of renewable energy is increasing day by day, and this development requires the optimization of these technologies in various dimensions. Solar systems have a higher acceptance due to their high availability and accessibility; the most common solar technology is photovoltaic cell. In this research, modeling was done to achieve the most economically optimal arrangement of photovoltaic panels, inverters, and module placement to generate more electrical energy by considering economic parameters, for which the CPSO algorithm was used. Four different combinations of module and inverter were studied in this research, among which the second combination, which included PV module type one and inverter type two, was the best case. One of the significant results of the present study is 191,430 kWh of electrical energy during the studied year by the solar cell connected to the grid, which requires $42,792,727 to produce.

1. Introduction

The use of fossil fuels to supply electricity is a common method that is associated with emissions. The increasing use of fossil fuels has reduced these reserves [1,2,3]. Energy is used in residential and industry sections, etc., and therefore, predicting energy consumption can be very helpful. Moayedi et al. [4] investigated double-target-based neural networks in order to predict both cooling and heating energy consumption in residential buildings. They provided unique double-target equations that could estimate these two outputs simultaneously. The reduction of fossil fuels and the pollution caused by this type of fuel has necessitated the use of renewable energy systems (RES) [5,6,7]. One of the main problems of renewable energy is the storage of generated power when there is no access to production resources. One of the ways is to use batteries. This technology also has its own losses [8,9]. Battery research was done to uncover its potential [9,10,11]. Then, after the investigations, the battery usage in the power networks was evaluated [12,13]. Among these types of energy generation systems, the on-grid photovoltaic system can be mentioned, which is supported by many countries around the world [14,15,16,17]. On-grid photovoltaic system is used to supply grid power through energy obtained from PV modules [18,19,20]. Much work has been done on the design of on-grid photovoltaic systems. The effect of diverse variables on the system performance was investigated in [21,22,23,24,25]. In [26], research was conducted to provide heat and power by a photovoltaic thermal system to supply different consumption needs of a building. In [27], authors investigated the presence of PV generation, aiming to decrease power loss and enhance voltage profile. In [28], authors conducted research to improve efficiency of PV grid-connected system under partial shading conditions. In [29,30,31], the PV size ratio was analyzed to reduce the overall cost. According to simulations performed for different areas, it can be observed that the best of them depends on the technical specifications of the inverter, the slope angle of PV modules, and the cost of equipment. In [32], the authors investigated the optimal building-integrated photovoltaic window performance for total consumed energy in terms of output energy, cooling and heating load, and artificial lighting to meet visual comfort and energy savings in specific buildings in a semi-arid weather condition. In [33,34], a method for the best design and economic investigation of an on-grid photovoltaic system was shown. Table 1 gives information on some recent work conducted in the field of modeling PV and optimization with different algorithms.
In these papers, it is observed that the profitability and design of the on-grid photovoltaic system can be greatly affected by parameters like the required land cost for installation, financial aid, and the sale price of electricity to the grid. In this method, the profit obtained is maximized using a genetic algorithm.
In the mentioned methods for designing the system, some important factors, such as the slope angle of PV modules, the price of required land to install the system, the structure of the panel supports, and economic parameters, such as taxes and inflation rates, which can have a great impact on the design, were not considered. In this section, a new approach for the optimal design of an on-grid photovoltaic system is presented and is applicable to systems that sell all the output energy to the power grid. This method aims to provide the best number of PV modules, best number of inverters, the best slope angle of PV modules, the best place to install the module in the existing area, and the best module distribution among the inverters so that the overall net profit is maximized during system operation. The profit is calculated concerning the net present value (NPV) method. The minimization of the objective function, which is the cost of the system, is done using the CPSO algorithm.
The structure of this paper is as follows: Section 2 presents the Materials and Methods along with the system description and required data, and Section 3 presents the simulation results. Finally, the conclusions are drawn and presented in Section 4.

2. Materials and Methods
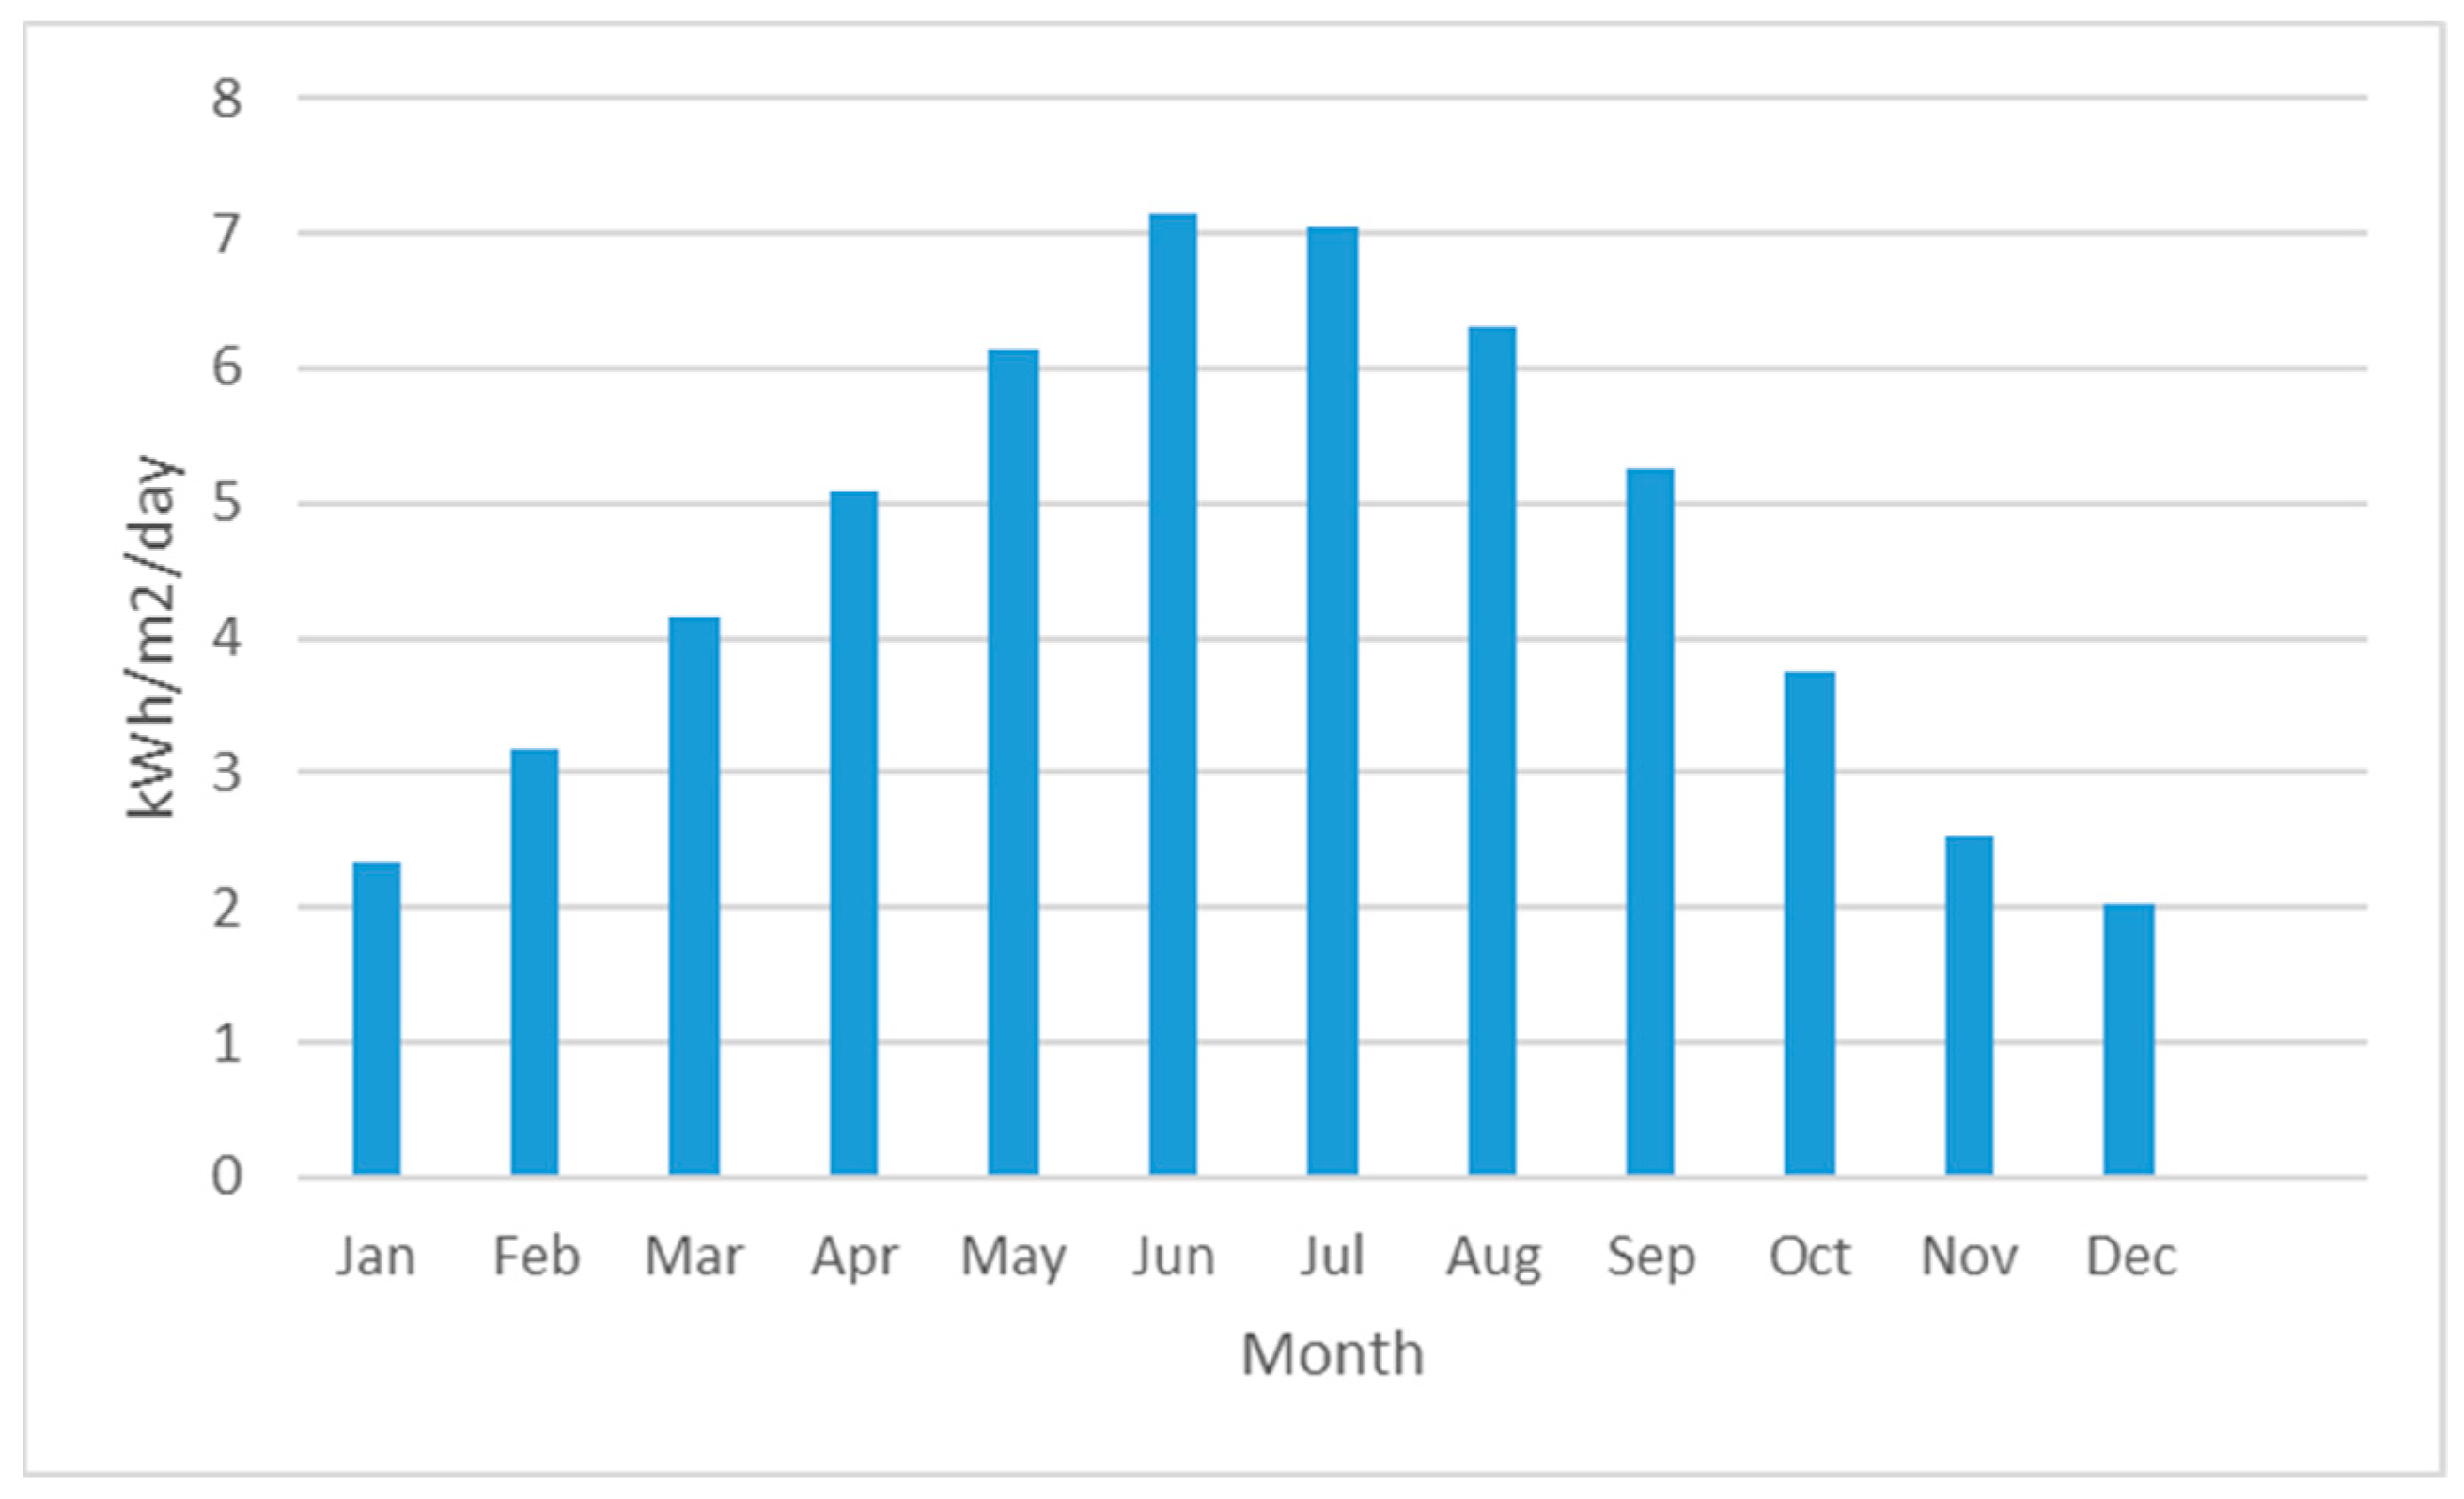
In this study, an on-grid photovoltaic system is considered as a complement to the national electricity grid in one of the villages in the northwest of Iran. With the optimal design of on-grid photovoltaic system, in addition to generating adequate power, the cost of building the system will be minimized. The aim of the proposed method is to provide the numbers of modules and inverters for installation, the best slope angle of PV modules, the best distribution of modules among inverters, and the optimal use of the available area for installation considering the support structure of panels using CPSO algorithm. Among the types of equipment, the most economical type of combination is selected, and finally, the net profit of the whole system, which is calculated taking into account the net present value (NPV) method, is expressed along with the analysis of pollution reduction.
In an on-grid photovoltaic system, several DC-to-AC inverters are used to convert the output DC voltage of the PV modules to the AC voltage corresponding to the grid. The input of each DC-to-AC inverter is a set of vertical rows of PV modules to which it is connected.

2.1. Required Data

The method presented in this study is for optimum design of on-grid photovoltaic system in one of the villages of Osco city located in northwestern Iran (east Azerbaijan), with a longitude of 46 degrees and 6 min and 30 s and a latitude of 37 degrees and 55 min. The location has a relatively good radiation intensity (between 2 to 8 kWh/m2 per day). The average daily amount of sunlight and ambient temperature was obtained from the regional meteorological office. Graphs related to radiation intensity and ambient temperature can be seen in Figure 1 and Figure 2.
The technical and economic specifications of the types of PV modules and DC / AC inverter that enter the optimization process as primary information are shown in Table 2 and Table 3. The installation cost of each equipment is included along with their initial cost. The maintenance cost of photovoltaic modules is 1%, and the inverter maintenance cost is 1.5% of the initial cost of each of them. As can be seen in the tables, two characteristics of the equipment were entered for each module and inverter, so there are four modes of PV module and inverter combination, from which the most suitable one will be selected.

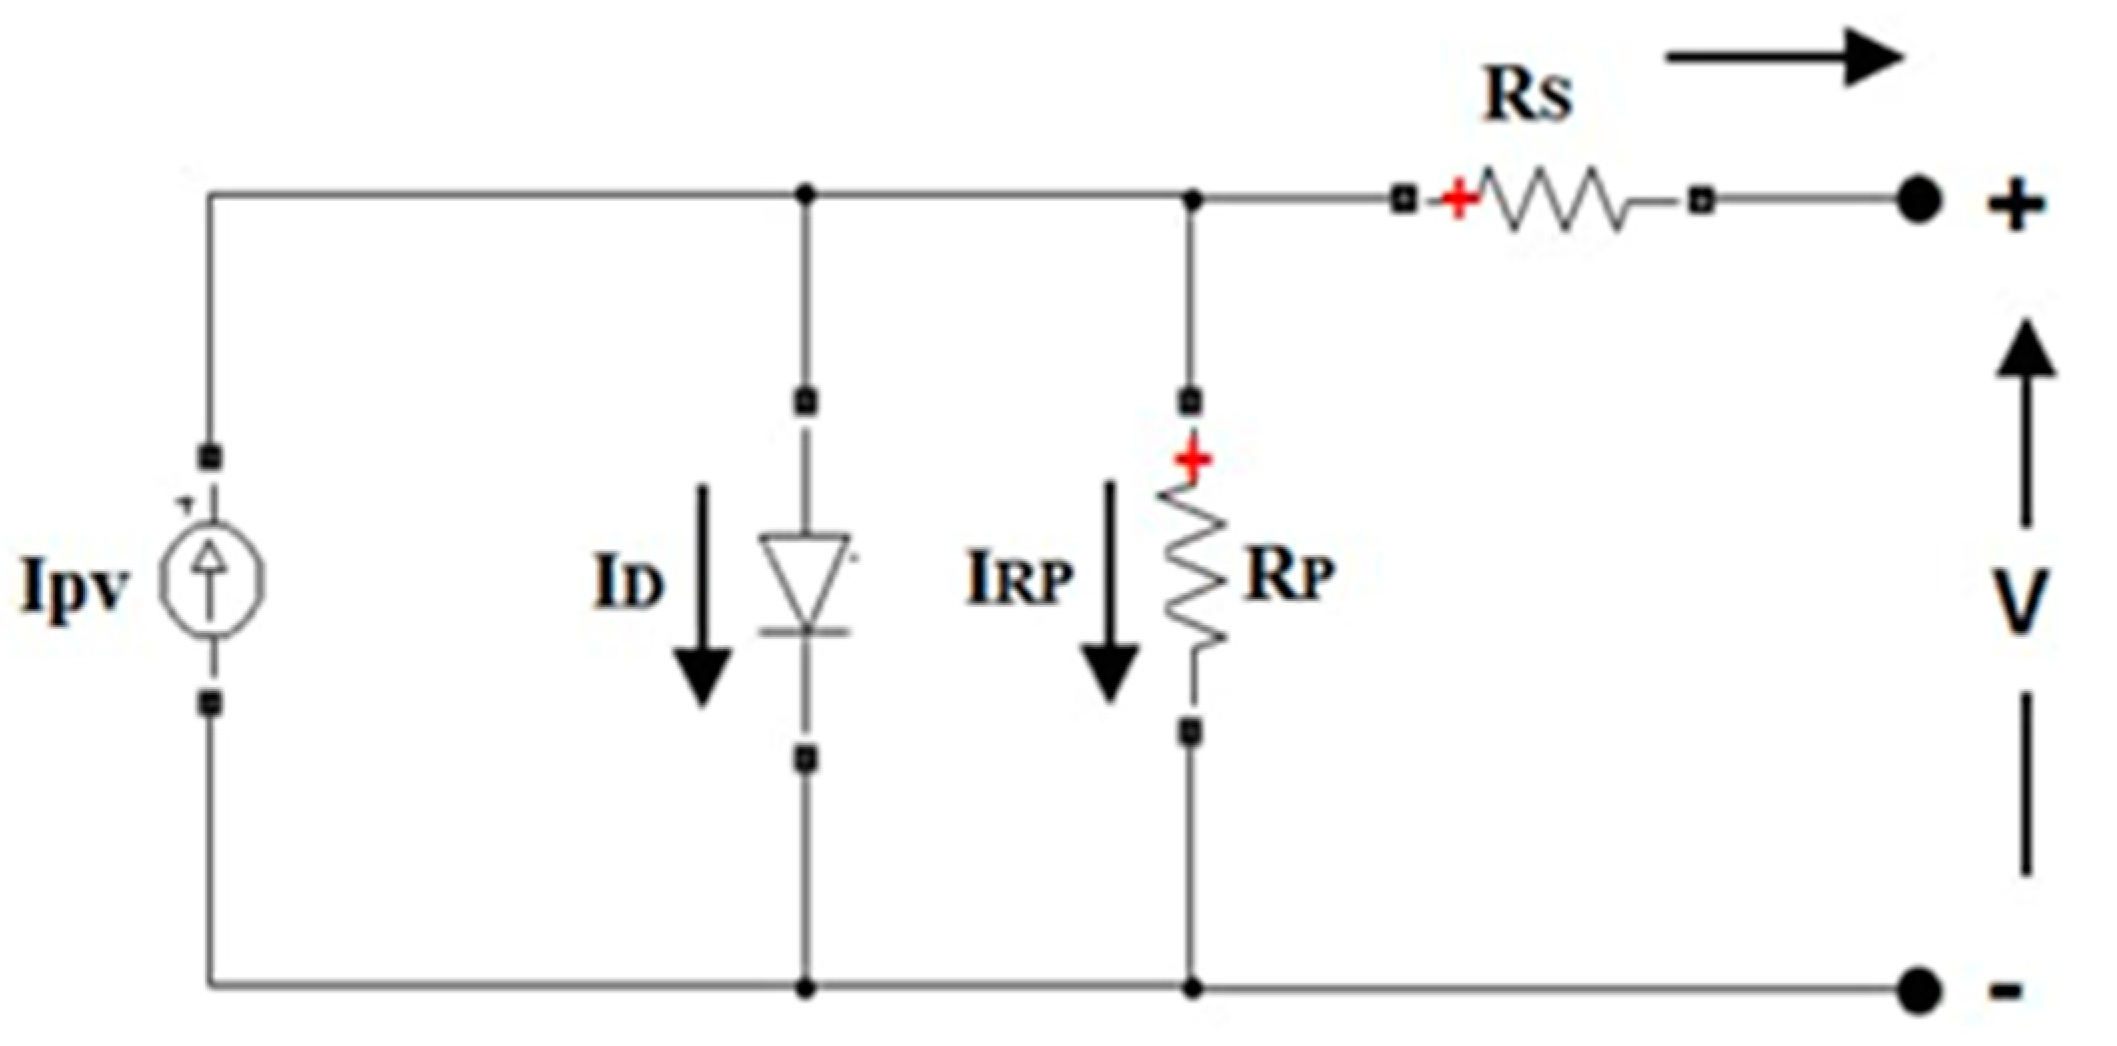
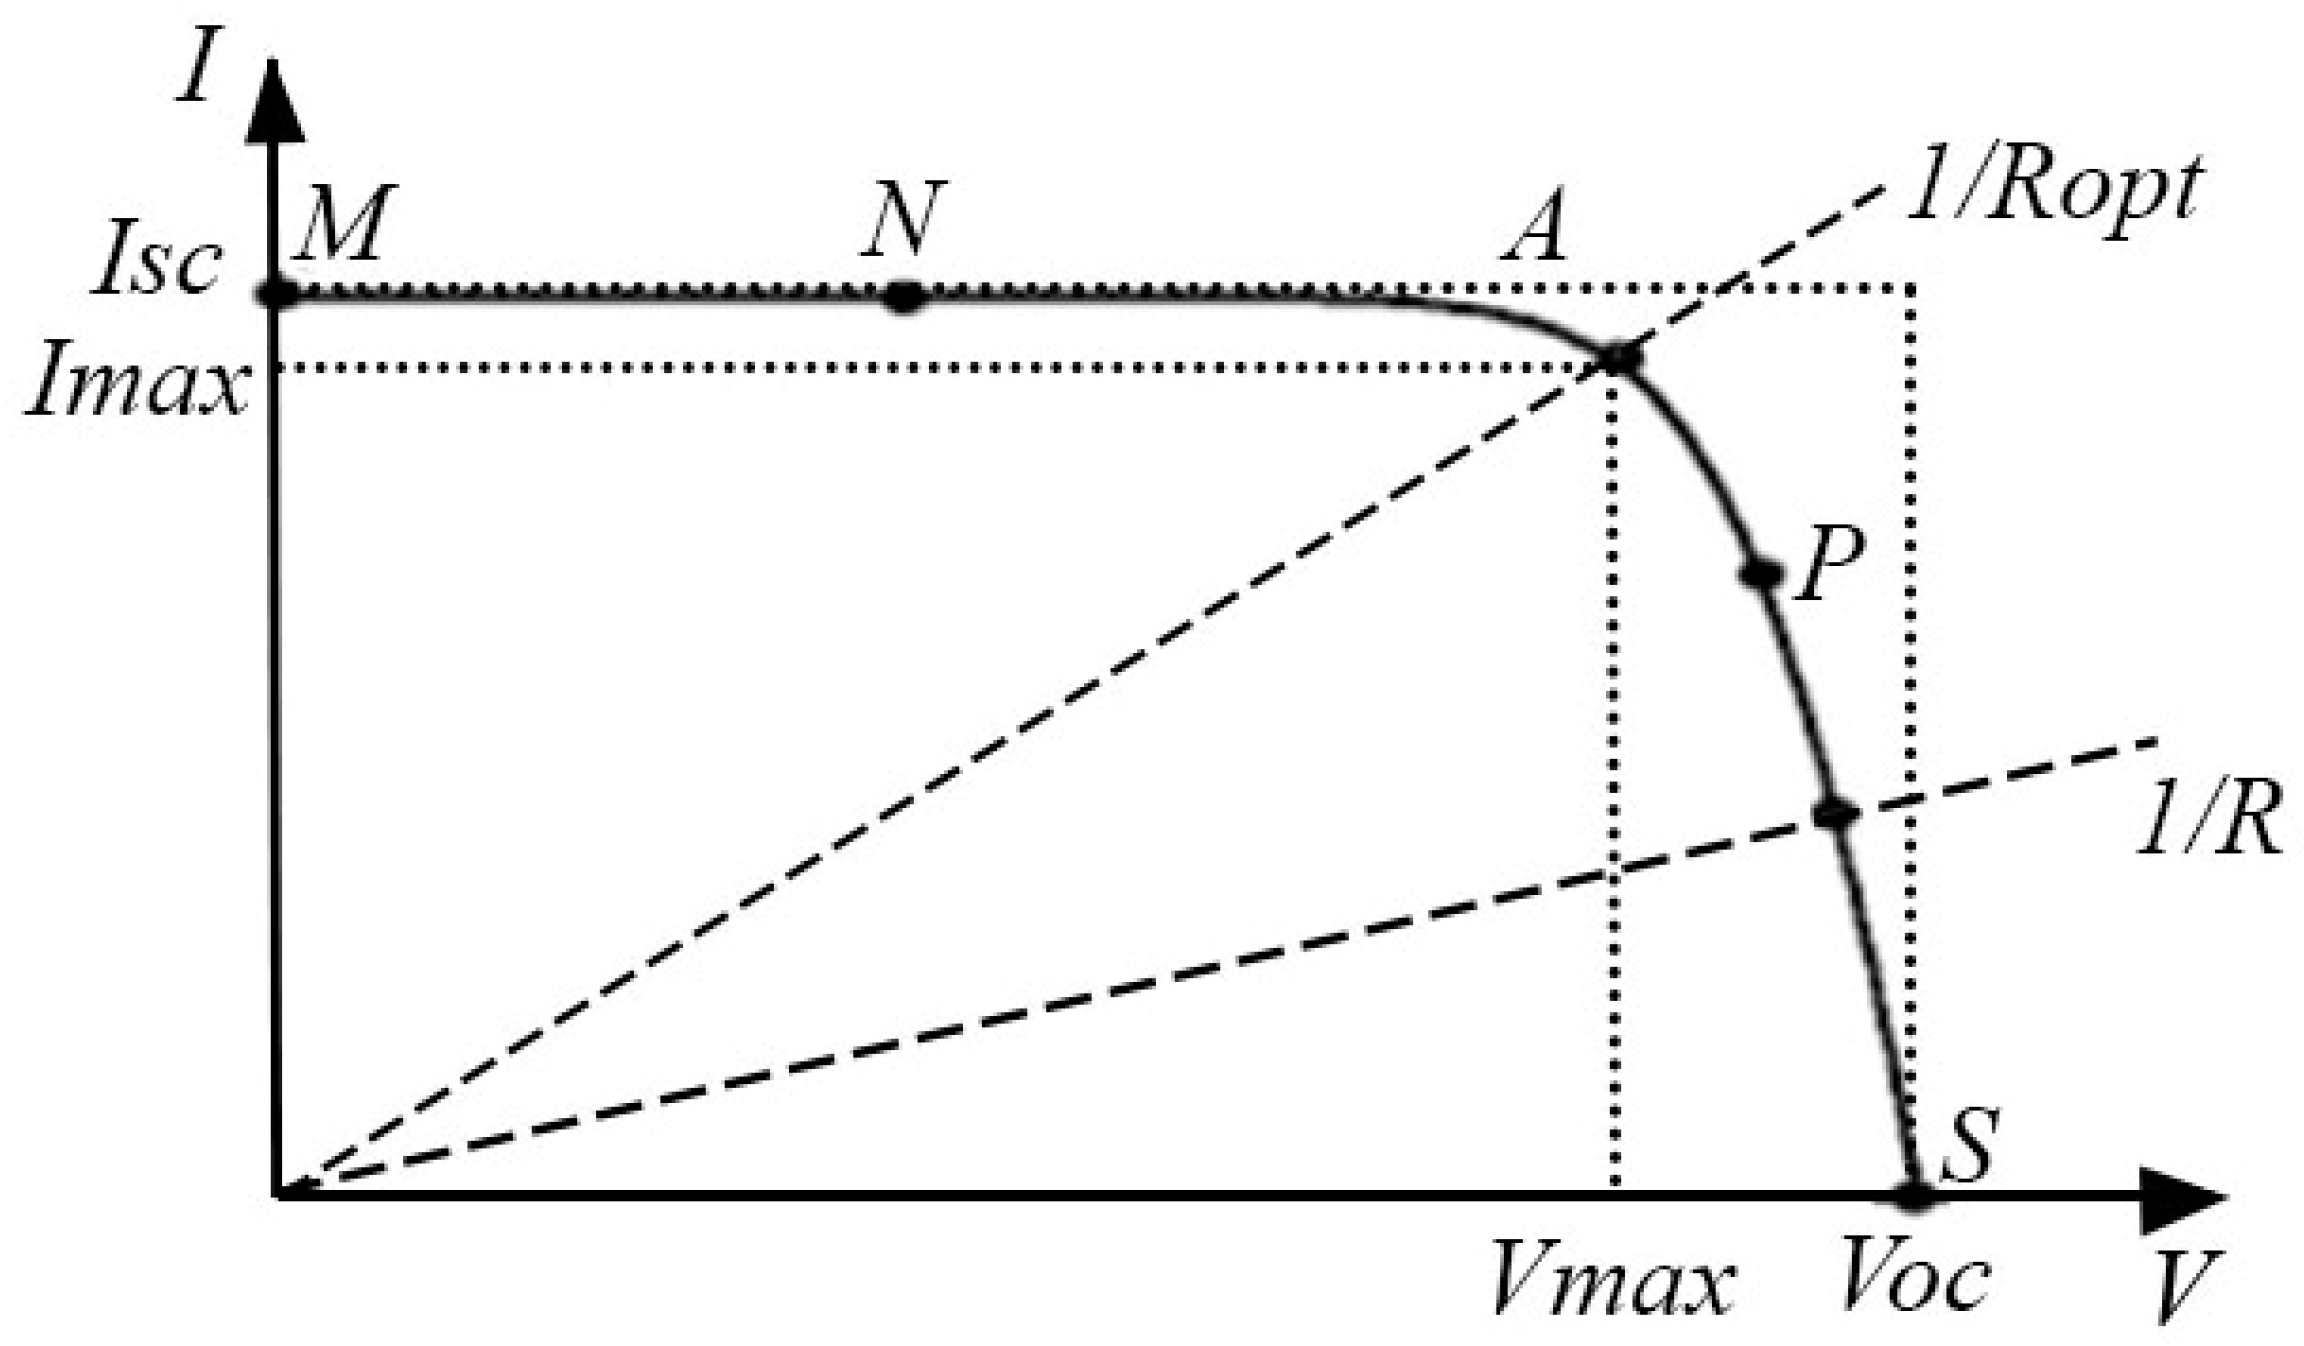
2.2. Modeling of Photovoltaic Cells

The power generated by the photovoltaic system can be expressed as follows [38,39,40]:
P P V ( i , t ) = η m · η e l e c · A m · G t ( i , t ) · ( 1 β t ( T c ( i , t ) T r ) )
Cell temperature is obtained from the following equation:
T c ( i , t ) = T a ( i , t ) + G t ( i , t ) · ( N O C T 20 800 )
The energy generated by the photovoltaic system is as follows:
E P V ( i , t ) = P P V ( i , t ) · Δ t
Radiation intensity and temperature are factors that have a direct effect on the output power of solar cells. Monocrystalline solar cells, for example, are able to convert only 25 percent of the sun’s energy into electricity. This phenomenon is due to lack of energy in sunlight. Photons that have more energy than the energy gap band can convert their energy into electricity.

2.3. On-Grid Photovoltaic System Modeling

To determine the amount of power generated by the photovoltaic system, after determining the type of solar module and electric inverter, the photovoltaic system was modelled. In this research, a single PV diode model was used for photovoltaic modelling. Figure 3 shows the electrical model of the PV module.
According to the above figure, the PV output current can be calculated as Equation (4): [16,17,18,19,20,21]
I = I p v I o × [ e x p ( V + I R s α × N s × V t ) 1 ] V + I R s R p
Vt is also the thermal voltage and is obtained as follows:
V t = K × T q
The purpose of PV module modeling is to determine five parameters of ideal coefficient ( ), module current (IPV), reverse saturation current (Io), series resistance (Rs), and parallel resistance (Rp). A simple I–V curve for a solar cell is shown in Figure 4. For a resistive load, the load profile is a straight line with a slope. Therefore, it can be said that the delivered power to the load depends only on the amount of resistance. Nonetheless, if the value of resistance R is small, the cell will operate in the M–N range specified in the curve in Figure 4. In this case, the cell acts as a constant current source, which is often equal to the short-circuit current. On the other hand, if the value of resistor R is large, the cell will operate in the P–S range specified in Figure 4, in which case the cell acts as a constant voltage source, often equal to the open circuit voltage.
Therefore, to examine the single-diode model of the photovoltaic module, the following two modes can be considered:
1-For short circuit conditions at temperature T ( I = I s c ( T ) , V = 0 ): [21]
I s c ( T ) = R p R s + R p × [ I p v I o ( e x p ( I s c ( T ) × R s α × N s × V t ( T ) ) 1 ) ]
2-For open circuit conditions ( I = 0 , V = V o c ( T ) ):
V o c ( T ) = R p × [ I p v I o ( e x p ( V o c ( T ) α × N s × V t ( T ) ) 1 ) ]
By placing I = I m p ( T ) and V = V m p ( T ) in Equation (4), the maximum power for a given temperature T can be calculated as follows:
P m p ( T ) = R p × V m p ( T ) R s + R p × [ I p v I o ( e x p ( V m p ( T ) + I m p ( T ) R s α × N s × V t ( T ) ) 1 ) V m p ( T ) R p ]
The relationship between the effect of solar radiation intensity (G) and operating temperature (T) on Ipv can be expressed as follows:
I p v ( G , T ) = G G n × ( I p v , n + K I s c Δ T )
According to Figure 4, the maximum power is in point A   and can be calculated as follows:
P m a x = V m a x × I m a x
In addition, the maximum efficiency is the ratio of the maximum power to the radiant optical power:
A = P m a x P i n = V m a x × I m a x A × G
Figure 5 shows the arrangement of photovoltaic cells in relation to different modules.

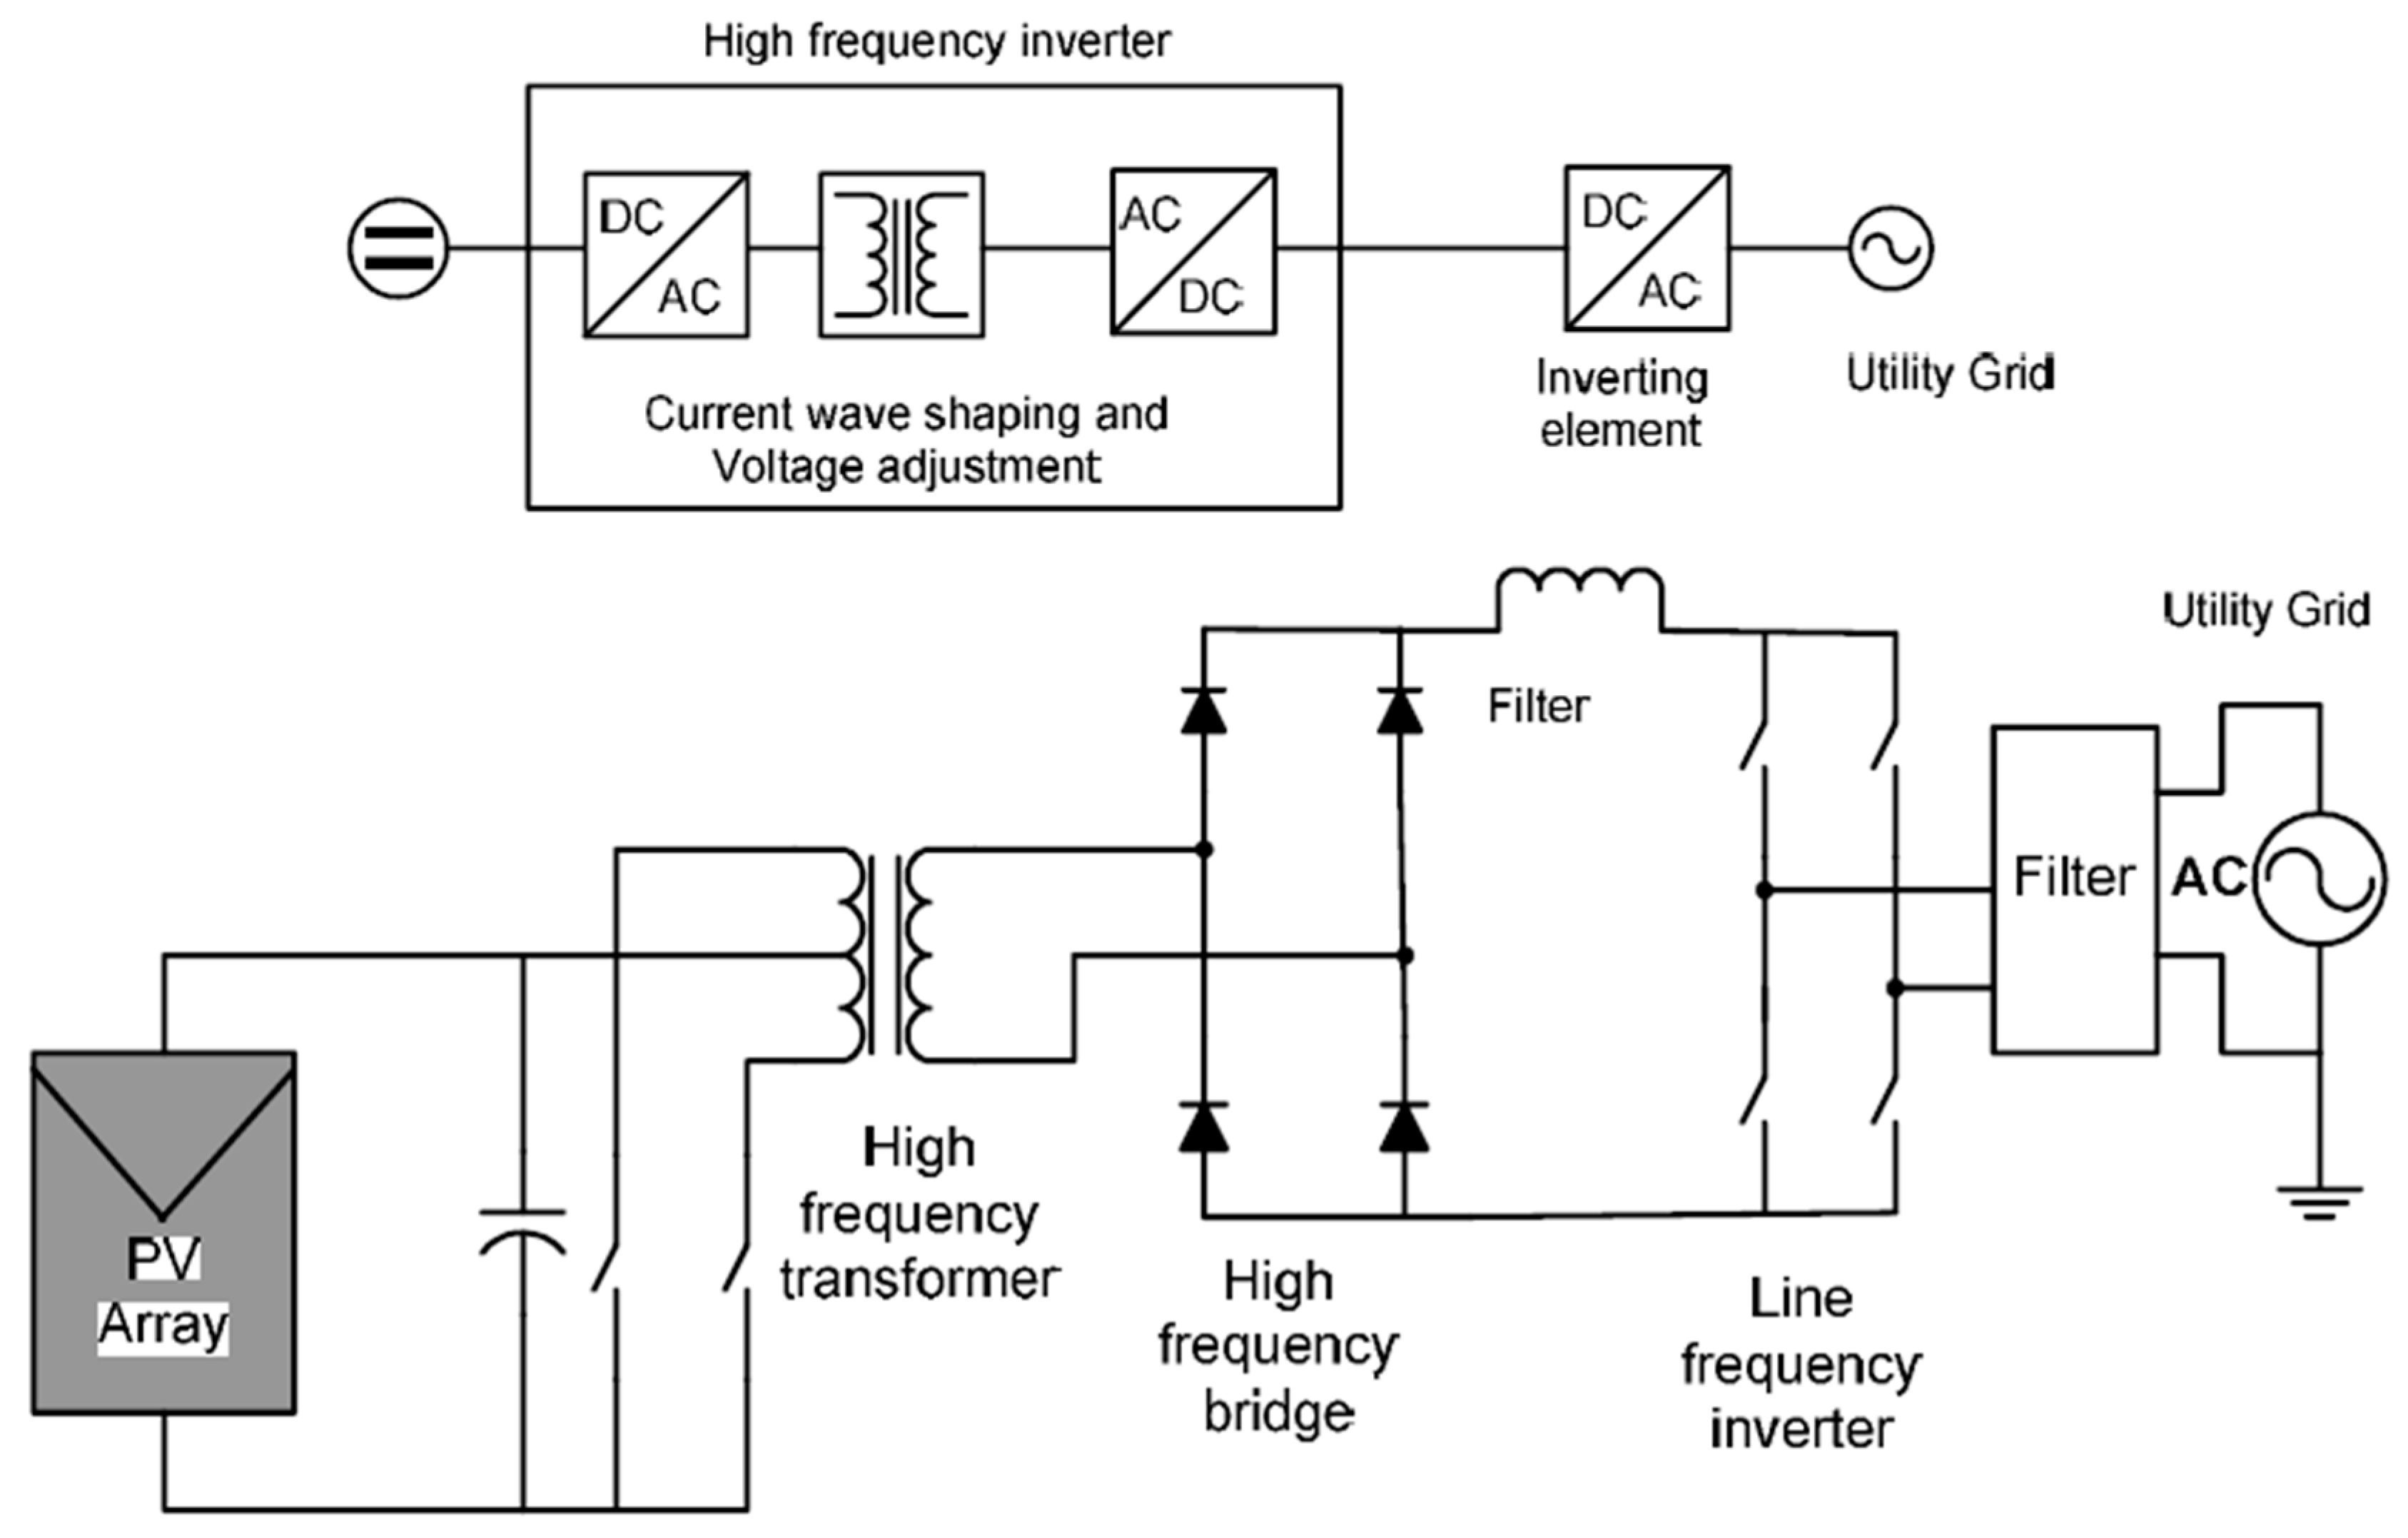
2.4. DC/AC Converter (Inverter)

Electricity generated by solar panels is DC and is converted to AC power with the help of inverters. Inverters are made in different types and sizes, and some of them have very high efficiency [5]. One of the main components of on-grid photovoltaic systems are inverters that convert the DC power generated by solar cells to AC in proportion to the voltage and frequency of the grid and automatically shuts off power when not needed. In the application of on-grid photovoltaic systems, the inverter has the following tasks: converting the current waveform to sinusoidal current, converting DC current to AC current, and increasing the voltage of PV arrays if they are less than the grid voltage. An on-grid photovoltaic system requires an on-grid inverter. Figure 6 shows a simple block diagram of an on-grid inverter.
There are a number of different structures, in each of which the inverters have different connections to the photovoltaic system. Each of these structures has advantages and disadvantages, and the choice of each depends on the application of the photovoltaic system.

2.5. Suitable Conditions for Installation and Setting up of Photovoltaic Systems

The efficiency of photovoltaic panels depends on the orientation, location, and weather conditions. Number of cloudy days, wind speed to determine the strength of a metal or building structure, rainfall and snow height to determine the height of solar panels from the ground, the amount of sultry or steamy air, and the amount of lightning and thunder to provide appropriate safety equipment are some of the factors that should be considered when installing photovoltaic systems. They are very important to install PV panels to provide maximum efficiency. For fixed panels, the southern direction in the northern hemisphere is the best direction for collecting solar radiation compared to tracking panels that track maximum solar radiation. Fifteen degrees to the west or east will not have much effect on the efficiency of solar panels. In addition, the angle of deflection of the panel is also an important factor in the design of solar systems. The deflection angle is the angle that solar panels make with the horizon and varies from 0 to 90 degrees. Due to the deviation of the earth’s axis, the angle of the sun’s radiation changes throughout the year, so the angles of deflection are different in winter and summer. In summer, the deflection angle is usually between 10 to 15 degrees less than latitude, and in all seasons, the deviation angle is about 10 to 15 degrees higher than the latitude of the target area. Snowfall is also effective in the amount of optimal deflection angle. In order to prevent the accumulation of snow on the solar panels, the angle of deviation is usually considered to be about 60 degrees [40,41,42].
In investigating the temporal position of the installation site and its conditions in relation to the movement of the sun, the possibility of the shadow of the surrounding heights and mountains or even the shadow of buildings and trees and determining the hours of the day that the presence of these shadows may prevent direct sunlight to solar panels is investigated. Therefore, we tried not to overshadow not only the solar panels on each other but also other buildings and natural obstacles on the solar panels. For houses with a chimney, the installation location of the arrays should be as far away as possible from the shadow of the chimney as well as the soot particles coming out of the chimney. The longitude and latitude as well as the height of the installation site of solar systems are necessary factors to calculate the radiant power of sunlight. Usually 80 to 85% of sunlight (1000 W/m) is received on sunny days, and this amount is higher in the highlands and desert areas. Depending on the size of the PV arrays on site, arrays may be installed on rooftops or floors. The arrays installed on the buildings are designed to withstand wind speeds of 175 km/h. In order to install PV panels on the ground, concrete bases are used to hold them in place. The installation height of the array from the ground should be higher than the maximum height of snowfall in the area. In the case of small systems (one or two PV arrays), solar panels can be installed on towers to keep them away from surrounding shading sources, including trees and buildings.

2.6. CPSO Algorithm

In recent years, many improved methods have been introduced. In comparative particle swarm optimization (CPSO), the compression coefficient enters the velocity equation, which reduces the particle motion, which ensures the convergence of the algorithm [43]. The original PSO equation can be represented by variations. Therefore, the new method (CPSO) will have these strategies:
  • Proper convergence of the system.
  • The system can examine different areas and prevent premature convergence.
To ensure the convergence of the PSO algorithm, the CPSO speed can be expressed as follows [44,45]:
v i + 1 ( j ) = x · ( v i ( j ) + C 1 r 1 , i ( j ) · ( p b e s t ( j ) x i ( j ) ) + C 2 r 2 , i ( j ) · ( g b e s t ( j ) x i ( j ) )
x = 2 | 2 C C 2 4 · C |
C = C 1 + C 2 ,     C > 4
The convergence profile of the system can be controlled with C. In CPSO, the value of C must be greater than 4 to ensure stability. As C increases, the compression ratio x decreases, and the variation in values decreases and results in a slower response. For example, when the compression ratio is used, C is 4.1 (for example, c1, c2 = 2.05) and the value of x is 0.729. CPSO causes individual convergences during simulation. Unlike other evolutionary calculations, CPSO ensures the convergence of the algorithm using mathematical principles. Therefore, CPSO guarantees a higher quality solution than the simple PSO method. Since the objective function used has several variables, and on the one hand, due to the fact that the constraints are nonlinear, doing this with other algorithms will cost more. On the other hand, to minimize costs using genetic algorithms and PSO, we will have to change the coefficients used, which due to the high dependence of these algorithms on changing variables, will often cause divergence in them. Figure 7 shows the block diagram of this method of optimization.

2.7. Cost Minimization Process Function

In the proposed method, the variables used in the optimization are N1, N2, and β, which are the best number of PV panels, the best number of DC/AC inverters, and the best placement of the modules in the area, respectively. They were calculated using the best values of the three variables mentioned. The objective function that is minimized during the optimization process is equal to the system cost function.
m i n { f ( x ) } = m i n { C c ( x ) + C m ( x ) }
The total net profit earned during system operation is related to the amount of energy produced by the PV modules and the price at which they sell the energy generated to the grid. The capital investment is calculated as follows:
C c ( x ) = ( 1 S 100 ) ( N 1 C P V + N 2 C I N V + C L + C B )
The cost of land required for PV installation is obtained as follows:
C L = D 1 + D 2 · C 1
The present value of the maintenance cost during the operation of the system is obtained by the Equation (18).
C m ( x ) = ( N 1 · M P V + N d c M I N V ) · ( l + g ) · [ 1 ( 1 + g 1 + i ) n i g ] + R T C
RTC ($) is equal to the present value of the total cost of repairing DC/AC inverters for grid photovoltaic systems, calculated as follows:
R T C = N d c · R c o s t · [ j = k * 1 + g j 1 + j j ]
The value of k* depends on the number of times of repairs during the life of the system, Nr, which is calculated by:
N r = n · 24.365 M T B F
The total profit from the sale of energy from the photovoltaic system to the public grid, PE ($), is calculated as follows:
P E = ( 1 t a x / 100 ) · C o · N 1 · E t o t · ( 1 ( 1 1 + i ) n ) i
E t o t = η I N V · η M P P T · d = 1 365 P M d ( d , B ) 1000 W / K W · Δ t
E = N 1 · E t o t
The simulation timestep is set to Δt = 1 day. Total profit from PV system is obtained from the following equation:
N P V = P E min ( C c + C m )
The optimization constraints are as follows:
N 1 L N 1 N 1 u
N 2 L N 2 N 2 u
β L β β u
(N1, N2, β) constraints = Satisfied
β L , N 2 L , N 1 L is the lower limit, and β u , N 2 u , N 1 u is the upper limit of the optimization variables, and the values of (N1, N2, β) are the system design constraints, shown in the previous sections. The lower limit of constraints is equal to:
N 2 L = N 1 L = β L = 0
The maximum slope angle is β u = 90°, so the upper limit of the other two variables, N 2 u , N 1 u , will be entered as input by the system designer.

3. Results

The simulation results for all combinations are obtained by considering the value of zero for the amount of financial aids and taxes (S, tax = 0). The cost of metal rods is 33 $/m, and the foundation cost is 230 $/m3. The wall size of concrete foundations is considered to be hw = 0.25 m and tw = 0.3 m. Annual inflation rate is 6%, annual nominal discount rate is 8%, electricity sales price to the grid (C0) is 0.11 $/kWh, and system lifetime is 25 years. The upper limit of the variables N1, N2, are considered as N1u = 2000 and N2u = 100, while the available land is DIM1 = 10 m (southern part) and DIM2 = 100 m (western part). The simulation results for different combinations of module and inverter for state C1=0 $/m2 are shown in Table 4, Table 5 and Table 6.
Among the obtained results, combination 2 is the best answer and has the highest profit, which consists of modules type 1 and inverters type 2. It can be concluded that the best solution for an on-grid photovoltaic system is obtained when modules and inverters are used with higher nominal power. The inverter conversion factor should also be higher.
Details of the optimal combination of on-grid photovoltaic system components for all combinations are shown in Table 5. For the optimal case (combination 2), the space occupied for the installation of the desired system is 86.2% of the total available area. There is also a distance of 3.48 m between the panels to prevent any mutual shading. PV modules are evenly distributed among 15 DC/AC inverters in 36 modules (18 in 2).
The economic results of the system are shown in Table 6 under mentioned conditions. In combination 2, which is the best-case scenario, the total installation cost is 35.8%, and the maintenance cost is 6.3% of the money obtained by selling of electricity to the power grid. As can be seen, the money earned by selling of electricity to the power grid is not the highest amount in combination 2, but due to the fact that the cost of equipment in this case is the lowest amount compared to other cases, it causes the highest profit. This value is obtained according to the amount of energy produced by PV modules. The value of E (kWh), which is the total electricity generated by the on-grid photovoltaic system, is shown in Figure 8 for all days of the year. As can be seen in the figure, the maximum power generation at a suitable radiation intensity is about 785 kWh. By obtaining the total daily generated energy, its annual value is obtained, for which, in 25 years of system operation, the total amount of generated energy by the on-grid photovoltaic system is equal to 191,430 kWh.
Figure 9 shows the convergence process of the CPSO algorithm to obtain the optimal value that is the lowest value of total initial and maintenance cost (($)42,7927). The algorithm in MATLAB software performed the desired optimization with an initial population of 60 and 200 iterations. Unlike other methods that diverge under the influence of various parameters or output at higher iterations, this algorithm has high speed and accuracy in convergence.
Figure 10 shows the convergence of the ACO algorithm to find the lowest cost. Comparing the answers obtained from the CPSO and ACO algorithms, it can be seen that the algorithm used in this research is less costly, and convergence in this method also occurs in lower iterations, as shown in Table 7.

4. Conclusions

Solar-power-generation technologies are currently making promising progress, and it can be expected that in the near future, with the development of new technologies in this field and the continuous reduction of generation prices with these methods, solar power plants will have an acceptable share of the total electricity generation required by the world. The construction of solar power plants is a good choice for the long-term goals of electricity supply, taking into account environmental issues. Therefore, in this paper, photovoltaic cell modeling was performed with the aim of reducing investment costs and increasing efficiency.
According to the results obtained from the optimal measurement of the on-grid photovoltaic system in Table 3, Table 4 and Table 5, it can be concluded that the total gain obtained during system operation is influenced by factors such as the type of module and inverter used in the system, arrangement of modules in the area for installation, the distribution of PV modules among inverters, and the slope angle of PV modules, which also affect the amount of generated energy and the cost of the structure of the supports. According to the results obtained in this research, the combination of the photovoltaic module type one and inverter type two is the best case for energy production.
Future works:
The research conducted in this work has been on the control section of these resources, and the following items can be analyzed in future works:
  • Compare on-grid mode with off-grid mode,
  • Calculate the cost of producing each unit of energy from this system,
  • Add another renewable source as a complement to this system, and
  • Use other optimization algorithms and compare with the current research.

Author Contributions

R.A.: Formal analysis, Investigation, Methodology. M.M.: Methodology, Writing. S.R.S.: Methodology, Writing—review & editing. M.H.A. and M.S.: Formal analysis, Investigation, Methodology Validation, Reviewing, editing. All authors have read and agreed to the published version of the manuscript.

Funding

This research received no external funding.

Institutional Review Board Statement

Not applicable.

Informed Consent Statement

Not applicable.

Data Availability Statement

All necessary data are provided in the manuscript.

Conflicts of Interest

There is no conflict of interest.

Nomenclature

RESrenewable energy systems
PVphotovoltaic
CPSOcomparative particle swarm optimization
NPVtotal profit from PV system ($)
VOC,STCopen-circuit voltage under STC (V)
ISC,STCPV module short-circuit current under STC (A)
VMPmaximum power point voltage (V)
IMPmaximum power point current (A)
Pratedrated power of PV panel (W)
NCOTnominal operating cell temperature
Amtotal area of photovoltaic panels
ηmmodule efficiency
ηelecelectrical inverter efficiency
Tris the reference temperature of the photovoltaic cell
βtthe thermal coefficient
Gtthe total solar radiation (W/m2)
Taambient temperature
EPVenergy generated by the PV
Iothe diode saturation current
αthe ideal coefficient
Nsare also the number of series cells
Vtthe thermal voltage
Tthe temperature of the PV module
qelectron charge (1.60217646 × 10⁻¹⁹)
KBoltzmann constant (1.3806503 × 10⁻²³ J/K)
Gsolar radiation
I p v , n the current of PV under standard test conditions (STC)
G n intensity of solar radiation under standard test conditions (STC)
Athe area of the solar panel
N1best number of PV panels
N2best number of DC/AC inverters
βbest placement of the modules in the area
Cc(x)the total capital investment ($)
Cm(x)the maintenance cost ($)
Spercentage of financial aid
CPVcapital investment of the PV modules ($)
Cinvcapital investment of the inverter ($)
CLthe cost of land required for PV installation ($)
CBcost of structure ($)
Clland price in terms of ($/m2)
D1 land dimension (southern part)
D2land dimension (western part)
MPVannual maintenance cost of each unit of PV modules ($/year)
MINTannual maintenance cost of each unit of inverters ($/year)
gannual inflation rate (%)
ithe annual discount rate (%)
k*the number of years the DC/AC inverter needs to be repaired
Rcosthe cost of repairing each inverter ($)
MTBFthe average time between inverter failures (h)
taxthe amount of tax for profit, energy sales price (%)
Etotthe total energy generated by each PV module in one year (kWh)
Ethe total energy generated by PV modules in one year (kWh)
ηINVis the DC/AC inverter efficiency
ηMPPTefficiency maximum power point tracker
npayback period

References

  1. Alayi, R.; Ahmadi, M.H.; Visei, A.R.; Sharma, S.; Najafi, A. Technical and environmental analysis of photovoltaic and solar water heater cogeneration system: A case study of Saveh City. Int. J. Low-Carbon Technol. 2021, 16, 447–453. [Google Scholar] [CrossRef]
  2. Roshani, M.; Phan, G.; Roshani, G.H.; Hanus, R.; Nazemi, B.; Corniani, E.; Nazemi, E. Combination of X-ray tube and GMDH neural network as a nondestructive and potential technique for measuring characteristics of gas-oil–water three phase flows. Measurement 2021, 168, 108427. [Google Scholar] [CrossRef]
  3. Patmal, M.H.; Shiran, H. Public awareness and their attitudes toward adopting renewable energy technologies in Afghanistan. Int. J. Innov. Res. Sci. Stud. 2021, 4, 82–91. [Google Scholar] [CrossRef]
  4. Moayedi, H.; Amir, M. Double-Target Based Neural Networks in Predicting Energy Consumption in Residential Buildings. Energies 2021, 14, 1331. [Google Scholar] [CrossRef]
  5. Khayatnezhad, M.; Nasehi, F. Industrial pesticides and a methods assessment for the reduction of associated risks: A Review. Adv. Life Sci. 2021, 8, 202–210. [Google Scholar]
  6. Hsu, C.C.; Zhang, Y.; Ch, P.; Aqdas, R.; Chupradit, S.; Nawaz, A. A step towards sustainable environment in China: The role of eco-innovation renewable energy and environmental taxes. J. Environ. Manag. 2021, 299, 113609. [Google Scholar] [CrossRef]
  7. Sibuea, M.B.; Sibuea, S.R.; Pratama, I. The impact of renewable energy and economic development on environmental quality of ASEAN countries. AgBioForum 2021, 23, 12–21. [Google Scholar]
  8. Zhang, X.; Tang, Y.; Zhang, F.; Lee, C. A Novel Aluminum-Graphite Dual-Ion Battery. Adv. Energy Mater. 2016, 6, 1502588. [Google Scholar] [CrossRef] [Green Version]
  9. Tong, X.; Zhang, F.; Ji, B.; Sheng, M.; Tang, Y. Carbon-Coated Porous Aluminum Foil Anode for High-Rate, Long-Term Cycling Stability, and High Energy Density Dual-Ion Batteries. Adv. Mater. 2016, 28, 9979–9985. [Google Scholar] [CrossRef]
  10. Ji, B.; Zhang, F.; Song, X.; Tang, Y. A novel potassium-ion-based dual-ion battery. Adv. Mater. 2017, 29, 1700519. [Google Scholar] [CrossRef]
  11. Wang, M.; Jiang, C.; Zhang, S.; Song, X.; Tang, Y.; Cheng, H. Reversible calcium alloying enables a practical room-temperature rechargeable calcium-ion battery with a high discharge voltage. Nat. Chem. 2018, 10, 667–672. [Google Scholar] [CrossRef] [PubMed]
  12. Mu, S.; Liu, Q.; Kidkhunthod, P.; Zhou, X.; Wang, W.; Tang, Y. Molecular grafting towards high-fraction active nanodots implanted in N-doped carbon for sodium dual-ion batteries. Natl. Sci. Rev. 2020, 8, nwaa178. [Google Scholar] [CrossRef] [PubMed]
  13. Hu, J.; Ye, C.; Ding, Y.; Tang, J.; Liu, S. A Distributed MPC to Exploit Reactive Power V2G for Real-Time Voltage Regulation in Distribution Networks. IEEE Trans. Smart Grid 2021. [Google Scholar] [CrossRef]
  14. Erol, I.; Velioğlu, M.N. An investigation into sustainable supply chain management practices in a developing country. Int. J. eBus. eGov. Stud. 2019, 11, 104–118. [Google Scholar] [CrossRef]
  15. Al-Sharafi, A.; Sahin, A.Z.; Ayar, T.; Yilbas, B.S. Techno-economic analysis and optimization of solar and wind energy systems for power generation and hydrogen production in Saudi Arabia. Renew. Sustain. Energy Rev. 2017, 69, 33–49. [Google Scholar] [CrossRef]
  16. Sun, Q.; Lin, D.; Khayatnezhad, M.; Taghavi, M. Investigation of phosphoric acid fuel cell, linear Fresnel solar reflector and Organic Rankine Cycle polygeneration energy system in different climatic conditions. Process. Saf. Environ. Prot. 2021, 147, 993–1008. [Google Scholar] [CrossRef]
  17. Vasel-Be-Hagh, A.; Iakovidis, F. The effect of wind direction on the performance of solar PV plants. Energy Convers. Manag. 2017, 153, 455–461. [Google Scholar] [CrossRef]
  18. Mukisa, N.; Zamora, R.; Lie, T.T. Store-on grid scheme model for grid-tied solar photovoltaic systems for industrial sector application: Costs analysis. Sustain. Energy Technol. Assess. 2020, 41, 100797. [Google Scholar] [CrossRef]
  19. Kumar, N.M.; Yadav, S.K.; Chopra, S.S.; Bajpai, U.; Gupta, R.P.; Padmanaban, S.; Blaabjerg, F. Operational performance of on-grid solar photovoltaic system integrated into pre-fabricated portable cabin buildings in warm and temperate climates. Energy Sustain. Dev. 2020, 57, 109–118. [Google Scholar] [CrossRef]
  20. Mesloub, A.; Ghosh, A.; Touahmia, M.; Albaqawy, G.; Noaime, E.; Alsolami, B. Performance Analysis of Photovoltaic Integrated Shading Devices (PVSDs) and Semi-Transparent Photovoltaic (STPV) Devices Retrofitted to a Prototype Office Building in a Hot Desert Climate. Sustainability 2020, 12, 10145. [Google Scholar] [CrossRef]
  21. Alayi, R.; Jahanbin, F. Generation Management Analysis of a Stand-alone Photovoltaic System with Battery. Re-Newable Energy Res. Appl. 2020, 1, 205–209. [Google Scholar]
  22. Subramaniam, U.; Vavilapalli, S.; Padmanaban, S.; Blaabjerg, F.; Holm-Nielsen, J.B.; Almakhles, D. A Hybrid PV-Battery System for ON-Grid and OFF-Grid Applications—Controller-In-Loop Simulation Validation. Energies 2020, 13, 755. [Google Scholar] [CrossRef] [Green Version]
  23. Ozcan, H.G.; Varga, S.; Gunerhan, H.; Hepbasli, A. Numerical and experimental work to assess dynamic advanced exergy performance of an on-grid solar photovoltaic-air source heat pump-battery system. Energy Convers. Manag. 2021, 227, 113605. [Google Scholar] [CrossRef]
  24. Alayi, R.; Kumar, R.; Seydnouri, S.R.; Ahmadi, M.H.; Issakhov, A. Energy, environment and economic analyses of a parabolic trough concentrating photovoltaic/thermal system. Int. J. Low-Carbon Technol. 2021, 16, 570–576. [Google Scholar] [CrossRef]
  25. Mesloub, A.; Ghosh, A. Daylighting performance of light shelf photovoltaics (LSPV) for office buildings in hot desert-like regions. Appl. Sci. 2020, 10, 7959. [Google Scholar] [CrossRef]
  26. Seyednouri, S.R.; Islamic Azad University; Ebrahimian, H.; Jalili, A. Power Loss Reduction and Voltage Profile improvement by Photovoltaic Generation. Int. J. Eng. Trends Technol. 2015, 20, 192–196. [Google Scholar] [CrossRef]
  27. Almutairi, A.; Abo-Khalil, A.; Sayed, K.; Albagami, N. MPPT for a PV Grid-Connected System to Improve Efficiency under Partial Shading Conditions. Sustainability 2020, 12, 10310. [Google Scholar] [CrossRef]
  28. Altun, A.F.; Kilic, M. Design and performance evaluation based on economics and environmental impact of a PV-wind-diesel and battery standalone power system for various climates in Turkey. Renew. Energy 2020, 157, 424–443. [Google Scholar] [CrossRef]
  29. Riahi, A.; Ali, A.B.H.; Fadhel, A.; Guizani, A.; Balghouthi, M. Performance investigation of a concentrating photovoltaic thermal hybrid solar system combined with thermoelectric generators. Energy Convers. Manag. 2020, 205, 112377. [Google Scholar] [CrossRef]
  30. Micheli, L.; Fernández, E.F.; Aguilera, J.T.; Almonacid, F. Economics of seasonal photovoltaic soiling and cleaning optimization scenarios. Energy 2021, 215, 119018. [Google Scholar] [CrossRef]
  31. Mesloub, A.; Albaqawy, G.A.; Kandar, M.Z. The Optimum Performance of Building Integrated Photovoltaic (BIPV) Windows Under a Semi-Arid Climate in Algerian Office Buildings. Sustainability 2020, 12, 1654. [Google Scholar] [CrossRef] [Green Version]
  32. Akinsipe, O.C.; Moya, D.; Kaparaju, P. Design and economic analysis of off-grid solar PV system in Jos-Nigeria. J. Clean. Prod. 2021, 287, 125055. [Google Scholar] [CrossRef]
  33. Azerefegn, T.M.; Bhandari, R.; Ramayya, A.V. Techno-economic analysis of grid-integrated PV/wind systems for electricity reliability enhancement in Ethiopian industrial park. Sustain. Cities Soc. 2020, 53, 101915. [Google Scholar] [CrossRef]
  34. Khalili, H.; Arash, A.; Alayi, R. Simulation and economical optimization hybrid system PV and grid in Ardabil city. J. Curr. Res. Sci. 2015, 3, 83. [Google Scholar]
  35. Mahmoud, M.E.E.; Diab, A.A.Z.; Kotin, D.A. Simulation and Experimental Validation of Two-Diode Model of Photovoltaic (PV) Modules. In Proceedings of the 2018 XIV International Scientific-Technical Conference on Actual Problems of Electronics Instrument Engineering (APEIE), Novosibirsk, Russia, 2–6 October 2018; pp. 244–251. [Google Scholar]
  36. Gupta, A. A Work on Grid Connected Solar Photovoltaic System Using Particle Swarm Optimization Technique. Adv. Commun. Devices Netw. 2018, 462, 209–221. [Google Scholar]
  37. Yaqoob, S.J.; Obed, A.A. Modeling, Simulation and Implementation of PV System by Proteus Based on Two-diode Model. J. Tech. 2020, 1, 39–51. [Google Scholar] [CrossRef]
  38. Kefale, H.A.; Getie, E.M.; Eshetie, K.G. Optimal Design of Grid-Connected Solar Photovoltaic System Using Selective Particle Swarm Optimization. Int. J. Photoenergy 2021, 2021, 6632859. [Google Scholar] [CrossRef]
  39. Hassan, Q. Evaluation and optimization of off-grid and on-grid photovoltaic power system for typical household electrification. Renew. Energy 2021, 164, 375–390. [Google Scholar] [CrossRef]
  40. Santiago, I.; Trillo-Montero, D.; Moreno-Garcia, I.; Pallarés-López, V.; Luna-Rodríguez, J. Modeling of photovoltaic cell temperature losses: A review and a practice case in South Spain. Renew. Sustain. Energy Rev. 2018, 90, 70–89. [Google Scholar] [CrossRef]
  41. Motahhir, S.; Chalh, A.; El Ghzizal, A.; Sebti, E.G.; Derouich, A. Modeling of Photovoltaic Panel by using Proteus. J. Eng. Sci. Technol. Rev. 2017, 10, 8–13. [Google Scholar] [CrossRef]
  42. Sinha, S.; Chandel, S.S. Analysis of fixed tilt and sun tracking photovoltaic–micro wind based hybrid power systems. Energy Convers. Manag. 2016, 115, 265–275. [Google Scholar] [CrossRef]
  43. Kaldellis, J.; Zafirakis, D. Experimental investigation of the optimum photovoltaic panels’ tilt angle during the summer period. Energy 2012, 38, 305–314. [Google Scholar] [CrossRef]
  44. Ling, H.; Zhu, T.; He, W.; Luo, H.; Wang, Q.; Jiang, Y. Coverage Optimization of Sensors under Multiple Constraints Using the Improved PSO Algorithm. Math. Probl. Eng. 2020, 2020, 8820907. [Google Scholar] [CrossRef]
  45. Djanssou, D.M.; Dadjé, A.; Tom, A.; Djongyang, N. Improvement of the Dynamic Response of Robust Sliding Mode MPPT Controller-Based PSO Algorithm for PV Systems under Fast-Changing Atmospheric Conditions. Int. J. Photoenergy 2021, 2021, 6671133. [Google Scholar] [CrossRef]
Figure 1. Average daily radiation intensity.
Sustainability 13 12420 g001
Figure 2. Average daily temperature.
Sustainability 13 12420 g002
Figure 3. Electric model of a single diode PV cell.
Sustainability 13 12420 g003
Figure 4. I–V curve for a solar cell.
Sustainability 13 12420 g004
Figure 5. Arrangement of the string of PV modules in the existing area for installation.
Sustainability 13 12420 g005
Figure 6. Block diagram of an on-grid inverter.
Sustainability 13 12420 g006
Figure 7. Block diagram of CPSO optimization method.
Sustainability 13 12420 g007
Figure 8. Daily generation capacity of the on-grid photovoltaic system.
Sustainability 13 12420 g008
Figure 9. Convergence process of CPSO algorithm to get the lowest cost.
Sustainability 13 12420 g009
Figure 10. Convergence of ACO algorithm to get the lowest cost.
Sustainability 13 12420 g010
Table 1. Recent studies on modeling/optimization PV.
AlgorithmConnection ModePurposeAuthorsReference, Year
ModelingOff-gridTwo-diode model of photovoltaic (PV) moduleMahmoud et al.[35], 2018
PSOOn-gridMaximum accessible powerGupta[36], 2018
ModelingOff-gridTwo-diodes PV system model using Proteus softwareYaqoob and Obed[37], 2019
SPSOOn-gridSizing and siting of the solar photovoltaic systemKefale et al.[38], 2021
Optimal designOn/off gridEstablished optimal Off/On grid photovoltaic systems configurationsHassan[39], 2021
Table 2. Specifications of PV modules.
TypeVOCSTC (V)ISCSTC (A)VMPP (V)IMPP (A)Prated (W)NCOT (°C)CPV ($)MPV ($/Year)LPV1 (m)LPV1 (m)Life Time
129823.40.27170475155.151.290.9925
219.83.415.90.1550452022.021.220.32925
Table 3. Inverter specifications.
Type(%) ηINV(%) ηMPPTPmax (W)MTBF (h)CINV ($)MINV ($/Year)Vimin (V)Vimax (V)Rcost
194.41003000219,00014502515045014.5
295.31007000219,00030084533556030
Table 4. Results of optimal PV system for different combinations of module and inverter.
CombinationType of PV ModuleType of InverterN1N2β (°)NPV ($)n (y)IRR (%)
1115852125574,760619
2125401028584,9435.820
321825467549,5688.114
4226363622564,0697.517
Table 5. Details of the optimal combination of the components of the on-grid photovoltaic system.
CombinationNrowFy (m)N2NserminD1 (m)D2 (m)NsNp
145.8921729.0399.56151
273.4815724.0395.45182
3128.1746897.7689.81222
496.1414890.7695.94275
Table 6. The best economic results from the simulation.
TypeCc ($)Cm ($)PE ($)
1368,12271,0261,013,908
2363,25364,6741,012,870
3403,70364,5121,020,783
4374,77974,2151,013,063
Table 7. Optimal solutions for CPSO and ACO algorithms.
AlgorithmOptimal SolutionsIteration
CPSO($)427,92740
ACO($)445,530130
Publisher’s Note: MDPI stays neutral with regard to jurisdictional claims in published maps and institutional affiliations.

