Article

Soil Microbial and Nematode Community Response to the Field Application of Recycled Bio-Based Fertilisers in Irish Grassland

1
enviroCORE, Department of Science and Health, Institute of Technology Carlow, Kilkenny Road, R93 V960 Carlow, Ireland
2
Teagasc–Agriculture and Food Development Authority, Johnstown Castle, Y35 Y521 Wexford, Ireland
*
Author to whom correspondence should be addressed.
Sustainability 2021, 13(22), 12342; https://doi.org/10.3390/su132212342
Submission received: 24 September 2021 / Revised: 29 October 2021 / Accepted: 2 November 2021 / Published: 9 November 2021

Abstract

:
Phosphorus (P) is an essential plant nutrient routinely applied to soils as an agricultural fertiliser, frequently in non-renewable, inorganic forms. Finite reserves and growing demand for agricultural phosphorus mean alternative P resources need to be explored. Recycling-derived fertilisers (RDF) recovered from specific waste streams, using nutrient recovery technologies, have the potential to replace conventional phosphorus fertilisers used in agriculture. Healthy functioning soil microbial and nematode communities are essential players in maintaining soil health and nutrient status. Thus, it is important to assess the responses of these communities to RDF application. We compared soil microbial and nematode communities of conventional fertiliser and RDF treated soil, in the form of struvite and ash, using next-generation sequencing (NGS) technologies in a phosphate-fertiliser replacement value (P-FRV) field trial. Bacterial and nematode communities displayed significant changes under the different P fertilisation treatments, while fungal communities were relatively unaffected. Bacterial diversity was higher among RDF treatments than conventional treatments, while nematode diversity was reduced by one ash treatment. Available potassium and phosphate were the main drivers of bacterial community changes when analysed by canonical correspondence analysis (CCA), while available phosphate alone was the driver of nematode community shifts. Of the RDF, struvite products yielded the highest crop biomass, maintained microbial diversity and were associated with the least disturbed nematode communities.

1. Introduction

Phosphorus is an essential macro-nutrient required for plant growth, which is primarily sourced from non-renewable phosphate rock for use in agriculture. However, global mineral phosphate reserves are estimated to be depleted within the next 100 years due to increasing human population and food demand [1]. Meanwhile, the production of organic waste from agricultural, municipal, and industrial wastes, which are rich in phosphorus, is on the increase and is often discarded. Thus, in recent years, much research has been focused on the recovery of nutrients from these waste streams [2] in attempts to achieve sustainable agriculture, global food security, and to develop a more circular economy.
A healthy functioning soil ecosystem is central to the successful growth of agricultural crops. Soil microbial communities are often referred to as a functional “black box” [3]. Up to 10 billion microorganisms may be harboured in a single gram of soil belonging to thousands of different species, which form a complex network of trophic interactions [4]. The microbial component of soil is involved in a multitude of key processes, such as the decomposition of organic matter, recycling of nutrients, mineralisation, nitrogen fixation, maintaining soil quality and health, and enhancing soil structure [5]. Many of these beneficial microbes are sustained by consuming sugars, amino acids, organic acids, and flavonoids secreted by the roots of a plant growing in the soil [6]. It is estimated that 30% of all carbon fixed in photosynthesis in the leaves is voluntarily released into the root zone in order to sustain a healthy and diverse microbial population in the soil. In return, microbes can solubilise nutrients (e.g., phosphates and potassium) in the soil, converting them into forms that plants cannot access alone. Additionally, microbes help to protect against plant pathogens, produce hormones that encourage growth, stimulate the plant immune system and enhance stress responses [7]. For these reasons, it is essential that fertilisers derived from recycled materials have no adverse effects on the diversity or abundance of the microorganisms, allowing such functions to be maintained.
Soil microbial diversity is an indicator of soil health [8]. Loss of soil microbial diversity poses a major threat, as it is associated with the loss of essential ecosystem functions [9]. For example, experimental evidence shows that soil bacterial taxonomic diversity is critical to maintaining plant productivity [10]. Therefore, low microbial diversity in soil indicates stressful conditions, while high soil microbial diversity is indicative of healthy, productive soil [11]. Several parameters have been shown to influence the structure and composition of soil microbial communities, including soil properties such as pH, moisture, texture, compaction, as well as other factors such as climate, type of vegetation, land management, and nutrient availability [12]. In turn, variation in soil microbial community structure can influence and disrupt some of the vital ecosystem processes provided by soils [13]. Thus, measures of bacterial and fungal diversity and community structure were used in these analyses to study the ecological impact of recycling-derived fertilisers (RDF).
Nematodes are the most abundant and widespread animals in nature [14] and can be used as bioindicators of environmental change because of their presence in high abundance, feeding behaviours, and diversity [15]. Nematodes are assigned to a colonisers and persisters (C-P) scale according to their life strategies [16]. Colonising bacterial feeding nematodes, also known as enrichment opportunists, are assigned to the lowest c-p 1 scale. They reproduce and increase in numbers rapidly, especially during the addition of rich organic matter material into the soil environment, such as animal manure. The persisters contain species with larger individuals and are characterised by long life spans and low reproduction rates. These are assigned to c-p 4 and 5 scales, and they favour undisturbed habitats [17]. Pollutant tolerant nematodes, assigned to c-p scale 2, can accept moderate to extreme soil disturbance [16], while persisters, equipped with a permeable cuticle, move away from the source of contamination. Environmental disturbance causes a decrease in the number of persister nematode species and shifts towards dominance of colonising species [18]. The reduction in persisters, such as dorylaimids, is a sign of soil environmental disturbance.
Ecosystem functioning indices such as Channel Index (CI) or Enrichment Index (EI) are based on the proportion of the c-p values assigned to each nematode taxon at the family, genus, or species level. These indices were utilised to observe any detrimental changes that RDFs might have caused on nematode communities and provide insight into the complex soil food web interactions. Soil nutrient mineralisation depends on the nutrient source and may proceed via bacterial or fungal decomposition channels. Organic materials rich in cellulose and lignin are decomposed via the fungal decomposition channel. Organic materials which are moist and rich in N are decomposed via the bacterial decomposition channel [19]. The Channel Index was proposed by Ferris et al. [20] and provided information on the flow of nutrients either through bacterial (fast) or fungal (slow) decomposition channels, calculated from the weighted proportion of c-p 2 fungivore and c-p 1 bacterivore nematodes. A decrease in the CI and an increase in the EI suggest increased bacteria activity and a fast bacterial decomposition channel [20], while an increase in the CI would indicate a slow fungal decomposition pathway.
The literature available on soil microbial and nematode community responses to the application of struvite and ash fertilisers is very limited. For example, Bang-Andreasen et al. [21] investigated bacterial community response to wood ash application in forest soil, while Robles-Aguilar [22] studied the effect of struvite fertiliser as an N source on rhizosphere dynamics and cultivation of lupine. However, to our knowledge, there is no available literature on microbial or nematode community responses to struvite or ash produced from nutrient recovery technologies in an agricultural setting. In the work presented here, we hypothesised the occurrence of diversity and community shifts due to the differing physical and chemical properties of RDF compared to conventional P fertiliser. Our goal was to investigate any negative impacts or possible threats imposed by struvite and ash fertilisers to microbial and nematode communities and to conclude on the ecological safety of RDF utilisation.

2. Materials and Methods

2.1. Field Description and Experimental Design

The field trial was conducted at Teagasc, Johnstown Castle, County Wexford (52°17′46.9″ N 6°30′32.1″ W). This was a P deficient site (P index 1, 1–3 mg P L−1) with an initial average pH of 5.6. Lime was applied at 1.5 t/ha at the beginning of the experiment. The soil on the site was classified as a sandy loam. Perennial ryegrass (vars. AberGreen (40%), AberChoice (30%), and AberGain (30%)) was sown in September 2018, and the initial fertiliser application occurred 7 months later, in April 2019. N, K, and S were applied in the mineral form at the recommended dosages of 125 kg N/ha, 155 kg K/ha, and 20 kg S/ha. P was applied at a rate of 40 kg P/ha, in the form of conventional fertilisers or the RDF under test. Depending on the source, some P fertilisers also contained other nutrients. Therefore, application of P resulted in surplus of N, K, and S in some cases. Second and third applications of mineral fertilisers N, K, and S took place in May and July 2019, at dosages of 100 kg N/ha, 75 kg K/ha, and 20 kg S/ha. No further P was applied to ensure it was the only limiting nutrient. A full list of fertiliser treatments and their application rates are provided in Table S1.
A treatment with no fertiliser (no P, N, K, or S) applied (NF), and a no phosphate (N, K, and S applied, but no P) treatment (SP 0) served as negative controls. Mineral superphosphate (SP 40) was applied to one set of plots as a positive control. A cattle slurry and mineral superphosphate combination (CS) also served as a positive control, as this is commonly practiced in agriculture. RDF treatments included potato waste struvite (PWS), municipal waste struvite (MWS), poultry litter ash (PLA), and sewage sludge ash (SSA). The chemical compositions of RDFs are displayed in Table 1. Each treatment had five replicate plots, each 2 × 6 m in size.

2.2. Soil Sampling, Physiochemical Properties, and Preparation for DNA Extraction and Sequencing

Soil sampling was conducted 51 days after fertiliser application following cutting of grass silage (July 2019). Nine sample cores were taken to a depth of 10 cm per plot and stored at −20 °C until ready for analysis. A total of 40 composite samples were obtained (8 treatments X 5 replicate plots). Defrosted samples were sieved through a 2 mm mesh to homogenise them. For bacterial and fungal analysis, 0.25 g sub-samples were further processed immediately. For nematode analysis, 25 g sub-samples of soil were shaken in 25 mL of deionised water for 10 min at 95 rpm and centrifuged for 2 min at 3500 rpm. The supernatant was discarded, and the remaining material was dried overnight at 28 °C in Petri dishes before thoroughly homogenising again using a mortar and pestle. Finally, 0.25 g sub-samples were used for further processing.
Total DNA was extracted from 0.25 g soil sub-samples using the Qiagen DNeasy® PowerSoil® Pro kit, as per the manufacturer’s instructions. Total DNA quality and quantity were assessed by NanoDrop™ instrument and agarose gel electrophoresis using 1% agarose gels, before outsourcing to a sequencing company. Bacterial 16S V4-V5 region rRNA, fungal ITS1 region rRNA, and nematode 18S V4 region rRNA were sequenced using 515F and 907R [23,24], ITS5-1737F and ITS2-2043R [25], and MN18F and 22R [26] primer pairs, respectively, on Illumina paired-end platform.

2.3. Sequence Data Analysis

Sequencing data were processed and clustered into OTUs based on a 97% similarity threshold by the sequencing company. In QIIME2 (version 2020.11), taxonomy was assigned to bacterial and nematode OTUs using the SILVA (release 138 SSURef_NR99) database [27], and to fungal OTUs using UNITE (version 8.2) database [28]. Fungal data were filtered to remove OTUs, which did not belong to the fungal kingdom. For subsequent alpha and beta diversity analyses, OTU numbers were normalised using the sequence number corresponding to the sample with the least sequences as the standard.
Levels of bacterial and fungal diversity were assessed by Observed OTU, Simpson, and Chao1 alpha diversity indices and statistically compared by the Kruskal–Wallis H test. Beta diversity was measured by Weighted Unifrac distances followed by permutational multivariate analysis of variance (PERMANOVA) based on 999 Monte Carlo permutations. Statistical analyses of bacterial and fungal abundances and correlation analysis were performed in IBM SPSS Statistics for Windows, version 25. One-way ANOVA with Tukey’s Honest Significant Difference (HSD) pairwise comparisons were used to detect significant differences between treatment groups in the relative abundances of bacteria and fungi at specific taxon levels, and in soil physiochemical properties. Where data violated the homogeneity of variance or normality assumptions, the nonparametric Kruskal–Wallis H test was used. Pearson’s correlation was used to test for significant relationships between microbial abundance and diversity data with soil physiochemical properties and crop yield.
Significant differences in nematode diversity were assessed by Observed OTU and Shannon alpha diversity indices and compared using SPSS (Version 25.0 for Windows). The Shapiro–Wilk’s test was used to determine the data’s normal distribution and Levene’s Statistic to test the homogeneity of variances. The differences among the data groups were tested for significance using the Kruskal–Wallis nonparametric test and Tukey honestly significant difference (HSD), where the data appeared to be parametric. Differences between the nematode communities were detected via a nonparametric test Anosim (Analysis of Similarity) and MetaStat. The functional indices such as CI and EI were calculated via Nematode INdicator Joint Analysis (NINJA) [29]. An automated calculation system, was specifically created for nematode biomonitoring, based on the R code, suitable to perform faunal analysis.
In order to examine the interaction between the bacterial, fungal, and nematode community structures with environmental parameters, canonical correspondence analysis (CCA) was performed on the soil’s physiochemical characteristics. The CCA of soil properties was based on OTU presence/absence data and performed using R software (version 4.0.4). Heatmaps of bacterial and fungal phylum and genera abundances were also produced using R.

3. Results

3.1. Soil and Plant Properties

Results of soil physiochemical property measurements (Table 2) tested for differences of significance revealed only Morgan’s P and Morgan’s K to be significantly variable among the different fertilisation treatments. The unfertilised (NF) and no phosphate (SP0) negative control treatments had the lowest concentrations of soluble P, as expected. However, statistically, these were only significantly lower than the MWS treatment, which had the highest levels of soluble P. Soil soluble K concentrations were significantly higher in the CS treatment compared to all other treatments. Additionally, the PLA treatment had a significantly higher amount of soluble K compared to the unfertilised treatment (NF). The rest of the soil properties remained stable across the various treatments, displaying no differences of significance. Perennial ryegrass dry matter (DM) yield was significantly lower in the unfertilised treatment compared to all other treatments, with an average DM yield of 1.4 tons per hectare—less than half the yield of those treatments that received fertilisers. Uptake of phosphorus by plants was significantly lower in the unfertilised treatment than in those fertilised with P (i.e., all other treatments excluding SP 0, in which no P fertiliser was applied). More details of soil and plant properties which significantly differed between treatments can be found in Table S2.

3.2. Microbial Analysis

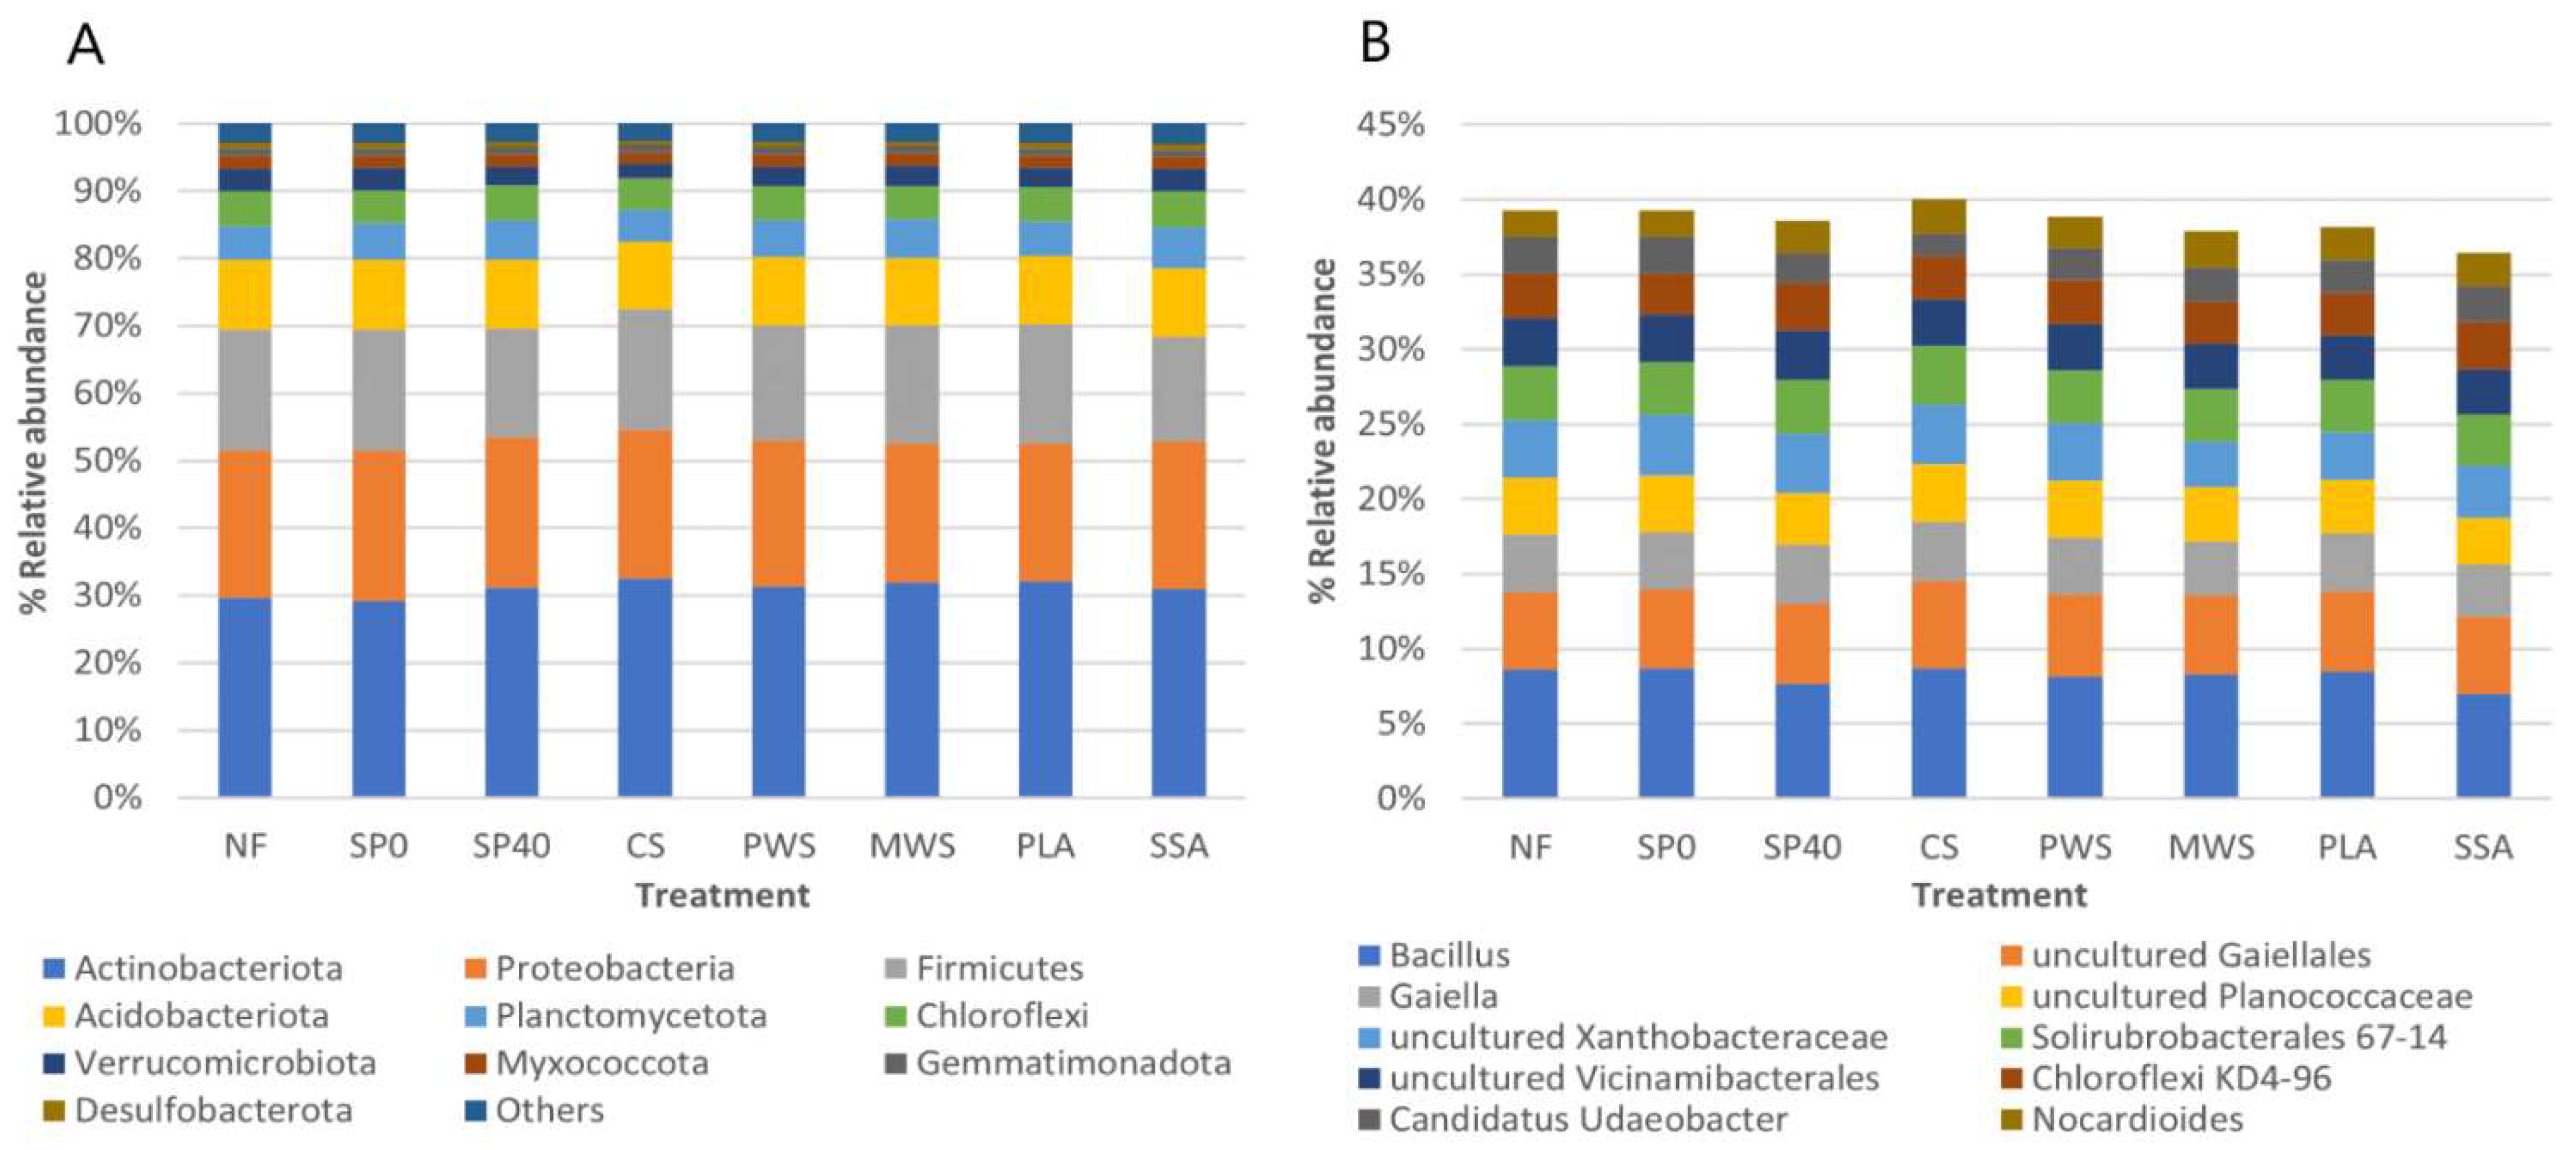
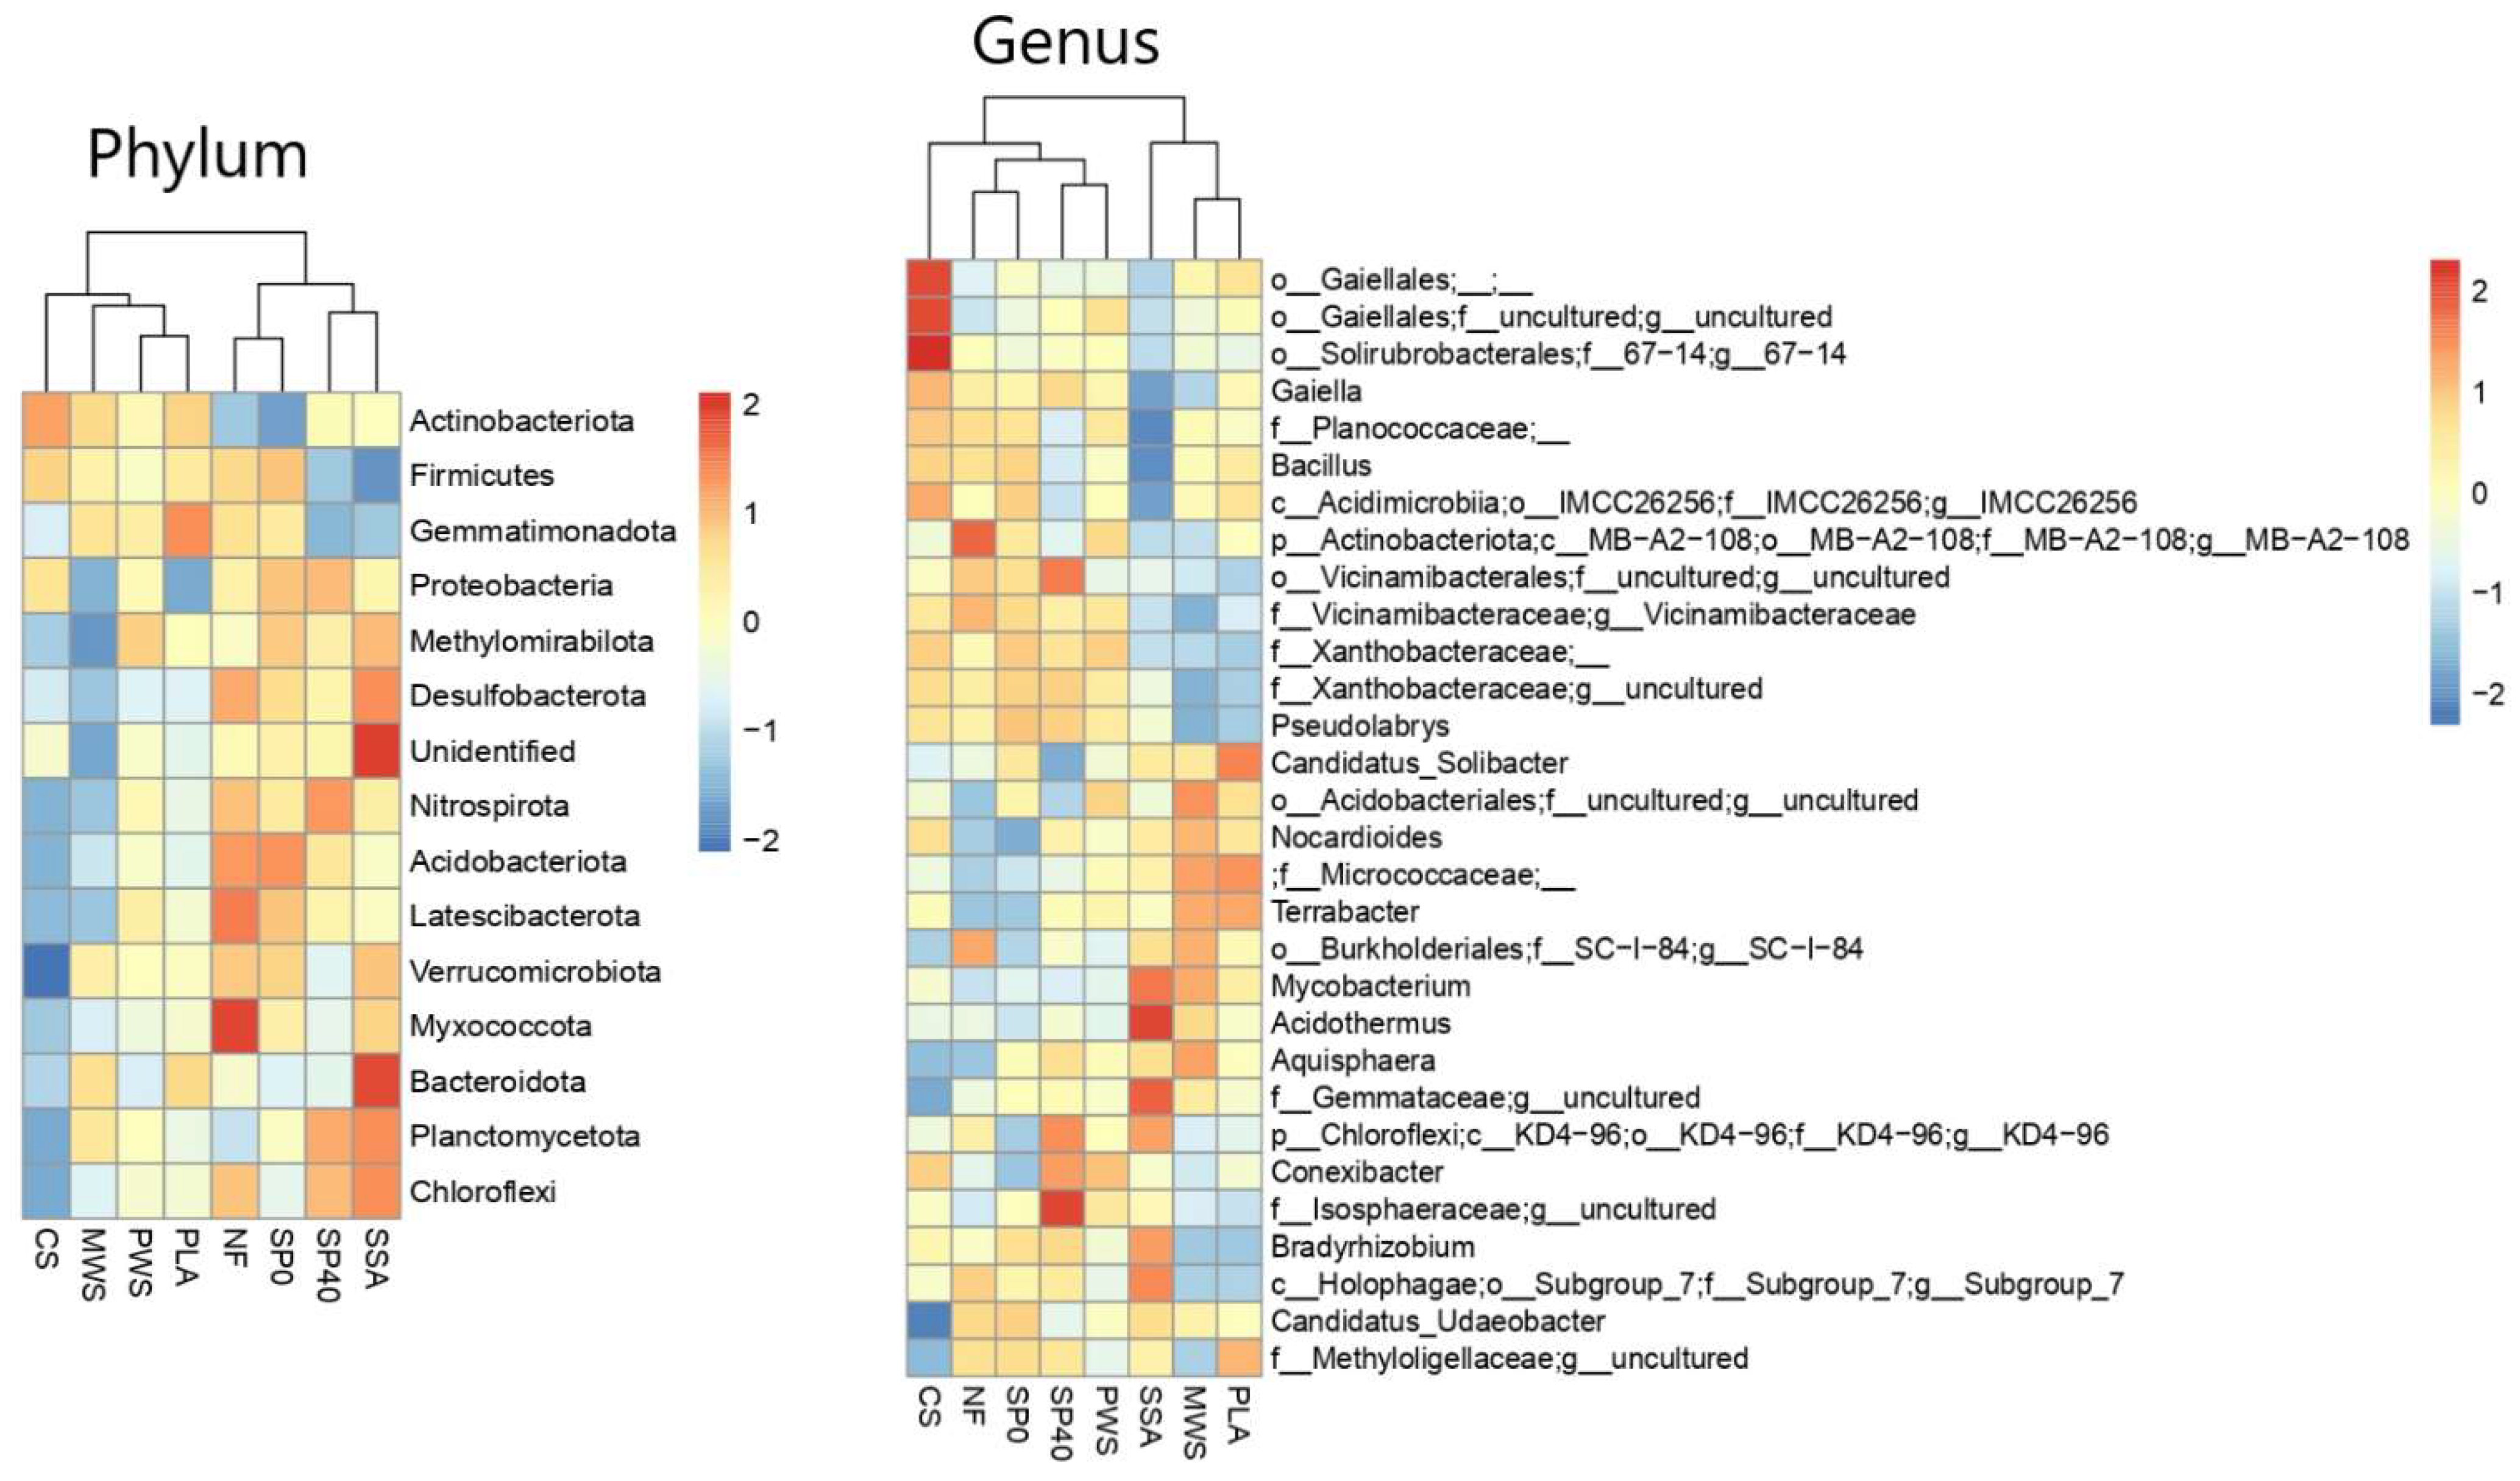
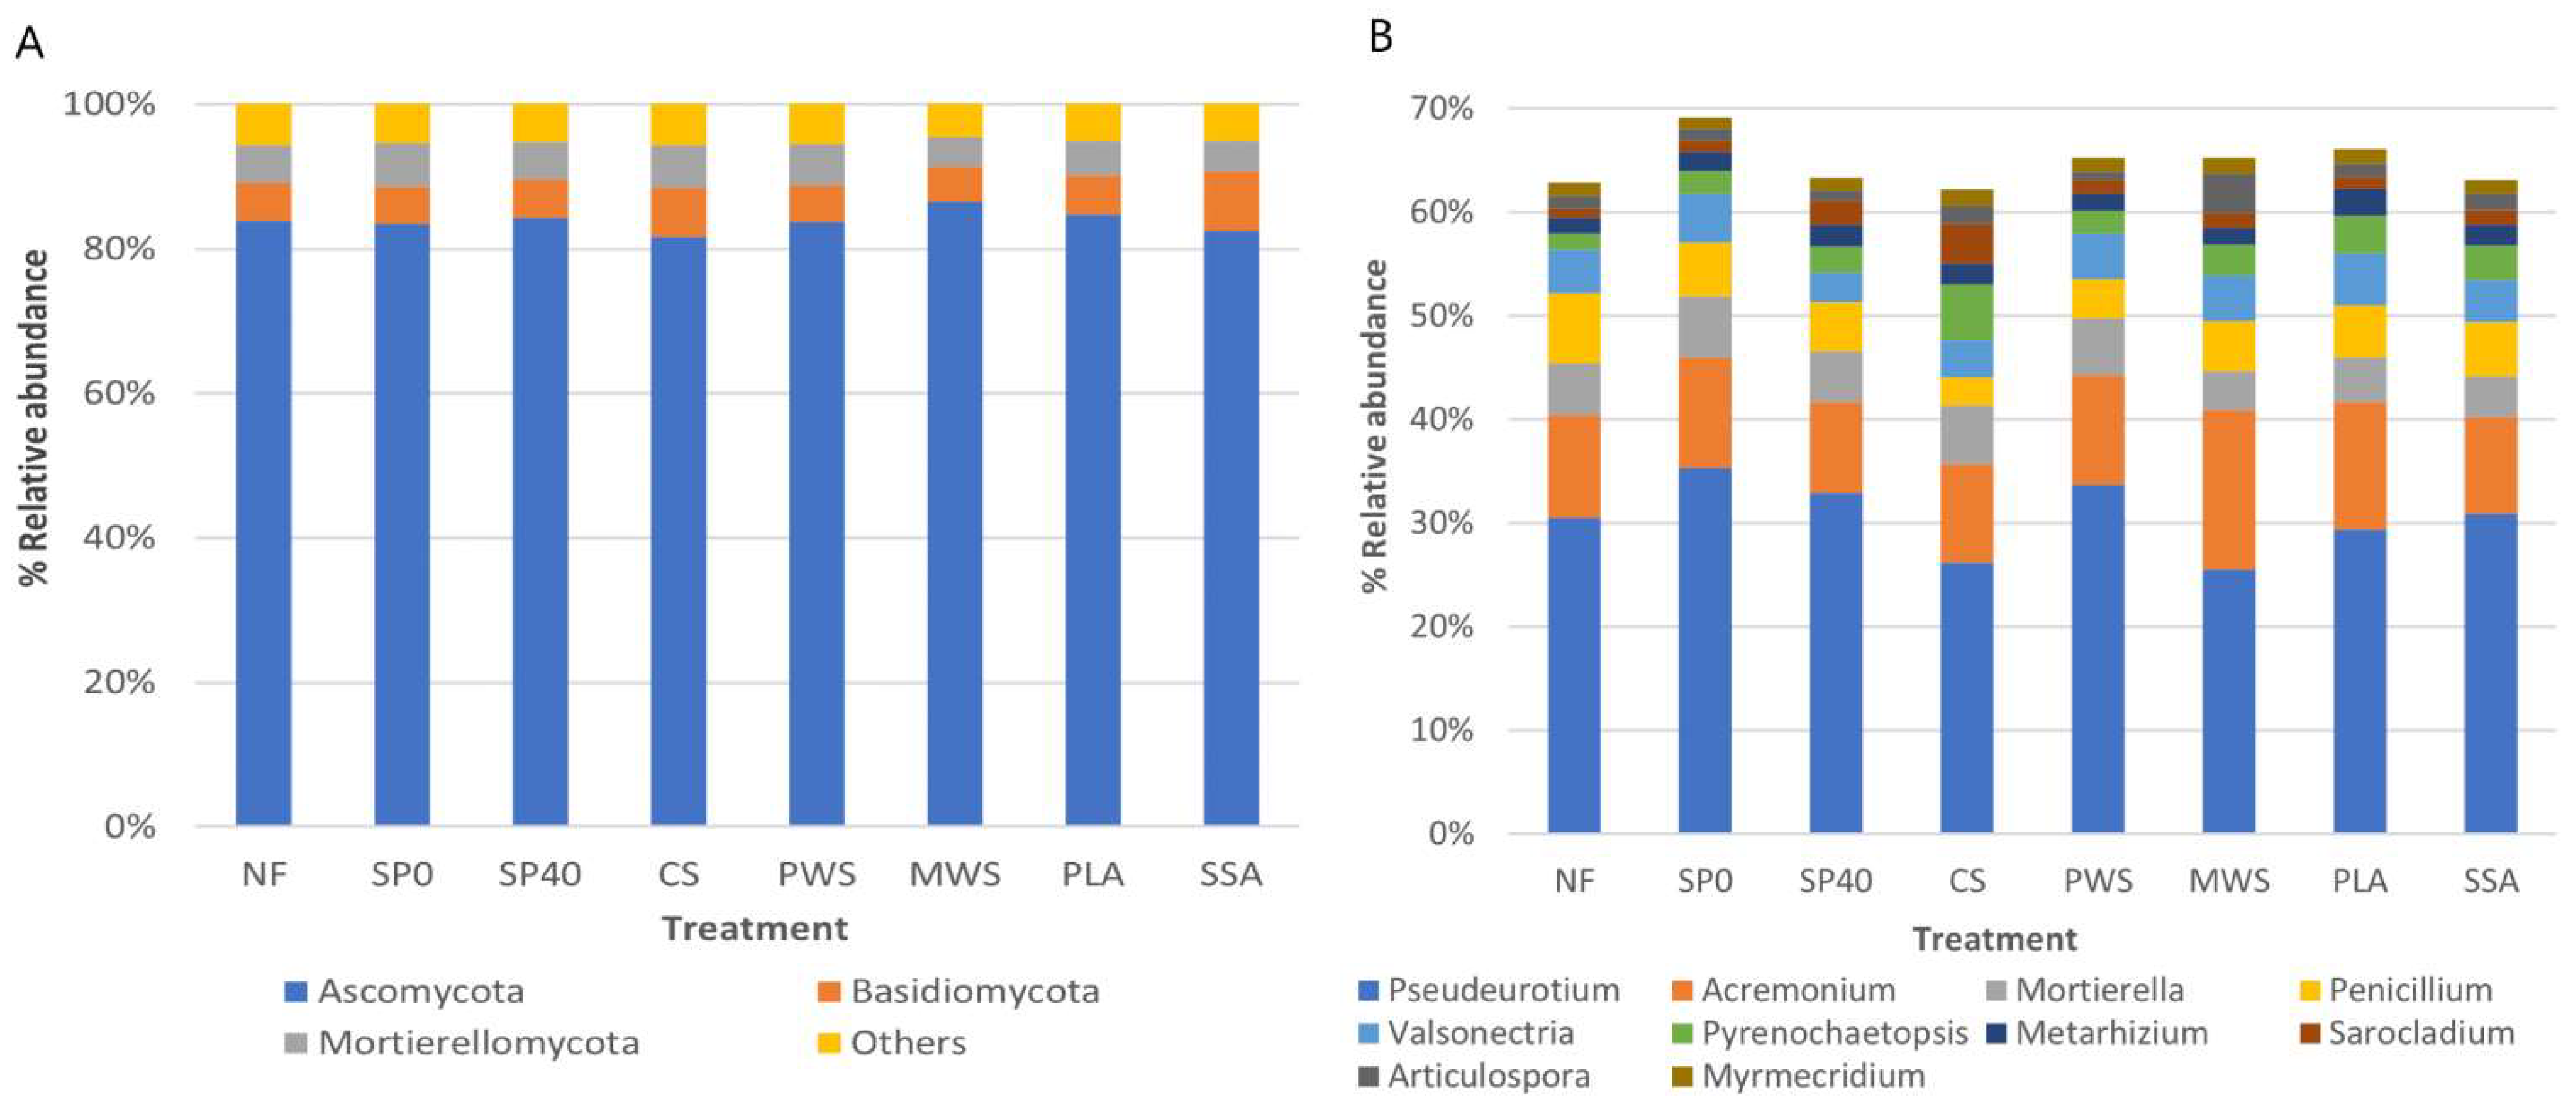
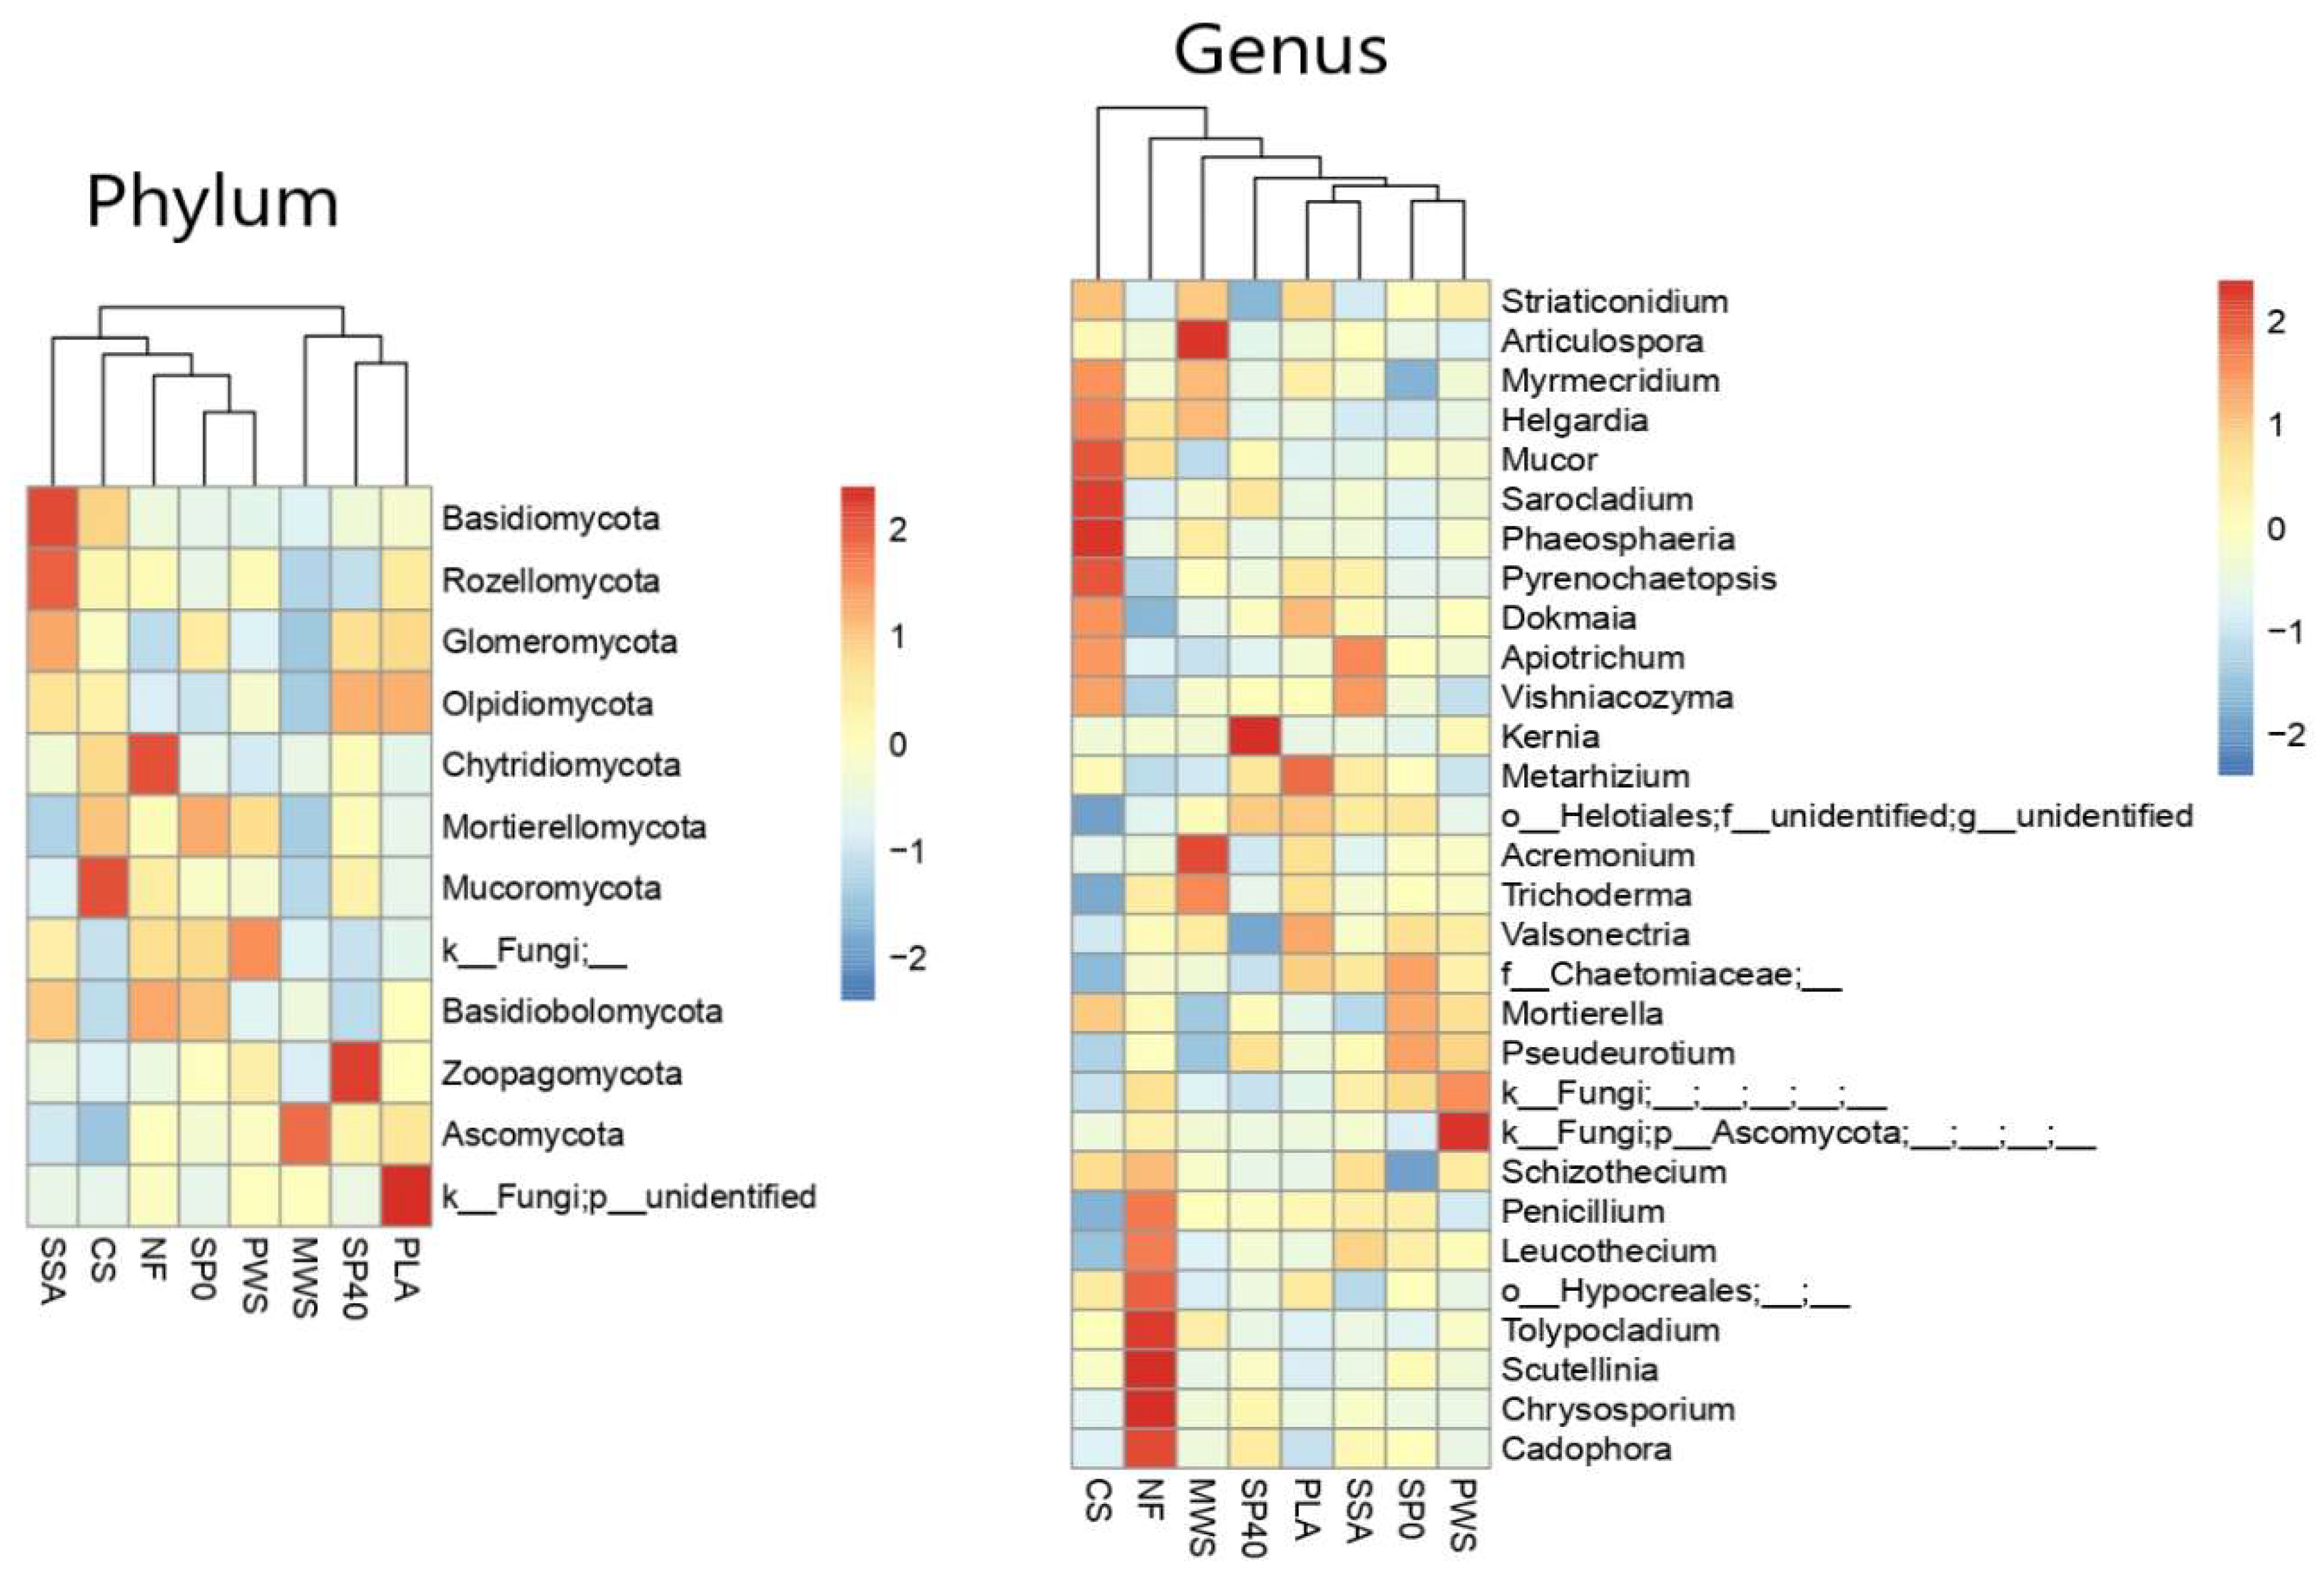
3.2.1. Community Composition

After quality filtering, totals of 2,283,122 (19,553–101,287 sequences per sample) and 1,148,140 (7439–45,875 sequences per sample) 16S rRNA and ITS sequences were obtained, respectively. The dominant bacterial phyla were Actinobacteriota, followed by Proteobacteria, Firmicutes, Acidobacteriota, Planctomycetota, Chloroflexi, Verrucomicrobiota, Myxococcota, Gemmatimonadota, and Desulfobacterota, together accounting for 96.9–97.6% of the total bacterial sequences in samples (Figure 1A). The dominant bacterial phyla remained consistent across the fertiliser treatments; however, their relative abundances were altered in several cases. Of the top 15 bacterial phyla, which accounted for >99% of sequences in all samples, pairwise significant differences were found in the abundances of the phyla Myxococcota, Gemmatimonadota, Desulfobacterota, Bacteroidota, and Latescibacterota (p < 0.05, Table S3). While the dominant phylum, Actinobacteriota, was clearly enriched in treatments with P fertilisation, changes were not significant in pairwise comparisons. The average relative abundance of Actinobacteriota increased by 1.4–3.4% in P-treated soil. Myxococcota abundance significantly dropped in CS treatment compared to NF. Gemmatimonadota abundance significantly increased in PLA compared to SP40, CS, and SSA. Desulfobacterota were significantly increased in NF compared with MWS and SSA compared with the other RDF treatments (PWS, MWS, and PLA). Bacteroidota abundance was enriched in SSA compared to CS. Lactescibacterota abundance significantly lowered in CS and MWS treatments compared to NF.
At the genus level, the top 10 genera (Figure 1B) accounted for a large proportion of the total bacterial population at 36.4–40.0%. While the order of genera dominance varied among treatments, Bacillus and an unidentified genus of the order Gaiellales were the top two genera in all treatments, with average abundances of 8.2% and 5.4%, respectively. The top 30 genera, accounting for 60.4–64.9% of total bacteria, were investigated statistically for differences of significance (p < 0.05, Table S3) among treatments. Generally, significant declines were observed in the abundances of an uncultured genus of Xanthobacteraceae in MWS and PLA treatments, and another unidentified genus of Xanthobacteraceae in MWS, PLA, and SSA treatments. Solirubrobacterales 67-14 were significantly increased in CS, Nocardioides, Terrabacter, and uncultured Gemmataceae in MWS, Bradyrhizobium in SSA, Candidatus Solibacter in both ash treatments (PLA, SSA), and unidentified Micrococcaceae in both MWS and PLA treatments. Finally, the abundance of Pseudolabrys was significantly decreased in MWS treatment. The bacterial abundance changes at phylum and genus level are visualised via heatmaps in Figure 2.
On average, the dominant fungal phylum, Ascomycota, accounted for 83.8% of total fungal sequences. Alongside the phyla Ascomycota, the Mortierellomycota and Basidiomycota comprised 90.4–97.5% of total fungal sequences in samples (Figure 3). An average of approximately 3% of fungal sequences could not be assigned to a specific fungal phylum. No significant differences were detected between the various fertilisation treatment groups in the abundances of their fungal phyla or genera. In most cases, nonparametric significance tests had to be performed due to the variability between samples of the same group, which caused the normality assumption of parametric tests to be dissatisfied. Transforming the data was also unsuccessful in achieving normal distribution. The heatmaps in Figure 4 visually represent the abundance differences of the top fungal phyla and genera.

3.2.2. Microbial Alpha Diversity

Sequences were rarefied to 19,553 and 12,239 per sample for bacteria and fungi, respectively. Significant differences (p < 0.05) were detected in bacterial richness and evenness (observed OTUs and Simpson’s index) among the different treatment groups, while the fungal diversity remained equally rich and even, suggesting fungal diversity was relatively unaffected by the fertilisation regimes (Table 3). In observed bacterial OTUs, pairwise comparisons revealed the mineral SP40 and CS treatments had significantly lower numbers in comparison to the unfertilised (NF) control (p = 0.047, p = 0.009), while CS treatment also had significantly lower numbers compared to the SP0 control (p = 0.016). The only significant difference detected between the SP40 control treatment, and other treatments were with the SSA treatment, which had a higher number of observed OTUs (p = 0.028), while MWS, PLA, and SSA had significantly higher numbers in comparison to CS treatment (p = 0.009, p = 0.009, p = 0.009). A high Simpson’s index was calculated in all samples. In terms of Simpson’s index, SSA treatment was found to have a significantly higher index than the NF (p = 0.047), SP0 (p = 0.049), SP40 (p = 0.028) and CS (p = 0.009) treatments. In poultry litter ash (PLA) it was significantly higher than in SP0 (p = 0.047) and CS (p = 0.028), while in MWS was significantly higher than in CS treatment (p = 0.047). Otherwise, the PWS RDF treatment had significantly lower observed OTUs and Simpson’s index compared to the SSA RDF (p = 0.028, p = 0.009).

3.2.3. Microbial Beta Diversity

Permutational multivariate analysis of variance (PERMANOVA) procedure performed on Weighted Unifrac distances, based on 999 Monte Carlo permutations, revealed that bacterial community structure was significantly affected by the different fertilisation treatments (F = 1.998, p = 0.001), while fungal communities were not (F = 0.990, p = 0.463). As determined through PERMANOVA pairwise comparisons, several of the treatment groups significantly differed (p < 0.05) from one another in their bacterial community structures. Both NF and SP0 negative control treatments exhibited significantly different (p < 0.05) bacterial community structures in comparison to CS, MWS, PLA, and SSA treatments, but not to SP40 or PWS treatments (Table S5). Interestingly, the SP0 treatment, which had N, K, and S fertilisers applied, did not differ significantly in its bacterial community structure when compared to the NF treatment, which had zero fertilisers applied. The MWS treatment was the most distinct, in that it had a significantly different bacterial community structure compared to all other treatments and was the only treatment that significantly differed from the mineral control treatment (SP40). Both PLA and SSA treatments were also significantly different from the CS treatment. Based on Unweighted Unifrac distances, neither bacterial (F = 1.023, p = 0.134) nor fungal (F = 1.023, p = 0.414) community structures were found to be significantly variable.

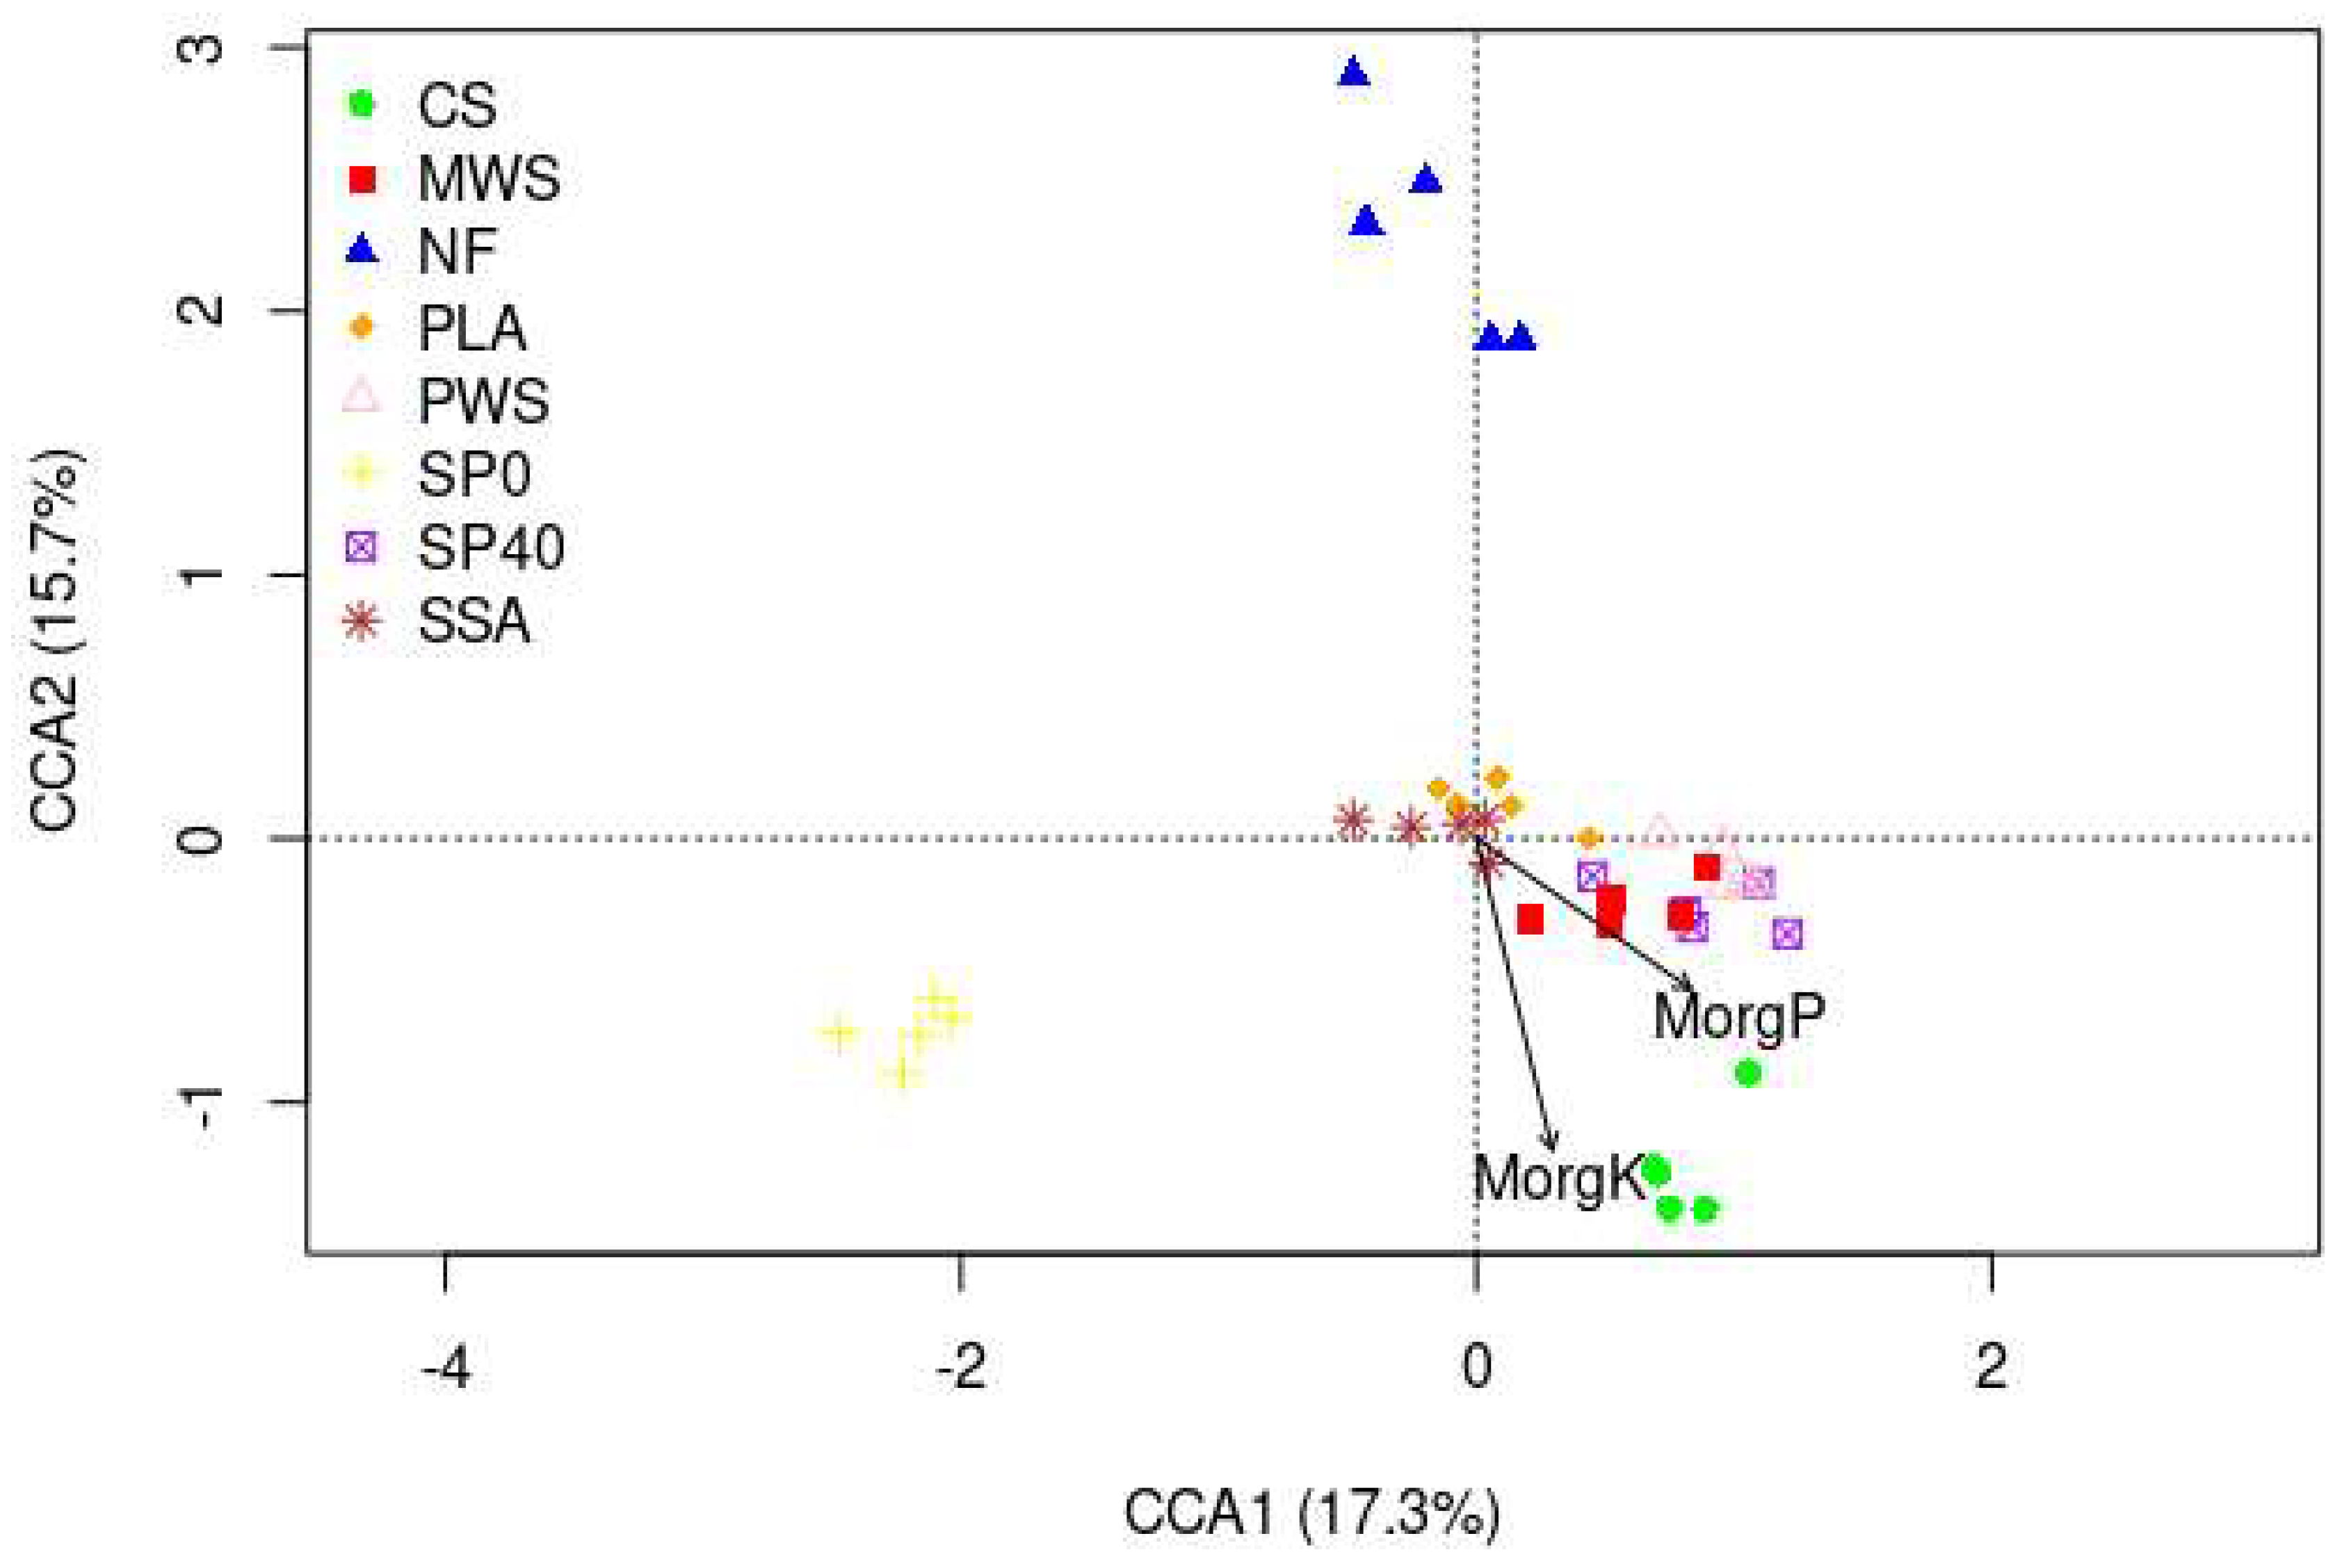
3.2.4. Relationships between Physiochemical Soil Variables and Microbial Communities

Canonical correspondence analysis (CCA) conducted on bacterial and fungal sample OTU data with soil variables unveiled significant relationships between available P and K with bacterial communities. Approximately 18.6% of the total variation in the bacterial analysis was explained by soil chemical properties (Figure 5). Available P appeared to be a significant driving factor in shaping the bacterial communities of SP40, PWS, and MWS treatments, while available K played a significant role in shaping the community of the CS treatment. Fungal communities were not significantly affected by soil variables.
Pearson’s correlation analysis was performed on bacterial abundances at phylum and genus level to unveil bacterial taxa affected by available P and K concentrations (Table S4). Available P (Morgan’s P) in the soil was weakly positively correlated with the abundance of the Actinobacteriota phylum (r(40) = 0.32, p = 0.048). The top 30 genera were investigated, and all those positively correlated with available P belonged to the Actinobacteriota, including Nocardioides, Mycobacterium, an unidentified Micrococcaceae genus, Acidothermus, and Terrabacter. Meanwhile, the Proteobacteria (r(40) = −0.42, p = 0.007), Acidobacteriota (r(40) = −0.35, p = 0.025) and Myxococcota (r(40) = −0.32, p = 0.043) phyla were negatively correlated with available P. Proteobacterial genera, negatively correlated, included two uncultured Xanthobacteraceae genera and Pseudolabrys. Two uncultured genera belonging to Vicinamibacterales of the Acidobacteriota also had negative relationships with available P. The Chloroflexi (r(40) = −0.31, p = 0.049) and Verrucomicrobiota phyla (r(40) = −0.35, p = 0.027) abundances were negatively correlated with available K (Morgan’s K) in the soil. At the genus level, a moderate positive relationship was revealed between Solirubrobacterales 67-14 metagenome genus and available K, while Candidatus Udaeobacter showed a negative relationship.

3.3. Nematode Analysis

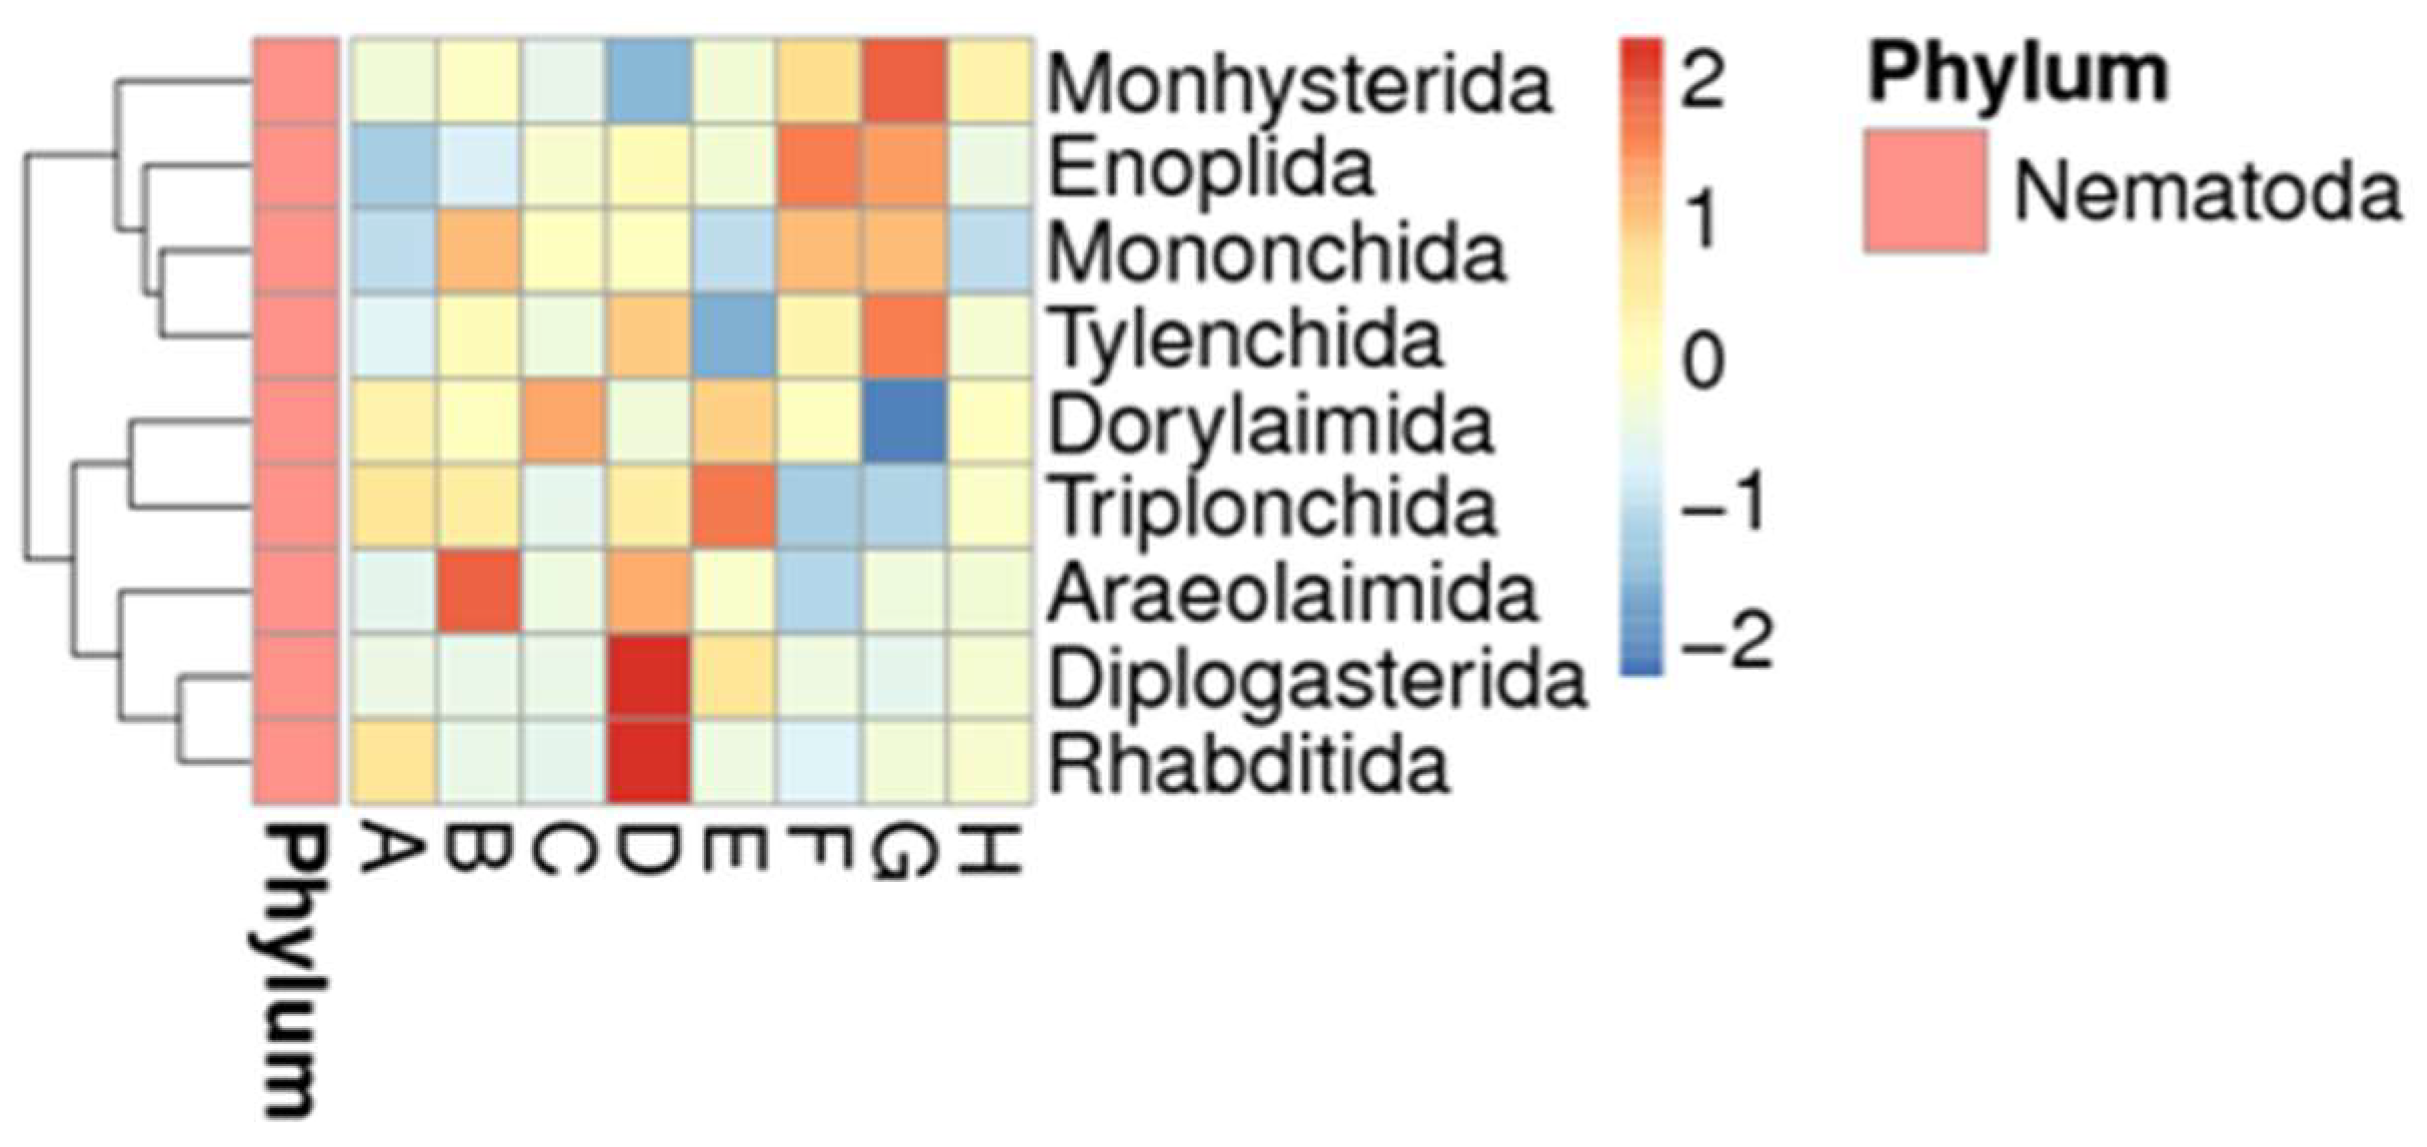
3.3.1. Community Composition

After quality filtering, an average of 151,561 total effective tags was obtained per sample. For alpha and beta diversity analyses, samples were analysed as groups based on their fertiliser treatment. A sequence cut-off value equivalent to the lowest number of taxon tags sequenced in a sample was used, which in this case was 41,377. The dominant nematode order was Dorylaimida, followed by Monhysterida, Tylenchida, Rhabditida, Triplonchida, Araeolaimida, Diplogasterida, Enoplida, and Mononchida, together accounting for 96.8–99.9% of the total nematode sequences in samples. Of the top nine nematode orders, significant differences were found in the abundances of the Dorylaimida, Monhysterida, Triplonchida, and Rhabditida (Figure 6), when compared to the abundances of orders in SP 40, the conventional mineral fertiliser (Table S6). Poultry litter ash treatment significantly (p = 0.003) decreased the relative abundance of environmental disturbance sensitive dorylaimids and significantly (p = 0) increased the relative abundance of stress-tolerant monhysterids. Cattle slurry treatment significantly (p = 0.03) increased the numbers of food opportunistic rhabditids, when compared with SP 40, due to the input material rich in organic matter. Potato waste struvite treatment significantly (p = 0.006) increased the relative abundance of predacious or bacteria feeding triplonchids, when compared with SP 40, the mineral control.

3.3.2. Nematode Alpha and Beta Diversity

Levels of nematode diversity within the different fertilisation treatment groups were found to be significantly different from each other in two particular cases (Table 4). Sewage sludge ash had a negative effect on nematode diversity when compared to SP 40, the conventional mineral fertiliser. Sewage sludge ash significantly (p = 0.02) reduced the number of observed species when compared with SP 40 and the remaining treatments. Poultry litter ash showed the highest species richness and evenness, when compared with SP 40 and the remaining treatments. The analysis of similarity (ANOSIM) performed on Weighted Unifrac distances, revealed that nematode community structure was significantly affected by the PLA, when compared with those in NF, SP 0, SP 40, CS, and PWS treatment (Table S8). Based on Unweighted Unifrac distances, CS, SSA, and PLA nematode communities were significantly different from those in the remaining treatments, and each other (Table S9).

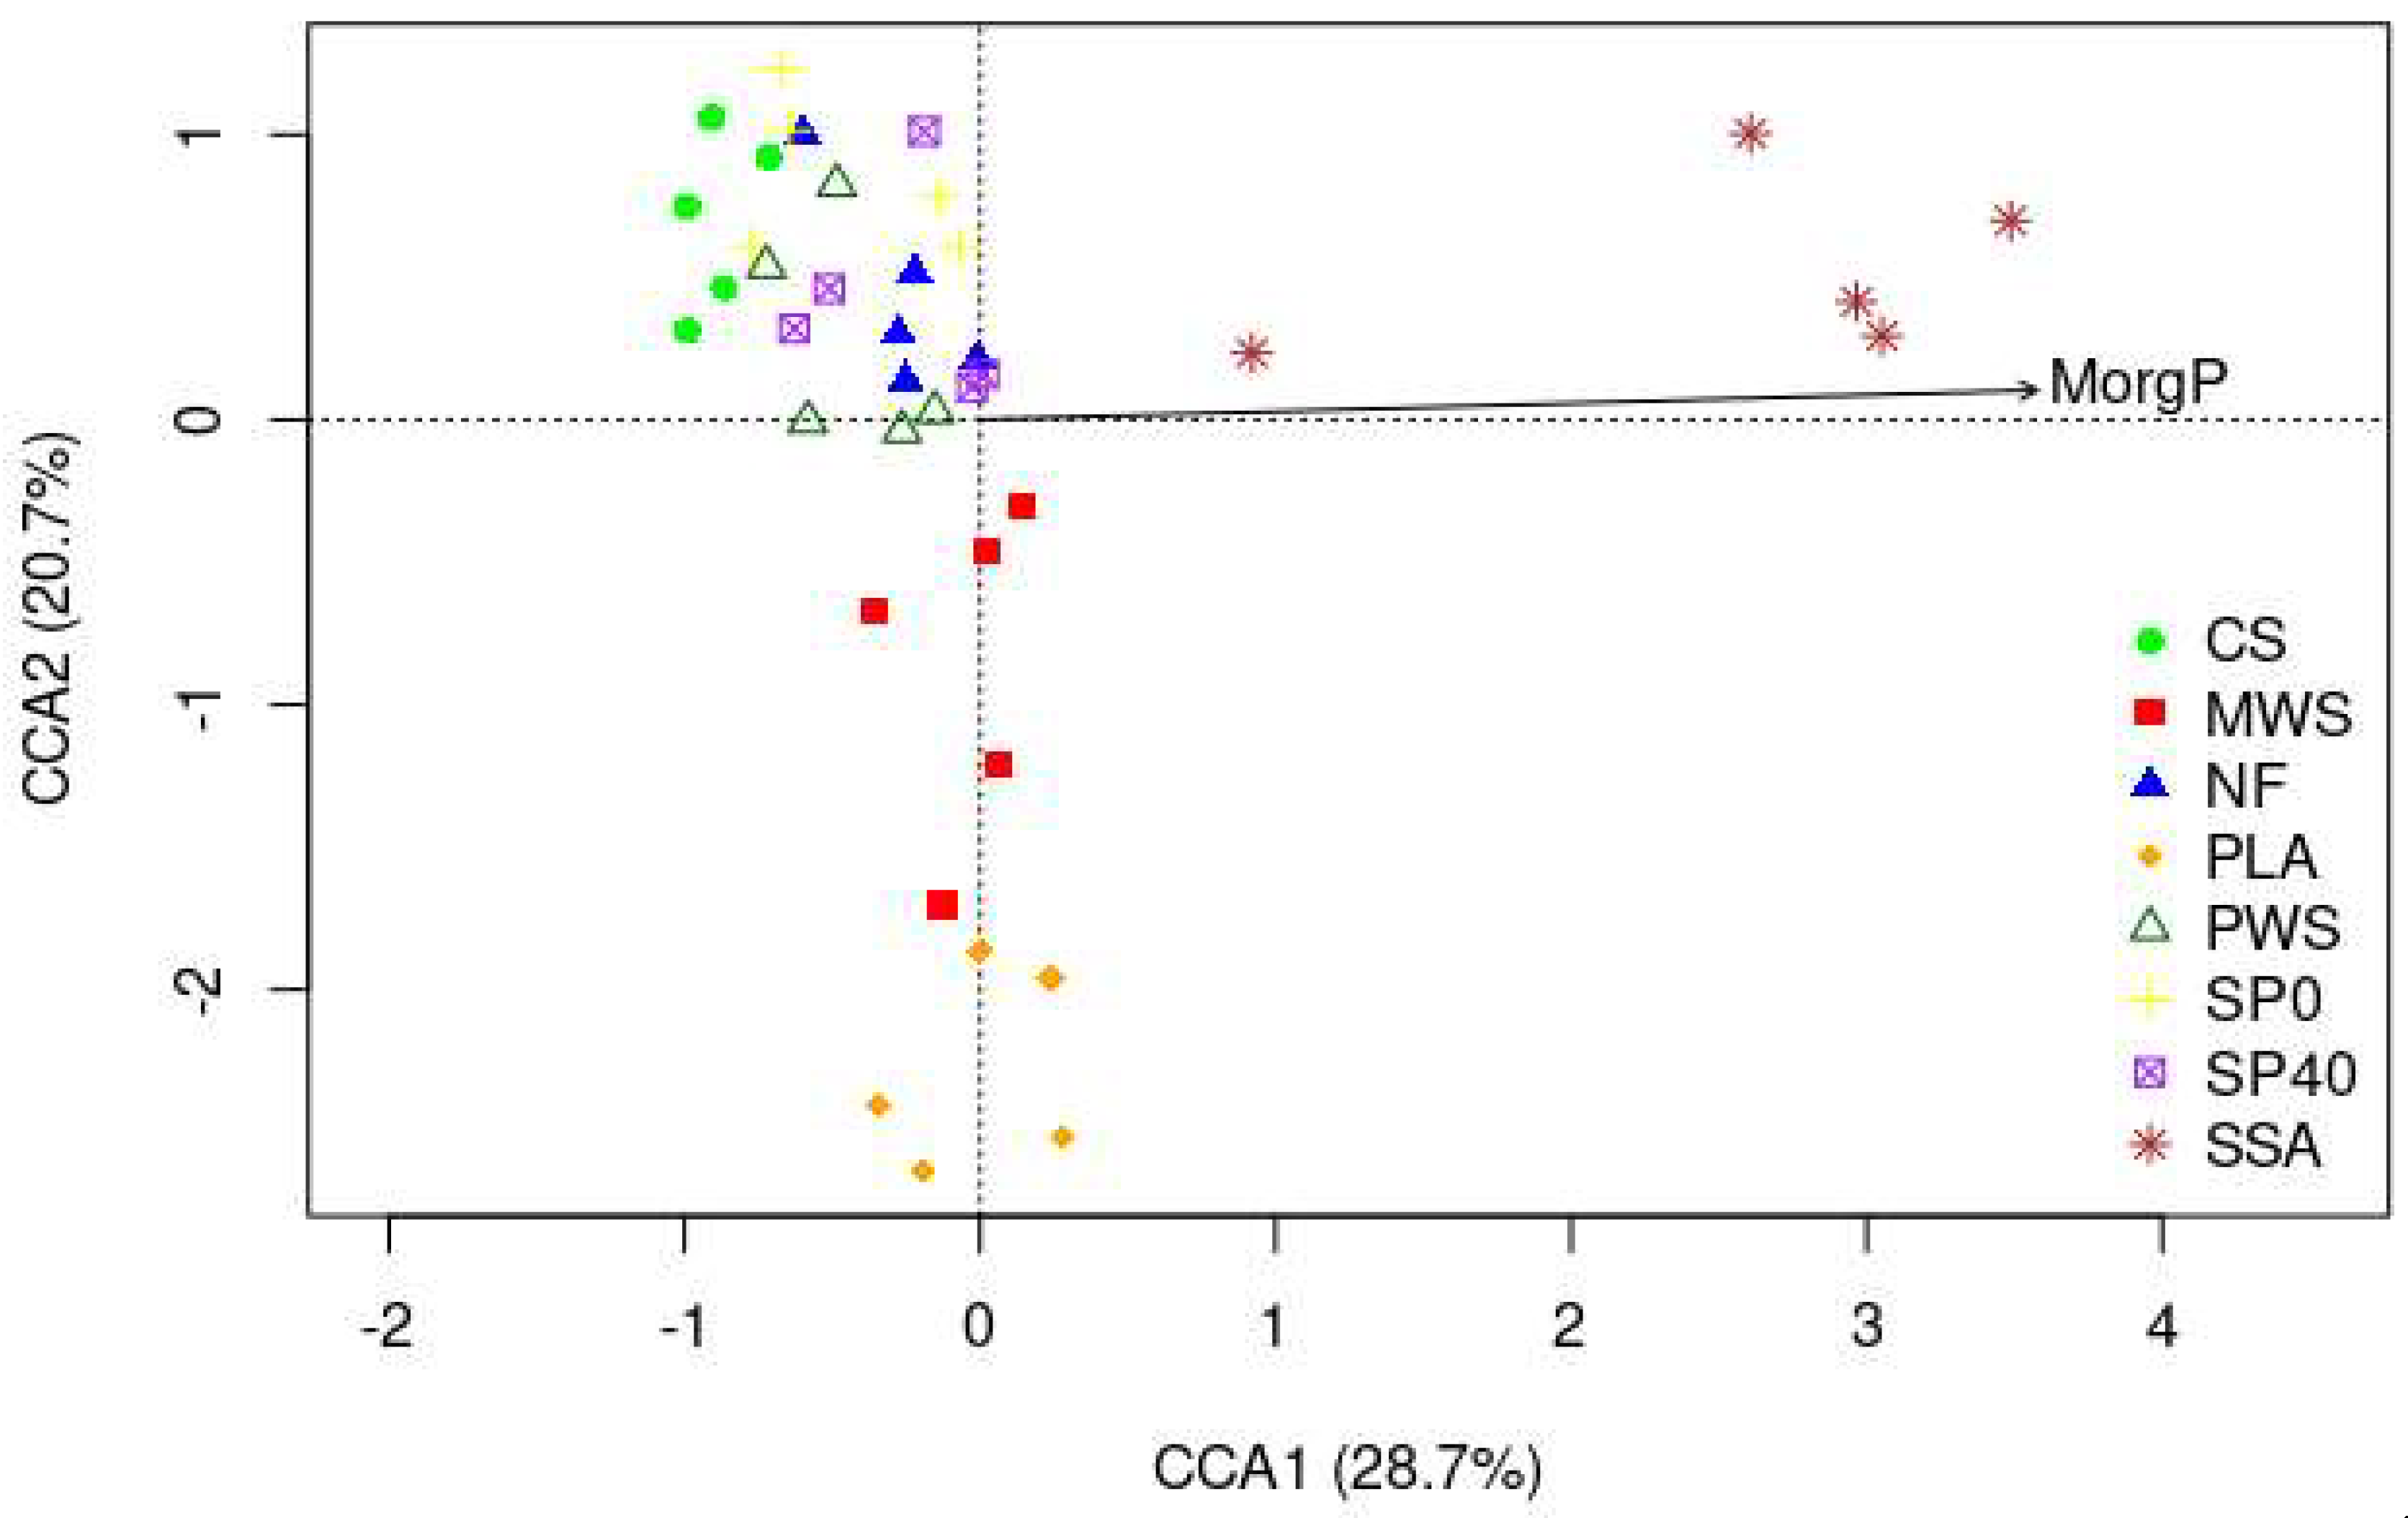
3.3.3. Relationships between Physiochemical Soil Variables and Nematode Communities

Canonical correspondence analysis (CCA) conducted on nematode associated OTU data and soil variables revealed significant relationships between available P (Morgan’s P) with nematode communities. Approximately 25% of the total variation in nematode analysis was explained by soil chemical properties (Figure 7). Available P appeared to be a significant driving factor in shaping the nematode communities in the SSA treatment.
Pearson’s correlation analysis was performed to reveal nematode taxa affected by soil available P concentration. The analysis showed no correlation at the order level (Table S7). Further investigation at the species level revealed that Available P (Morgan’s P) was weakly positively correlated with the relative abundance of Neopsilenchus magnidens (r(40) = 0.355, p = 0.025) and weakly negatively correlated with Acrobeloides spp. (r(40) = −0.354, p = 0.025). This means that the abundance of the plant-parasitic (epidermal-root hair feeder) Neopsilenchus spp. was increasing with increasing soil available P. On the other hand, the abundance of the bacterial feeding Acrobeloides spp. was decreasing, while available P was relatively high. Additionally, Pearson’s correlation analysis showed that other soil properties than Morgan’s P to be significantly correlated with the relative abundances of certain nematode taxa. The relative abundance of enoplids was positively correlated with uptake P (kg/ha) in the soil (r(40) = 0.317, p = 0.046), and DM yield (ton/ha) (r(40) = 0.357, p = 0.024). The relative abundance of Alaimus spp. (Ba4), belonging to order Enoplida, was also positively correlated with the DM yield (r(40) = 0.346, p = 0.029). The abundance of the plant-parasitic Xiphinema diversicaudatum was positively correlated with the DM yield (r(40) = 0.327, p = 0.039) as well as with uptake P (r(40) = 0.351, p = 0.026). Additionally, the lowest relative abundance of X. diversicaudatum was recorded for NF, SP 0, and SSA treatments and the lowest uptake P values. The numbers of the omnivorous Sectonema barbatoides were positively correlated with uptake P (r(40) = 0.382, p = 0.015). Again, the lowest relative abundance of S. barbatoides was recorded for NF, SP 0, and SSA treatments, previously recorded with the lowest uptake p values.

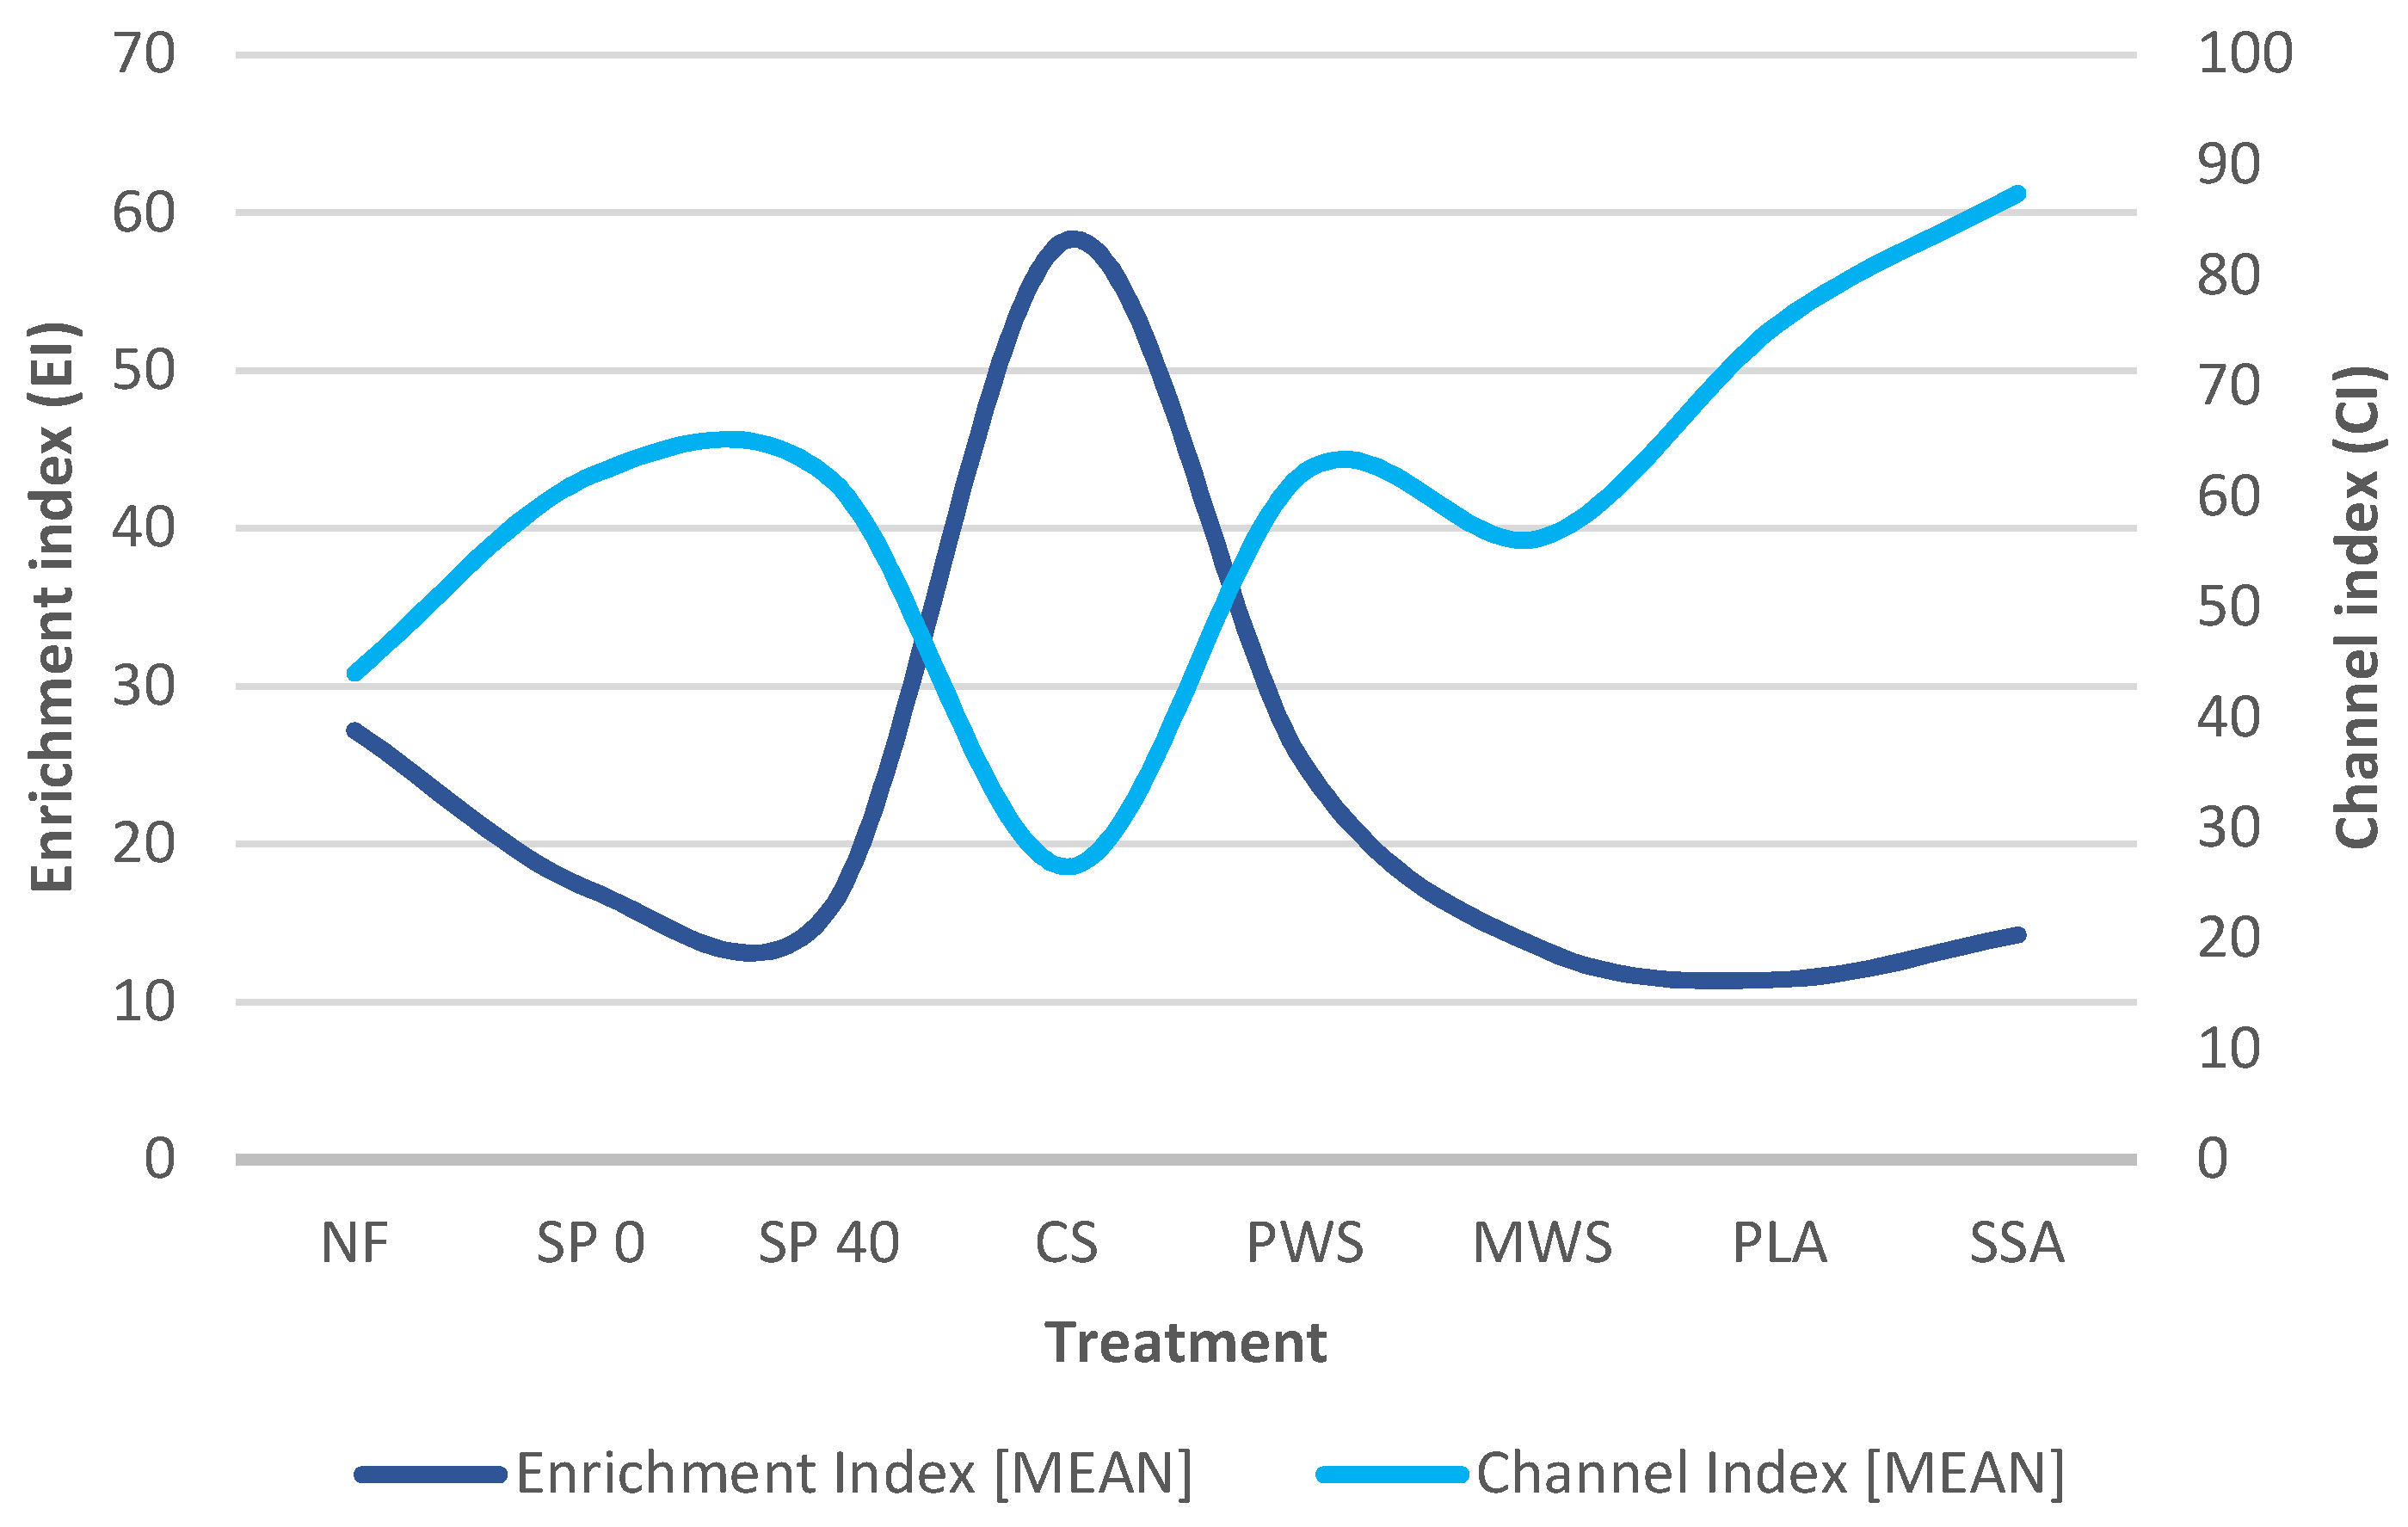
3.3.4. Food Web Diagnostics

The database that the Nematode INdicator Joint Analysis (NINJA) tool operates on contains the majority of terrestrial nematode families, genera, and species, with the corresponding c-p scale values and feeding behaviours [29]. The relative abundance data of the 45 nematode species, identified via molecular approach, were used to perform the diagnostics. The faunal profile analysis revealed a significant (p = 0.02) difference in the Channel Index (CI) value of SSA (87.47) and CS (26.51) treatments (Figure 8). The Enrichment Index (EI) was identified as significantly (p = 0.04) higher in CS (21.83) treatment when compared with that in PLA RDF (5.41). Additionally, Pearson’s correlation analysis showed strong negative correlation (r(40) = −0.762, p = 0.00) between EI and CI.

4. Discussion

4.1. Microbial Community

The different types of P fertiliser used in this trial had varying significant influences on the soil bacterial communities. Several of the top bacterial phyla were found to significantly differ in abundance between treatment groups. However, abundance differences were treatment-specific, i.e., they occurred between some treatments, but not all. This indicated that while significant taxa abundance differences were detected, they were not so significant that they were enriched or depleted compared to all other treatment groups.
The Actinobacteriota were found to be the dominant phylum of bacteria in all treatments. Most Actinobacteriota are aerobic saprophytes and are typically dominant in soils, with a diverse range of roles [30]. While overall significance in the relative abundance of Actinobacteriota was detected, no significant pairwise comparisons were found, despite an obvious increase in their relative abundances in P-treated soils. Hence, the Actinobacteriota were positively correlated with available P in the soil, which indicated that their ability to make P available through various mechanisms [31] allowed them to thrive. Though the Gemmatimonadota are among the nine most abundant bacterial phyla found in soils, their increased abundance in PLA treated soil was difficult to interpret, as their ecological importance is poorly understood, with very few members isolated, to date [32]. They have, however, been shown to prefer drier soils [33] and soil with high salinity-sodicity [34]. The increased abundance of Desulfobacterota in SSA-treated soil may have been due to the excess S applied to the soil. However, PLA treatment, which received a higher amount of S, had a lower abundance of Desulfobacterota. It is possible that the high Fe content of SSA stimulated iron-oxidisers within this phylum [35]. Additionally, Bacteroidota, which are considered to be specialised degraders of complex organic matter, also increased in abundance in SSA treatment [36]. Notably, among the top 30 genera, soil treated with MWS had the most significant abundance differences. A trend emerged in that all genus abundance decreases in this treatment occurred in the family Xanthobacteraceae—two uncultured genera, Bradyrhizobium and Pseudolabrys, while genera with significantly enriched abundances all belonged to the class Actinobacteria—Nocardioides, an uncultured Micrococcaceae and Terrabacter. The Xanthobacteraceae family are associated with C and N cycling in soils [37] and have been identified as enriched in low P soils [38], suggesting they declined due to increased competition with P-solubilising Actinobacteriota.
Two soil physiochemical properties, available P and K, were found to be explanatory of a portion of the bacterial community variation, according to CCA (Figure 5). Overall, available P appeared to have the widest influence on the bacterial community structure in this trial, showing multiple significant positive or negative correlations with the dominant bacterial phyla and genera. Actinobacteriota were the only phylum positively correlated with available P, as described above. Mycobacterium, a member of this phylum, displayed the strongest positive relationship with available P (r = 0.509, p = 0.001). Mycobacterium is best known as a NO3 reducer and polyaromatic hydrocarbon degrader [39], but it is also named an active species in the conversion of insoluble phosphorus [40]. Available K was negatively correlated with two bacterial phyla, Chloroflexi and Verrucomicrobiota, both of which have been previously observed to decline in abundance with increasing K [41,42].
Soil bacterial diversity richness and evenness were significantly variable among treatments, with the CS treatment the least diverse. In the case of CS treated soil, the rate of N and K applied exceeded the recommended amounts by 80 kg N/ha and 116 kg K/ha, respectively. However, the drop of bacterial diversity levels in CS treated soils was unusual, as organic amendments are known to increase bacterial diversity [43,44,45]. One possible explanation is that the additional moisture led to a more rapid release of P in this treatment. This decrease in bacterial diversity levels was also observed in the mineral SP40 treatment. However, some studies have reported reduced bacterial diversity after application of mineral P and the application of manure and mineral fertiliser combination treatments, due to stimulated growth of copiotrophic dominating microbes [46,47]. This occurrence is further supported by the lack of significance between the Simpson’s index of NF and the positive control treatments, which measures OTU richness and evenness. Additionally, it is possible that the excessive amounts of N applied in the CS treatment may have contributed to the significant decrease in bacterial diversity, a trend previously reported by Li et al. [48]; however, it must be mentioned that the sequencing depth was estimated to represent approximately 60% of the bacterial community; therefore, it is possible that diversity was decreased by chance due to insufficient sequencing depth. The most interesting finding was that the level of bacterial OTU richness and evenness were either maintained or increased by RDF treatments when compared to negative and positive control treatments.
In beta diversity analysis, bacterial community structure was found to be significantly variable among treatments by PERMANOVA statistical method when measured by the quantitative Weighted Unifrac, but not when measured by the qualitative Unweighted Unifrac. This provided evidence that the dissimilarity among the bacterial communities was attributable to differences in abundance rather than phylogenetic composition. This is not an unusual occurrence, as pointed out by Lozupone et al. [49] that Weighted and Unweighted Unifrac can lead to dramatically different conclusions. Generally, soil bacterial communities were more responsive to P input combined with N, K, and S, than they were to N, K, and S alone; however, soil treated with mineral superphosphate fertiliser (SP40) showed no change in community structure in comparison to NF and SP0 treatments. With the exception of increased abundance of one bacterial genus, Conexibacter, our findings between SP0 and SP40 treatments were consistent with Randall et al. [50], who found that soil bacterial abundance, structure, and richness were unaffected by inorganic P fertilisation (30 kg P/ha−1) under a cut and removed grass management system. The MWS RDF treatment was the most distinct, with a significantly different bacterial community compared to all other treatments. This treatment had the highest levels of Uptake P, available P, and an increased abundance of genera belonging to Actinobacteriota, all of which were positively correlated with available P, suggesting that this struvite released P most efficiently. This, alongside the significant drop in genera belonging to the Xanthobacteraceae family, described above, explained this community change. Overall, while bacterial taxa abundances, diversity, and community structure were significantly impacted by the various fertiliser treatments in this P-FRV trial, we found no evidence suggestive of deleterious effects imposed by RDFs as a P source on soil bacterial community.
Fungal community response to fertiliser treatments, while highly variable among samples of the same treatment, was statistically insignificant between treatments. This applied to fungal taxa abundance, alpha diversity, and beta diversity. Bacteria have been shown to be more sensitive to different fertilisers than fungi, due to their shorter turnover time and faster reactions to environmental changes [51]. However, some change, at least between the unfertilised and fertilised treatments, would have been anticipated. Though in contrast with the literature [52], the results of this trial suggest that the soil’s fungal community was not significantly affected by the different P treatments, or even fertilisation in general. A higher sequencing depth may have aided in the statistical analyses and interpretation of this dataset.
Agricultural management practices, including the use of fertilisers, can alter the physical, chemical, and biological properties of soil, which in turn, can influence a soil’s quality and productive capacity [53]. The addition of fertiliser to soil can greatly impact its function and properties such as organic carbon content, pH, nutrient availability, and enzyme activity, among others, leading to soil degradation. Furthermore, the intense use of chemical fertiliser is associated with functional and structural shifts in soil microbial populations [54]. In our field study, we observed only minor changes in the measured soil properties as a result of RDF application. However, one interesting observation, though statistically insignificant, was that soil subjected to mineral superphosphate (SP40) fertiliser had the lowest average organic matter and carbon contents. This suggests that a higher enzymatic potential and biological activity are maintained in soil by fertilisation with RDF and CS [55]. In fact, due to their relationship with soil biology, enzymes in soil such as phosphatase, dehydrogenase, and catalase can serve as sensitive indicators of microbial activity [56]. Such analysis could provide a further understanding of the bacterial community shifts observed in this trial. Recycling-derived fertilisers have the potential to replace mined non-renewable P and aid in achieving global food security, while minimising the impact of waste streams on our environment. The current linear flow of mineral P from reserves to farms, and into waterbodies, has already surpassed the thresholds of sustainable human development [57]. A circular nutrient economy can be achieved by utilisation of RDF. This study represents the first of a set of analyses of the impact of RDF on soil microbial diversity and community structure subjected to such products. Future work should consider microbial community response under balanced crop nutrient conditions for a clearer picture of their practical use by farmers.

4.2. Nematodes

The diversity of the nematode communities displayed significant changes under the various fertilisation treatments of this trial. In terms of species diversity, richness and evenness, significant changes of observed nematode OTU and Shannon indices were detected among the treatments. The Sewage sludge ash treatment had a significantly lower number of observed species, while PLA showed the highest species richness and evenness, when compared with the remaining treatments. Although PLA showed the highest species richness, it was found to be significantly different from the remaining treatments in terms of nematode taxa, indicating environmental disturbance. Poultry litter ash significantly decreased the relative abundance of stress-sensitive dorylaimids and significantly increased the relative abundance of stress-tolerant monhysterids when compared with SP 40, the mineral fertiliser. This unfavourable shift of nematode communities in PLA RDF could indicate environmental change or disturbance. The persisters, such as dorylaimids, favour undisturbed habitats [17], and a decrease in their abundance indicates disturbance or pollution of their habitat. Overall, environmental disturbance causes a decrease in the number of persisters and causes a shift towards the dominance of colonisers [18].
This field trial design did not take into consideration the nutrient content of RDFs as all treatments received a blanket application to meet crop N, K, and S requirements. As a result, PLA received surplus potassium when compared with other RDFs. The microbial analysis revealed a negative relationship between soil available K and certain bacterial diversity. The surplus of K can also be a potential cause of the unfavourable shift within nematode communities, and as an important factor should be considered during the environmental risk assessment. For this reason, a trial examining microbial and nematode community response to RDFs under balanced nutrient conditions will be analysed in future work. Another reason that possibly caused the reduction in sensitivity to environmental disturbance taxa was the presence of heavy metals in the ash products (unpublished data). The estimated concentration of Copper (Cu) in the ash derived from poultry litter was 417 mg/kg, and the concentration of Zinc (Zn) was as high as 1940 mg/kg. The concentrations of the heavy metals in the ash derived from sewage sludge were similar. Possible heavy metal toxicity to nematode communities was examined following the addition of Cu and Zn to agricultural soil [58]. In the Korthals et al. study, during exposure, the nematode community structure, as well as individual nematode taxa, were significantly affected by increasing concentrations of heavy metals, reaching up to 200 mg/kg. Sensitive to environmental disturbance, dorylaimids such as Thonus spp. and Aporcelaimellus spp. significantly decreased in their abundance at concentrations of Cu and Zn exceeding 50 mg/kg. In the present study, although the ash derived from sewage sludge waste did not adversely affect nematode taxa sensitive to stress and disturbance, it did significantly reduce the number of observed species when compared with the remaining treatments. According to CCA analysis (Figure 7), the soil chemical property of available P appeared to have the strongest influence on the nematode community structure in the SSA treatment. Among RDF, SSA was recorded with the lowest uptake of phosphorous by plants.
In beta diversity analysis, measured by the qualitative Unweighted Unifrac, nematode community structure was found to be significantly variable among the CS, PLA, and SSA treatments. Additionally, the food web diagnostics, based on the relative abundance of nematode species, also showed significant differences among these three treatments, in terms of EI and CI (Figure 8). A significant increase in EI, followed by a significant decrease in CI, indicates enhanced soil bacterial activity and a fast bacterial decomposition channel in CS treatment. The increased CI value indicates a slow fungal decomposition pathway of nutrients in SSA RDF, as opposed to a fast bacterial decomposition channel in CS treatment. The nematode food web becomes enriched when increased microbial activity enhances the bacteria feeding enrichment opportunists [20]. The significant increase in food opportunistic rhabditids in CS treatment, thus, the attraction of bacteria feeding nematodes to graze, was likely due to the input of rich in organic matter material. Treatments that sustained higher levels of bacterivores also experienced higher rates of N mineralisation [59]. Cattle slurry treatment received the highest amount of N, equivalent to 305 kg/ha, between 1st and 2nd application of nutrients; however, the rate of N applied exceeded the recommended amount by 80 kg N/ha, the N (% of DM) was not significantly different among the treatments (Table 2). The highest DM yield was recorded for CS treatment, which also showed the most enriched food web. On the other hand, out of all RDFs, the PLA treatment was recorded with the lowest DM yield, and also showed significantly (p = 0.04) lower EI when compared with CS treatment. Among RDFs, SSA was recorded with the lowest uptake P by plants, as well as the highest CI, which was significantly increased when compared with CI recorded for the CS treatment. The increased CI value indicates a slow fungal decomposition pathway of nutrients in the SSA RDF, as opposed to a fast bacterial decomposition channel in the CS treatment.
Although there was no correlation between Morgan’s P and any of the nematode orders, the relative abundance of the two species was related to available soil nutrients. The increased abundance of the plant-parasitic Neopsilenchus spp. was associated with increased available P in the soil, thus, with less P uptake by plants. The relative abundance of the bacteria feeding Acrobeloides spp. was very low across the treatment groups, and it was negatively correlated with Morgan’s P. This means that the abundance of bacterivorous Acrobeloides spp. was decreasing with increasing soil available P.
The relative abundance of various nematode species was found to be positively correlated with uptake P, DM yield, or both. The omnivorous c-p 5 Sectonema barbatoides, had a weak positive relationship with uptake P, while the bacterivorous (c-p 4) Alaimus spp., weakly positively correlated with DM yield. Although plant-parasitic, the relative abundance of the c-p 5 Xiphinema diversicaudatum, had a weak positive correlation with both uptake P and DM yield. These findings suggest that during this trial, S. barbatoides, X. diversicaudatum, and Alaimus spp., assigned to the upper persisters scale, directly positively contributed to either phosphorous uptake by plants or dry matter yield. The presence of persisters is highly important in agricultural soils and nutrient cycling. Placed at the top of the soil nematode food chain, they feed on bacterial and fungal feeding nematodes, releasing more nutrients available for plant uptake and regulating the coloniser’s population [60].
Soil is the main source of nutrients needed for plant growth. In order to deliver high crop yields and satisfy an increasing demand of a growing population, intensive agriculture causes depletion of the natural reserves of these nutrients in the soil, leading us to a P emergency. It is estimated that the existing global P resources will be exhausted within the coming 50–100 years [61,62,63]. The long-term inputs of inorganic fertilisers are unfavourable from an agricultural sustainability point of view [64]; therefore, it is essential to make better use of P resources, improve the recycling of P from agricultural and urban wastes [65] and explore more sustainable sources of P [66]. Over time, nematode abundance and community composition are affected by the application of mineral or organic fertiliser, soil properties, and crop cultivated [67,68,69]. Organic input, such as animal manure, is widely accepted as one of the sustainable agricultural practices that improve soil fertility and soil biological properties [70,71,72]. In the Gruzdeva et al. [73] study, the application of mineral fertilisers had a more pronounced effect on the nematode community in the plots without the addition of manure. However, even the most efficient use of P resources can cause eutrophication to surrounding water bodies by the leaching of P from agricultural land [74]. Recycling derived fertilisers, as a valid source of nutrients in the form of ash or struvite, can positively contribute to sustainable food production. The nematode density information concept was introduced, by van den Hoogen et al. [75], to visualise the abundance and biomass of nematodes at a global scale. It was estimated that the global biomass of nematodes in the global topsoil is approximately 0.3 gigatonnes (Gt), and their metabolic activity is estimated to be responsible for a monthly carbon (C) turnover of 0.14 Gt, within the global growing season [75]. The diversity and high abundance of nematode communities influence the global carbon cycle and highlight their functional importance in nutrient cycling and agricultural soil food-web functioning. Global warming is driving significant climate change and extreme weather events, such as more frequent droughts and heavy rainfall. As nematodes are aquatic animals and require a water film around soil particles to move, feed, and reproduce [76], more frequent and/or long-term droughts can change the structure of nematode communities and weaken their role in the agricultural soil food web systems [77]. In addition to dry soil conditions, the temperature was reported as an important environmental factor affecting nematode communities [78,79,80,81]. An increase in atmospheric temperature by 0.74 °C over the last century has been reported [82], and a further increase at a rate of 1–3 °C by 2100 has also been predicted. It is unclear what the effects of such nematode community changes will be on food webs, nutrient cycling, and ecosystem functions in agricultural soils. More research is therefore needed in this area, especially in the context of ecological predictive modelling.

5. Conclusions

In this P-FRV trial, we aimed to uncover variation in microbial and nematode community compositions according to different sources of P fertiliser, including conventional P and RDF P treatments derived from municipal and agricultural wastes. In soil microbial analyses, we found that bacterial populations were significantly influenced by fertilisation treatments. The most remarkable result here was that the positive control treatments, SP 40 and CS, significantly lowered the bacterial diversity compared to the unfertilised control treatment, NF, while the RDF treatments did not. Bacterial diversity was either maintained or enriched by RDF application, while conventional mineral fertiliser treatments displayed the lowest levels of diversity. Only one RDF treatment, a struvite derived from municipal waste, was found to have a significantly different bacterial community to the mineral superphosphate control. Most bacterial community variation was explained by available P levels, which appeared to stimulate the Actinobacteriota. Soil available K was also found to be a significant factor influencing bacterial communities. Fungal populations appeared to be relatively unaffected by P sources and fertilisation in general. While community variation was obvious via statistical methods, no negative impacts imposed by utilisation of RDFs on the soil microbiome were observed in this analysis. Though, ash RDFs may be associated with lower crop yield.
The presence of dorylaimids reflects a mature, structured, and less disturbed soil environment, as opposed to a degraded or recently disturbed ecosystem, colonised by stress-tolerant and opportunistic food nematodes. Such disturbance occurred after the application of PLA in the P-FRV trial. This is likely due to the high content of heavy metals in the ash derived from poultry litter waste, or the increased application of potassium during the field trial. Sewage sludge ash displayed unfavourable changes to nematode diversity when compared with the remaining treatments. Soil available P appeared to be a driving factor in shaping the nematode communities of the SSA treatment, which was recorded with the lowest phosphorous uptake among RDF treatments. The SSA, also containing heavy metals, may pose a risk to terrestrial nematode communities in long-term use and, as a result, may negatively affect soil nutrient cycling and mineralisation. The ash product, rich in recycled nutrients, can be certainly used as a fertiliser additive. This approach would reduce the input of unwanted heavy metals into the soil environment while making use of the beneficial recycled nutrients. The ash producers should consider the improvement of the production process to minimise the heavy metal content in the final product.
There were fewer variations in nematode communities observed in struvites, when compared with those in N and K enriched CS. There were no major differences between PWS and MWS and the controls in terms of ecological impact. Neither struvite fertilisers reduced the number of observed nematode species or adversely affected nematode communities, thus, maintaining soil nematode biodiversity. Both struvites can be therefore applied by farmers, as the main source of phosphorous, without posing a threat to terrestrial nematode communities and plant growth.

Supplementary Materials

The following are available online at https://www.mdpi.com/article/10.3390/su132212342/s1, Table S1: Mineral and RDF fertiliser application rates in each treatment, Table S2: One-way ANOVA Tukey’s HSD pairwise comparisons of soil variables in treatment groups, Table S3: Significantly different bacterial genera and phyla relative abundances between treatments, Table S4: Pearson’s correlation results of bacterial phyla and genus abundances with soil variables, Table S5: PERMANOVA pairwise comparison results of bacterial communities based on Weighted Unifrac distances, Table S6: Significantly different nematode order relative abundances between treatments, Table S7: Pearson’s correlation results of nematode order and species abundances with soil variables, Table S8: ANOSIM pairwise comparison results of nematode communities based on Weighted Unifrac distances, Table S9: ANOSIM pairwise comparison results of nematode communities based on Unweighted Unifrac distances.

Author Contributions

All authors contributed to the intellectual input, research design and provided assistance to this study and manuscript preparation. A.K., D.R. and P.F. conducted the experiments. A.K. and D.R. analysed the data and wrote the manuscript. T.K.-D., K.G., D.D. and P.F. reviewed the manuscript. T.K.-D., K.G. and D.D. supervised the work and approved the manuscript for publication. All authors have read and agreed to the published version of the manuscript.

Funding

This research was part-funded by “ReNu2farm: Nutrient Recycling—from pilot production to farms and fields” (Project number NWE601, Interreg North-West Europe).

Data Availability Statement

Sequence information available at NCBI Sequence Read Archive database, bioproject PRJNA762644. Bacterial sequence accession numbers SRR15912161–SRR15912200. Fungal sequence accession numbers SRR15904266-SRR15904305. Nematode sequence accession numbers SSR15912527–SSR15912566.

Acknowledgments

The authors wish to thank Miguel Redondo, University of Madrid, for his assistance and advice on the computational analysis performed. We also wish to thank S.M. Ashekuzzaman and Cathal Redmond of Teagasc, Johnstown Castle, Co. Wexford, for maintaining the field trials. Finally, we would like to thank Deborah Pollard-Jackson, Institute of Technology Carlow, for her help with coordinating our finances.

Conflicts of Interest

The authors declare no conflict of interest.

References

  1. Cooper, J.; Lombardi, R.; Boardman, D.; Carliell-Marquet, C. The future distribution and production of global phosphate rock reserves. Resour. Conserv. Recycl. 2011, 57, 78–86. [Google Scholar] [CrossRef]
  2. Mehta, C.M.; Khunjar, W.O.; Nguyen, V.; Tait, S.; Batstone, D. Technologies to Recover Nutrients from Waste Streams: A Critical Review. Crit. Rev. Environ. Sci. Technol. 2014, 45, 385–427. [Google Scholar] [CrossRef] [Green Version]
  3. Maron, P.-A.; Mougel, C.; Ranjard, L. Soil microbial diversity: Methodological strategy, spatial overview and functional interest. Comptes Rendus Biol. 2011, 334, 403–411. [Google Scholar] [CrossRef]
  4. Torsvik, V.; Øvreås, L. Microbial diversity and function in soil: From genes to ecosystems. Curr. Opin. Microbiol. 2002, 5, 240–245. [Google Scholar] [CrossRef]
  5. Verstraete, W.; Mertens, B. Chapter 5 The key role of soil microbes. In Developments in Soil Science; Doelman, P., Eijsackers, H.J.P., Eds.; Elsevier: Amsterdam, The Netherlands, 2004; Volume 29, pp. 127–157. [Google Scholar] [CrossRef]
  6. Badri, D.V.; Vivanco, J.M. Regulation and function of root exudates. Plant Cell Environ. 2009, 32, 666–681. [Google Scholar] [CrossRef] [PubMed]
  7. Hayat, R.; Ali, S.; Amara, U.; Khalid, R.; Ahmed, I. Soil beneficial bacteria and their role in plant growth promotion: A review. Ann. Microbiol. 2010, 60, 579–598. [Google Scholar] [CrossRef]
  8. Nielsen, M.N.; Winding, A. Microorganisms as Indicators of Soil Health; National Environmental Research Institute: Roskilde, Denmark, 2002. [Google Scholar]
  9. Singh, B.; Quince, C.; Macdonald, C.; Khachane, A.; Thomas, N.; Abu Al-Soud, W.; Sørensen, S.; He, Z.; White, D.; Sinclair, A.; et al. Loss of microbial diversity in soils is coincident with reductions in some specialized functions. Environ. Microbiol. 2014, 16, 2408–2420. [Google Scholar] [CrossRef] [PubMed]
  10. Chen, Q.-L.; Ding, J.; Zhu, Y.-G.; He, J.-Z.; Hu, H.-W. Soil bacterial taxonomic diversity is critical to maintaining the plant productivity. Environ. Int. 2020, 140, 105766. [Google Scholar] [CrossRef] [PubMed]
  11. Rao, D. Microbial Diversity, Soil Health and Sustainability. J. Indian. Soc. Soil Sci. 2007, 55, 392–403. [Google Scholar]
  12. Fierer, N. Embracing the unknown: Disentangling the complexities of the soil microbiome. Nat. Rev. Genet. 2017, 15, 579–590. [Google Scholar] [CrossRef]
  13. Zhen, Z.; Liu, H.; Wang, N.; Guo, L.; Meng, J.; Ding, N.; Wu, G.; Jiang, G. Effects of Manure Compost Application on Soil Microbial Community Diversity and Soil Microenvironments in a Temperate Cropland in China. PLoS ONE 2014, 9, e108555. [Google Scholar] [CrossRef]
  14. Wilson, M.; Kakouli-Duarte, T. Nematodes as Environmental Indicators; CABI: Wallingford, UK, 2009; pp. 1–17. [Google Scholar]
  15. Bongers, T.; Bongers, M. Functional diversity of nematodes. Appl. Soil Ecol. 1998, 10, 239–251. [Google Scholar] [CrossRef]
  16. Bongers, T.; Ferris, H. Nematode community structure as a bioindicator in environmental monitoring. Trends Ecol. Evol. 1999, 14, 224–228. [Google Scholar] [CrossRef]
  17. Bongers, T. The maturity index: An ecological measure of environmental disturbance based on nematode species composition. Oecologia 1990, 83, 14–19. [Google Scholar] [CrossRef]
  18. Odum, E.P. Trends Expected in Stressed Ecosystems. BioScience 1985, 35, 419–422. [Google Scholar] [CrossRef]
  19. Wardle, D.A.; Yeates, G.W. The dual importance of competition and predation as regulatory forces in terrestrial ecosystems: Evidence from decomposer food-webs. Oecologia 1993, 93, 303–306. [Google Scholar] [CrossRef]
  20. Ferris, H.; Bongers, T.; Goede, R. A framework for soil food web diagnostics: Extension of the nematode faunal analysis concept. Appl. Soil Ecol. 2001, 18, 13–29. [Google Scholar] [CrossRef]
  21. Bang-Andreasen, T.; Nielsen, J.T.; Voriskova, J.; Heise, J.; Rønn, R.; Kjøller, R.; Hansen, H.C.B.; Jacobsen, C.S. Wood Ash Induced pH Changes Strongly Affect Soil Bacterial Numbers and Community Composition. Front. Microbiol. 2017, 8, 1400. [Google Scholar] [CrossRef]
  22. Robles-Aguilar, A.A.; Grunert, O.; Hernandez-Sanabria, E.; Mysara, M.; Meers, E.; Boon, N.; Jablonowski, N.D. Effect of Applying Struvite and Organic N as Recovered Fertilizers on the Rhizosphere Dynamics and Cultivation of Lupine (Lupinus angustifolius). Front. Plant Sci. 2020, 11, 572741. [Google Scholar] [CrossRef]
  23. Caporaso, J.G.; Lauber, C.L.; Walters, W.A.; Berg-Lyons, D.; Lozupone, C.A.; Turnbaugh, P.J.; Fierer, N.; Knight, R. Global patterns of 16S rRNA diversity at a depth of millions of sequences per sample. Proc. Natl. Acad. Sci. USA 2010, 108, 4516–4522. [Google Scholar] [CrossRef] [Green Version]
  24. Armitage, D.W.; Gallagher, K.L.; Youngblut, N.D.; Buckley, D.H.; Zinder, S.H. Millimeter-scale patterns of phylogenetic and trait diversity in a salt marsh microbial mat. Front. Microbiol. 2012, 3, 293. [Google Scholar] [CrossRef] [PubMed] [Green Version]
  25. Schoch, C.L.; Seifert, K.A.; Huhndorf, S.; Robert, V.; Spouge, J.L.; Levesque, C.A.; Chen, W. Nuclear ribosomal in-ternal transcribed spacer (ITS) region as a universal DNA barcode marker for Fungi. Proc. Natl. Acad. Sci. USA 2012, 109, 6241–6246. [Google Scholar] [CrossRef] [PubMed] [Green Version]
  26. Bhadury, P.; Austen, M.; Bilton, D.; Lambshead, P.; Rogers, A.; Smerdon, G. Development and evaluation of a DNA-barcoding approach for the rapid identification of nematodes. Mar. Ecol. Prog. Ser. 2006, 320, 1–9. [Google Scholar] [CrossRef]
  27. Quast, C.; Pruesse, E.; Yilmaz, P.; Gerken, J.; Schweer, T.; Yarza, P.; Peplies, J.; Glöckner, F.O. The SILVA ribosomal RNA gene database project: Improved data processing and web-based tools. Nucleic Acids Res. 2012, 41, D590–D596. [Google Scholar] [CrossRef]
  28. Nilsson, H.; Larsson, K.-H.; Taylor, A.F.S.; Bengtsson-Palme, J.; Jeppesen, T.S.; Schigel, D.; Kennedy, P.; Picard, K.; Glöckner, F.O.; Tedersoo, L.; et al. The UNITE database for molecular identification of fungi: Handling dark taxa and parallel taxonomic classifications. Nucleic Acids Res. 2018, 47, D259–D264. [Google Scholar] [CrossRef]
  29. Sieriebriennikov, B.; Ferris, H.; Goede, R. NINJA: An automated calculation system for nematode-based biological monitoring. Eur. J. Soil Biol. 2014, 61, 90–93. [Google Scholar] [CrossRef]
  30. Zhang, B.; Wu, X.; Tai, X.; Sun, L.; Wu, M.; Zhang, W.; Chen, X.; Zhang, G.; Chen, T.; Liu, G.; et al. Variation in Actinobacterial Community Composition and Potential Function in Different Soil Ecosystems Belonging to the Arid Heihe River Basin of Northwest China. Front. Microbiol. 2019, 10, 2209. [Google Scholar] [CrossRef]
  31. Solans, M.; Messuti, M.I.; Reiner, G.; Boenel, M.; Vobis, G.; Wall, L.G.; Scervino, J.M. Exploring the response of Actinobacteria to the presence of phosphorus salts sources: Metabolic and co-metabolic processes. J. Basic Microbiol. 2019, 59, 487–495. [Google Scholar] [CrossRef]
  32. Zeng, Y.; Nupur, N.W.; Madsen, A.M.; Chen, X.; Gardiner, A.T.; Koblížek, M. Gemmatimonas groenlandica sp. nov. Is an Aerobic Anoxygenic Phototroph in the Phylum Gemmatimonadetes. Front. Microbiol. 2021, 11. [Google Scholar] [CrossRef]
  33. DeBruyn, J.M.; Nixon, L.T.; Fawaz, M.N.; Johnson, A.M.; Radosevich, M. Global Biogeography and Quantitative Seasonal Dynamics of Gemmatimonadetes in Soil. Appl. Environ. Microbiol. 2011, 77, 6295–6300. [Google Scholar] [CrossRef] [Green Version]
  34. Guan, Y.; Jiang, N.; Wu, Y.; Yang, Z.; Bello, A.; Yang, W. Disentangling the role of salinity-sodicity in shaping soil microbiome along a natural saline-sodic gradient. Sci. Total Environ. 2021, 765, 142738. [Google Scholar] [CrossRef] [PubMed]
  35. Murphy, C.L.; Biggerstaff, J.; Eichhorn, A.; Ewing, E.; Shahan, R.; Soriano, D.; Stewart, S.; VanMol, K.; Walker, R.; Walters, P.; et al. Genomic characterization of three novel Desulfobacterota classes expand the metabolic and phylogenetic diversity of the phylum. Environ. Microbiol. 2021, 23, 4326–4343. [Google Scholar] [CrossRef] [PubMed]
  36. Wolińska, A.; Kuźniar, A.; Zielenkiewicz, U.; Izak, D.; Szafranek-Nakonieczna, A.; Banach, A.; Błaszczyk, M. Bacteroidetes as a sensitive biological indicator of agricultural soil usage revealed by a culture-independent approach. Appl. Soil Ecol. 2017, 119, 128–137. [Google Scholar] [CrossRef]
  37. Oren, A. The Family Xanthobacteraceae. In The Prokaryotes: Alphaproteobacteria and Betaproteobacteria; Rosenberg, E., De Long, E.F., Lory, S., Stackebrandt, E., Thompson, F., Eds.; Springer: Berlin/Heidelberg, Germany, 2014; pp. 709–726. [Google Scholar]
  38. Oliverio, A.M.; Bissett, A.; McGuire, K.; Saltonstall, K.; Turner, B.L.; Fierer, N.; Moran, M.A. The Role of Phosphorus Limitation in Shaping Soil Bacterial Communities and Their Metabolic Capabilities. Mbio 2020, 11, e01718-20. [Google Scholar] [CrossRef]
  39. Anderson, C.R.; Condron, L.M.; Clough, T.; Fiers, M.; Stewart, A.; Hill, R.; Sherlock, R.R. Biochar induced soil microbial community change: Implications for biogeochemical cycling of carbon, nitrogen and phosphorus. Pedobiologia 2011, 54, 309–320. [Google Scholar] [CrossRef]
  40. Anand, K.; Kumari, B.; Mallick, M. Phosphate solubilizing microbes: An effective and alternative approach as biofertilizers. Int. J. Pharm. Pharm. Sci. 2016, 8, 37–40. [Google Scholar]
  41. Zhang, M.-M.; Wang, N.; Hu, Y.-B.; Sun, G.-Y. Changes in soil physicochemical properties and soil bacterial community in mulberry (Morus alba L.)/alfalfa (Medicago sativa L.) intercropping system. Microbiol. Open 2018, 7, e00555. [Google Scholar] [CrossRef]
  42. Navarrete, A.; Soares, T.; Rossetto, R.; Van Veen, J.A.; Tsai, S.M.; Kuramae, E.E. Verrucomicrobial community structure and abundance as indicators for changes in chemical factors linked to soil fertility. Antonie Leeuwenhoek 2015, 108, 741–752. [Google Scholar] [CrossRef] [Green Version]
  43. Yang, Y.; Ashworth, A.J.; DeBruyn, J.; Willett, C.; Durso, L.M.; Cook, K.; Moore, J.P.A.; Owens, P.R. Soil bacterial biodiversity is driven by long-term pasture management, poultry litter, and cattle manure inputs. PeerJ 2019, 7, e7839. [Google Scholar] [CrossRef] [Green Version]
  44. Francioli, D.; Schulz, E.; Lentendu, G.; Wubet, T.; Buscot, F.; Reitz, T. Mineral vs. Organic Amendments: Microbial Community Structure, Activity and Abundance of Agriculturally Relevant Microbes Are Driven by Long-Term Fertilization Strategies. Front. Microbiol. 2016, 7, 1446. [Google Scholar] [CrossRef] [Green Version]
  45. Tang, H.; Li, C.; Xiao, X.; Shi, L.; Cheng, K.; Wen, L.; Li, W. Effects of short-term manure nitrogen input on soil microbial community structure and diversity in a double-cropping paddy field of southern China. Sci. Rep. 2020, 10, 1–9. [Google Scholar] [CrossRef]
  46. Pathan, S.; Scibetta, S.; Grassi, C.; Pietramellara, G.; Orlandini, S.; Ceccherini, M.; Napoli, M. Response of Soil Bacterial Community to Application of Organic and Inorganic Phosphate Based Fertilizers under Vicia faba L. Cultivation at Two Different Phenological Stages. Sustainability 2020, 12, 9706. [Google Scholar] [CrossRef]
  47. Celestina, C.; Wood, J.L.; Manson, J.B.; Wang, X.; Sale, P.W.G.; Tang, C.; Franks, A.E. Microbial communities in top- and subsoil of repacked soil columns respond differently to amendments but their diversity is negatively correlated with plant productivity. Sci. Rep. 2019, 9, 1–12. [Google Scholar] [CrossRef]
  48. Li, H.; Xu, Z.; Yang, S.; Li, X.; Top, E.M.; Wang, R.; Zhang, Y.; Cai, J.; Yao, F.; Han, X.; et al. Responses of Soil Bacterial Communities to Nitrogen Deposition and Precipitation Increment Are Closely Linked with Aboveground Community Variation. Microb. Ecol. 2016, 71, 974–989. [Google Scholar] [CrossRef] [PubMed]
  49. Lozupone, C.A.; Hamady, M.; Kelley, S.T.; Knight, R. Quantitative and Qualitative β Diversity Measures Lead to Different Insights into Factors That Structure Microbial Communities. Appl. Environ. Microbiol. 2007, 73, 1576–1585. [Google Scholar] [CrossRef] [Green Version]
  50. Randall, K.; Brennan, F.; Clipson, N.; Creamer, R.; Griffiths, B.; Storey, S.; Doyle, E. Soil bacterial community structure and functional responses across a long-term mineral phosphorus (Pi) fertilisation gradient differ in grazed and cut grasslands. Appl. Soil Ecol. 2019, 138, 134–143. [Google Scholar] [CrossRef]
  51. Lazcano, C.; Gómez-Brandón, M.; Revilla, P.; Domínguez, J. Short-term effects of organic and inorganic fertilizers on soil microbial community structure and function. Biol. Fertil. Soils 2012, 49, 723–733. [Google Scholar] [CrossRef]
  52. Tayyab, M.; Islam, W.; Lee, C.G.; Pang, Z.; Khalil, F.; Lin, S.; Lin, W.; Zhang, H. Short-Term Effects of Different Organic Amendments on Soil Fungal Composition. Sustainability 2019, 11, 198. [Google Scholar] [CrossRef] [Green Version]
  53. Samuel, A.D.; Bungau, S.; Tit, D.M.; Melinte, C.E.; Purza, L.; Badea, G.E. Effects of Long Term Application of Organic and Mineral Fertilizers on Soil Enzymes. Rev. Chim. 2018, 69, 2608–2612. [Google Scholar] [CrossRef]
  54. Pahalvi, H.N.; Rafiya, L.; Rashid, S.; Nisar, B.; Kamili, A.N. Chemical Fertilizers and Their Impact on Soil Health. In Microbiota and Biofertilizers; Springer: Cham, Switzerland, 2021; pp. 1–20. [Google Scholar] [CrossRef]
  55. Bungau, S.; Behl, T.; Aleya, L.; Bourgeade, P.; Aloui-Sossé, B.; Purza, A.L.; Abid, A.; Samuel, A.D. Expatiating the impact of anthropogenic aspects and climatic factors on long-term soil monitoring and management. Environ. Sci. Pollut. Res. 2021, 28, 1–23. [Google Scholar] [CrossRef]
  56. Samuel, A.; Brejea, R.; Domuta, C.; Bungau, S.; Cenusa, N.; Tit, D.M. Enzymatic Indicators of Soil Quality. J. Environ. Prot. Ecol. 2017, 18, 871–878. [Google Scholar]
  57. Ockenden, M.C.; Hollaway, M.J.; Beven, K.J.; Collins, A.L.; Evans, R.; Falloon, P.D.; Forber, K.J.; Hiscock, K.M.; Kahana, R.; Macleod, C.J.A.; et al. Major agricultural changes re-quired to mitigate phosphorus losses under climate change. Nat. Commun. 2017, 8, 161. [Google Scholar] [CrossRef] [Green Version]
  58. Korthals, G.W.; Bongers, M.; Kokkema, A.; Dueck, T.A.; Lexmond, T.M. Joint Toxicity of Copper and Zinc to a Terrestrial Nematode Community in an Acid Sandy Soil. Ecotoxicology 2000, 9, 219–228. [Google Scholar] [CrossRef]
  59. Ferris, H.; Matute, M. Structural and functional succession in the nematode fauna of a soil food web. Appl. Soil Ecol. 2003, 23, 93–110. [Google Scholar] [CrossRef]
  60. Yeates, G.W.; Wardle, D.A. Nematodes as predators and prey: Relationships to biological control and soil processes. Pedobiologia 1996, 40, 43–50. [Google Scholar]
  61. Steen, I. Phosphorus availability in the 21st Century: Management of a non-renewable resource. Phosphorus Potassium 1998, 217, 25–31. [Google Scholar]
  62. Smil, V. Phosphorus in the environment: Natural Flows and Human Interferences. Annu. Rev. Energy Environ. 2000, 25, 53–88. [Google Scholar] [CrossRef] [Green Version]
  63. Ashley, K.; Mavinic, D.; Koch, F. International Conference on Nutrient Recovery from Wastewater Streams; IWA Publishing: Vancouver, BC, Canada, 2009; pp. 20–40. [Google Scholar] [CrossRef]
  64. Sarkar, S.; Singh, S.R.; Singh, R.P. The effect of organic and inorganic fertilizers on soil physical condition and the productivity of a rice–lentil cropping sequence in India. J. Agric. Sci. 2003, 140, 419–425. [Google Scholar] [CrossRef]
  65. Hilton, J.; Johnston, A.E.; Dawson, C.J. The Phosphate Life-Cycle: Rethinking the Options for a Finite Resource; International Fertiliser Society: London, UK, 2010; pp. 1–13. [Google Scholar]
  66. DeSmidt, E.; Ghyselbrecht, K.; Zhang, Y.; Pinoy, L.; Van Der Bruggen, B.; Verstraete, W.; Rabaey, K.; Meesschaert, B. Global Phosphorus Scarcity and Full-Scale P-Recovery Techniques: A Review. Crit. Rev. Environ. Sci. Technol. 2014, 45, 336–384. [Google Scholar] [CrossRef]
  67. Briar, S.S.; Miller, S.A.; Stinner, D.; Kleinhenz, M.; Grewal, P.S. Effects of organic transition strategies for peri-urban vegetable production on soil properties, nematode community, and tomato yield. Appl. Soil Ecol. 2011, 47, 84–91. [Google Scholar] [CrossRef]
  68. Ugarte, C.M.; Zaborski, E.R.; Wander, M.M. Nematode indicators as integrative measures of soil condition in organic cropping systems. Soil Biol. Biochem. 2013, 64, 103–113. [Google Scholar] [CrossRef]
  69. Leroy, B.L.; Reheul, D.; Moens, M.; Ferris, H.; De Sutter, N. Short-term nematode population dynamics as influenced by the quality of exogenous organic matter. Nematology 2009, 11, 23–38. [Google Scholar] [CrossRef] [Green Version]
  70. Talgre, L.; Lauringson, E.; Roostalu, H.; Astover, A.; Makke, A. Green manure as a nutrient source for succeeding crops. Plant Soil Environ. 2012, 58, 275–281. [Google Scholar] [CrossRef] [Green Version]
  71. Wang, F.; Ya, T.; Js, Z.; Pc, G.; Jn, C. Effects of various organic materials on soil aggregate stability and soil microbiological properties on the Loess Plateau of China. Plant Soil Environ. 2013, 59, 162–168. [Google Scholar] [CrossRef] [Green Version]
  72. Zhang, H.; Ding, W.; He, X.; Yu, H.; Fan, J.; Liu, D. Influence of 20–Year Organic and Inorganic Fertilization on Organic Carbon Accumulation and Microbial Community Structure of Aggregates in an Intensively Cultivated Sandy Loam Soil. PLoS ONE 2014, 9, e92733. [Google Scholar] [CrossRef]
  73. Gruzdeva, L.I.; Matveeva, E.M.; Kovalenko, T.E. Changes in soil nematode communities under the impact of fertilizers. Eurasian Soil Sci. 2007, 40, 681–693. [Google Scholar] [CrossRef]
  74. Withers, P.J.A.; Neal, C.; Jarvie, H.P.; Doody, D.G. Agriculture and Eutrophication: Where Do We Go from Here? Sustainability 2014, 6, 5853–5875. [Google Scholar] [CrossRef] [Green Version]
  75. Hoogen, J.V.D.; Geisen, S.; Routh, D.; Ferris, H.; Traunspurger, W.; Wardle, D.; De Goede, R.G.M.; Adams, B.J.; Ahmad, W.; Andriuzzi, W.; et al. Soil nematode abundance and functional group composition at a global scale. Nature 2019, 572, 194–198. [Google Scholar] [CrossRef] [Green Version]
  76. Bardgett, R. The Biology of Soil, a Community and Ecosystem Approach; Oxford University Press: Oxford, UK, 2005; p. 256. [Google Scholar]
  77. Yan, D.; Yan, D.; Song, X.; Yu, Z.; Peng, D.; Ting, X.; Weng, B. Community structure of soil nematodes under different drought conditions. Geoderma 2018, 325, 110–116. [Google Scholar] [CrossRef]
  78. Simmons, B.; Wall, D.; Adams, B.; Ayres, E.; Barrett, J.; Virginia, R. Long-term experimental warming reduces soil nematode populations in the McMurdo Dry Valleys, Antarctica. Soil Biol. Biochem. 2009, 41, 2052–2060. [Google Scholar] [CrossRef]
  79. Li, Q.; Bai, H.; Liang, W.; Xia, J.; Wan, S.; Van Der Putten, W.H. Nitrogen Addition and Warming Independently Influence the Belowground Micro-Food Web in a Temperate Steppe. PLoS ONE 2013, 8, e60441. [Google Scholar] [CrossRef] [Green Version]
  80. Dong, Z.; Hou, R.; Chen, Q.; Ouyang, Z.; Ge, F. Response of soil nematodes to elevated temperature in conventional and no-tillage cropland systems. Plant Soil 2013, 373, 907–918. [Google Scholar] [CrossRef]
  81. Ruess, L.; Michelsen, A.; Schmidt, I.K.; Jonasson, S. Simulated climate change affecting microorganisms, nematode density and biodiversity in subarctic soils. Plant Soil 1999, 212, 63–73. [Google Scholar] [CrossRef]
  82. IPCC. Climate Change 2013: The Physical Science Basis. Contribution of Working Group I to the Fifth Assessment Report of the Intergovernmental Panel on Climate Change. Available online: https://www.ipcc.ch/site/assets/uploads/2017/09/WG1AR5_Frontmatter_FINAL.pdf (accessed on 23 October 2021).
Figure 1. The average relative abundances of (A) the top 10 bacterial phyla and (B) the top 10 bacterial genera, observed in each of the treatment groups (n = 5). Treatment group name: NF, No fertiliser; SP0, No phosphate; SP40, mineral super phosphate; CS, cattle slurry; PWS, potato waste struvite; MWS, municipal waste struvite; PLA, poultry litter ash; SSA, sewage sludge ash.
Sustainability 13 12342 g001
Figure 2. Heatmaps representing the abundances of the top 15 bacterial phyla and top 30 bacterial genera in treatment groups. Treatment group name: NF, No fertiliser; SP0, No phosphate; SP40, mineral super phosphate; CS, cattle slurry; PWS, potato waste struvite; MWS, municipal waste struvite; PLA, poultry litter ash; SSA, sewage sludge ash. The Z-score ranges between 2 and −2 and represents the distance between the raw score and the mean of the standard deviation. ‘Z’ is negative when the raw score is below the mean, and vice versa. For those bacterial taxa unable to be assigned into specific known bacterial genera, the higher known taxonomic unit was included.
Sustainability 13 12342 g002
Figure 3. The average relative abundances of (A) the top 3 fungal phyla and (B) the top 10 fungal genera, observed in each of the treatment groups (n = 4 or 5). Treatment group name: NF, No fertiliser; SP0, No phosphate; SP40, mineral super phosphate; CS, cattle slurry; PWS, potato waste struvite; MWS, municipal waste struvite; PLA, poultry litter ash; SSA, sewage sludge ash.
Sustainability 13 12342 g003
Figure 4. Heatmaps representing the abundances of fungal phyla and the top 30 fungal genera in treatment groups. Treatment group name: NF, no fertiliser; SP0, no phosphate; SP40, mineral super phosphate; CS, cattle slurry; PWS, potato waste struvite; MWS, municipal waste struvite; PLA, poultry litter ash; SSA, sewage sludge ash. The Z-score ranges between 2 and −2 and represents the distance between the raw score and the mean of the standard deviation. ‘Z’ is negative when the raw score is below the mean, and vice versa. For those fungal taxa unable to be assigned into specific known fungal genera, the higher known taxonomic unit was included.
Sustainability 13 12342 g004
Figure 5. CCA biplot of bacterial OTU data and soil variables that were significantly associated. Arrows indicate the direction and magnitude of measurable variables significantly associated with bacterial community structures. Treatment group name: NF, No fertiliser; SP0, No phosphate; SP40, mineral super phosphate; CS, cattle slurry; PWS, potato waste struvite; MWS, municipal waste struvite; PLA, poultry litter ash; SSA, sewage sludge ash.
Sustainability 13 12342 g005
Figure 6. Heatmaps representing the abundances of the top nine nematode orders in treatment groups. Treatment group name A: No fertiliser (NF), B: no phosphate (SP 0), C: mineral super phosphate 40 (SP 40), D: cattle slurry (CS), E: potato waste struvite (PWS), F: municipal waste struvite (MWS), G: poultry litter ash (PLA), H: sewage sludge ash (SSA). The Z-score ranges between 2 and −2 and represents the distance between the raw score and the mean of the standard deviation. ‘Z’ is negative when the raw score is below the mean, and vice versa.
Sustainability 13 12342 g006
Figure 7. CCA biplot of nematode OTU data and soil variables that were significantly associated. Arrows indicate the direction and magnitude of measurable variables significantly associated with nematode community structures. Treatment group name: NF, No fertiliser; SP0, No phosphate; SP40, mineral super phosphate; CS, cattle slurry; PWS, potato waste struvite; MWS, municipal waste struvite; PLA, poultry litter ash; SSA, sewage sludge ash.
Sustainability 13 12342 g007
Figure 8. The relationship between enrichment index, channel index, and treatment groups.
Sustainability 13 12342 g008
Table 1. Nutrient contents of RDFs.
Recycling-Derived Fertiliser (RDF)pHNPKSCaAlFe
%
Potato waste struvite (PWS)8.33.06.20.700.030.0020.004
Municipal waste struvite (MWS)7.52.65.20.0300.020.0020.01
Poultry litter ash (PLA)12.30.025.510.73.115.60.750.46
Sewage sludge ash (SSA)11.40.038.41.33.010.35.36.0
Table 2. Soil physiochemical properties of treatments, crop yield, and P uptake after the second ryegrass harvest.
TreatmentTot C
(%)
Org C
(%)
OM
(% of DM)
pHN
(% of DM)
NF2.23 ± 0.271.65 ± 0.155.54 ± 0.665.91 ± 0.160.24 ± 0.03
SP02.53 ± 0.061.86 ± 0.115.98 ± 0.055.89 ± 0.090.26 ± 0.00
SP402.14 ± 0.071.58 ± 0.035.46 ± 0.055.95 ± 0.000.23 ± 0.00
CS2.40 ± 0.071.81 ± 0.105.84 ± 0.006.01 ± 0.020.25 ± 0.00
PWS2.56 ± 0.231.93 ± 0.166.26 ± 0.505.83 ± 0.240.27 ± 0.02
MWS2.24 ± 0.461.65 ± 0.215.72 ± 0.705.94 ± 0.040.24 ± 0.03
PLA2.46 ± 0.151.86 ± 0.046.02 ± 0.505.95 ± 0.270.26 ± 0.01
SSA2.28 ± 0.211.69 ± 0.145.44 ± 0.156.05 ± 0.160.24 ± 0.02
TreatmentMorg P
(mg/L)
Morg K
(mg/L)
Morg Mg
(mg/L)
DM Yield
(ton/ha)
Uptake P
(kg/ha)
NF2.38 ± 0.51 a61.14 ± 18.14 a158.60 ± 10.901.39 ± 0.362.86 ± 0.71 a
SP02.47 ± 1.07 a95.52 ± 1.30 ab141.80 ± 7.503.15 ± 0.38 a6.28 ± 1.03 ab
SP402.95 ± 0.31 ab70.04 ± 7.30 ab144.80 ± 20.503.22 ± 0.44 a7.28 ± 0.87 b
CS3.50 ± 0.06 ab162.60 ± 9.45159.00 ± 19.003.66 ± 0.23 a8.00 ± 0.84 b
PWS3.93 ± 0.68 ab93.32 ± 55.21 ab163.40 ± 20.803.47 ± 0.34 a8.04 ± 1.40 b
MWS4.51 ± 0.58 b88.92 ± 5.20 ab161.60 ± 9.503.64 ± 0.70 a8.20 ± 1.45 b
PLA3.86 ± 0.05 ab102.48 ± 33.15 b148.00 ± 2.502.83 ± 0.59 a7.32 ± 3.91 b
SSA4.18 ± 1.16 ab85.88 ± 11.45 ab158.00 ± 8.103.31 ± 0.21 a6.83 ± 0.77 b
Values are means ± standard deviation (n = 5). Treatments: NF, control without fertilisation; SP0, NKS; SP40, NKS plus 40 kg P/ha mineral superphosphate; CS, NKS plus 23.5 kg P/ha cattle slurry and 16.5 kg P/ha mineral superphosphate; PWS, NKS plus 40 kg P/ha potato waste struvite; MWS, NKS plus 40 kg P/ha municipal waste struvite; PLA, NKS plus 40 kg P/ha poultry litter ash; SSA, NKS plus 40 kg P/ha sewage sludge ash. Tot C, total carbon; Org C, organic carbon; OM, organic matter; Morg P, Morgan’s available phosphorus; Morg K, Morgan’s available potassium; Morg Mg, Morgan’s available magnesium; N, nitrogen; DM Yield, dry matter yield of ryegrass crop; Uptake P, uptake of phosphorus by ryegrass crop; % of DM, percent of dry matter. Different letters beside values in a column represent significant differences between the treatments at p < 0.05.
Table 3. Alpha diversity indices of bacteria and fungi for each treatment group.
Bacteria Fungi
TreatmentObserved OTUs Simpson Chao1 Observed OTUs SimpsonChao1
NF1887 ± 37 bd0.9923 ± 0.001 abc2925 ± 176411 ± 210.888 ± 0.026538 ± 44
SP01865 ± 36 bcd0.9922 ± 0.001 ab2853 ± 78435 ± 370.881 ± 0.027621 ± 65
SP401810 ± 53 ac0.9923 ± 0.001 abc2690 ± 154455 ± 470.903 ± 0.038615 ± 60
CS1787 ± 23 a0.992 ± 0.000 a2674 ± 149426 ± 400.916 ± 0.027560 ± 49
PWS1828 ± 40 abc0.9924 ± 0.000 abc2755 ± 76445 ± 400.890 ± 0.035658 ± 60
MWS1847 ± 35 bcd0.9929 ± 0.001 bcd2711 ± 132427 ± 180.914 ± 0.026581 ± 47
PLA1875 ± 31 bcd0.9928 ± 0.000 cd2838 ± 105443 ± 410.915 ± 0.015600 ± 72
SSA1895 ± 36 d0.9933 ± 0.000 d2815 ± 99464 ± 300.912 ± 0.010625 ± 53
Values are means ± standard deviation (n = 4 or 5). Treatments: NF, control without fertilisation; SP0, NKS; SP40, NKS plus 40 kg P/ha mineral superphosphate; CS, NKS plus 23.5 kg P/ha cattle slurry and 16.5 kg P/ha mineral superphosphate; PWS, NKS plus 40 kg P/ha potato waste struvite; MWS, NKS plus 40 kg P/ha municipal waste struvite; PLA, NKS plus 40 kg P/ha poultry litter ash; SSA, NKS plus 40 kg P/ha sewage sludge ash. Different letters beside values in a column represent significant differences between the treatments at p < 0.05.
Table 4. Average alpha diversity indices for each of the treatment groups (n = 5), including their standard deviations.
TreatmentObserved OTUs ± S.D.Shannon ± S.D.
NF175 ± 4.40 a4.56 ± 0.11 a
PLA174 ± 6.20 a5.1 ± 0.15 a
PWS173 ± 3.80 a4.55 ± 0.26 a
SP 40172 ± 9.30 a4.47 ± 0.33 a
CS172 ± 5.13 a4.62 ± 0.47 a
SP 0171 ± 6.40 ab4.72 ± 0.24 a
MWS167 ± 7.50 a4.48 ± 0.6
SSA153 ± 15.9 b4.3 ± 0.73 a
Values are means ± standard deviation (n = 5). Treatments: NF, control without fertilisation; SP0, NKS; SP40, NKS plus 40 kg P/ha mineral superphosphate; CS, NKS plus 23.5 kg P/ha cattle slurry and 16.5 kg P/ha mineral superphosphate; PWS, NKS plus 40 kg P/ha potato waste struvite; MWS, NKS plus 40 kg P/ha municipal waste struvite; PLA, NKS plus 40 kg P/ha poultry litter ash; SSA, NKS plus 40 kg P/ha sewage sludge ash. Different letters beside values in a column represent significant differences between the treatments at p < 0.05.
Publisher’s Note: MDPI stays neutral with regard to jurisdictional claims in published maps and institutional affiliations.

