Article

Predicting Embodied Carbon and Cost Effectiveness of Post-Tensioned Slabs Using Novel Hybrid Firefly ANN

1
Department of Building Construction and Structural Theory, South Ural State University, 76 pr. Lenina, 454080 Chelyabinsk, Russia
2
Department of Civil & Environmental Engineering, Western University, London, ON N6A 5B9, Canada
3
Young Researchers and Elite Club, Ahvaz Branch, Islamic Azad University, Ahvaz 1915, Iran
*
Author to whom correspondence should be addressed.
Sustainability 2021, 13(21), 12319; https://doi.org/10.3390/su132112319
Submission received: 11 October 2021 / Revised: 5 November 2021 / Accepted: 5 November 2021 / Published: 8 November 2021
(This article belongs to the Section Sustainable Materials)

Abstract

:
Post-tensioning has become a strong contender for manufacturing reinforced concrete (RC) members, especially for flat slabs in large-span structures. Post-tensioned (PT) slabs can lead to considerable material savings while reducing the embodied carbon (embodied CO2), construction time, and life cycle maintenance and repair costs. In this research, a novel hybrid Firefly–Artificial Neural Network (Firefly–ANN) computational intelligence model was developed to estimate the cost effectiveness and embodied CO2 of PT slabs with different design variables. To develop the dataset, several numerical models with various design variables, including the pattern of tendons, slab thickness, mechanical properties of materials, and span of slabs, were developed to investigate the sustainability and economic competitiveness of the derived designs compared to benchmark conventional RC flat slabs. Several performance measures, including punching shear and heel drop vibration induced by human activity, were used as design constraints to satisfy safety and serviceability criteria. The economic competitiveness of PT slabs was more evident in larger spans where the cost and embodied CO2 emissions decreased by 39% and 12%, respectively, in PT slabs with a 12-m span length compared to conventional RC slabs. Sensitivity analysis also confirmed that the cost and embodied CO2 emissions were very sensitive to the slab thickness by 86% and 62%, respectively.

1. Introduction

Post-tensioned concrete is a type of prestressed concrete where the concrete is strengthened via an arrangement of reinforcement held in tension. Steel cables, called post-tensioning tendons, are placed in plastic sleeves and positioned inside the concrete formwork before the concrete is poured. Once the concrete is poured and has gained sufficient strength, the cables are pulled at either end (tensioned) and anchored on the outer edges of the concrete. Using the post-tension (PT) technique, the behavior of reinforced concrete (RC) structural members in tension can be greatly enhanced, allowing the construction of longer spans and more slender structural components. Applying this technique in flat concrete slabs reduces the building height and results in substantial savings in conventional steel rebar reinforcement. Such savings in material consumption permit reducing the embodied carbon (embodied CO2) emissions and the overall construction cost, thus providing a sustainable design solution for the construction industry. Embodied CO2 is the carbon footprint of a material. It considers how much greenhouse gas (GHG) is released throughout the supply chain and is often measured from cradle to (factory) gate, or cradle to site (of use).
Previous research has reported the following advantages of PT slabs over conventional reinforced flat slabs [1,2,3,4]: (i) More economical design with a very high tensile strength; (ii) larger spans and greater slenderness resulting in reduced dead load; (iii) enhanced performance with respect to deflections and cracking and deflections under permanent load; (iv) higher punching shear strength achieved through an appropriate layout of the post-tension tendons; and (v) considerable reduction in construction time as a result of the earlier striking of real formwork slabs.
There is a dearth of research on the sustainable assessment of PT slabs. In general terms, sustainable construction means building with renewable and recyclable resources and materials, or through new technologies, e.g., post tensioning. Therefore, to address sustainability considerations, in this manuscript, the focus will be climate change (decreasing CO2 emissions) because of its current importance for sustainability. The existing limited research has mainly addressed structural considerations. In 1990, Foutch et al. [5] pointed out the advantages of using PT RC slab solutions according to design strength considerations. Previous research has confirmed that prestressing substantially improves the resistance of flat concrete slabs to punching shear [6,7,8]. From the sustainability perspective, the research conducted by Dane Miller [9] confirmed that by increasing the span length in PT slabs from 6.67 to 13.3 m, the consumption of concrete and steel reinforcement can be decreased by 21.5 and 34.4%, respectively. A study by Abdelrahman [10] has shown that PT concrete slabs generally contain 30 to 50% less steel reinforcement than conventional RC flat slabs when designed for equivalent load, span, and durability performances.
Meanwhile, previous research on sustainable structural design in the open literature has mainly considered structural systems comprising composite or RC materials fabricated using two or more heterogeneous materials. In particular, considerable research has been conducted to optimize the design of RC flat slabs. For instance, optimization of the cost and mechanical strength requirements specified in design codes for concrete flat slabs was investigated by Sahab [11] using the genetic algorithm (GA) approach and compared with the traditional strength-based design approach. The environmental impact of one-way RC flat slabs was evaluated by Ferreiro-Cabello et al. [12] using a deep-learning-based optimum design model. The design variables in the proposed model were limited to four geometrical parameters, while the mechanical properties of structural materials remained constant. Lee et al. [13] suggested that a more reliable, eco-friendly optimum design can be attained if material strength is set as one of the design parameters. They claimed that such a strategy would enhance the possibility of a reduction in embodied CO2 emissions.
Overall, existing pertinent studies primarily address the structural design considerations of PT slabs, while no systematic research exploring the sustainability and cost-effectiveness of PT slabs compared to conventional concrete flat slabs could be retrieved in the open literature. Meanwhile, international standards such as ACI 318-18 [14] generally satisfy the static serviceability related to vertical deflection limitations, which does not adequately address serviceability issues pertaining to the human-induced vibration of flat concrete [15]. This research aims to determine the environmental and cost advantages that are achievable through the application of post-tensioned slabs compared to conventional RC slabs. A total of 68 PT and 9 conventional RC flat slab models for residential buildings with different geometries and span lengths were developed. To satisfy the criteria of safety and serviceability, punching shear and vibrations induced by human activity were defined as the design constraints. In addition, in the present study, a novel hybrid Firefly–Artificial Neural Network (Firefly–ANN) model was developed to estimate the cost and embodied CO2 emissions of PT slabs made with different designs variables. The study examines the ratio of concrete, steel, and tendon in the distribution of cost and embodied CO2 emissions of PT slabs. In addition, the sensitivity of the overall cost and embodied CO2 emissions to the geometrical and mechanical parameters was investigated. The findings should be useful for engineers to accurately assess PT RC flat slabs’ embodied carbon and cost performance, which can contribute to green design and more sustainable reinforced concrete structures.

2. Problem Statement

Reducing CO2 emissions in the construction sector has been pursued in various ways since buildings yield significant amounts of CO2 emissions over their entire life cycle, including the manufacturing of building materials, transporting, construction, operation, and decommissioning. Previous research indicated that the construction, operation, and demolition stages are responsible for approximately 13%, 85%, and 2% of CO2 emissions, respectively [16,17,18].
Several researchers have explored the impact and significance of the construction phase concerning CO2 emissions [19,20,21]. Buildings use a wide range of construction materials, and the manufacturing of each material consumes energy and emits CO2. González and Navarro [22] recommended using low-environmental-impact materials to decrease CO2 emissions by up to 28% in the construction phase. Rattanashotinunt et al. [23] proposed approaches that use recycled industrial by-products and reduce the manufacturing process to lower raw material extraction and consumption over the construction phase. Similarly, high-strength steel reinforcement and concrete would be effective techniques for reducing CO2 emissions of reinforced concrete (RC) structures. For instance, Tae et al. [24] concluded that using high-strength concrete resulted in lowering the number of reinforcement rebars in RC structures and extending the life span of buildings. Moreover, Cho and Na [25] posited that using high-strength reinforcing rebars in RC structures decreased CO2 emissions.
Concrete is the world’s most-consumed construction material. The manufacture of ordinary Portland cement (OPC) is responsible for the majority of CO2 emissions of RC structures representing around 5 to 8% of the world’s greenhouse gas (GHG) emissions [26]. In recent decades, manufacturing eco-efficient concrete using industrial by-products has received increasing attention. The manufacturing of sustainable concrete has resulted in CO2 savings since OPC is partially replaced with industrial by-products, including ground blast furnace slag (GBFS), a by-product of the steel industry, or fly ash (FA), a by-product of coal-fired power plants. Tatiana García-Segura et al. [27] investigated the quantified GHG emissions as a function of the cement used over the concrete life cycle and examined whether the reduction in the production emissions of “green” concrete compensates for the reduced CO2 capture and durability. They concluded that partially replacing OPC with FA decreased the material emission factor. However, more significant reductions were achieved using GBFS, where the quantity of OPC that could be replaced was higher. In addition, they pointed out that green mixture designs with high rates of OPC replacement attained a decreased service life by around 10% due to the higher rate of carbonation.
Life Cycle Assessment (LCA) is a tool that can be used to identify ways to decrease the environmental impact of a product or process and to inform decision makers of the consequences of changes to the product or process. LCA encompasses all aspects of a process or product from “cradle to grave”, including material extraction, transport, production, maintenance, and removal or recycling. The LCA of concrete consists of different stages including raw material extraction, cement production, and use stage, as shown in Figure 1 [28]. An LCA of concrete would demonstrate reduced CO2 emissions from cement production, as well as concrete’s service life and recyclability [29]. OPC is mainly composed of calcium silicate minerals. The raw materials are extracted and transported to the manufacturing facility to be crushed and ground before entering a large rotary kiln where materials reach temperatures of more than 1400 °C. Gypsum is added to the clinker to adjust the setting time.
In the open literature, there is currently no systematic research examining the LCA of PT slabs. Conventional concrete consumes a large quantity of cement, which emits high amounts of CO2 into the atmosphere. Although PT slabs consume relatively lower materials and attain better durability performance, the cost effectiveness and embodied CO2 benefits associated with slabs with different bay lengths have not received enough attention. This research intends to identify the variation of cost and embodied CO2 emission versus the mechanical properties and geometry of PT slabs so that designers can estimate and manage the final design output.

3. Methods

3.1. Influential Variables and Dataset

In this research, both conventional and PT-reinforced concrete flat slabs were designed based on the provisions of the ACI 318-18 using the same design parameters. In total, 68 PT and 9 conventional RC flat slab models for residential buildings with different geometry and span lengths were developed. Figure 2 illustrates the area and geometry of all investigated design cases. The slab models were initially designed in SAFE 2016, the academic version [30], and the outcomes were verified and confirmed by industrial partner specialists in PT floor design [31]. In each design case, the CO2 and cost were compared and comprehensively analyzed in relation to the main design parameters and variations in material composition and governing constraints of the derived designs.
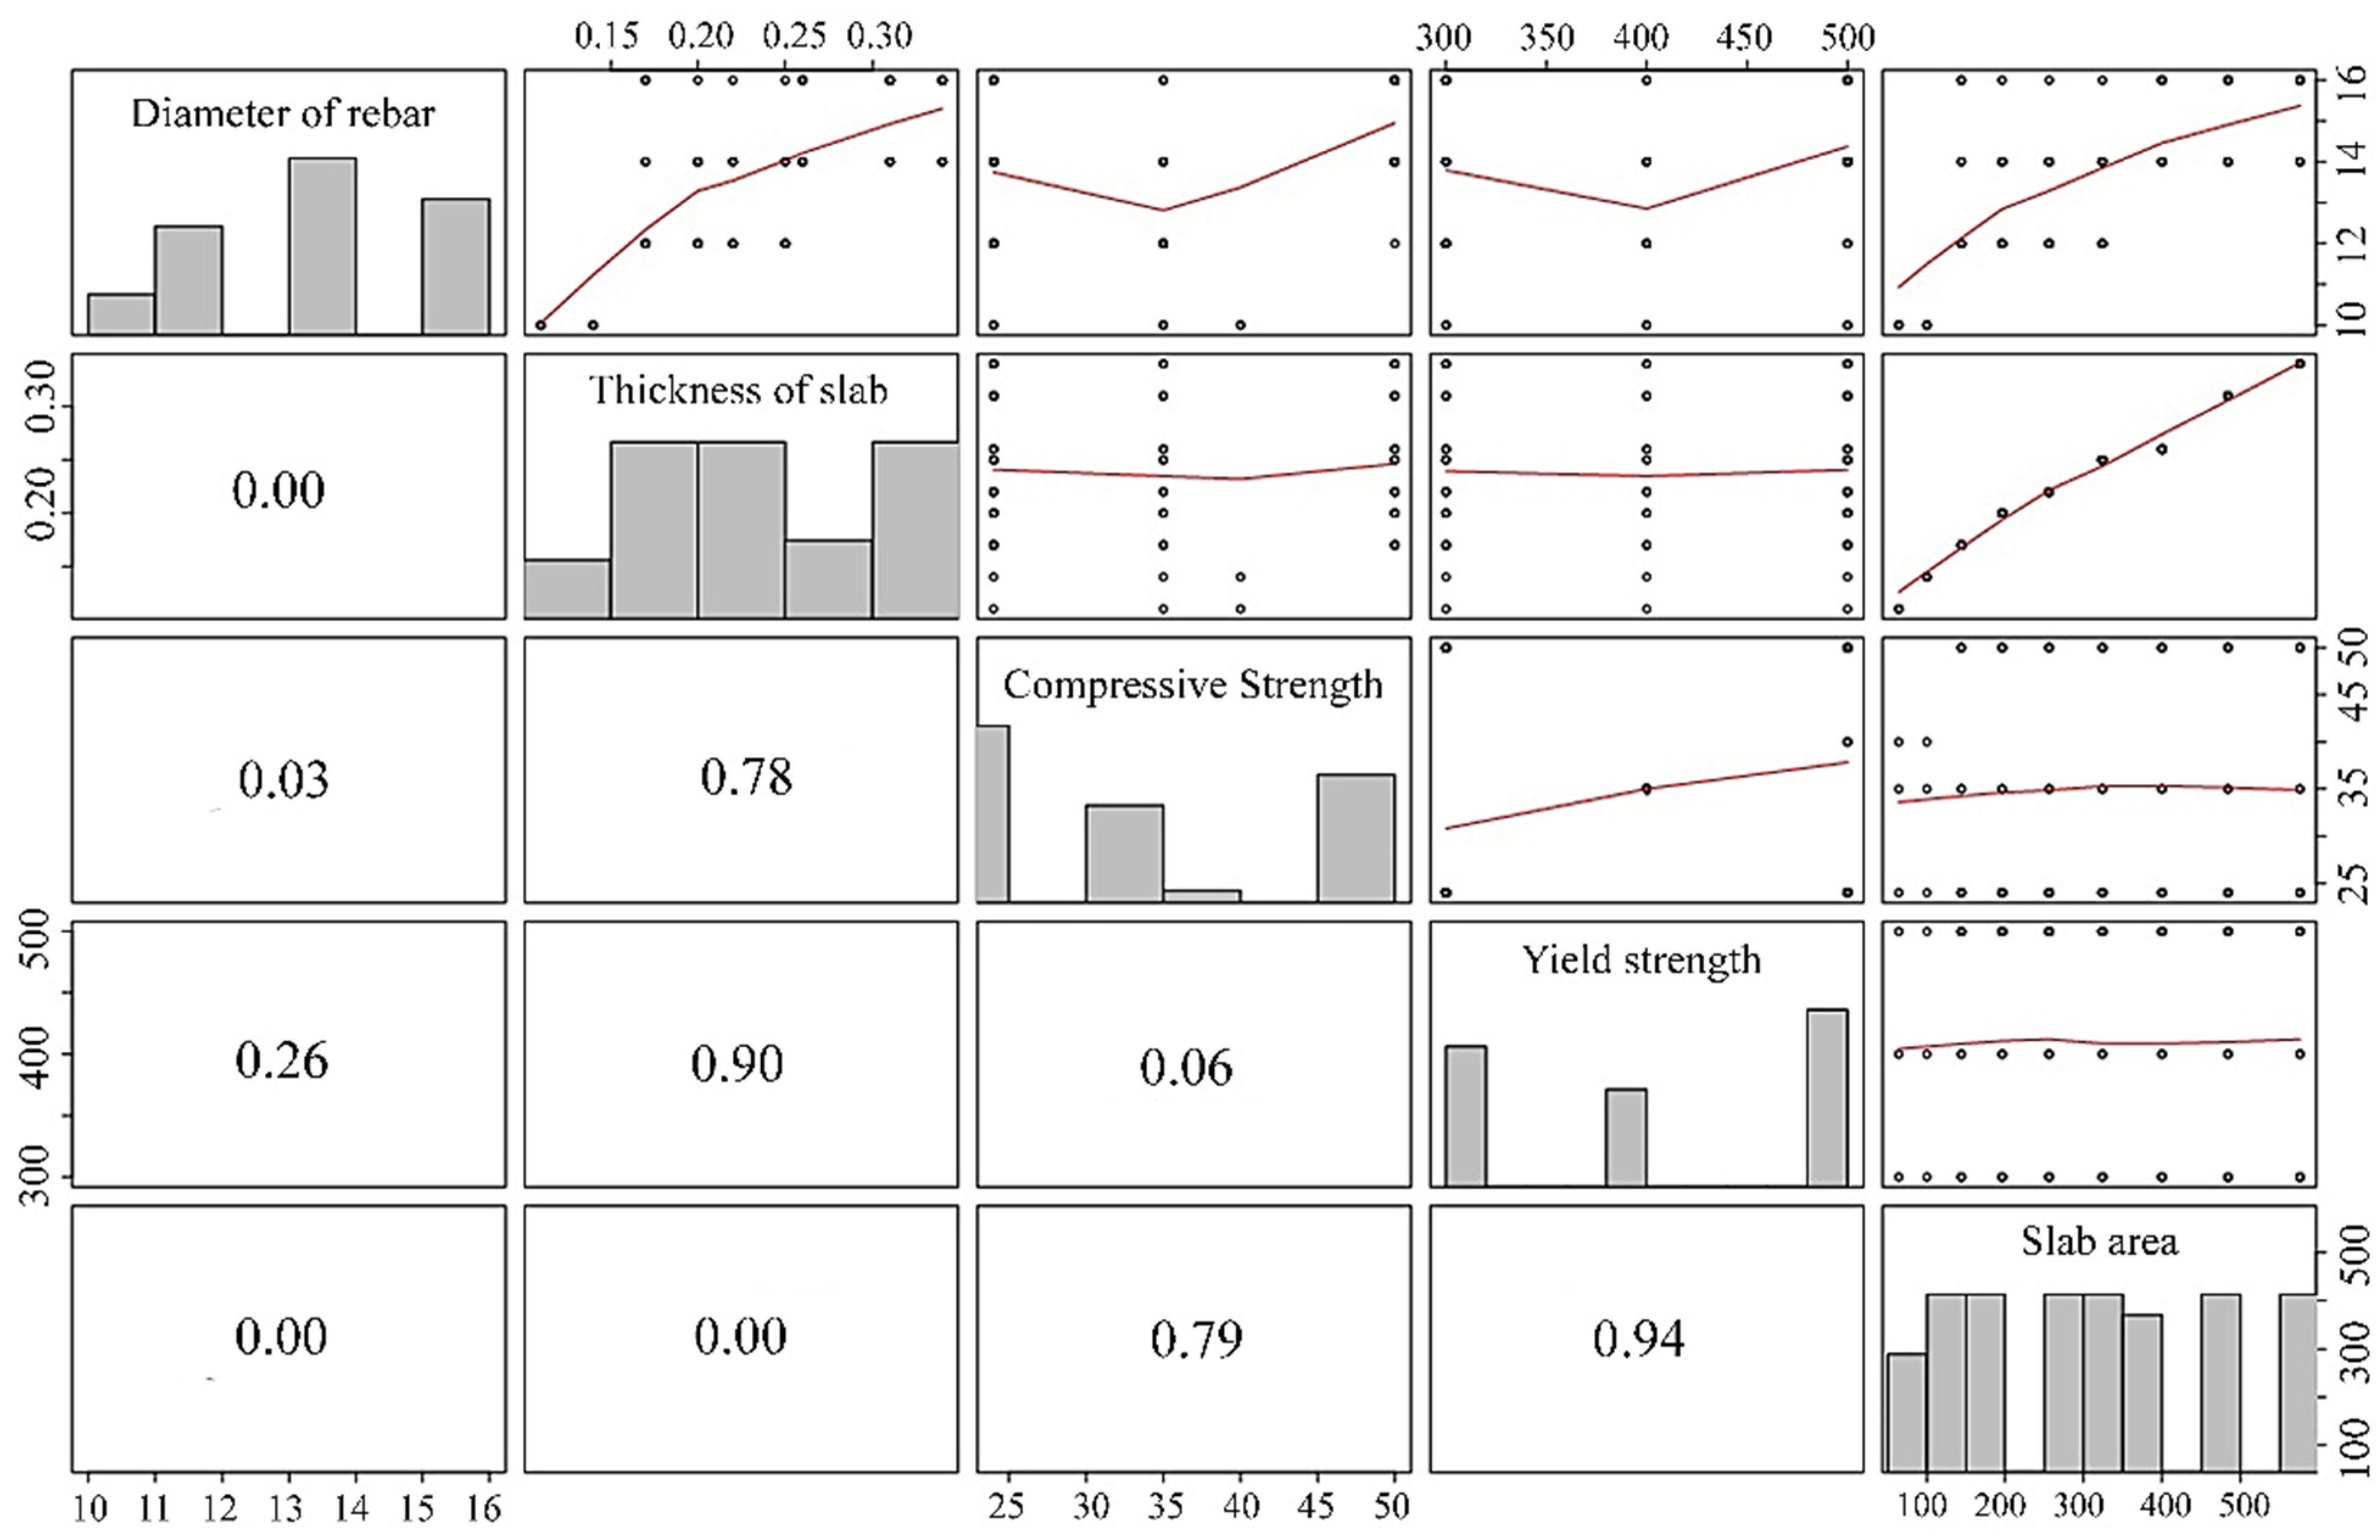
The compressive strength of concrete ( f c ) and slab thickness ( t c ) were considered as the design variables related to concrete, while the yield strength ( f y ) and diameter of the steel reinforcement ( d s ) were the design variables related to steel. The tendon pattern, either distributed or bonded, was set to be a tendon variable. Tendons are normally made of seven wires made of high-strength steel, wound together and placed inside a plastic duct. At each end, a PT anchor is installed, and these are fitted in pockets embedded into the slab edge. When the strands are stressed, the wires will stretch—about 100 mm for a 15 m strand—to apply about 146 kN of load. After stressing, the tendon is cut off and the pocket in which the anchors are located is filled with grout for corrosion protection.
Various slab design cases were produced by combining these design variables. The ranges of the design variables were selected in compliance with the practical values recommended in industrial practice. Table 1 illustrates the details and ranges of the above-mentioned design variables.
The current strength-based approaches for RC flat slabs attempt to maximize economic effectiveness through satisfying the strength requirement recommended by design codes using a minimal size of the structural member and thus a minimal quantity of materials. The calculation of embodied CO2 emissions concerned in the current research for each design case was characterized by the major processes associated with raw material extraction and material production stages in compliance with ICE [32]. The data for embodied CO2 emissions and cost were based on the results of an input–output life cycle assessment (LCA) analysis and the data frequently used in the existing literature that reflect the accepted practice in the construction industry [33,34,35]. The following equations were considered to estimate the embodied CO2 emissions and cost for each flat slab design case.
f co 2 = v c ρ c E c + v s ρ s E s + v t ρ t E t
f c o s t = v c ρ c C c + v s ρ s C s + v t ρ t C t
where v , ρ , E , and C denote the volume, density, unit embodied CO2 emissions, and cost, respectively, of the structural materials in the slabs. Subscripts c, s, and t represent concrete, steel, and tendon, respectively. In Equations (1) and (2), the v c , v s , and v t indicate the amounts of concrete, steel, and tendon, which are determined by the design variables t c ,   d s , and tendon pattern distribution, as outlined in Table 1, for the various derived design cases. In this study, a typical value for ρ c was taken as 2400   kg / m 3 , while ρ s was set according to the density of the steel reinforcement size ( d s ), which ranges from 10 to 16 mm. The prestressing tendons were mono strands (100 mm2 in cross-section) where the average rupture stress ( f p m ) was 1897 MPa and the stress at 0.1% residual strain was 1689 MPa. Table 2 shows the unit of embodied CO2 emissions and cost for different strengths of steel and concrete.
It was not always possible to determine complete boundary conditions for the embodied energy and carbon data in the original studies. A common example was the energy that was not traced completely back to the earth or electricity that was not traced all the way upstream. The ICE database has cradle-to-gate boundaries, but a robust assessment of the carbon released would consider whole-life implications, including operation and end of life, i.e., cradle-to-grave. For materials with high embodied energy and high density such as concrete, the difference between cradle-to-gate and cradle-to-grave could be considered reasonably negligible. In contrast, the difference is significant for materials with a very low cradle-to-gate embodied energy per kilogram, such as fine and coarse aggregates.
The product stage of concrete was divided into the raw material stage, the transportation stage, and the manufacturing stage. The raw material stage refers to CO2 emission during the production of the major components of concrete such as cement, aggregate, and water. For the transportation stage, CO2 emissions occur during the hauling of raw materials to the ready-mixed concrete manufacturing plant. In the manufacturing stage, CO2 emissions emanate from the electricity and oil used in concrete batch plants. The transport distance and concrete technology were the same for all the mixtures in the ICE database. The only difference was the concrete grade.
The embodied carbon or embodied CO2 comes from the embodied energy consumed to extract, refine, process, transport, and fabricate the material or product (including buildings). It is often measured from cradle to (factory) gate, cradle to site (of use), or cradle to grave (end of life). Therefore, the embodied carbon footprint is the amount of carbon (CO2 or CO2 emission) to produce a material. The embodied CO2 unit in Table 2 was estimated based on the life cycle inventory database constructed by ICE and some other references [33,36,37], where the embodied CO2 was estimated from the embodied CO2 emission factors of all energy sources for the given materials’ production, from cradle to (factory) gate. The carbon footprint of concrete varies because of the required compressive strength. Nevertheless, the aggregate properties and operation standards remain constant for all case studies.
According to Kajaste and Hurme [38], geographical differences in CO2 emissions from cement and steel production are the reason for developing regional datasets. They analyzed regional CO2 emissions of the cement industry by applying a climate impact management matrix on a cradle-to-gate basis, which resulted in datasets to estimate regional emission data covering over 77% of the world’s cement production. However, the ICE data for carbon and energy would have been sourced from within the British Isles. Nevertheless, for most materials, this was not feasible, and embodied energy data from international sources had to be adopted using, for instance, European and worldwide averages. Considering the datasets developed by Kajaste and Hurme, which indicated national differences in fuel sources and electricity generation, preference should be given to embodied carbon data from UK sources.

3.2. Design Constraint for Safety and Serviceability

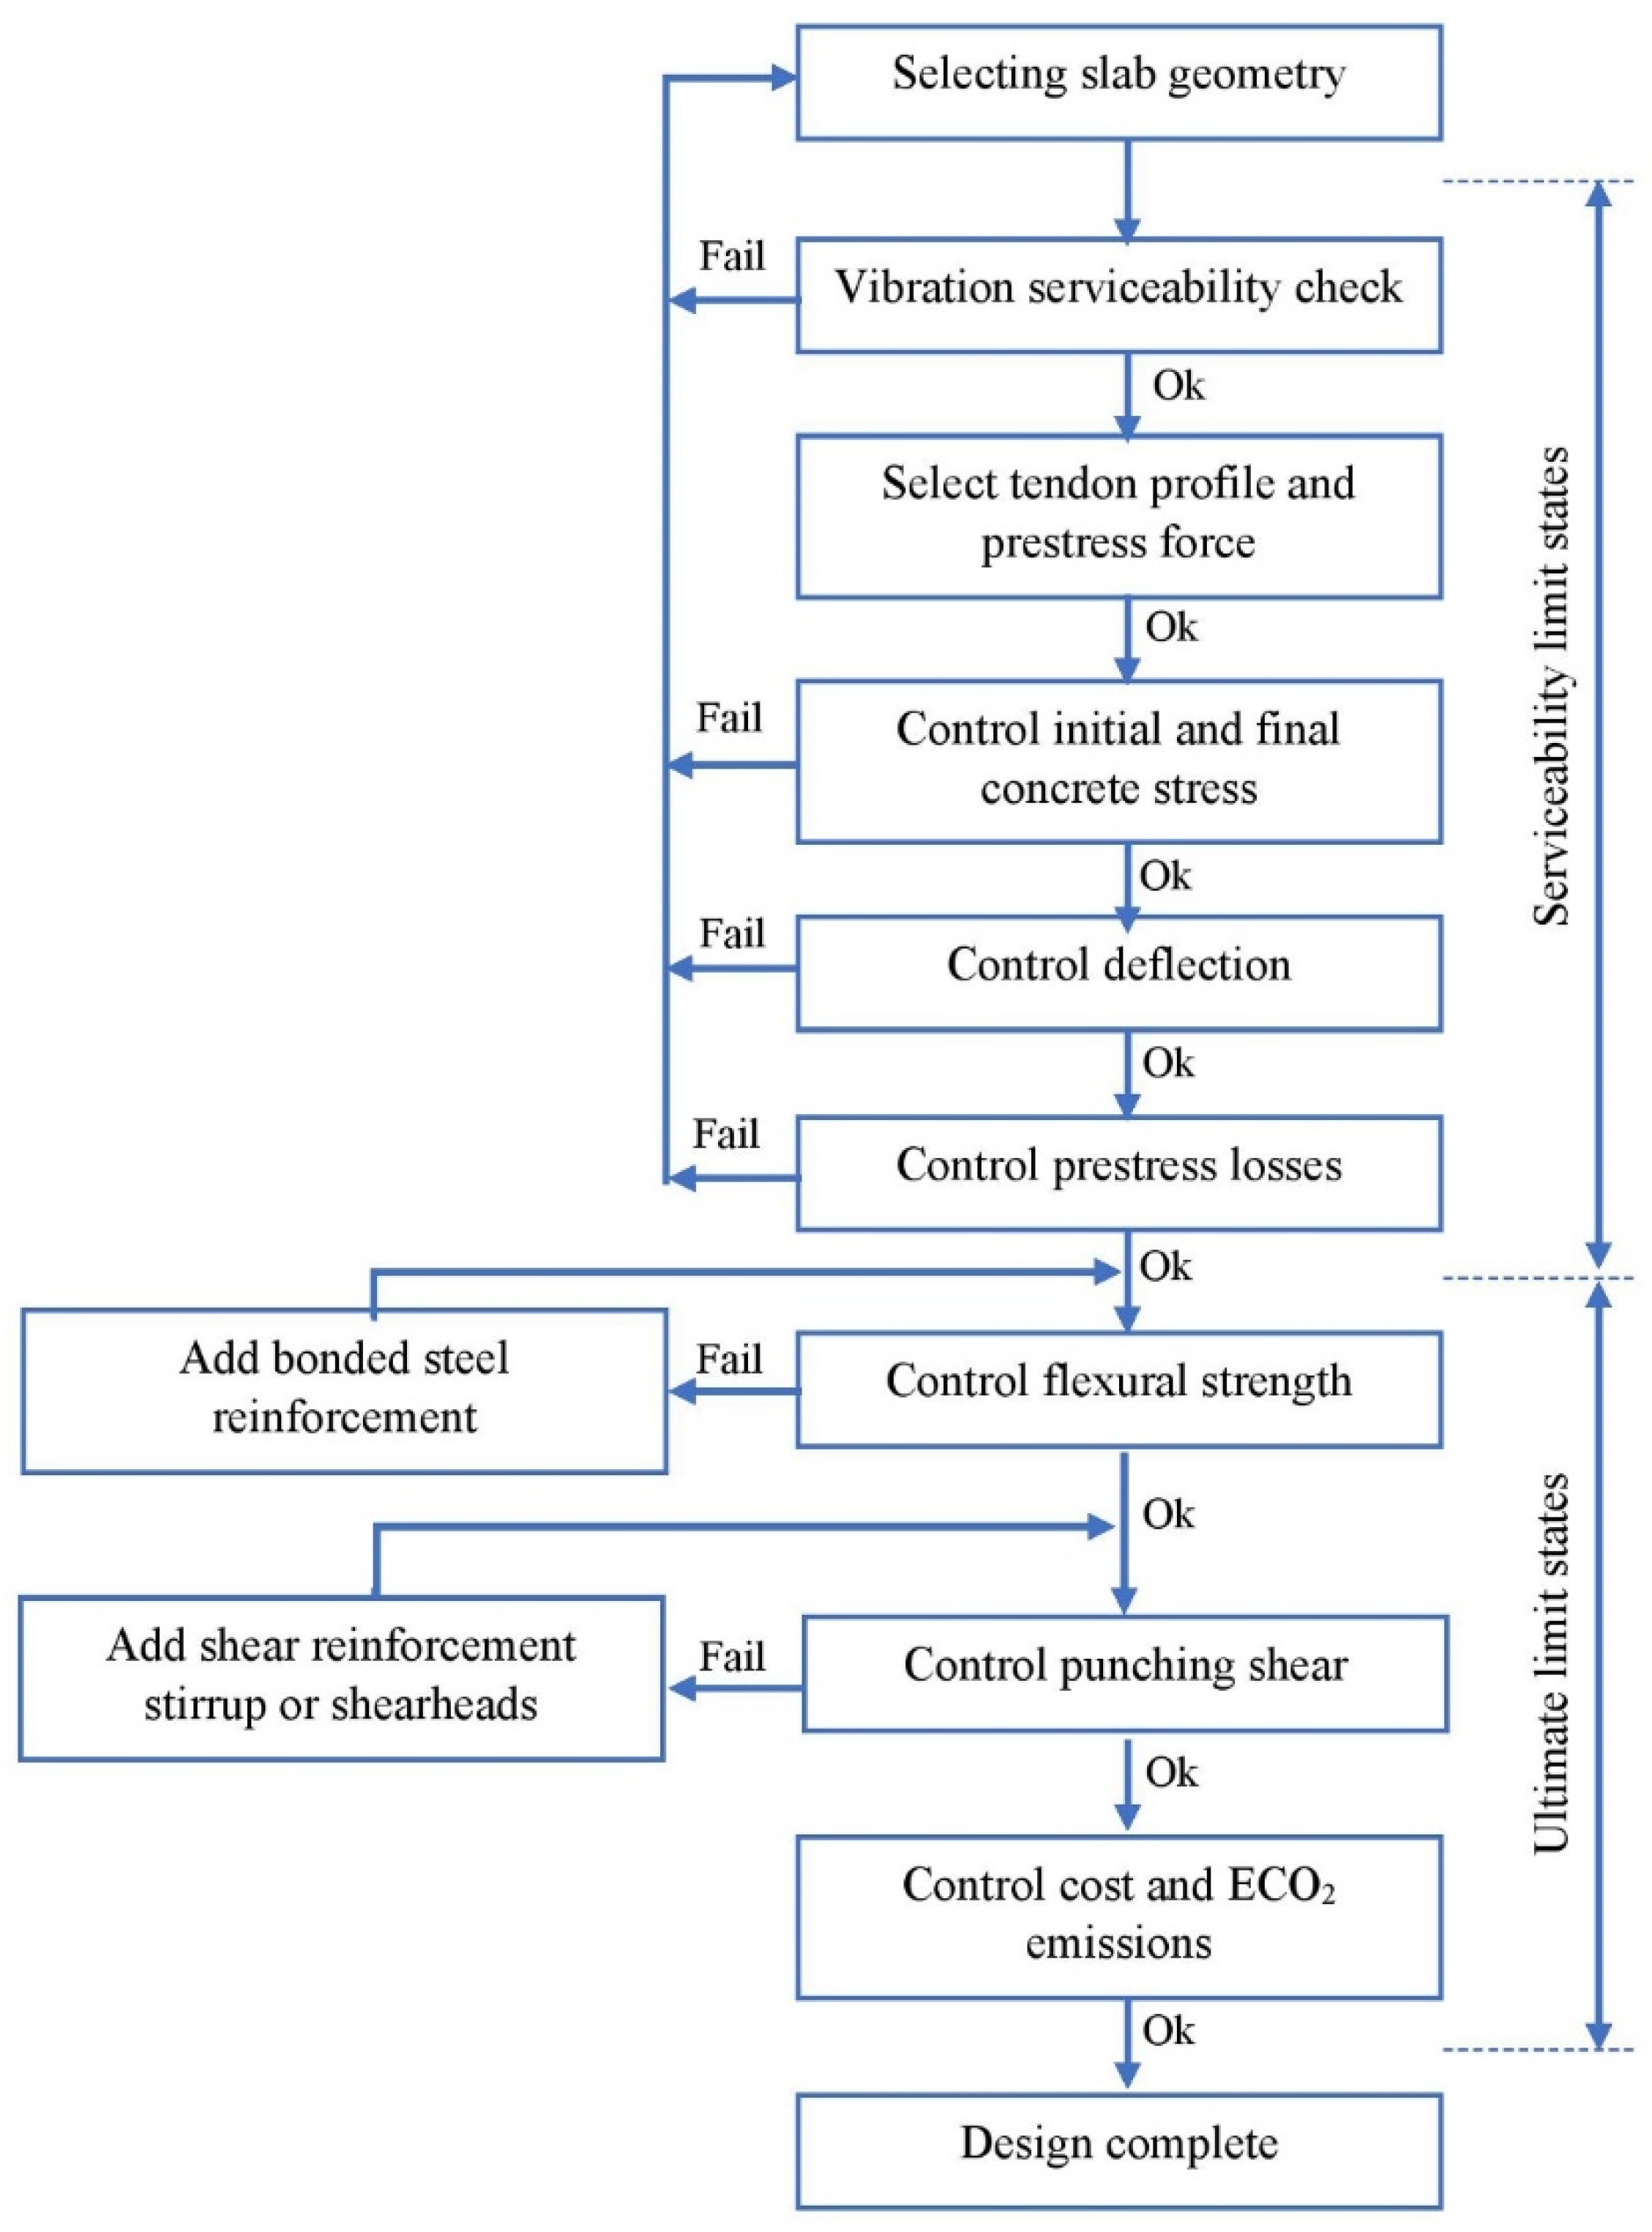
The final design of PT RC slabs should satisfy the criteria of safety and serviceability recommended by ACI 318-18 regarding the span-to-depth ratio, minimum slab reinforcement, punching shear strength, and heel drop vibration. These criteria were reflected as constraints in the design of each PT slab case. Figure 3 depicts the proposed design flowchart for the PT floor slabs in compliance with ACI 318-18.
According to the pertinent ACI 318-18 design provisions, the span-to-depth ratio for PT flat slabs with a total imposed load of 5 kN/m
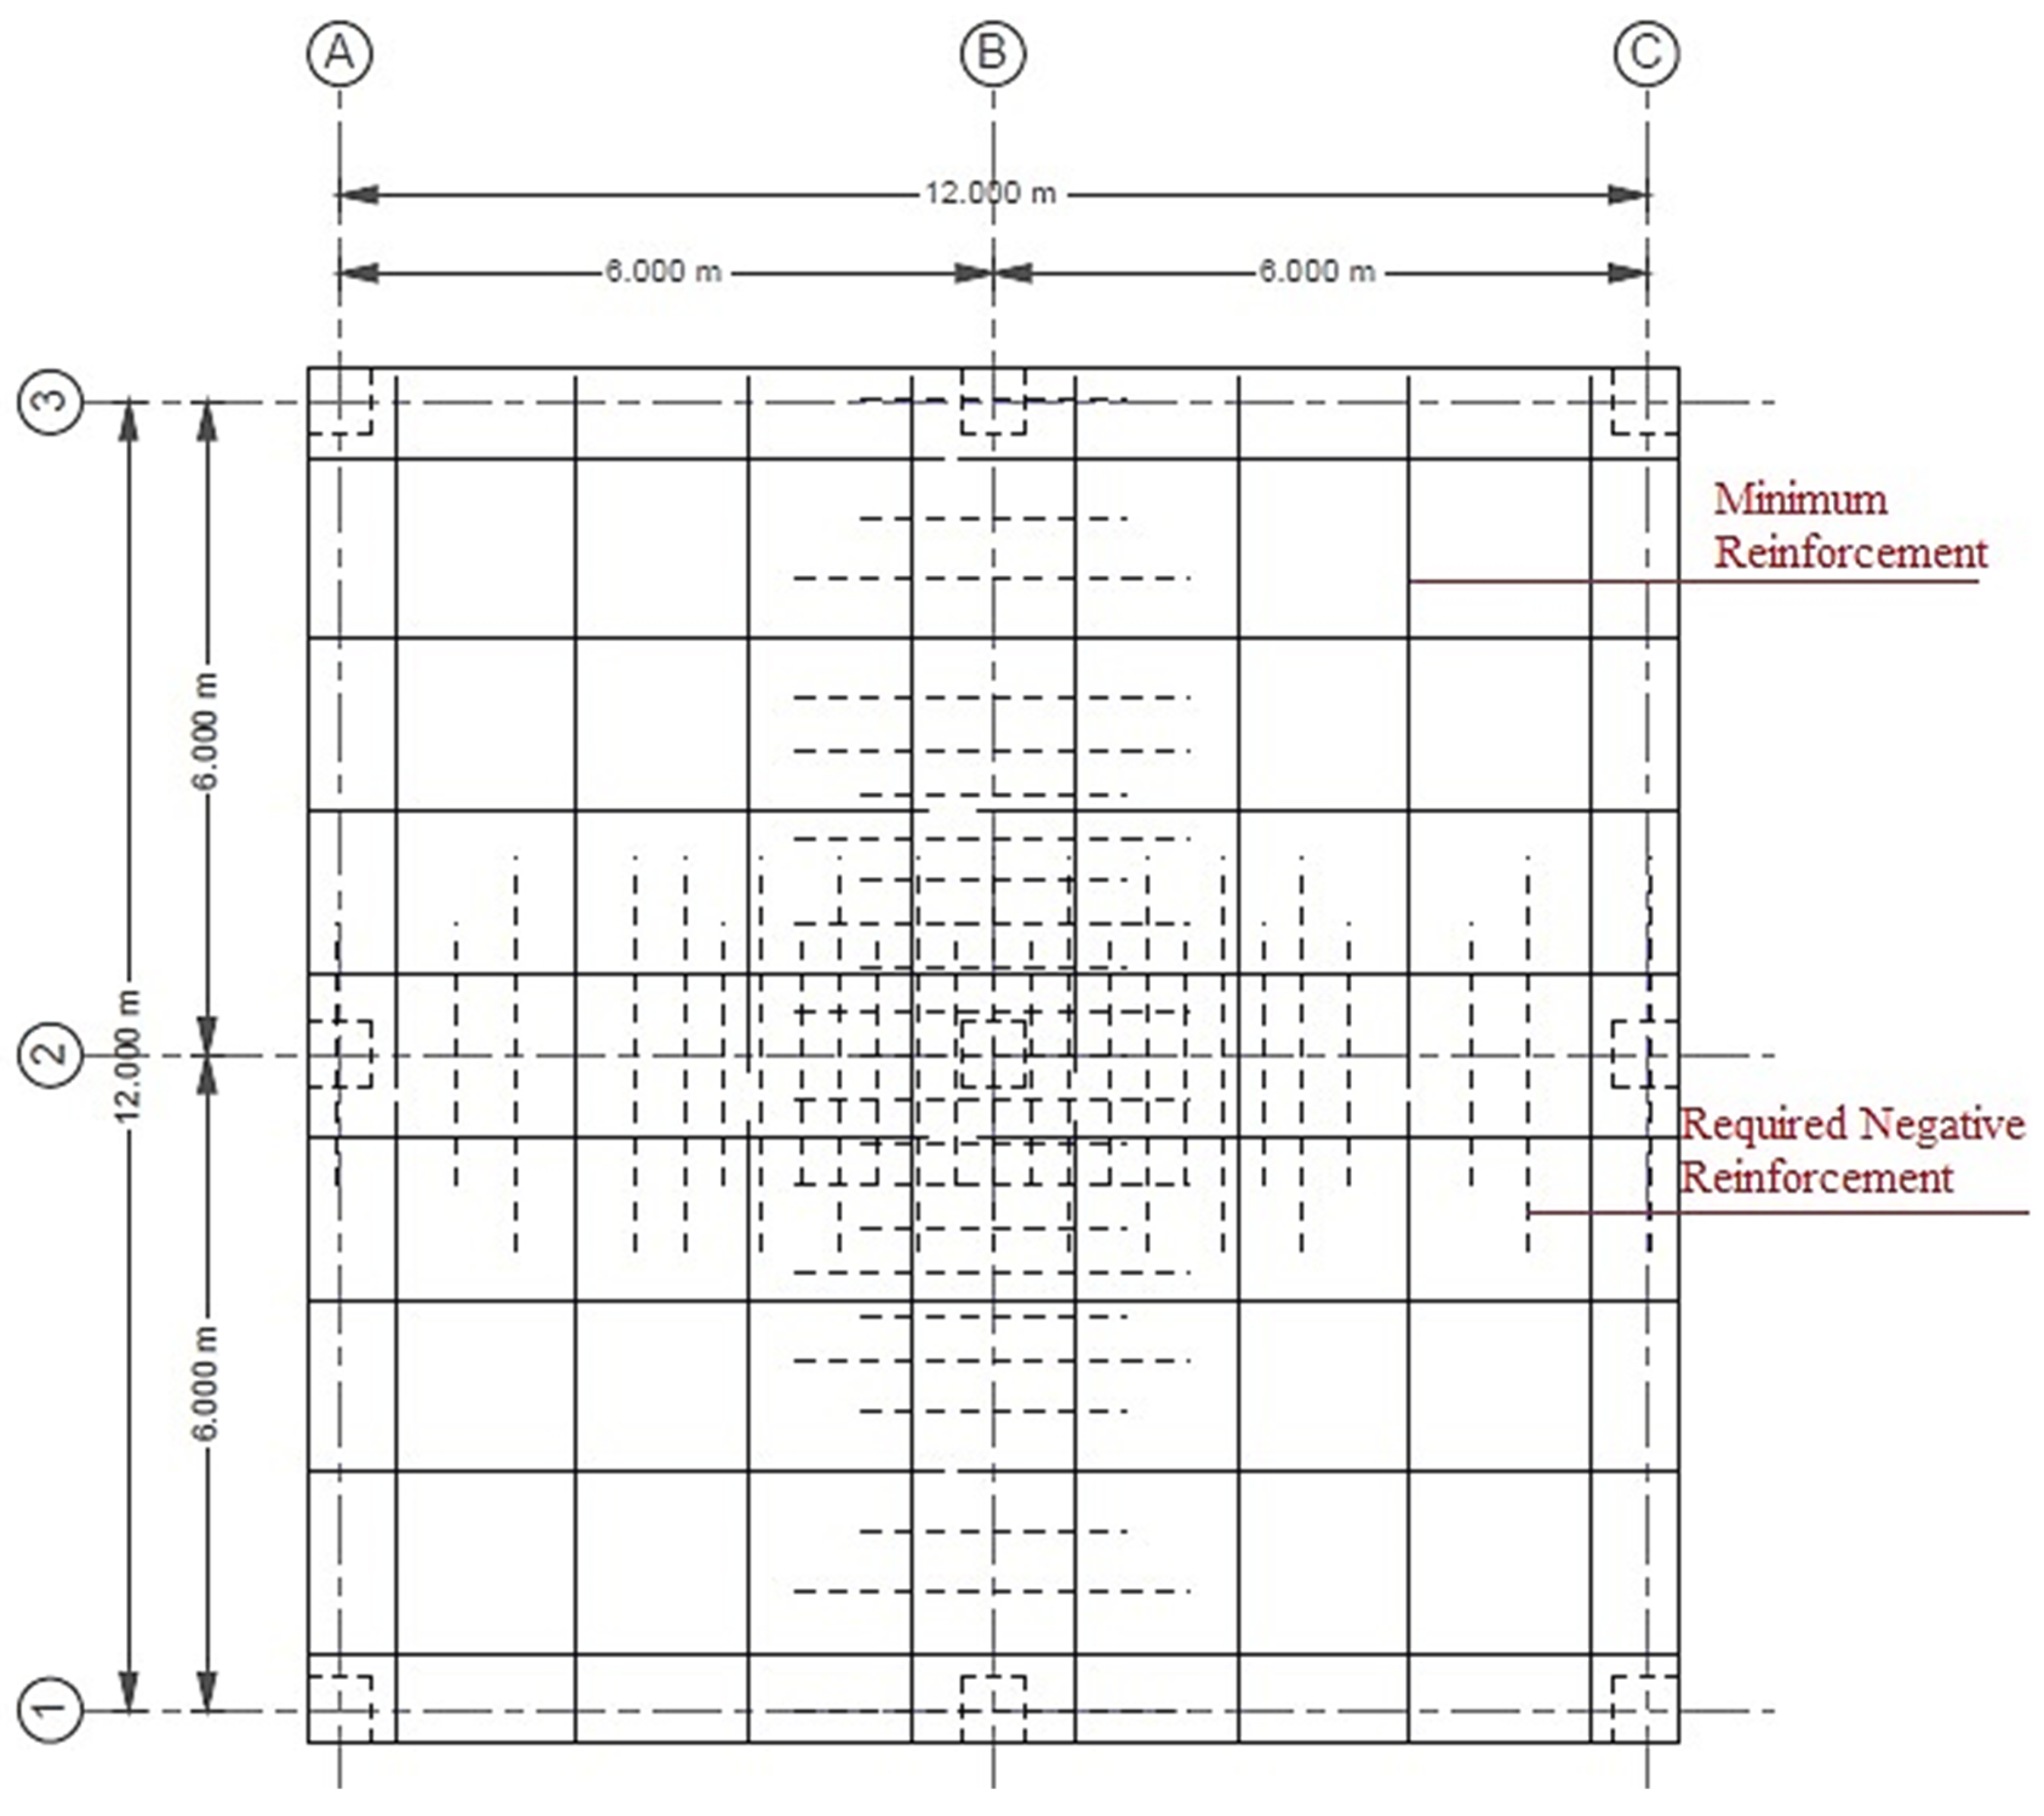
2 is recommended to be 36. In negative moment areas at the column support, the constraint for the minimum area of bonded reinforcement at the top of the PT slab in each direction is expressed using Equation (3), where A c f is the larger gross cross-sectional area of the slab-beam strip in the two orthogonal equivalent frames intersecting the column in a two-way slab system.
A s , m i n = 0.00075 A c f
In addition, once the spacing of tendons exceeds 1.37 m, additional bonded shrinkage and temperature reinforcement is required between the tendons at slab edges, extending from the slab edge for a distance equal to the tendon spacing. Figure 4 depicts the steel reinforcement distribution for a typical slab with a 6 m bay.
The punching shear strength of flat RC slabs is typically controlled by the concrete strength and geometric parameters of the slab and columns. In a flat RC slab without shear reinforcement subjected to a centered axial load by an isolated column, two categories of orthogonal bending moments, Mφ producing tangential stresses and Mr producing radial stresses, are developed due to the bidirectional flexural action of the slab. According to ACI 318-18, the concrete punching shear stress capacity of a two-way prestressed section can be taken as:
v c = ( β p λ f c + 0.3 f p c ) + v p
β p = min ( 0.29 ,   0.083 ( α s d b 0 + 1.5 ) )
where β p is the factor used to compute v c in the post-tensioned slab; b 0 is the perimeter of the critical section; f p c is the average value of f p c for the two directions ≤ 3.5 MPa and ≥0.9 MPa; v p is the factored vertical component of all prestressed forces crossing the critical section; and α s is the scale factor based on the location of the critical section (40 for interior columns). In this study, all PT slab cases were designed without shear reinforcement, and therefore the applied punching shear loads were lower than the allowable punching shear stress of Equation (4).
The vibration serviceability limit state is an important design consideration for two-way PT slabs. However, it is not always adequately addressed by several international design standards. As shown in Figure 3, the serviceability vibration check is the most important step in the PT floor design process and should be controlled once the load, slab geometry, and material properties have been defined. The frequency tuning and response calculation methods are the most adopted approaches for evaluating the vibration serviceability limit state in PT floors. The frequency tuning method sets the natural frequency of the PT floor above frequencies sensitive to resonating once excited by the lower harmonic of foot drop heel forces. The response calculation method is a performance-based approach concerned with determining the vibration response of a PT floor under the foot drop heel forces. Aalami [39] proposed a simplified procedure based on the response calculation method in which the parameters governing the vibration response of a PT floor system are its modulus of elasticity, mass, damping, degree of cracking, if any, and post-tensioning. In this simplified model, the floor system and its superimposed load are considered for the mass calculation. Since the elastic modulus for vibration analysis is larger than corresponding static values, the recommended value is 25% higher than the static modulus. The damping also has high variability that is difficult to estimate before the PT floor is placed in service. According to Allen et al. [40], the damping varies at 2–3% for bare concrete PT floors and 5–8% in the case of full-height partition walls. In concrete slabs, cracking decreases the floor stiffness and, therefore, decreases its natural frequency. Nevertheless, for post-tensioned floors designed according to ACI 318-18, allowable tensile stresses are relatively low; thus, such a decrease in stiffness is not essential.
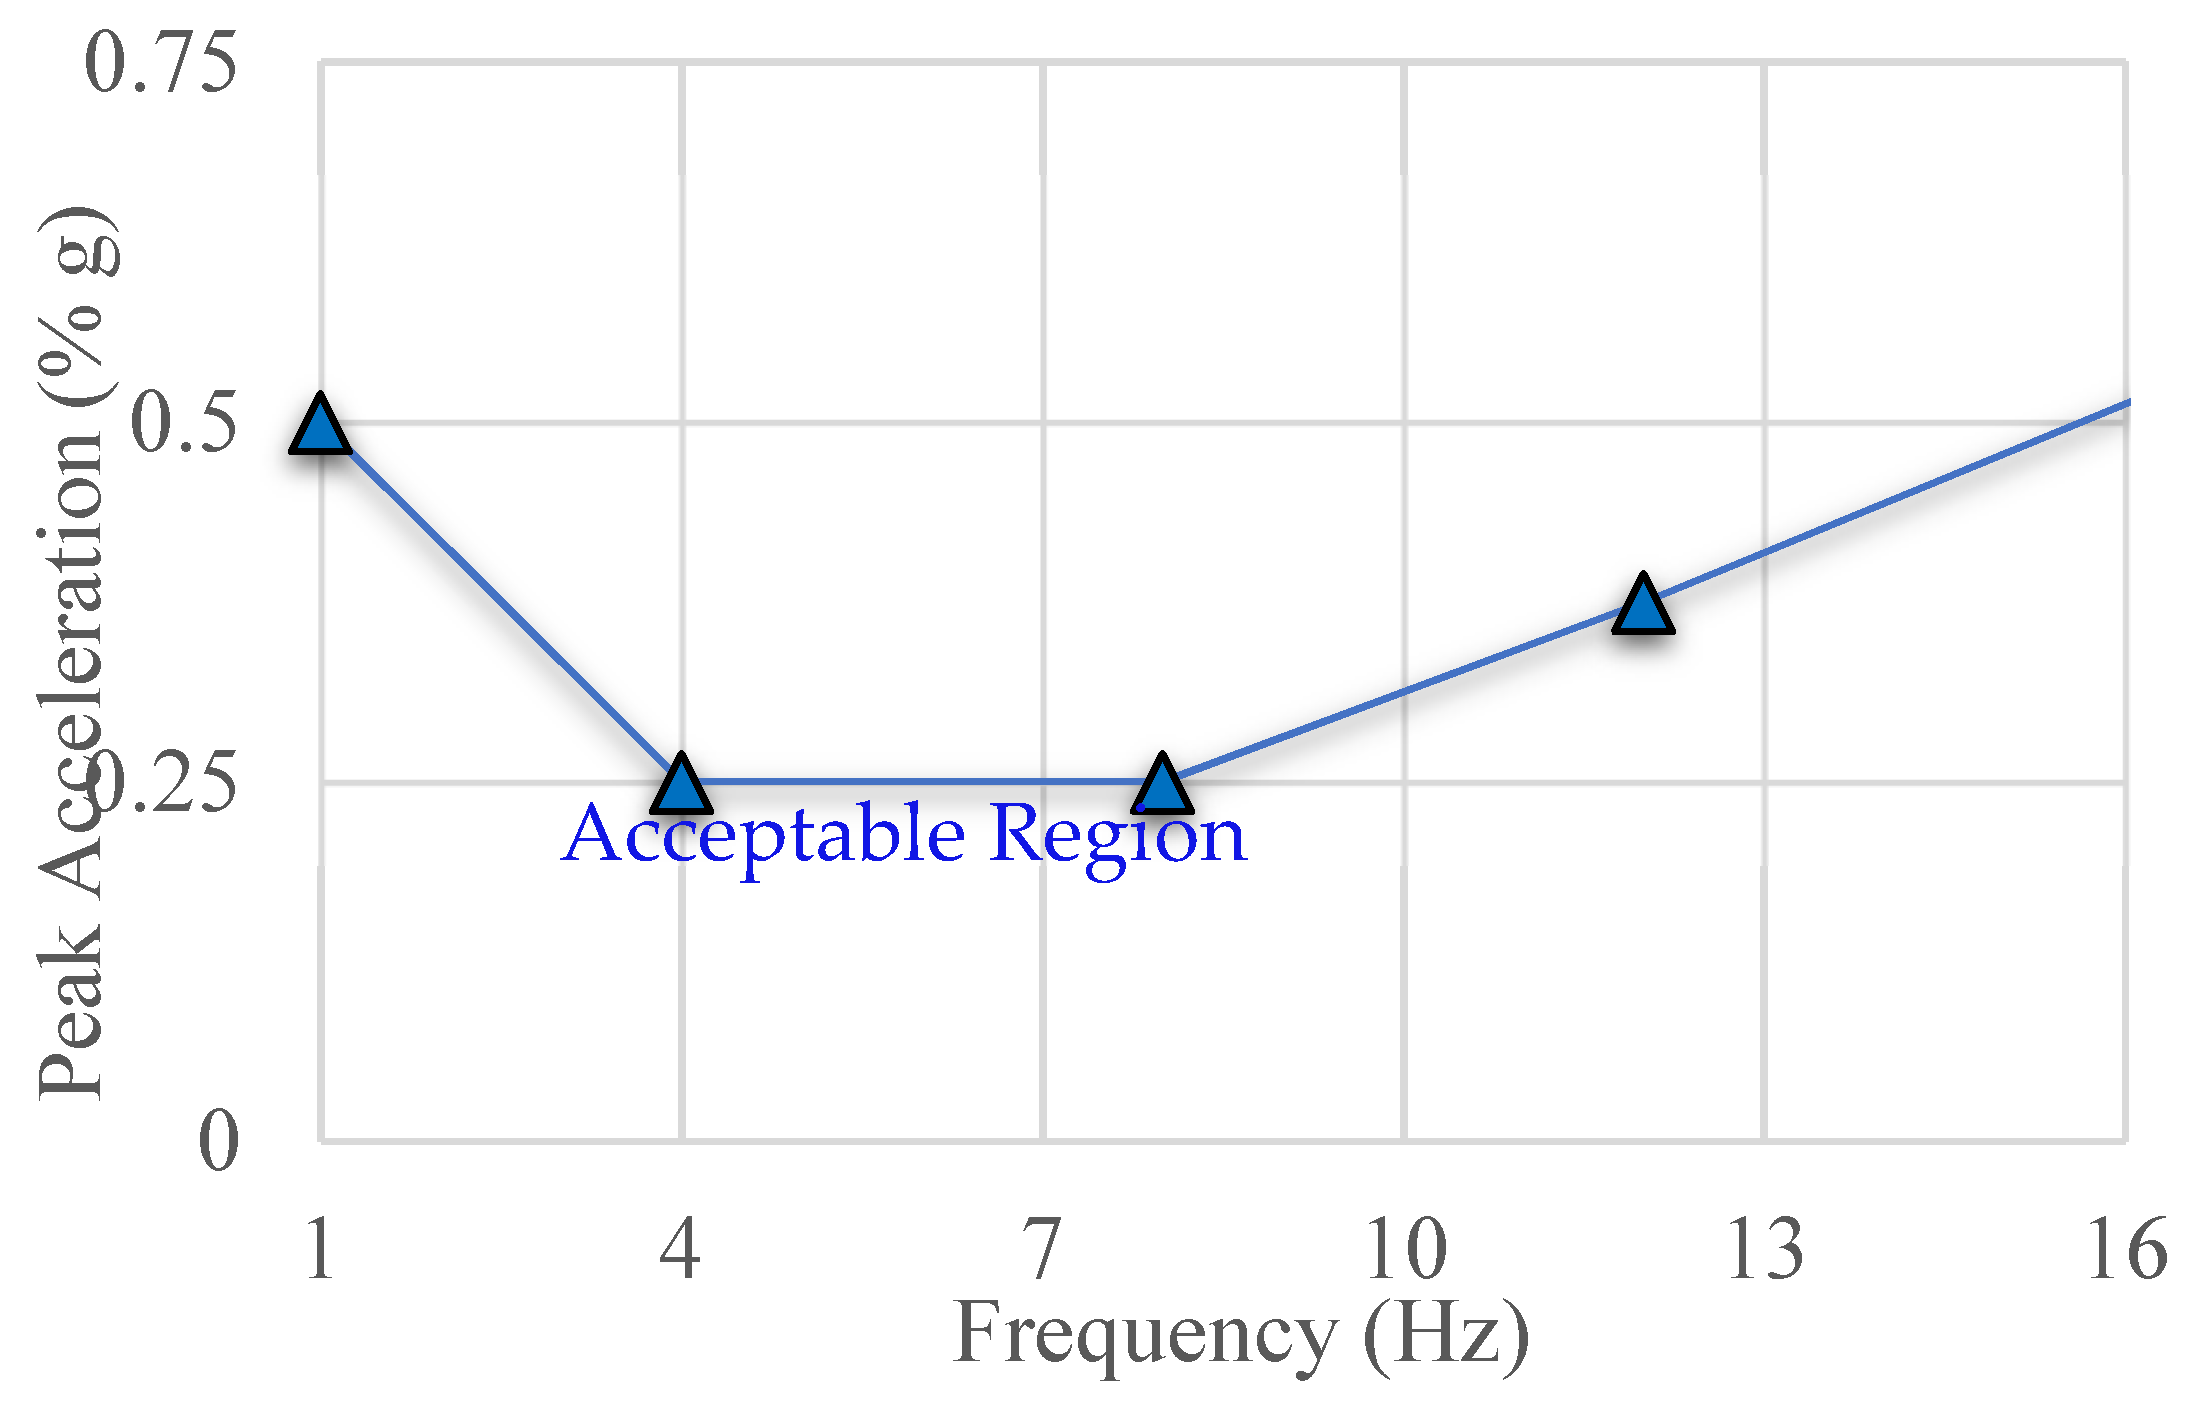
The perception of floor vibration and whether it is exasperating is highly subjective and differs from reference to reference. The Canadian Steel Design Code [41] provides the perceptibility of foot drop vibration for several floor-damping levels. The Applied Technology Council [42] addresses the same issue and recommends a threshold of human sensitivity to vertical vibration, as depicted in Figure 5 [43]. Generally, there is a relationship between the floor response acceleration with different natural frequencies and perceptibility levels. It is widely accepted that humans are most sensitive to vibration for frequencies ranging between 4 and 8 Hz, while more significant acceleration can be tolerated at lower or higher frequencies.
To determine the vibration characteristics of PT floors, the natural frequency and its associated peak acceleration should be identified. Apart from commercial programs, several analytical models are available to estimate the natural frequency of RC PT floors. The simplified procedure proposed by Aalami [44] recommends the following empirical equation to estimate the first natural frequency ( f ) of PT slabs with rectangular panels and uniform thickness:
f = c a 2 φ   where   c = E h 3 12 ( 1 υ 2 ) × g q
f is the first natural frequency [Hz], a is the span length in the X-direction, E is the dynamic modulus of elasticity 1.25 static E; in [MPa], h is the slab thickness [mm], υ is Poisson’s ratio [0.2], g is the gravitational acceleration [9810 mm/s2], q is the weight per unit surface area of the slab, and φ represents the boundary conditions of the slab, for a central panel bound by similar panels on each side
φ = 1.57 ( 1 + γ 2 )
where γ is the x to y span length ratio.
Using Equation (6), ATC [42] and AISC/CISC [45] recommend the following relationship for calculating the peak acceleration of the RC PT floor due to the foot drop heel:
a p g P 0 e 0.35 f β W  
where a p is the peak acceleration, g is the gravitational acceleration [32.2 ft/s2; 9.81 m/s2], P 0 is the constant force representing the walking force, β is the modal damping ratio, W is the effective weight of the panel and the superimposed dead load, and f is the first natural frequency [Hz].

4. Developing Informational Models for Predicting Cost and Embodied CO2

To develop a more reliable model for estimating the overall cost and embodied CO2 emissions of PT floors, it is necessary to elucidate the physical phenomena and underlying mechanisms correlated with the key geometrical and mechanical parameters involved. Accordingly, this study investigates the development of an informational model through developing a hybrid ANN coupled to a Firefly optimization algorithm. Using the comprehensive dataset discussed above, the informational model was created to estimate the overall cost and embodied CO2 emissions as determined by fundamental geometrical and mechanical input parameters ( t c , f c ,   f y , diameter of reinforcement bars, and slab area).
ANN is a data processing system that can learn from experience and generalize its knowledge to new data unfamiliar to the model [46,47]. Inspired by the structure of the biological brain, ANN comprises a group of neurons that operate locally to solve a particular problem. Neural networks acquire knowledge through learning, which mimics a simplified human brain-like approach via customary computations that capture the underlying mechanisms. The multilayer feed-forward network is a reliable and commonly used ANN structure and was used in this research. The multilayer feed-forward network comprises three different layers: The input layer where the data are introduced to the model; the hidden layer(s) where the input data are processed; and finally, the output layer where the results of the feed-forward ANN are produced. Each layer contains a group of nodes referred to as neurons that are connected to the proceeding layer. The neurons in the hidden and output layers consist of three components: Weights, biases, and an activation function that can be continuous, linear, or nonlinear. Standard activation functions include the nonlinear sigmoid functions (logsig, tansig) and linear functions (poslin, purelin) [48]. Once the architecture of a feed-forward ANN (number of layers, number of neurons in each layer, and activation function for each layer) has been selected, the weight and bias levels should be adjusted using training algorithms. One of the most reliable ANN training algorithms is the backpropagation (BP) algorithm, which distributes the network error to arrive at the best fit or minimum error [49,50].

4.1. Firefly Optimization Algorithm

The Firefly algorithm introduced by Yang [47] in 2009 at Cambridge University is a swarm intelligence algorithm for optimization problems. Inspired by the behavior and flashing patterns of tropical fireflies, this algorithm is flexible and easy to implement. It is a metaheuristic bio-inspired algorithm with a random optimization, which converges to a comprehensive solution of an optimization problem. The Firefly algorithm employs the following idealized rules [51,52,53,54]: (i) No sex distinctions, i.e., fireflies pay attention to each other regardless of their gender; and (ii) the level of attractiveness of each firefly is proportional to its brightness. Considering two flashing fireflies, the less-bright fireflies will move towards the brighter one. This attitude implies the higher the brightness is, the smaller the distance between two flashing fireflies will be. In the case of no brighter firefly nearby, it will fly randomly, and (iii) the brightness of a particular firefly is determined using the objective function.
The basic rules of the Firefly algorithm were designed in such a way as to resolve ongoing problems. Therefore, two fundamental parameters need to be identified: Attractiveness and the difference in the light intensity or brightness. The intensity of light I ( r i j ) is inversely relative to the square of the distance r i j and the relative light intensity or brightness of each firefly estimated using the following Gaussian equation [53,55]:
I ( r i j ) = I 0   e λ r i j 2
where I ( r i j ) is the brightness at a distance r i j ; I 0   is the maximum brightness (the absolute light intensity at the source point r i j = 0 ) that is relevant to the objective function value; λ is the light absorption factor, which indicates that brightness increases steadily by increasing the distance and the absorption of the medium; and r i j is the Euclidean distance between firefly i and firefly j . The following equation expresses the attractiveness of each firefly [56]:
β ( r i j ) = β 0 e λ r i j 2
where β 0 is the maximum attractiveness at the Euclidean distance r i j (the largest value of the firefly to attract another is naturally set to 1). To estimate the Euclidean distance between two fireflies, it is assumed that a firefly positioned at x i = ( x 1 i ,   x 2 i , ,   x k i )   is brighter than another firefly situated at x j = ( x 1 j ,   x 2 j , ,   x k j ) ; therefore, the firefly located at x i will move towards x j . Using this assumption, the Euclidean distance between any two fireflies i and j at x i and x j can be estimated as follows [53,55]:
r i j = | x i x j | = k d ( x i ,   k x j ,   k ) 2
where d is the dimension and   x i ,   k is the kth component of the spatial coordinate x i of the ith firefly. Once a firefly i is attracted to another more attractive firefly j , the updated location can be determined by the following equation:
x i + 1 = x i + β 0 e λ r i j 2 ( x j x i ) + ( r a n d 1 2 )
The first term in Equation (12) is the current position of a firefly, the second term is relevant to that firefly’s attractiveness to light intensity observed by nearby fireflies, and the third term is related to the random motion of a firefly once there are not any brighter fireflies. The factor is a randomization coefficient determined using the problem’s interest, whereas r a n d is a random number determined from a uniform distribution or Gaussian distribution at time t, and if β 0 = 2 , it tends to be a simple random walk. In the implementation of the algorithm, this study assumes that β 0 = 2   and   = 0.25 while the absorption coefficient or attractiveness λ = 1 ; leading to the rapid convergence of the algorithm towards the optimal solution. Figure 6 illustrates the concept of the firefly-based algorithm considered in this study. Moreover, Figure 7 depicts the developed flowchart implemented to predict the overall cost and embodied CO2 emissions given in Equations (1) and (2), as defined in Section 2 [57].

Generation of Training and Testing Data Sets

The dataset and its properties have been discussed in Section 3.1 above. As mentioned earlier, the independent input parameters in each design case include t c , f c , f y , the diameter of reinforcement bars, and the slab area, which forms a 5 × 1 matrix, and the dependent output parameter includes the overall cost and embodied CO2 emissions, which forms a 2 × 1 matrix. The features of input and output parameters are shown in Table 3.
A statistical relationship between two random variables, whether causal or not, is called correlation or dependency. In the broadest sense, correlation refers to the degree to which a pair of parameters are linearly associated. A correlation matrix is a table that provides correlation coefficients among input variables, where the correlation between the two variables is shown in each cell of the table. For advanced analysis, a correlation matrix is used to summarize data as input. Meanwhile, considering the range of data for each variable and to avoid any divergence in the results, the variables are first normalized in the range of 1 to −1, using the following equation:
X n = 2 ( X X min ) X m a x X m i x 1
where Xn is the normalized value of the variable, Xmax is its maximum value, and Xmin is its minimum value. X is the original (non-transformed) value of the variable. The minimum and maximum values for each input variable have been given earlier in Table 3. Figure 8 shows the correlation matrix developed for the input variables in this study. Considering that the statistical behavior of the output parameters should be evaluated, boxplots were examined, indicating that they follow a normal distribution, as depicted in Figure 9 [58].
The trial-and-error method was used to obtain the most efficient ANN model architecture that best reflects the characteristics of the data. In this study, an innovative method for calculating the number of neurons in the hidden layers was implemented, as per the following equation [59]:
N H min ( 2 N I + 1 ; N T R N I + 1 )  
where NH is the number of hidden layer nodes, NI is the number of inputs, and N T R   is the number of training samples. Since the number of influential input variables is 5, the empirical equation showed that the number of neurons in the hidden layers should be either 10.5 or 11. Thus, several networks with different topologies with a maximum of two hidden layers and 10 neurons were trained and studied in this study. The hyperbolic tangent stimulation function and the Levenberg–Marquardt training algorithm were used in all networks. The statistical metrics used to evaluate the performance of different topologies were the average absolute error (AAE), the coefficient of determination ( R 2 ), and the variance account factor (VAF), which are defined in Equations (15)–(17) [60]. In total, 25 topologies were examined, and it was found that the network with the topology consisting of the 5-4-5-2-layer architecture achieved the smallest error values for AAE, VAF, and the highest value of R2 in estimating the output parameters. To represent the accuracy of all the examined topologies, the R and RMSE indices were investigated, as depicted in Figure 10.
A A E = | i = 1 n ( O i P i ) O i | n × 100
R 2 = 1 s u m   s q u a r e d   r e g r e s s i o n   ( S S R ) t o t a l   s u m   o f   s q u a r e s   ( T S S )
V A F = [ 1 v a r ( O i P i ) v a r ( O i ) ] × 100  
Figure 11 illustrates the proposed 5-4-5-2 topology of the feed-forward network with two hidden layers, five input variables (neurons), and two output parameters. Table 4 reports the statistical metrics of the proposed 5-4-5-2 topology of the hybrid Firefly–ANN optimization algorithm at the training and testing stages. It should be noted that the error criteria for model training and testing were calculated in the main range of variables and not in the normalized range.
The ANN used in this study was the Newff Feed Forward. A total of 70% of the data were used for model training, while the remaining 30% was used for network testing. The firefly optimization algorithm was used to provide the least prediction error for the trained structure and to optimize the ANN’s weights and biases. The properties of the firefly optimization algorithm parameters are given in Table 5.

4.2. Genetic Algorithm, Multiple Linear, and Nonlinear Regression Models

To validate the proposed hybrid Firefly–ANN model in this study, the genetic algorithm, multiple linear, and nonlinear regression models were developed. The genetic algorithm (GA) is a method for solving both constrained and unconstrained optimization problems based on natural selection, the process that drives biological evolution [61]. The genetic algorithm repeatedly modifies a population of individual solutions. At each step, the GA selects individuals at random from the current population to be parents and uses them to produce the next generation of children. Over successive generations, the population evolves toward an optimal solution. The GA analyzed in this research is available in the Matlab Global Optimization Toolbox, and its features are depicted in Table 6.
In a multiple linear regression (MLR) model, two or more independent variables have a major effect on the dependent variable, as shown in the following equation:
y = f ( x 1 , x 2 , ) y = a 0 + a 1 x 1 + a 2 x 2 +
where y is a dependent variable; x1, x2, … are independent variables; and a1, a2, … are equation coefficients. In this study, different models of MLR were examined for input and output variables. The most suitable coefficients using the MLR model for the output parameters, overall cost, and embodied CO2 emissions, are presented in the following equations.
C o s t = 2931 185   x 1 40046   x 2 + 131.1   x 3 + 4.06   x 4 + 54.86   x 5
E C O 2 = 13.9 0.668   x 1 133.9   x 2 + 0.5318   x 3 + 0.00995   x 4 + 0.2138   x 5
where x 1 is the rebar diameter, x 2 is the thickness of the slab, x 3 is f c , x 4 is f y , and x 5 is the slab area. The nonlinear regression model (NLR) involves a comprehensive range of techniques for analyzing variables, particularly once the limited number of data has been determined. Nevertheless, this technique has some drawbacks, including not covering variables in all their possible range and using iterative methods to find the proper relationship. NLR has been successfully applied in diverse simulations and analyses in the domain of civil engineering, including modeling the compressive strength of recycled aggregate concrete, structural health monitoring, and predicting the ductility of reinforced concrete beams [62]. The most suitable coefficients using the NLR model for the output parameters, overall cost, and embodied CO2 emissions, are presented in the following equations.
C o s t = e x p   ( 0.006 x 1 + 3.325 x 2 + 0.008 x 3 + 0.0009 x 4 + 0.003 x 5 + 6.796 )
E C O 2 = exp ( 0.006 x 1 + 5.742 x 2 + 0.014 x 3 + 0.0002 x 4 + 0.002 x 5 + 0.750 )

5. Results and Discussion

5.1. Evaluation of Cost and Embodied CO2 Emissions

Figure 12 depicts the cost and embodied CO2 emissions of PT and conventional RC slabs for different span lengths. The results indicate that by increasing the slab span, both the cost and embodied CO2 emissions were decreased. According to Figure 12, the cost and embodied CO2 emissions decreased by 39% and 12%, respectively, in the PT slab with a 12 m span length compared to a conventional slab, yet these percentages were relatively smaller (18% and 1%, respectively) for a PT slab with a 4 m span length. Such a finding complies with previous findings in [63] where the cost analysis confirmed that the post-tensioned flat-slab system provides a better cost reduction of approximately 16.5. However, the current study did not consider the labor cost and technical equipment requirements, and therefore PT floor slabs may not be economically justifiable for span lengths shorter than 6 m.
Figure 13 illustrates the ratio of concrete, steel, and tendon in the distribution of cost and embodied CO2 emissions, calculated by the average value of design cases for a given span. The results indicate that concrete contributed an average of 65% and 94% to the overall cost and embodied CO2 emissions, respectively. The second-largest contributor to the overall cost and embodied CO2 emissions is steel, representing, on average, 18% and 4%, respectively. Although the tendons play a significant role in PT floors, they are only responsible for around 12% and 2% of the overall cost and embodied CO2 emissions. Therefore, Figure 13 confirms that for achieving an economical and sustainable design of PT slabs, the concrete should be the primary concern for optimization.

5.2. Evaluation of the Informational Models to Predict Cost and Embodied CO2 Emissions

Figure 14 displays a comparison between the actual observed data, the prediction of the novel Firefly–ANN model, and the other three informational models considered in this study. The results indicate that the Firefly–ANN model attained more reliable estimations of the overall cost and embodied CO2 emissions for PT floor slabs than the MLR, GA, and NLR. Table 7 shows the ratio of actual to calculated value obtained by all studied informational models to predict the cost and embodied CO2 emissions. It can be observed that the proposed hybrid Firefly–ANN model yielded the most reliable results for both studied parameters. The maximum and average values of the cost and embodied CO2 emissions ratio estimated by the Firefly–ANN model were the closest to unity, indicating robust predictive capability. Meanwhile, the minimum value of the ratio of those parameters achieved by the Firefly–ANN model was equal to 0.79 and 0.69, resulting in accurate yet conservative predictions, which is convenient for design purposes.
Another visual measure that can be considered for comparing the performance of the hybrid Firefly-ANN model against the other informational models is the Taylor diagram, as shown in Figure 15. This diagram depicts a graphical illustration of each investigated model’s adequacy based on the root mean-square-centered difference, the correlation coefficient, and the standard deviation. The results indicate that the closest prediction of the studied parameters to the points representing the actual cost and embodied CO2 emissions were provided by the Firefly–ANN model proposed in this study. The MLR model resulted in higher values of root mean-square-centered difference and standard deviation, indicating a rather low accuracy of the model in estimating the experimental data compared to the NLR model. Meanwhile, although the GA model predicted the EMBODIED CO2 emissions properly, it also resulted in higher root mean-square-centered values for the cost parameter.
Table 8 provides the final weights and biases for both hidden layers estimated by the ANN-Bat model. Using the values of the weights and biases between the different ANN layers, the output parameter can be determined and predicted through the following equations:
a ( 2 ) = t a n h ( I W × a ( 1 ) + b 1 )
a ( 3 ) = t a n h ( L W 1 × a ( 2 ) + b 2 )
Y C o s t   o r   E C O 2 P r e d i c ( N o r m a l i z e ) = t a n h ( L W 2 × a ( 3 ) + b 3 )
Y C o s t   o r   E C O 2 P r e d i c t ( A c t u a l ) = Y C o s t   o r   E C O 2 P r e d i c t ( N o r m a l i z e ) + 1 2 × ( Y m a x Y m i n ) + Y m i n

5.3. Sensitivity Analysis of Cost and Embodied CO2 Emissions to Slab Design Parameters

This section explores the sensitivity of the cost and embodied CO2 emissions to the PT slab geometrical and mechanical parameters ( t c ,   f c ,   f y ,   and   tendon   pattern ). Sensitivity analysis (SA) can reveal how significantly the model output is affected by changes within input variables. There are two main types of SA: Global and local sensitivity analysis. The local sensitivity analysis concentrates on the local impact of individual input parameters on the overall performance. The global sensitivity analysis (GSA) evaluates the influence of individual input parameters over their entire spatial range and measures the uncertainty of the overall performance (output) caused by input uncertainty in interaction with other parameters taken individually [64]. Therefore, considering the nature of the output parameters in this study, GSA was considered more rational for investigating the impact of input parameters on the overall model performance.
Amongst GSA methods, a variance-based approach was primarily considered in the existing literature for sensitivity analysis. The method provides a specific methodology for defining total and first-order sensitivity indices for each ANN model input parameter. Assuming a model of the form Y = f (X1, X2, …, Xk ) where Y is a scalar, the variance-based technique takes a variance ratio to evaluate the impact of individual parameters using variance decomposition as per the following equation:
V = i = 1 k V i + i = 1 k j > i k V i j + + V 1 , 2 , , k
where V is the variance of the ANN model output, Vi is the first-order variance for the input Xi, and Vij to V1,2, …, k corresponds to the variance of the interaction of the k parameters. Vi and Vij, which denote the significance of the individual input to the variance of the output, are a function of the conditional anticipation variance, following the equations below.
V i = V x i [ E x ~ i ( Y X i ) ]
V i j = V x i x j [ E x ~ i j ( Y X i , X j ) ] V i V j
where Xi designates the set of all input variables apart from Xi. The first-order sensitivity index (Si) represents the first-order impact of an input Xi on the overall output provided by the following equation.
S i = V i V ( Y )
The above-mentioned methodology for calculating the first-order sensitivity index was considered in this research. Results of the SA are presented in Figure 16. The results confirm that the thickness of the slab had a major influence on both the cost and embodied CO2 emissions by factors of 86% and 62%, respectively. This aspect was discussed earlier in Section 4.1 where the concrete was found to be responsible for the overall cost and embodied CO2 emissions by an average of 65% and 94%, respectively, in all studied floor spans. Figure 15 shows that the second largest contributor to the cost and embodied CO2 emissions in PT slabs is the compressive strength of concrete ( f c ), whereas the output parameters were less sensitive to the yield strength of the steel reinforcement ( f y ).
To examine the sensitivity of the overall cost and embodied CO2 emissions to f c and f y , a PT floor with a 12 m span was investigated. Figure 16 acknowledges that both the cost and embodied CO2 emissions were very sensitive to f c whereby upon f c increasing from 24 to 50 MPa, the overall cost and embodied CO2 emissions were increased by 20% and 50%, respectively. Yet, the overall cost and embodied CO2 emissions were slightly decreased by increasing the yield strength of the steel reinforcement ( f y ), although the impact was not major. Figure 17 indicates that there was a strong correlation between the tendon pattern and the overall cost, whereby using a distributed pattern, the overall cost was decreased by 42%. This issue can be explained by the fact that using a distributed pattern for tendons decreases the flexural shrinkage and the effect of temperature on the reinforcement. Yet, using a distributed pattern for tendons provided less impact on the overall embodied CO2 emissions.

6. Influence of Prestressing on Punching Strength of PT Slab

Punching shear failures of PT slabs are a primary concern in the absence of particular mitigating measures (integrity or shear reinforcement). They are brittle and can propagate to adjacent columns (overloaded after first punching of a column), thus triggering the possible progressive collapse of the entire structure [1]. The punching shear strength of flat RC slabs is typically controlled by the compressive strength of the slab and column concrete and their geometric parameters. In a flat slab without shear reinforcement subjected to a cantered axial load by an isolated column, two categories of orthogonal bending moments, Mφ producing tangential stresses and Mr producing radial stresses, are developed due to the bidirectional flexural action of the slab, as depicted in Figure 18 [6]. The normal stresses, σφ, and σr, developed by the above-mentioned orthogonal bending moments, respectively, stretch the top and compress the bottom of the slab. Once these stresses surpass the tensile strength of the concrete, flexural cracks are developed, normal and parallel to the column’s perimeter. Once the shear load increases, damage concentrates along a tangential direction that is inclined through the slab depth, labelled punching shear failure. Over the loading sequence, the stiffness changes because of the radial and tangential cracks, leading to redistributions between tangential and radial bending moments, subsequently yielding the flexural reinforcement.
To evaluate the accuracy of the ACI 318-18 empirical equation for punching shear (Equation (4)) and investigate the sensitivity of the punching shear of PT slabs to mechanical and geometrical properties ( f c , d , f p c , and flexural reinforcement ratio ρ ), a dataset of punching shear of PT floors was compiled from the open literature as shown in Appendix A (Table A1). Figure 19 depicts the sensitivity of the punching shear to geometrical and mechanical parameters. The results confirm that the overall depth of the slab, d , has a major contribution in resisting punching shear, whereas the prestress force in tendons has a contribution as low as 0.09. The compressive strength of concrete, f c , and flexural reinforcement ratio, ρ , contributed to the resistance against the punching shear by 0.19 and 0.13, respectively. Meanwhile, the statistical metrics (average, standard deviation, and coefficient of variance) presented in Appendix A (Table A1) indicate that the ACI empirical equation produced conservative results in estimating the punching shear of PT slabs, where the average value of the test-to-prediction data was calculated as 1.55.

7. Concluding Remarks

In this research, a novel hybrid Firefly–Artificial Neural Network (Firefly–ANN) model was developed to estimate the cost and embodied CO2 emissions of PT slabs made with different design variables. The following main findings can be drawn from this research.
The results confirm that the environmental and economic feasibility of PT floor slabs is more evident for large span slabs. It was found that the cost and embodied CO2 emissions decreased by 39% and 12%, respectively, in PT slabs with a 12 m span length compared to conventional RC slabs. However, considering labor costs and technical equipment requirements for PT floor slabs, their use for span lengths shorter than 6 m may not be economically justifiable.
The results indicate that the proposed Firefly–ANN model provided more accurate and reliable estimations of the overall cost and embodied CO2 emissions of PT floors than the genetic algorithm and multi-linear and non-linear regression models. The ratio of observational to calculated values estimated by the Firefly–ANN model was the closest to unity, indicating robust predictive capability. The root mean-square-centered difference, the correlation coefficient, and the standard deviation provided by the Taylor diagram also acknowledge the high potential of the hybrid Firefly–ANN model for estimating the cost and embodied CO2 emissions.
Using the proposed informational model, it is possible to manage the cost and embodied CO2 over the design process of PT slabs. Using this technique, the designer gains insight into the ratio of concrete, steel, and tendon in the distribution of cost and embodied CO2 emissions.
Sensitivity analysis confirmed that the cost and embodied CO2 emissions were very sensitive to the slab thickness, with values of 86% and 62%, respectively. Moreover, the sensitivity of the cost and embodied CO2 emissions to the compressive strength of concrete ( f c ) was recorded as 12% and 20%, respectively.
The results also showed a strong correlation between the tendon pattern and the overall cost, whereby using a distributed pattern, the overall cost was decreased by 42%. This issue can be explained by the fact that using a distributed pattern for tendons can decrease the flexural shrinkage and temperature effects on the reinforcement. Nevertheless, using a distributed pattern for tendons resulted in a smaller effect on the overall embodied CO2 emissions.

Author Contributions

Conceptualization, I.F. and M.L.N.; methodology, I.F. and M.N.; software, M.N. and I.F.; validation, I.F., M.L.N. and K.A.V.; formal analysis, I.F. and M.N.; investigation, I.F. and M.N.; data curation, I.F. and M.N.; writing—original draft preparation, I.F., M.N. and K.A.V.; writing—review and editing, M.L.N.; visualization, I.F. and M.N.; supervision, M.L.N. and K.A.V.; project administration, M.L.N. and K.A.V. All authors have read and agreed to the published version of the manuscript.

Funding

This project received no external funding.

Institutional Review Board Statement

Not applicable.

Informed Consent Statement

Not applicable.

Data Availability Statement

Most data are included in the manuscript.

Conflicts of Interest

The authors declare no conflict of interest.

Nomenclature

RC: Reinforced concrete f c : Compressive Strength of Concrete
ANN: Artificial Neural Network t c : slab thickness
FA-Firefly Algorithm d s : diameter of the steel reinforcement
PT: Post-tensioned v : Volume of the material
GHGs: greenhouse gases ρ : density of the material
GA: genetic algorithm E c , s , t : unit embodied CO2 emissions
I ( r i j ) : intensity of light C : Unit of the cost
NH: the number of hidden layer nodes f p m : average rupture stress of tendon
NI: the number of inputs A s , m i n : minimum area of bonded reinforcement
N T R : the number of training samples A c f : larger gross cross-sectional area of the slab-beam strip
AAE: average absolute error v c : punching shear strength
R 2 : coefficient of determination b 0 : perimeter of the critical section
VAF: variance account factor v p : the factored vertical component of all prestressed forces crossing the critical section
MLR: multiple linear regression α s : scale factor
NLR: nonlinear regression model f : the first natural frequency
SA: Sensitivity analysisa: span length in the X-direction
GSA: global sensitivity analysis φ : represents the boundary conditions of the slab
GBFS: ground blast furnace slagE: the dynamic modulus of elasticity
FA: fly ash υ : the Poisson’s ratio
OPC: ordinary Portland cement g : gravitational acceleration
LCA: Life Cycle Assessment q : weight per unit surface area of the slab
f y : yield strength a p : peak acceleration
f c : compressive strength of concrete P 0 : constant force representing the walking force
t c : slab thickness β : modal damping ratio
d s : diameter of the steel reinforcement W : effective weight

Appendix A

Table A1. Dataset on punching shear of PT slabs.
Slab f c ´   ( Mpa ) f p c   ( Mpa ) d(mm) ρ   ( % ) vc(kN)Vc/VACI
Mostafa S. et al. [65]
SNP130.12.03801.42711.95
SHP165.52.48801.43371.88
SHP2672.39801.44312.4
SHP3672.39801.43812.13
Eid [66]
S130.12.03801.42602.04
S229.62.01801.42202.24
S329.61.65801.41702.21
Silva [67]
A137.83.311020.623801.6
A237.82.141080.473151.38
A337.83.161020.62352.71.57
A437.81.981030.513211.61
B140.13.391080.6582.51.41
B240.12.231050.484881.39
B340.13.121020.63519.81.47
B440.12.161000.5458.81.48
C141.63.331050.617201.36
C241.62.261000.5556.71.26
C341.63.481000.64636.61.32
C441.62.31980.52497.11.2
D144.13.34990.68497.11.39
D244.12.231010.5385.21.18
D344.12.271000.51395.21.26
D444.12.221060.48531.51.09
Correa [68]
LP252.42.191041.173551.22
LP352.44.281041.174151.16
LP450.70.81041.173901.55
LP550.71.331041.174751.74
LP652.41.761041.174371.51
Kordino and Nolting [69]
V133.61.71240.624501.32
V2361.661230.95251.55
V3363.091220.625701.28
V630.41.771200.623751.46
V731.21.771240.624751.4
V835.21.771240.62518
Hassanzadeh [70]
A1312.791500.186681.33
A228.72.741460.185641.31
B243.82.121760.298271.37
B341.12.211900.2911131.56
B443.21.991900.299521.45
Shehata [71]
SP136.53.941400.279882
SP241.74.811400.278841.58
SP340.93.281400.277801.69
SP442.53.51400.277281.52
Melges [72]
M451.91.951280.927731.83
Average1.55
St of Dev0.31
C.O.V0.2

References

  1. Ranzi, G.; Al-Deen, S.; Ambrogi, L.; Uy, B. Long-term behaviour of simply-supported post-tensioned composite slabs. J. Constr. Steel Res. 2013, 88, 172–180. [Google Scholar] [CrossRef]
  2. Clément, T.; Ramos, A.P.; Ruiz, M.F.; Muttoni, A. Influence of prestressing on the punching strength of post-tensioned slabs. Eng. Struct. 2014, 72, 56–69. [Google Scholar] [CrossRef]
  3. Mohammed, A.H.; Tayşi, N.; Nassani, D.E.; Hussein, A.K. Finite element analysis and optimization of bonded post-tensioned concrete slabs. Cogent Eng. 2017, 4, 1341288. [Google Scholar] [CrossRef]
  4. Zelickman, Y.; Amir, O. Layout optimization of post-tensioned cables in concrete slabs. Struct. Multidiscip. Optim. 2021, 63, 1–24. [Google Scholar] [CrossRef]
  5. Foutch, D.A.; GambleE, W.L.; Sunidja, H. Tests of post-tensioned concrete slab-edge column connections. Struct. J. 1990, 87, 167–179. [Google Scholar]
  6. Barbán, V.V.; Melo, G.S.; Carvalho, A.L. Punching shear tests of post-tensioned flat slabs supported on edge columns. Struct. Concr. 2020, 21, 247–261. [Google Scholar] [CrossRef]
  7. Moeinaddini, F. Concentric Punching Shear Strength of Reinforced Concrete and Post-Tensioned Floors; Swinburne University of Technology: Melbourne, Australia, 2019. [Google Scholar]
  8. Luckkikanun, A.; Prawatwong, U.; Warnitchai, P. Cyclic Testing of Bonded Post-tensioned Interior Slab-Column Connections with Shear Stud. In EASEC16; Springer: Berlin/Heidelberg, Germany, 2021; pp. 1625–1634. [Google Scholar]
  9. Miller, D.; Doh, J.-H.; Guan, H.; Mulvey, M.; Fragomeni, S.; McCarthy, T.; Peters, T. Environmental Impact Assessment of Post Tensioned and Reinforced Concrete Slab Construction; Taylor & Francis Group: London, UK, 2013. [Google Scholar]
  10. Abdelrahman, A.A. Applications of sustainable post-tensioned concrete slabs. Innov. Infrastruct. Solut. 2017, 2, 1–12. [Google Scholar] [CrossRef] [Green Version]
  11. Sahab, M.G.; Toropov, V.V.; Gandomi, A.H. Optimum design of composite concrete floors using a hybrid genetic algorithm. In Handbook of Neural Computation; Elsevier: Amsterdam, The Netherlands, 2017; pp. 581–589. [Google Scholar]
  12. Ferreiro-Cabello, J.; Fraile-Garcia, E.; de Pison Ascacibar, E.M.; Martinez-de-Pison, F. Metamodel-based design optimization of structural one-way slabs based on deep learning neural networks to reduce environmental impact. Eng. Struct. 2018, 155, 91–101. [Google Scholar] [CrossRef]
  13. Lee, S.H.; Oh, B.K.; Choi, J.; Hong, D.H.; Hong, T.; Lee, D.-E.; Park, H.S. Eco-friendly and Economically Optimal Design Model (EEODM) to Reduce the CO2 Emissions and the Cost of Long-span Waffle Slabs. J. Clean. Prod. 2021, 296, 126367. [Google Scholar] [CrossRef]
  14. ACI Committee. Building Code Requirements for Structural Concrete (ACI 318-08) and Commentary; ACI Committee: Indianapolis, MI, USA, 2008. [Google Scholar]
  15. Han, S.W.; Lee, M.-J.; Moon, K.-H. Acceleration thresholds of vertical floor vibrations according to human perception levels in Korea. Adv. Struct. Eng. 2009, 12, 595–607. [Google Scholar] [CrossRef]
  16. Rosado, L.P.; Vitale, P.; Penteado, C.S.; Arena, U. Life cycle assessment of construction and demolition waste management in a large area of São Paulo State, Brazil. Waste Manag. 2019, 85, 477–489. [Google Scholar] [CrossRef]
  17. Sharma, A.; Saxena, A.; Sethi, M.; Shree, V. Life cycle assessment of buildings: A review. Renew. Sustain. Energy Rev. 2011, 15, 871–875. [Google Scholar] [CrossRef]
  18. Ramesh, T.; Prakash, R.; Shukla, K. Life cycle energy analysis of buildings: An overview. Energy Build. 2010, 42, 1592–1600. [Google Scholar] [CrossRef]
  19. Chastas, P.; Theodosiou, T.; Kontoleon, K.J.; Bikas, D. Normalising and assessing carbon emissions in the building sector: A review on the embodied CO2 emissions of residential buildings. Build. Environ. 2018, 130, 212–226. [Google Scholar] [CrossRef]
  20. Chau, C.K.; Leung, T.; Ng, W. A review on life cycle assessment, life cycle energy assessment and life cycle carbon emissions assessment on buildings. Appl. Energy 2015, 143, 395–413. [Google Scholar] [CrossRef]
  21. Ibn-Mohammed, T.; Greenough, R.; Taylor, S.; Ozawa-Meida, L.; Acquaye, A. Operational vs. embodied emissions in buildings—A review of current trends. Energy Build. 2013, 66, 232–245. [Google Scholar] [CrossRef]
  22. González, M.J.; Navarro, J.G. Assessment of the decrease of CO2 emissions in the construction field through the selection of materials: Practical case study of three houses of low environmental impact. Build. Environ. 2006, 41, 902–909. [Google Scholar] [CrossRef]
  23. Rattanashotinunt, C.; Tangchirapat, W.; Jaturapitakkul, C.; Cheewaket, T.; Chindaprasirt, P. Investigation on the strength, chloride migration, and water permeability of eco-friendly concretes from industrial by-product materials. J. Clean. Prod. 2018, 172, 1691–1698. [Google Scholar] [CrossRef]
  24. Tae, S.; Baek, C.; Shin, S. Life cycle CO2 evaluation on reinforced concrete structures with high-strength concrete. Environ. Impact Assess. Rev. 2011, 31, 253–260. [Google Scholar] [CrossRef]
  25. Cho, S.; Na, S. The reduction of CO2 emissions by application of high-strength reinforcing bars to three different structural systems in South Korea. Sustainability 2017, 9, 1652. [Google Scholar] [CrossRef] [Green Version]
  26. Fan, C.; Miller, S.A. Reducing greenhouse gas emissions for prescribed concrete compressive strength. Constr. Build. Mater. 2018, 167, 918–928. [Google Scholar] [CrossRef]
  27. García-Segura, T.; Yepes, V.; Alcalá, J. Life cycle greenhouse gas emissions of blended cement concrete including carbonation and durability. Int. J. Life Cycle Assess. 2014, 19, 3–12. [Google Scholar] [CrossRef]
  28. Asadollahfardi, G.; Katebi, A.; Taherian, P.; Panahandeh, A. Environmental life cycle assessment of concrete with different mixed designs. Int. J. Constr. Manag. 2019, 21, 1–12. [Google Scholar] [CrossRef]
  29. Zhang, Y.; Zhang, J.; Luo, W.; Wang, J.; Shi, J.; Zhuang, H.; Wang, Y. Effect of compressive strength and chloride diffusion on life cycle CO2 assessment of concrete containing supplementary cementitious materials. J. Clean. Prod. 2019, 218, 450–458. [Google Scholar] [CrossRef]
  30. SAFE 2016. Available online: https://www.csiamerica.com/products/safe (accessed on 1 May 2021).
  31. CCL. Available online: https://www.cclint.com/ (accessed on 20 August 2021).
  32. Hammond, G.; Jones, C.; Lowrie, E.F.; Tse, P. Embodied Carbon: The Inventory of Carbon and Energy (ICE), 2nd ed.; BSRIA: Bracknell, UK, 2011. [Google Scholar]
  33. Jang, M.; Hong, T.; Ji, C. Hybrid LCA model for assessing the embodied environmental impacts of buildings in South Korea. Environ. Impact Assess. Rev. 2015, 50, 143–155. [Google Scholar] [CrossRef]
  34. Ji, C.; Hong, T.; Park, H.S. Comparative analysis of decision-making methods for integrating cost and CO2 emission–focus on building structural design. Energy Build. 2014, 72, 186–194. [Google Scholar] [CrossRef]
  35. Wang, H.; Ang, B.; Su, B. A multi-region structural decomposition analysis of global CO2 emission intensity. Ecol. Econ. 2017, 142, 163–176. [Google Scholar] [CrossRef]
  36. Park, H.S.; Kwon, B.; Shin, Y.; Kim, Y.; Hong, T.; Choi, S.W. Cost and CO2 emission optimization of steel reinforced concrete columns in high-rise buildings. Energies 2013, 6, 5609–5624. [Google Scholar] [CrossRef]
  37. Oh, B.K.; Glisic, B.; Lee, S.H.; Cho, T.; Park, H.S. Comprehensive investigation of embodied carbon emissions, costs, design parameters, and serviceability in optimum green construction of two-way slabs in buildings. J. Clean. Prod. 2019, 222, 111–128. [Google Scholar] [CrossRef]
  38. Kajaste, R.; Hurme, M. Cement industry greenhouse gas emissions–management options and abatement cost. J. Clean. Prod. 2016, 112, 4041–4052. [Google Scholar] [CrossRef]
  39. Aalami, B.O. Structural modeling of posttensioned members. J. Struct. Eng. 2000, 126, 157–162. [Google Scholar] [CrossRef]
  40. Allen, D.; Murray, T. Design criterion for vibrations due to walking. Eng. J. 1993, 30, 117–129. [Google Scholar]
  41. Association Canadienne Normalisation. CAN/CSA-S16. 1-M89, Limit States Design of Steel Structures; Association Canadienne Normalisation: Ottawa, ON, Canada, 1990. [Google Scholar]
  42. Allen, D.E. Minimizing Floor Vibration; Applied Technology Council: Redwood City, CA, USA, 1999; Volume 1. [Google Scholar]
  43. Aalami, B.O. Vibration Design of Concrete Floors for Serviceability; ADAPT Corporation: Redwood City, CA, USA, 2008. [Google Scholar]
  44. Aalami, B.O. Time-dependent analysis of post-tensioned concrete structures. Prog. Struct. Eng. Mater. 1998, 1, 384–391. [Google Scholar] [CrossRef]
  45. AISC/CISC. Steel Design Guide Series No. 11: Floor Vibrations Due to Human Activity; USA American Institute of Steel: Cambridge, MA, USA, 1997. [Google Scholar]
  46. Adeli, H. Neural networks in civil engineering: 1989–2000. Comput. Aided Civil. Infrastruct. Eng. 2001, 16, 126–142. [Google Scholar] [CrossRef]
  47. Flood, I.; Kartam, N. Neural networks in civil engineering. I: Principles and understanding. J. Comput. Civ. Eng. 1994, 8, 131–148. [Google Scholar] [CrossRef]
  48. Nikoo, M.; Hadzima-Nyarko, M.; Karlo Nyarko, E.; Nikoo, M. Determining the natural frequency of cantilever beams using ANN and heuristic search. Appl. Artif. Intell. 2018, 32, 309–334. [Google Scholar] [CrossRef]
  49. Haykin, S. Neural Networks: A Comprehensive Foundation; Prentice-Hall, Inc.: Hoboken, NJ, USA, 2007. [Google Scholar]
  50. Bishop, C.M. Pattern Recognition and Machine Learning; Springer: Berlin/Heidelberg, Germany, 2006. [Google Scholar]
  51. Yang, X.-S. Multiobjective firefly algorithm for continuous optimization. Eng. Comput. 2013, 29, 175–184. [Google Scholar] [CrossRef] [Green Version]
  52. Yang, X.-S.; He, X.-S. Why the firefly algorithm works? In Nature-Inspired Algorithms and Applied Optimization; Springer: Berlin/Heidelberg, Germany, 2018; pp. 245–259. [Google Scholar]
  53. Yang, X.-S. Engineering Optimization: An Introduction with Metaheuristic Applications; John Wiley & Sons: Hoboken, NJ, USA, 2010. [Google Scholar]
  54. Fister, I.; Fister Jr, I.; Yang, X.-S.; Brest, J. A comprehensive review of firefly algorithms. Swarm Evol. Comput. 2013, 13, 34–46. [Google Scholar] [CrossRef] [Green Version]
  55. Yang, X.-S. Nature-Inspired Metaheuristic Algorithms; Luniver Press: London, UK, 2010. [Google Scholar]
  56. Jervase, J.A.; Bourdoucen, H.; Al-Lawati, A. Solar cell parameter extraction using genetic algorithms. Meas. Sci. Technol. 2001, 12, 1922. [Google Scholar] [CrossRef] [Green Version]
  57. Gupta, A.; Padhy, P. Modified Firefly Algorithm based controller design for integrating and unstable delay processes. Eng. Sci. Technol. Int. J. 2016, 19, 548–558. [Google Scholar] [CrossRef] [Green Version]
  58. Louzazni, M.; Khouya, A.; Amechnoue, K.; Gandelli, A.; Mussetta, M.; Crăciunescu, A. Metaheuristic algorithm for photovoltaic parameters: Comparative study and prediction with a firefly algorithm. Appl. Sci. 2018, 8, 339. [Google Scholar] [CrossRef] [Green Version]
  59. Rogers, L.L.; Dowla, F.U. Optimization of groundwater remediation using artificial neural networks with parallel solute transport modeling. Water Resour. Res. 1994, 30, 457–481. [Google Scholar] [CrossRef]
  60. Li, J.; Heap, A.D. A Review of Spatial Interpolation Methods for Environmental Scientists; Geoscience Australia: Canberra, Australia, 2008.
  61. Nikoo, M.; Torabian Moghadam, F.; Sadowski, Ł. Prediction of concrete compressive strength by evolutionary artificial neural networks. Adv. Mater. Sci. Eng. 2015, 2015, 849126. [Google Scholar] [CrossRef]
  62. Aval, S.B.; Ketabdari, H.; Gharebaghi, S.A. Estimating shear strength of short rectangular reinforced concrete columns using nonlinear regression and gene expression programming. Structures 2017, 12, 13–23. [Google Scholar] [CrossRef]
  63. Jayalakshmi Satyanarayanan, A.; Santhi Mariadhas, H.; Dhanapalan, P. Safety and economy in the design of reinforced and post-tensioned slab systems using IS, BS, and ACI standards. Pract. Period. Struct. Des. Constr. 2018, 23, 04018010. [Google Scholar] [CrossRef]
  64. Saltelli, A.; Ratto, M.; Andres, T.; Campolongo, F.; Cariboni, J.; Gatelli, D.; Saisana, M.; Tarantola, S. Global Sensitivity Analysis: The Primer; John Wiley & Sons: Hoboken, NJ, USA, 2008. [Google Scholar]
  65. Ragab, M.; Riad, K.; Zaher, A. Punching behavior of post-tensioned high strength concrete slabs. World Appl. Sci. J. 2014, 32, 527–539. [Google Scholar]
  66. Eid, H. Effect of Near Column Opening on Punching Behavior of Post Tensioned Slabs. In A Thesis Submitted in Partial Fulfillment for the Requirements of the Degree of Master of Science in Civil Engineering; Ain Shams University: Cairo, Egypt, 2013. [Google Scholar]
  67. Silva, R.J.; Regan, P.E.; Melo, G.S. Punching of post-tensioned slabs-tests and codes. ACI Struct. J. 2007, 104, 123. [Google Scholar]
  68. Corrêa, G.S. Puncionamento em Lajes Cogumelo Protendidas com Cabos Não-Aderentes; Universidade de Brasília: Brazilia, Brazil, 2001. [Google Scholar]
  69. Kordina, K.; Nötling, D. Tragfähigkeit Durchstanzgefährdeter Stahlbetonplatten-Entwicklung von Bemessungsvorschlägen; German Committee for Reinforced Concrete: Berlin, Germany, 1986; pp. 1–167. [Google Scholar]
  70. Hassanzadeh, G. Betongplattor på pelare. Dimensioneringsmetoder för plattor med icke vidhäftande spännarmering. Trita-BKN. Bull. 1998, 43, 160. [Google Scholar]
  71. Shehata, I. Punching of Prestressed and Non-Prestressed Reinforced Concrete Flat Slabs. Master’s Thesis, Polytechnic of Central London, London, UK, 1982. [Google Scholar]
  72. Melges, J.L.P. Análise Experimental da Punção em Lajes de Concreto Armado e Protendido; Universidade de São Paulo: São Paulo, Brazil, 2001. [Google Scholar]
Figure 1. The life cycle of concrete.
Sustainability 13 12319 g001
Figure 2. Geometry of studied RC flat slab design cases.
Sustainability 13 12319 g002
Figure 3. PT floor design flowchart.
Sustainability 13 12319 g003
Figure 4. Steel reinforcement distribution for 6 m bay PT slab.
Sustainability 13 12319 g004
Figure 5. Threshold of human sensitivity to vertical vibration.
Sustainability 13 12319 g005
Figure 6. A conceptual view of the firefly optimization algorithm; distance r , locations x , brightness I ( r ) , and attractiveness β ( r ) .
Sustainability 13 12319 g006
Figure 7. Illustration of the flowchart of the novel hybrid firefly optimization algorithm.
Sustainability 13 12319 g007
Figure 8. Correlation matrix for input variables.
Sustainability 13 12319 g008
Figure 9. Probability plot diagrams for the overall (a) EMBODIED CO2 emission, and (b) cost.
Sustainability 13 12319 g009
Figure 10. VAF and AAE values for the proposed topologies in the model testing phase, (a) cost, and (b) embodied CO2 emissions.
Sustainability 13 12319 g010
Figure 11. Proposed 5-4-5-2 topology of optimized feed-forward network.
Sustainability 13 12319 g011
Figure 12. Comparison between the cost and EMBODIED CO2 emissions in PT and conventional RC slabs.
Sustainability 13 12319 g012
Figure 13. Ratio of concrete, steel, and tendon in the distribution of cost and EMBODIED CO2 emissions.
Sustainability 13 12319 g013
Figure 14. Estimation of the overall cost and EMBODIED CO2 emissions by all studied informational models.
Sustainability 13 12319 g014aSustainability 13 12319 g014b
Figure 15. Taylor diagram visualization of Firefly–ANN model performance in the prediction of (a) cost and (b) embodied CO2 emissions.
Sustainability 13 12319 g015
Figure 16. Sensitivity analysis of cost and embodied CO2 emissions to the mechanical properties and tendon patterns in PT RC slabs.
Sustainability 13 12319 g016
Figure 17. Sensitivity of cost and embodied CO2 emissions to geometrical and mechanical parameters.
Sustainability 13 12319 g017
Figure 18. (a) Punching shear cracks, (b) internal forces, and (c) state of stresses in flat concrete slab.
Sustainability 13 12319 g018
Figure 19. Sensitivity of punching shear to geometrical and mechanical parameters.
Sustainability 13 12319 g019
Table 1. Design variables.
MaterialDesign VariablesTypical Values
Concrete Thickness   of   slab ,   t c 110–340 mm
Compressive   strength ,   f c 24, 35, 50 MPa
Steel reinforcement Yield   strength ,   f y 300, 400, 500 MPa
Size   of   reinforcement   bars   ( d s )10–16 mm
TendonDistributed pattern-
Bonded pattern-
Table 2. Unit embodied CO2 emissions and cost.
MaterialStrength
(MPa)
Unit Embodied CO2
(kg CO2/kg)
Unit Cost
(USD/ton)
Concrete24 E c = 0.1304 C c = 21.98
35 E c = 0.1616 C c = 25.02
50 E c = 0.20 C c = 34.02
Steel reinforcement300 E s = 0.39 C s = 577.29
400 E s = 0.40 C s = 581.14
500 E s = 0.42 C s = 604.20
Tendon1897 E t = 0.44 C t = 750.00
Table 3. Features of input and output parameters.
ParameterUnitTypeMaxMinAverageSTDVariance
Diameter of RebarmmInput16.0010.0013.761.883.53
Thickness of SlabmInput0.340.110.240.060.00
Compressive   Strength ,   f c MPaInput50.0024.0035.0911.12123.63
Yield   Strength ,   f y MPaInput500.00300.00408.8287.657682.18
Slab Aream2Input576.0064.00316.35158.2625,047.28
CostUSDOutput25,126.87621.648572.366330.7740,078,618.90
Embodied CO2 EmissionstonOutput101.972.3635.3526.17684.73
Table 4. Statistical metrics of the proposed 5-4-5-2 model topology.
Output ParameterStageNetwork DesignationAAEVAF%R2y = ax + b
Embodied CO2TrainFA-ANN 2L(4–5)0.01999%0.9991y = 0.9991x + 0.0326
TestFA-ANN 2L(4–5)0.09796%0.9756y = 1.0792x − 0.4217
CostTrainFA-ANN 2L(4–5)0.06097%0.9703y = 0.9703x + 259.42
TestFA-ANN 2L(4–5)0.16787%0.921y = 1.148x − 1268.5
Table 5. Firefly algorithm parameters.
ParameterValueParameterValue
Population size100Attraction coefficient base value2
Mutation coefficient0.25Mutation coefficient damping ratio0.99
Light absorption coefficient1M (exponent of distance term)2
Table 6. Properties of genetic algorithm.
ParameterValueParameterValue
Max generations150Crossover (percent)50
Recombination (percent)15Crossover methodsingle point
Lower bound−1Selection mode1
Upper bound+1Population size150
Table 7. Statistical metrics of all studied informational models (observational to calculated).
ParameterCostEmbodied CO2
ModelFA-ANNMLRGA-ANNNLRFA-ANNMLRGA-ANNNLR
Avg1.010.650.970.910.991.321.010.92
STD0.123.800.150.250.061.990.070.21
Max1.267.741.301.311.0815.421.331.64
Min0.790.250.390.300.690.300.840.34
Table 8. Final weights and bias values of the optimum FA-ANN model to estimate CO2 emissions and cost.
IWb1
1.9731−2.19982.6261−2.38205.23913.9098
−0.16600.4415−0.16670.24420.2667−0.2935
−0.1882−1.73761.0767−1.15291.9440−0.7258
−2.9288−3.8286−1.67150.71972.42723.1722
LW1b2
−1.3059−1.39290.98241.5435 0.8405
−0.90050.15710.0750−1.5616 −0.0179
0.3771−0.29960.01090.7141 1.2165
4.55270.8839−2.1155−2.0875 −5.0549
−0.5500−1.4244−2.3094−0.7354 −0.4599
LW2b3
−0.0971−2.5496−16.37040.0989−0.695313.4769
−1.0636−2.4175−15.9552−0.8183−0.205312.7690
IW: Weights values for Input Layer; LW1: Weights values for First Hidden; LW2: Weights values for Second Hidden Layer; b1: Bias values for First Hidden Layer; b2: Bias values for Second Hidden Layer; b3: Bias values for Output Layers.
Publisher’s Note: MDPI stays neutral with regard to jurisdictional claims in published maps and institutional affiliations.

