
Literature Review of Socioeconomic and Environmental Impacts of High-Speed Rail in the World


Abstract
:1. Introduction
2. Methodology
2.1. Article Identification and Selection
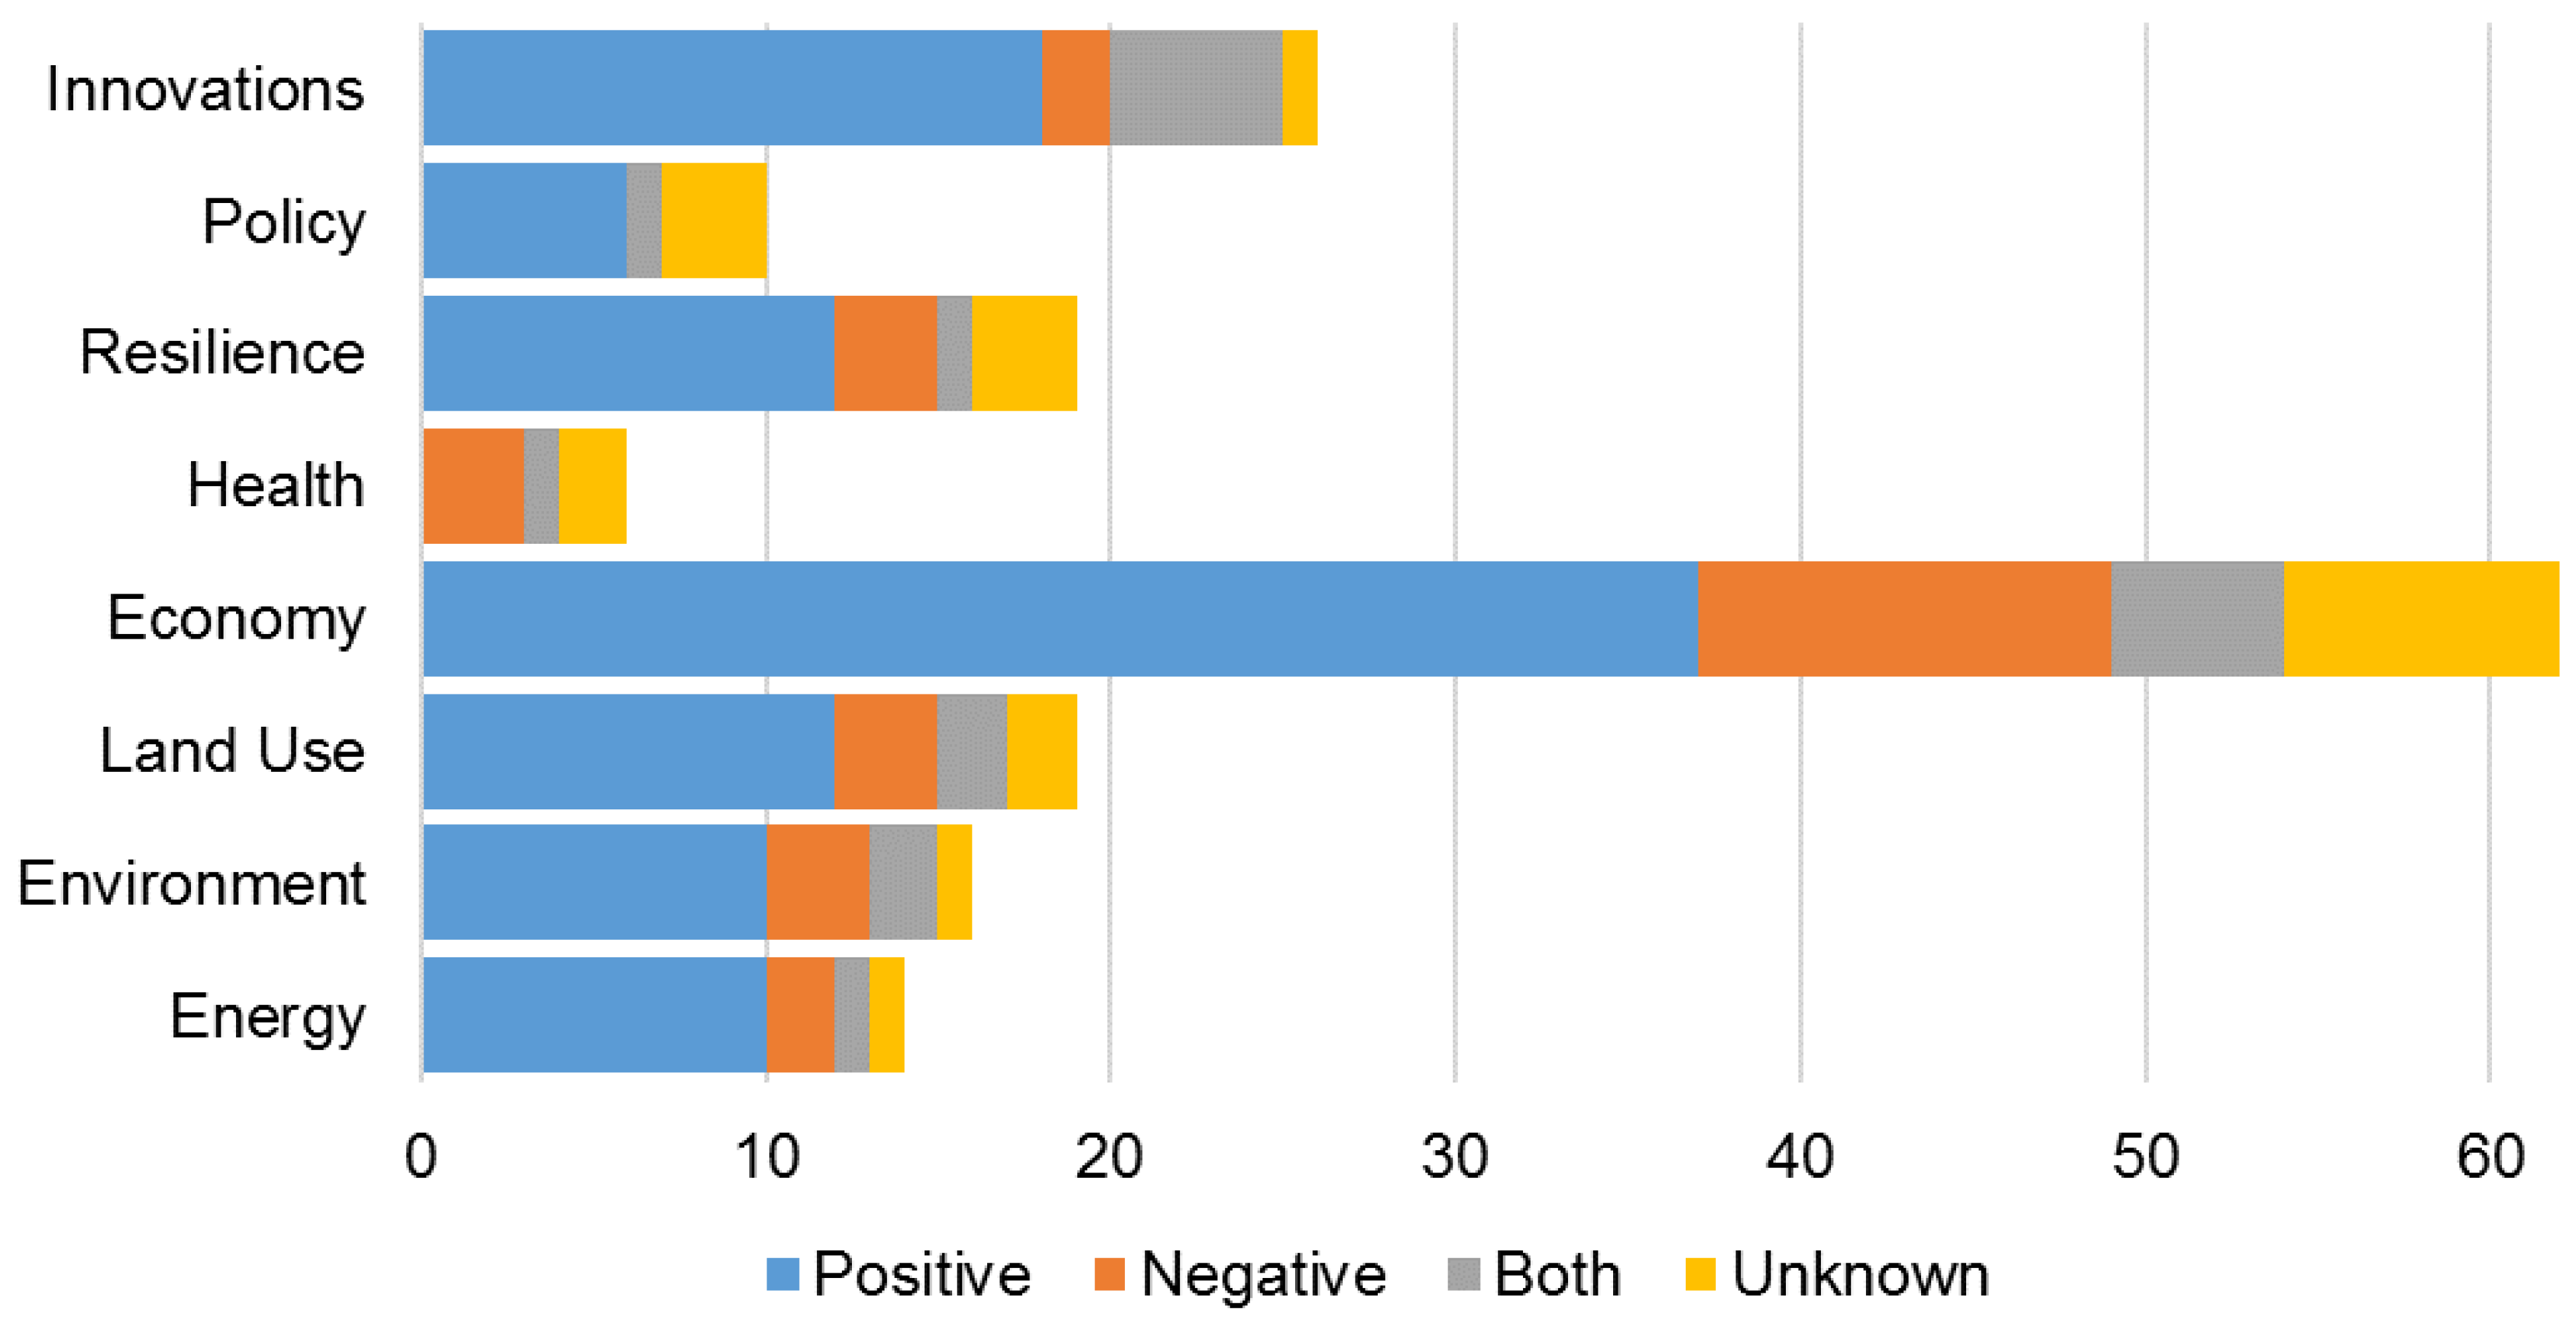
2.2. Impact Area Classification
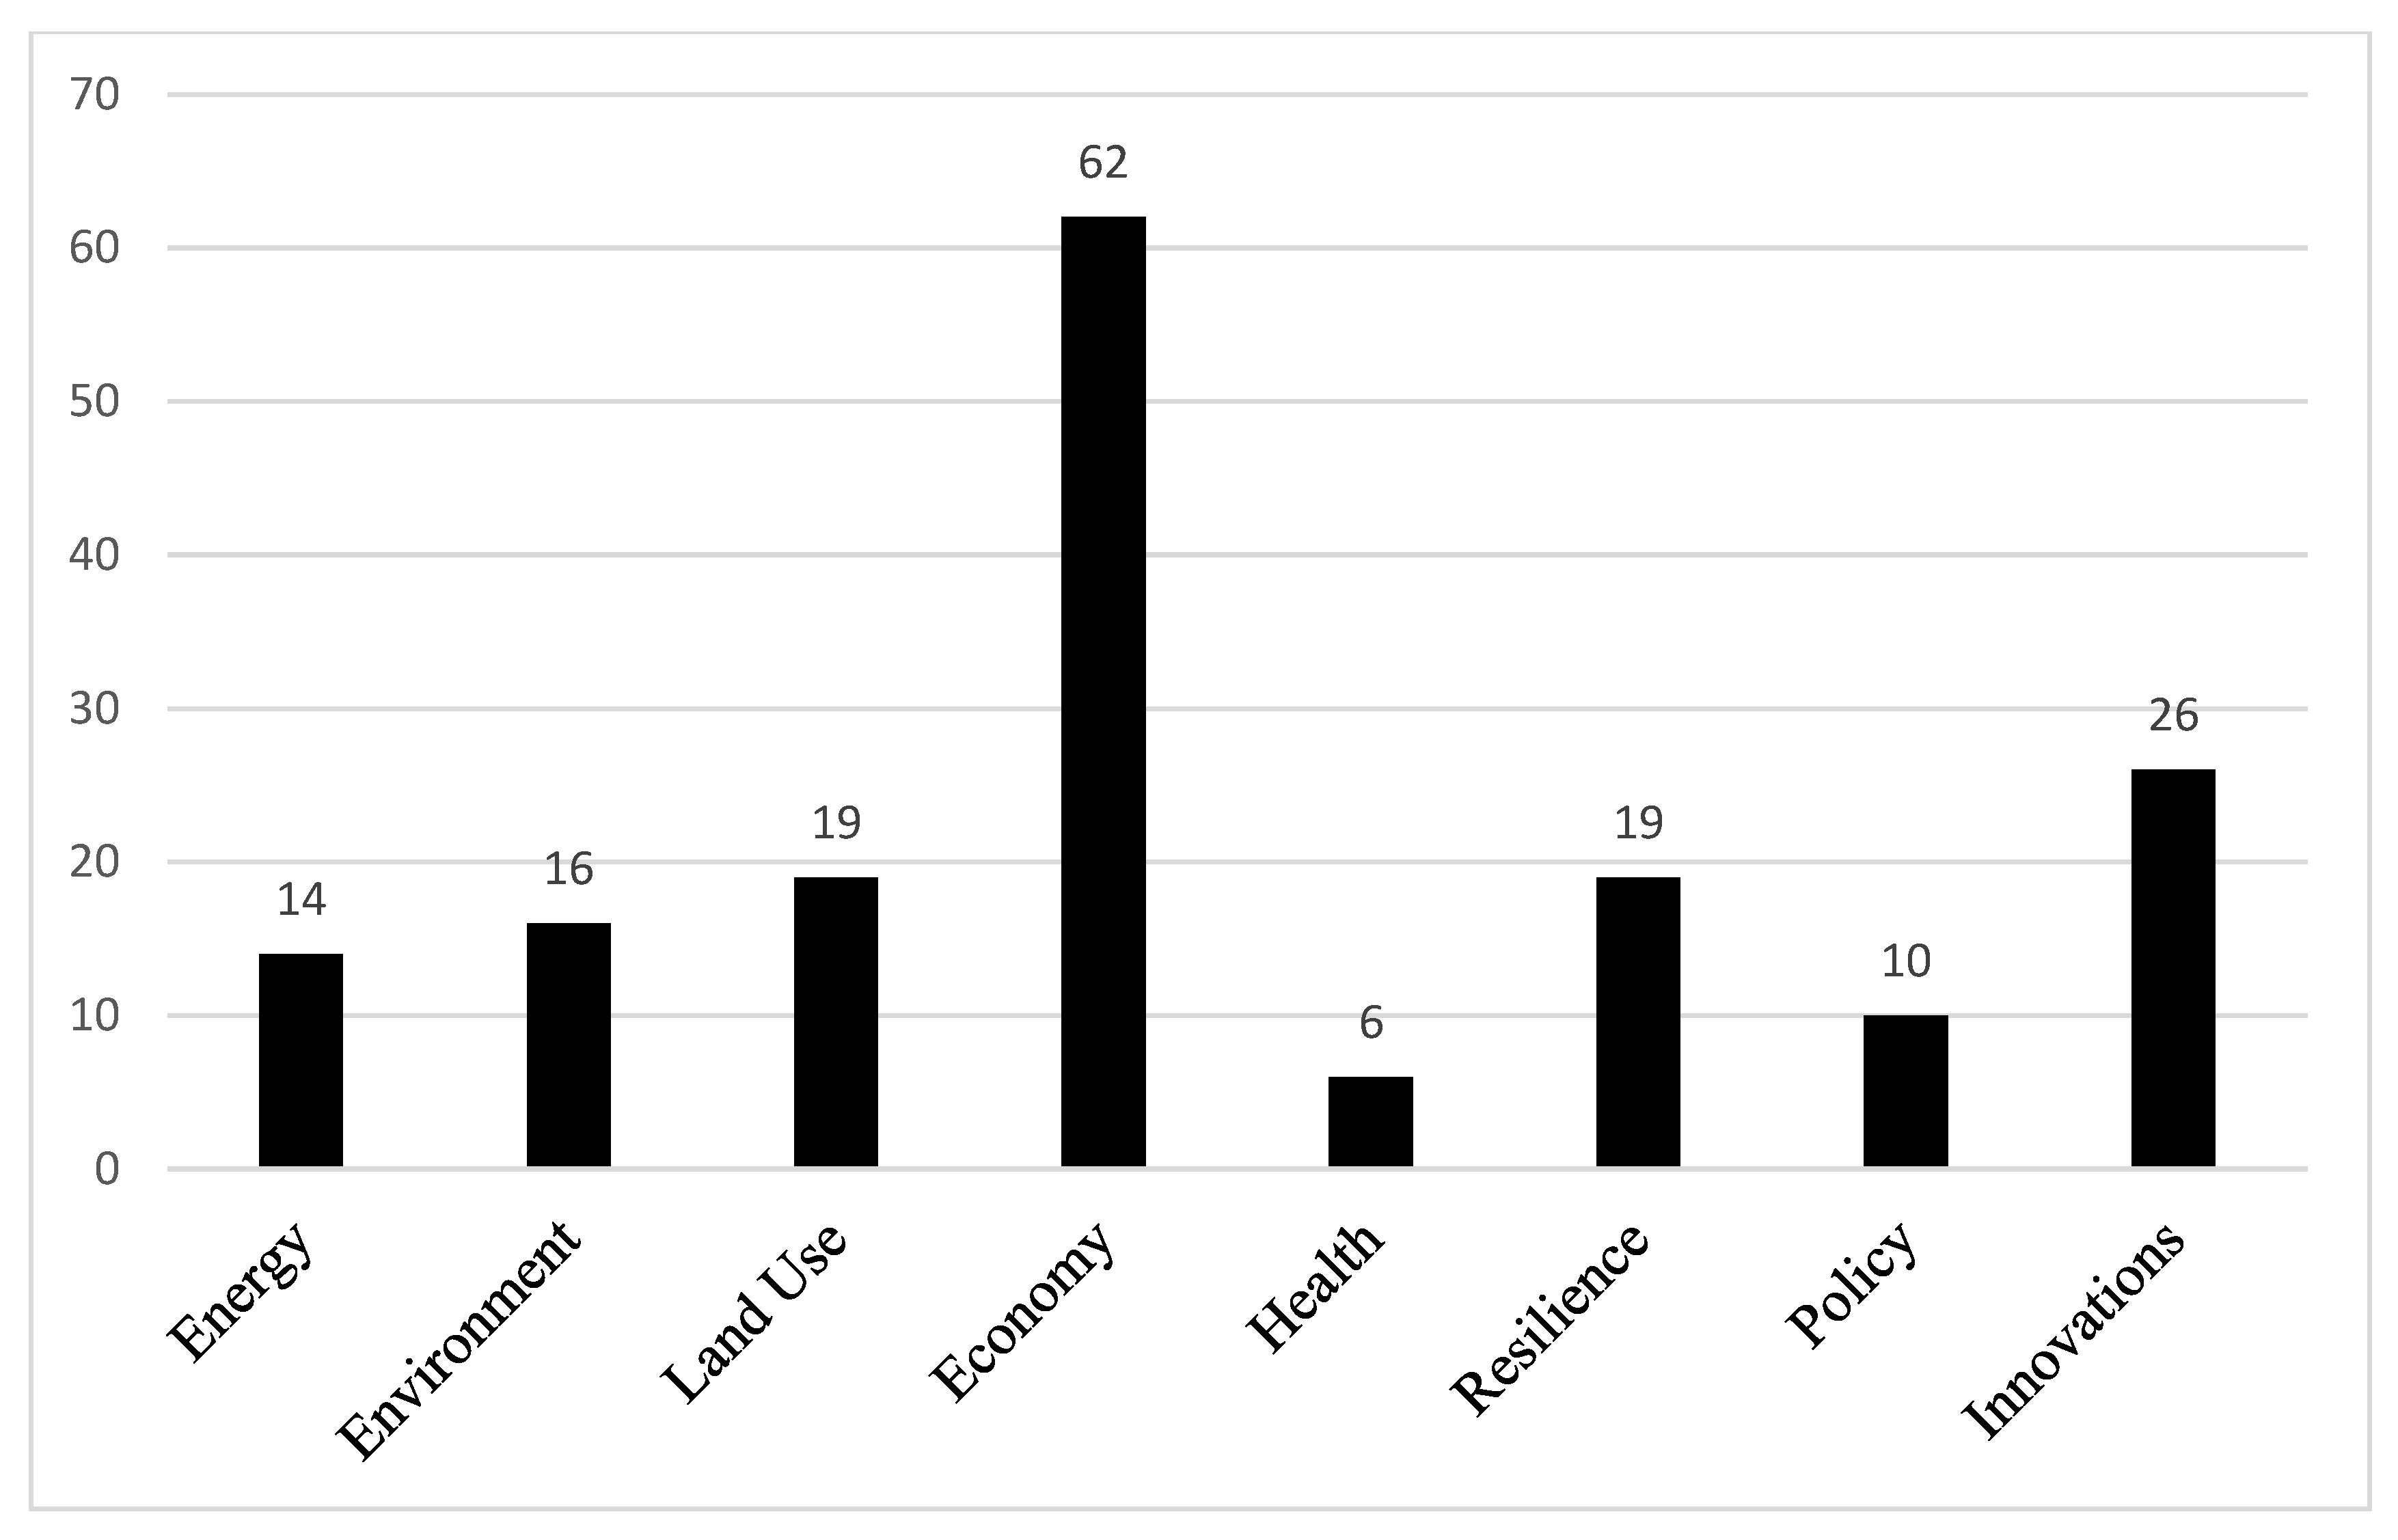
- Energy: consumption and savings for a nation.
- Environment: emissions and air quality.
- Land: allocation impacts on urban sprawl, community severance, and biodiversity.
- Economy: travel behavior, employment, and efficiency effects on local economies.
- Health: quality of life and implications for human health.
- Resilience: vulnerability and resilience of transport systems.
- Policy: implications and analysis of relevant policies.
- Innovations: original approaches to developments and deployments.
2.2.1. Energy
2.2.2. Environment
2.2.3. Land
2.2.4. Economy
2.2.5. Health
2.2.6. Resilience
2.2.7. Policy
2.2.8. Innovations
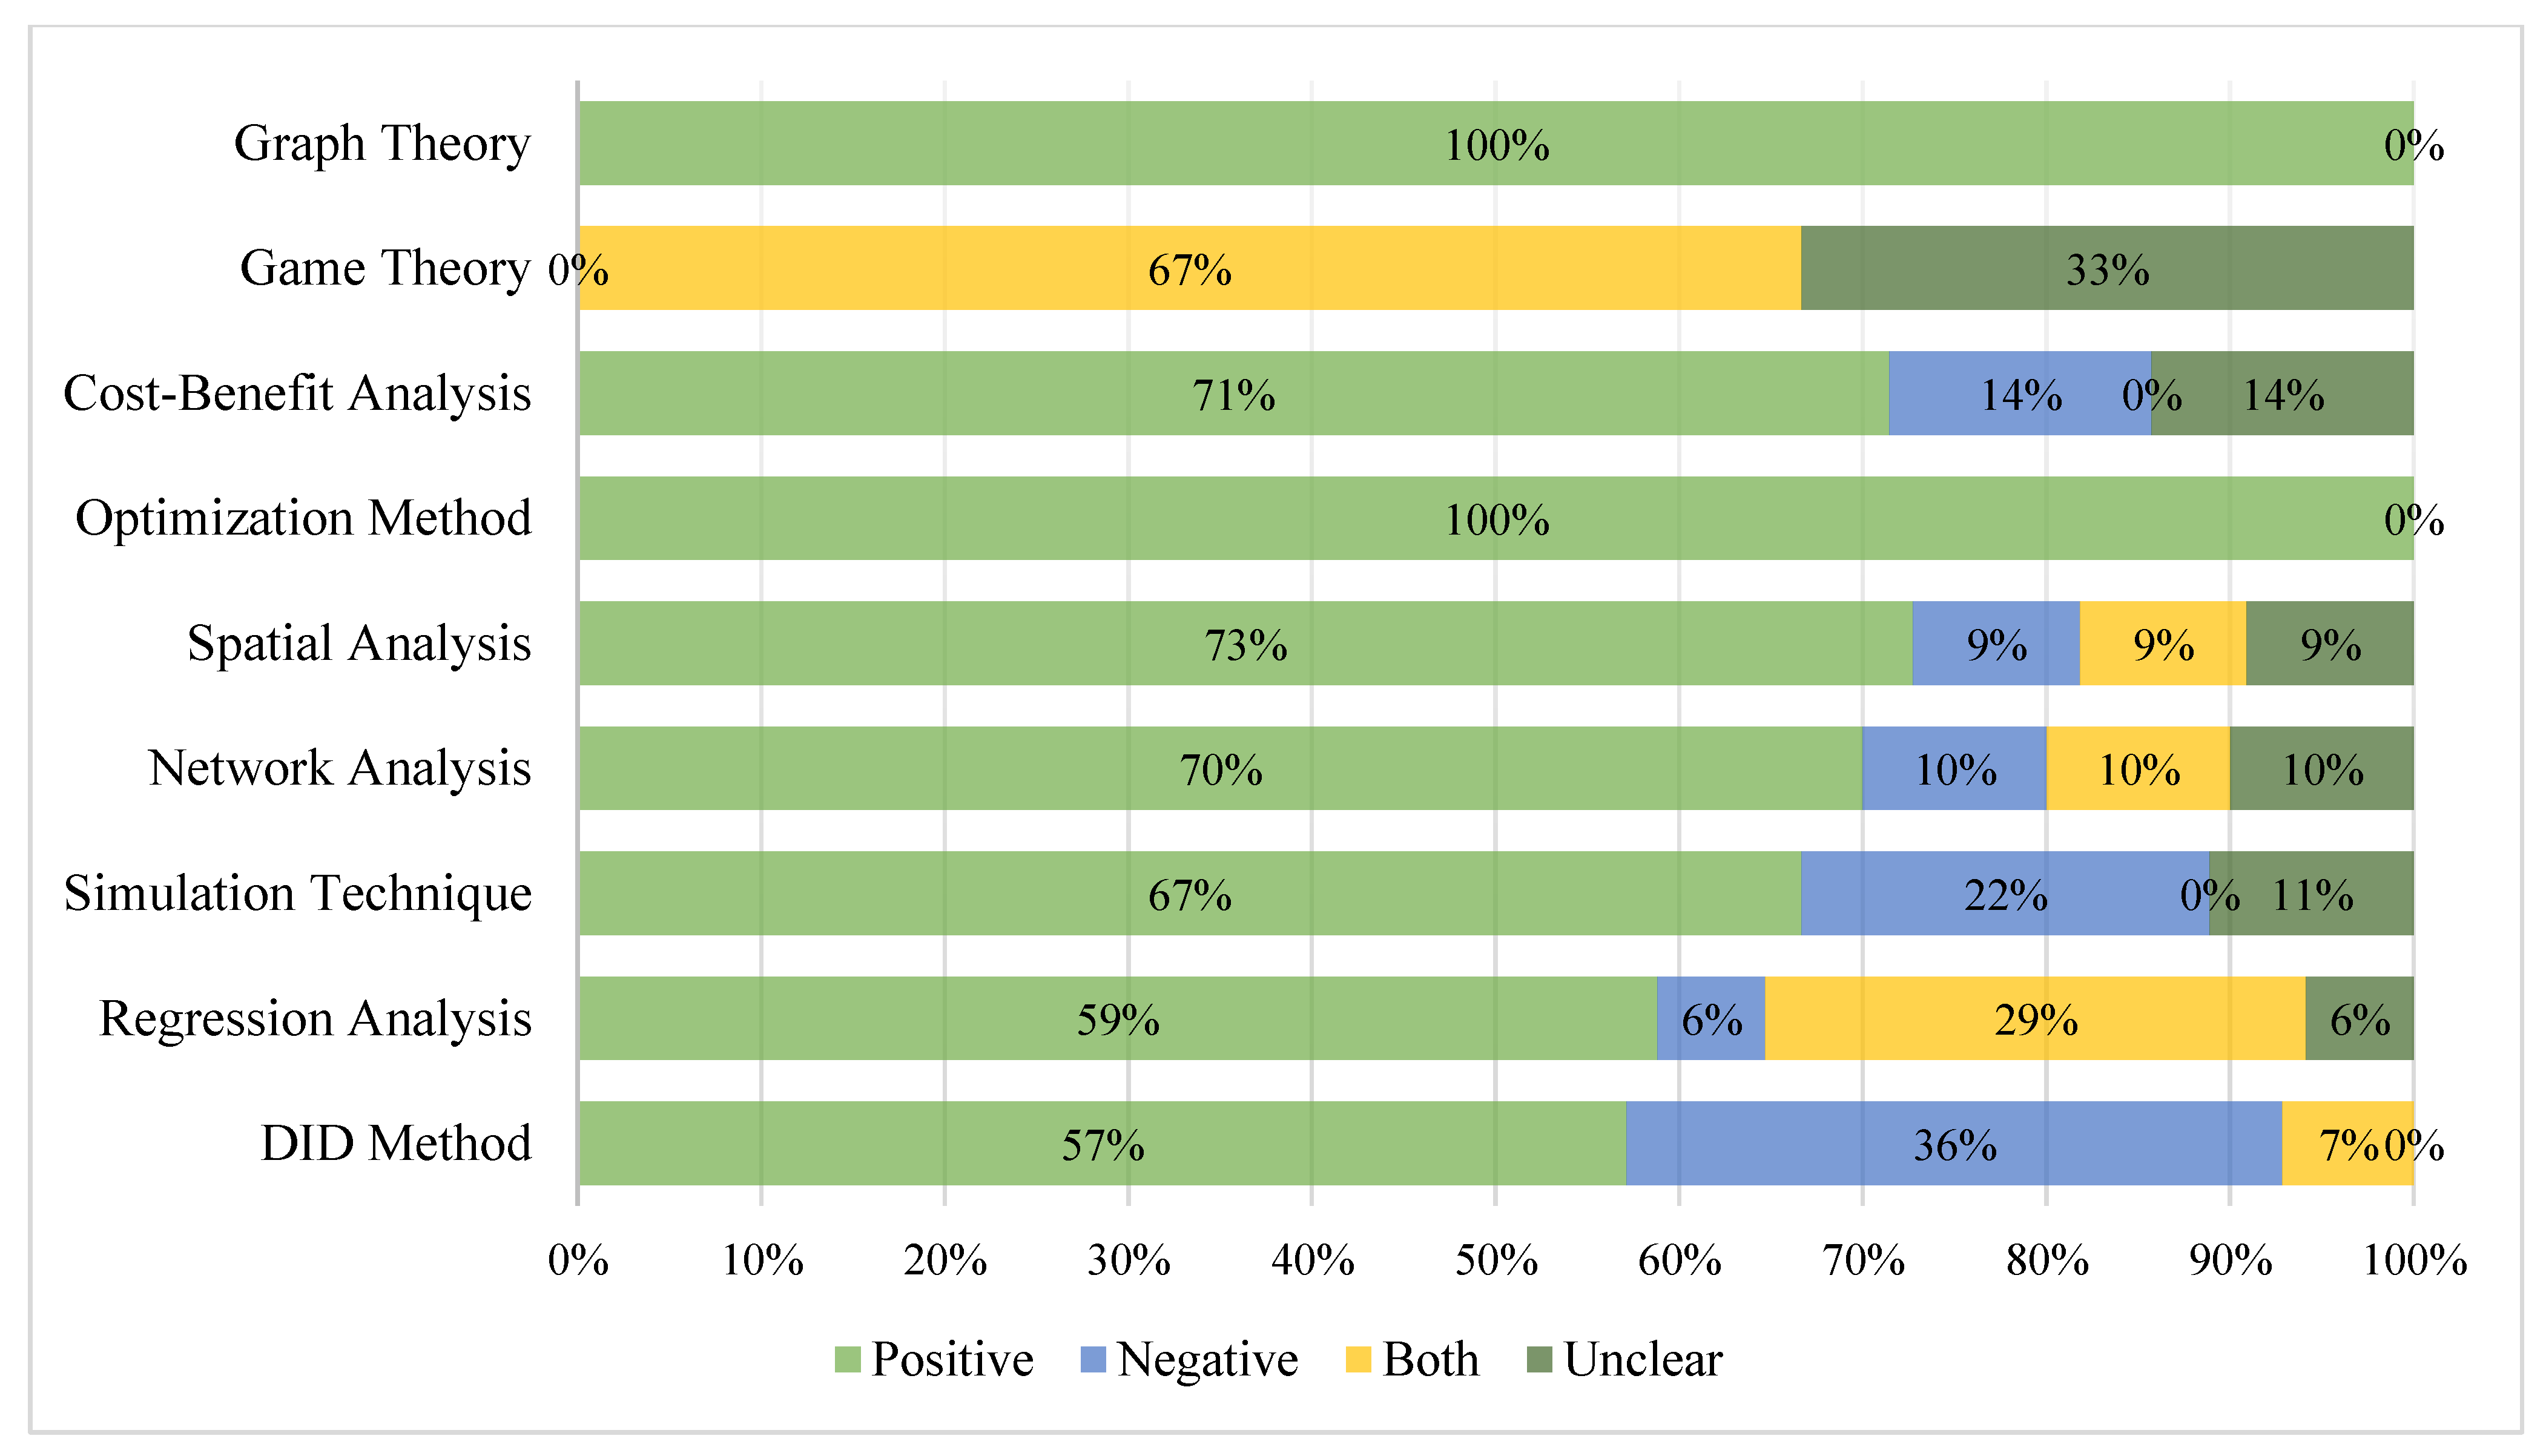
2.3. Analysis Technique Classification
2.4. Bivariate Frequency Distributions
3. Results
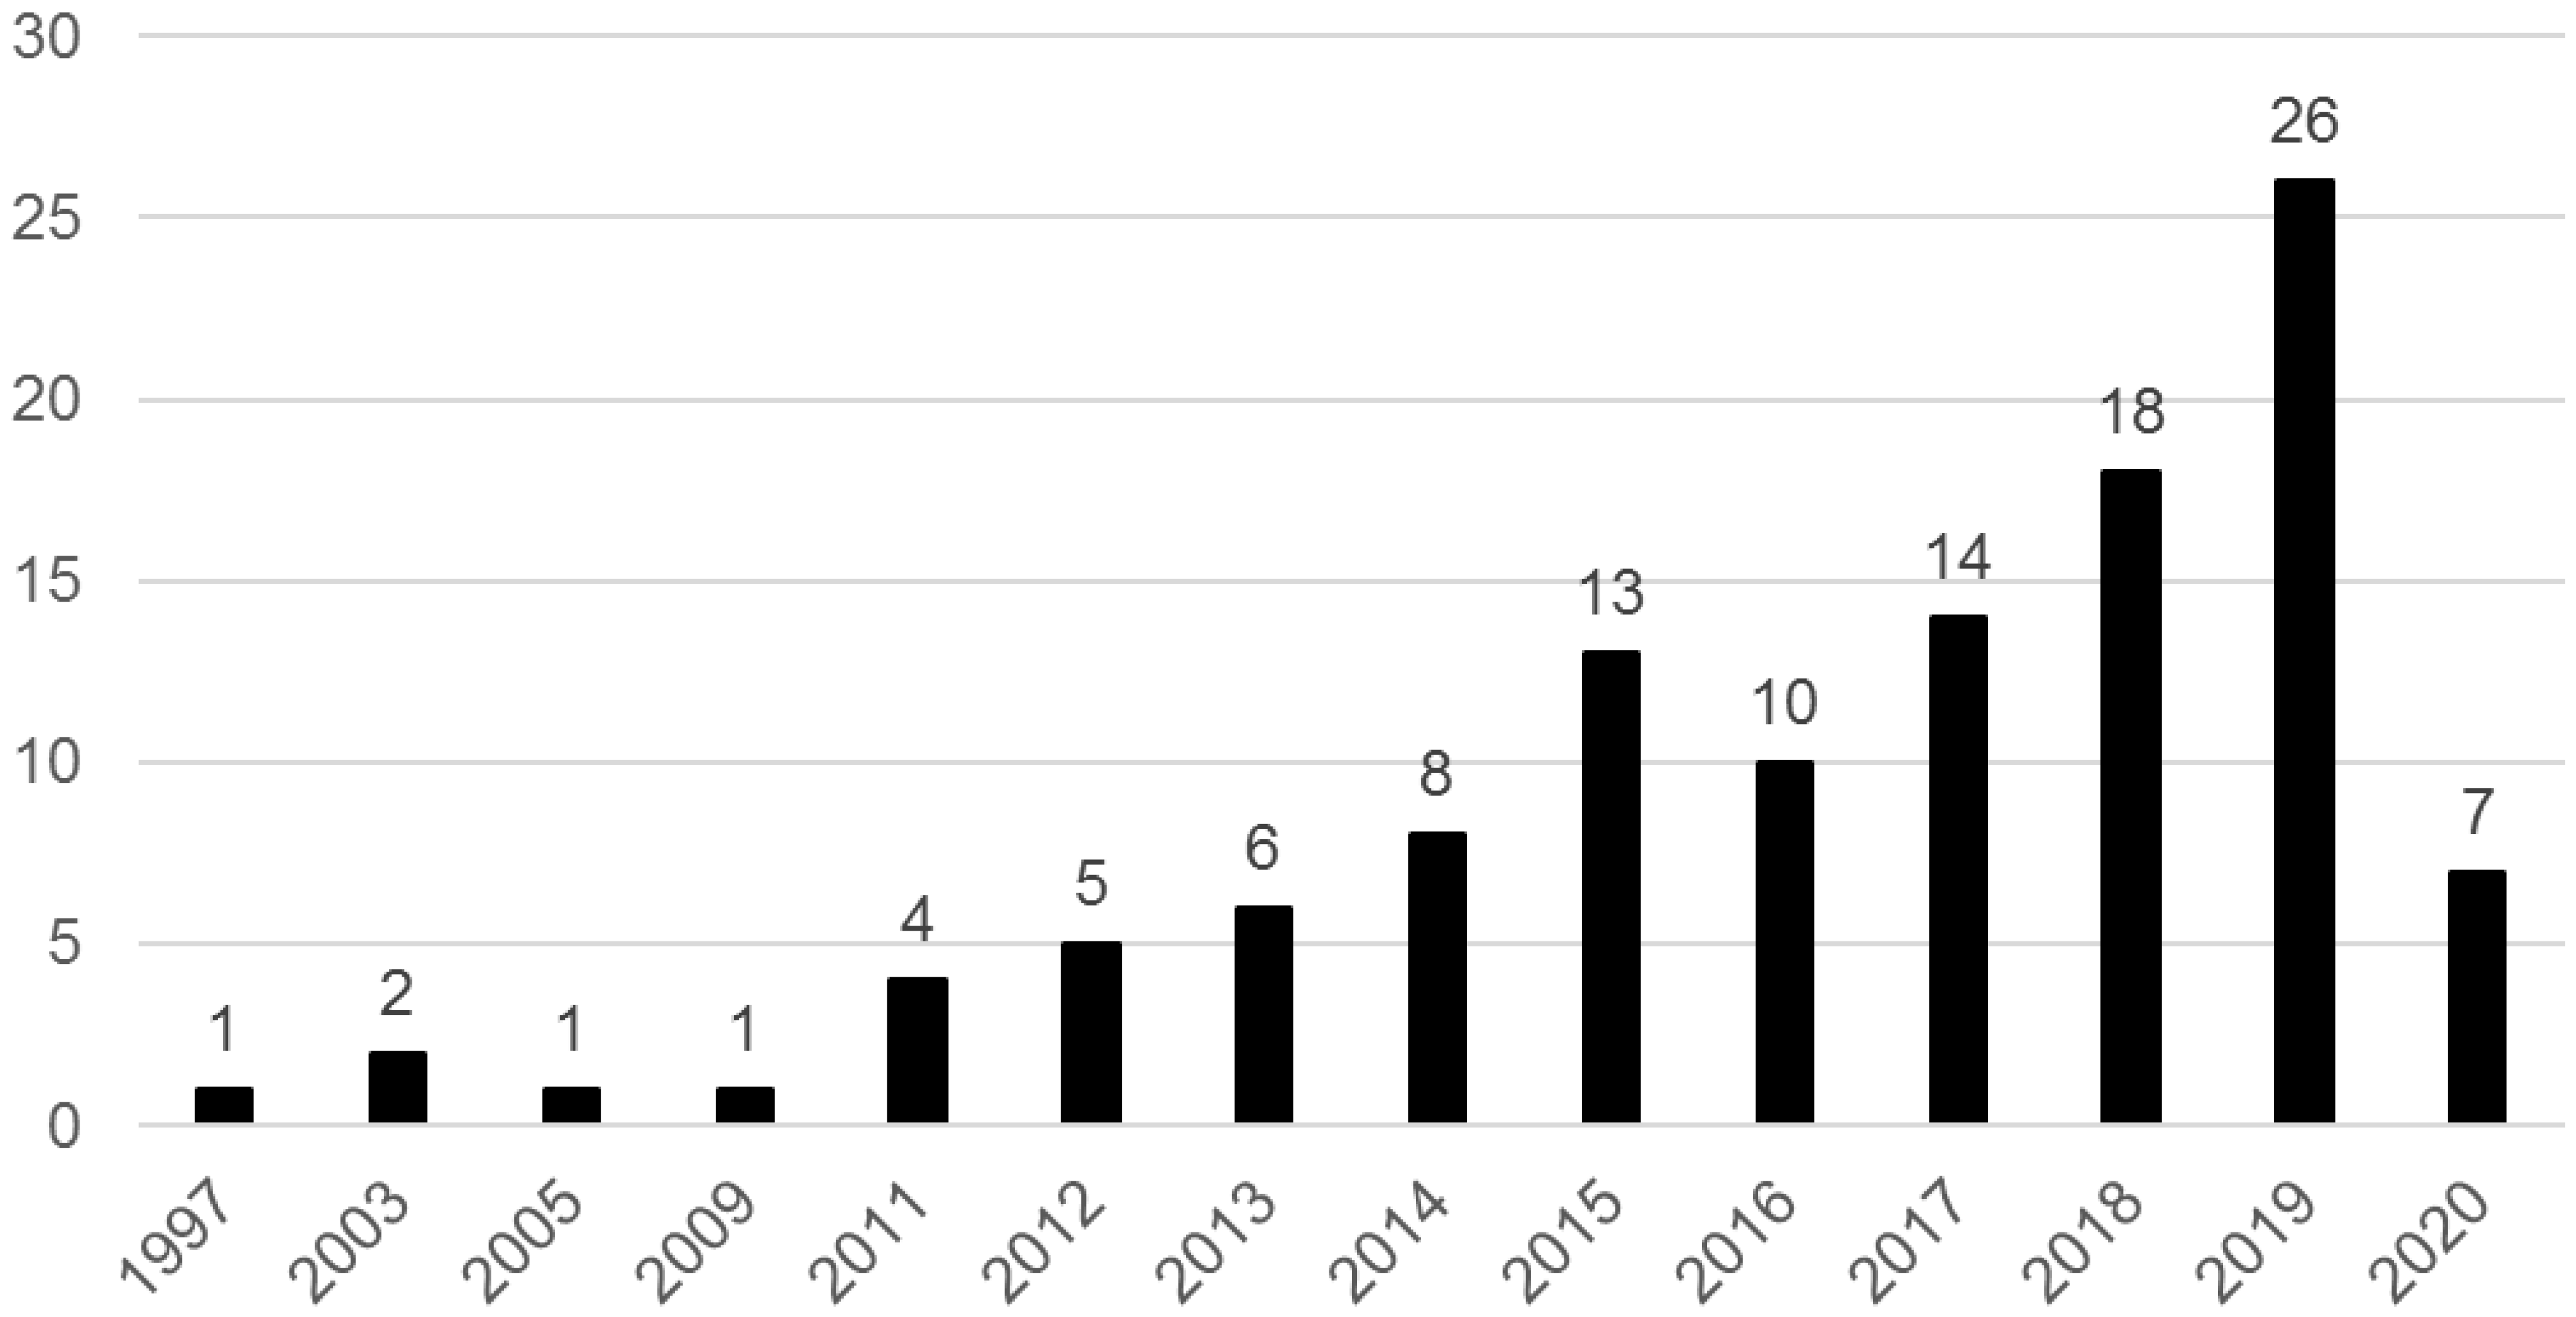
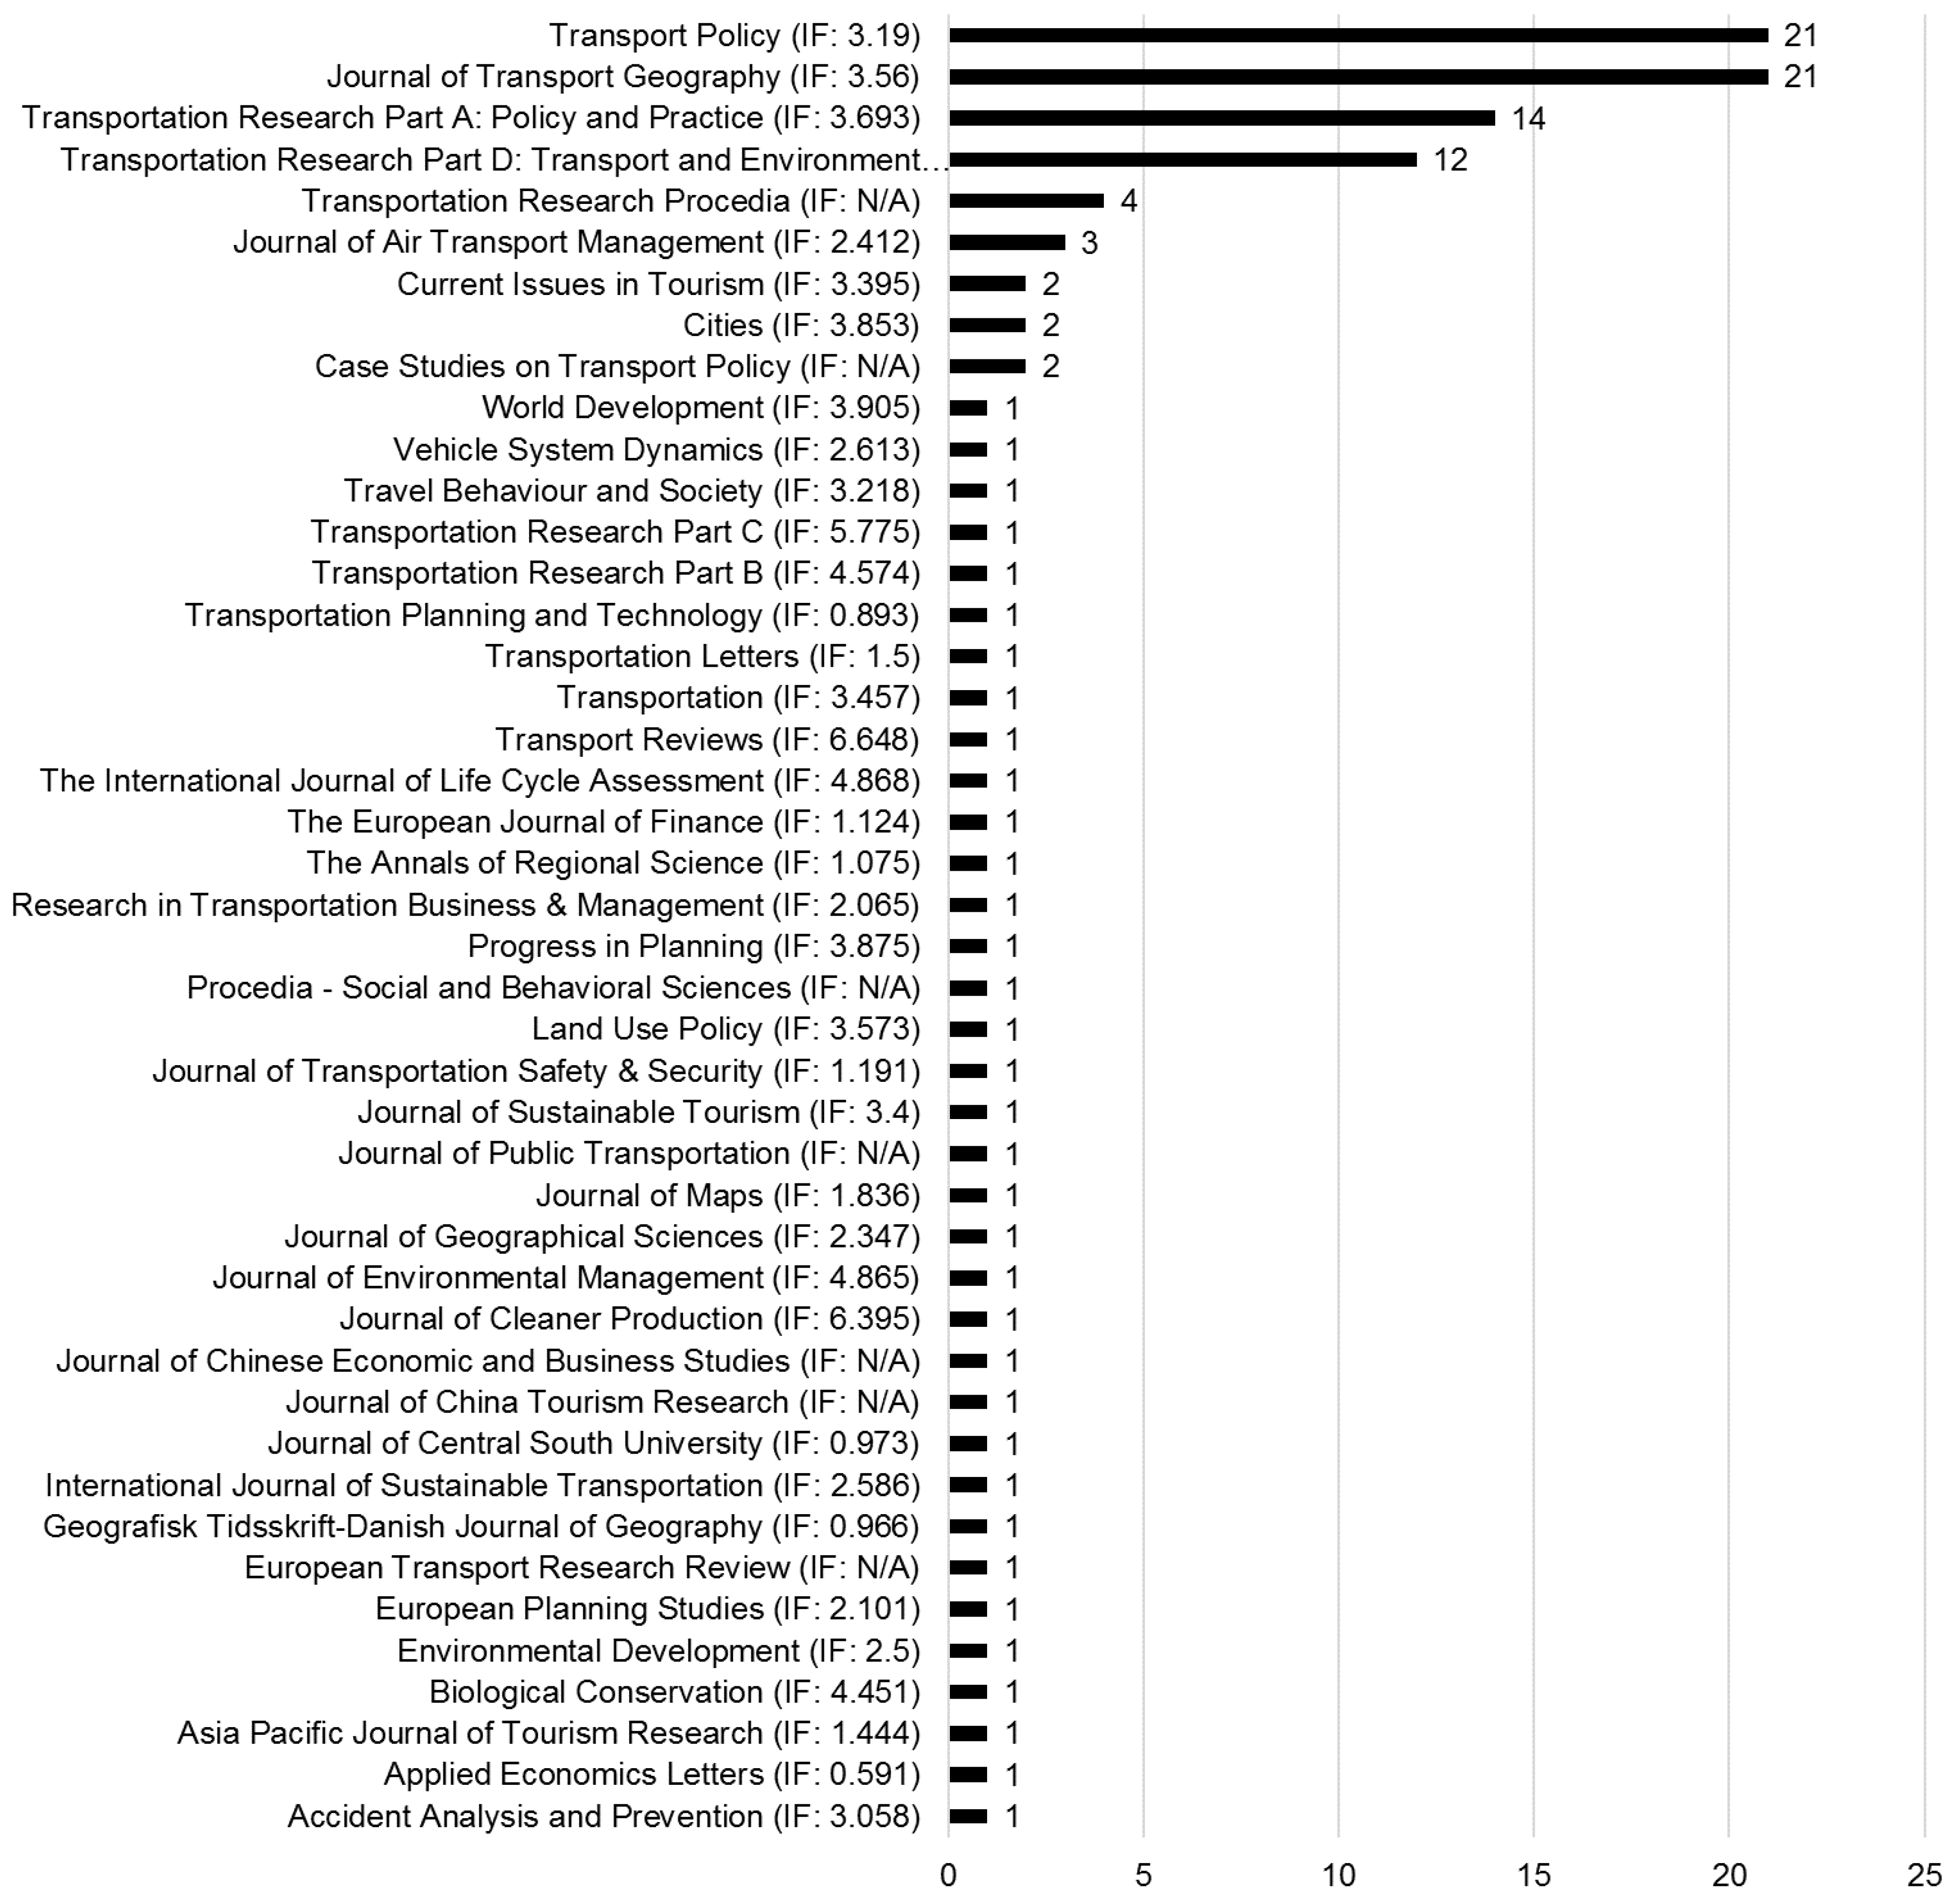
3.1. Journal Distribution
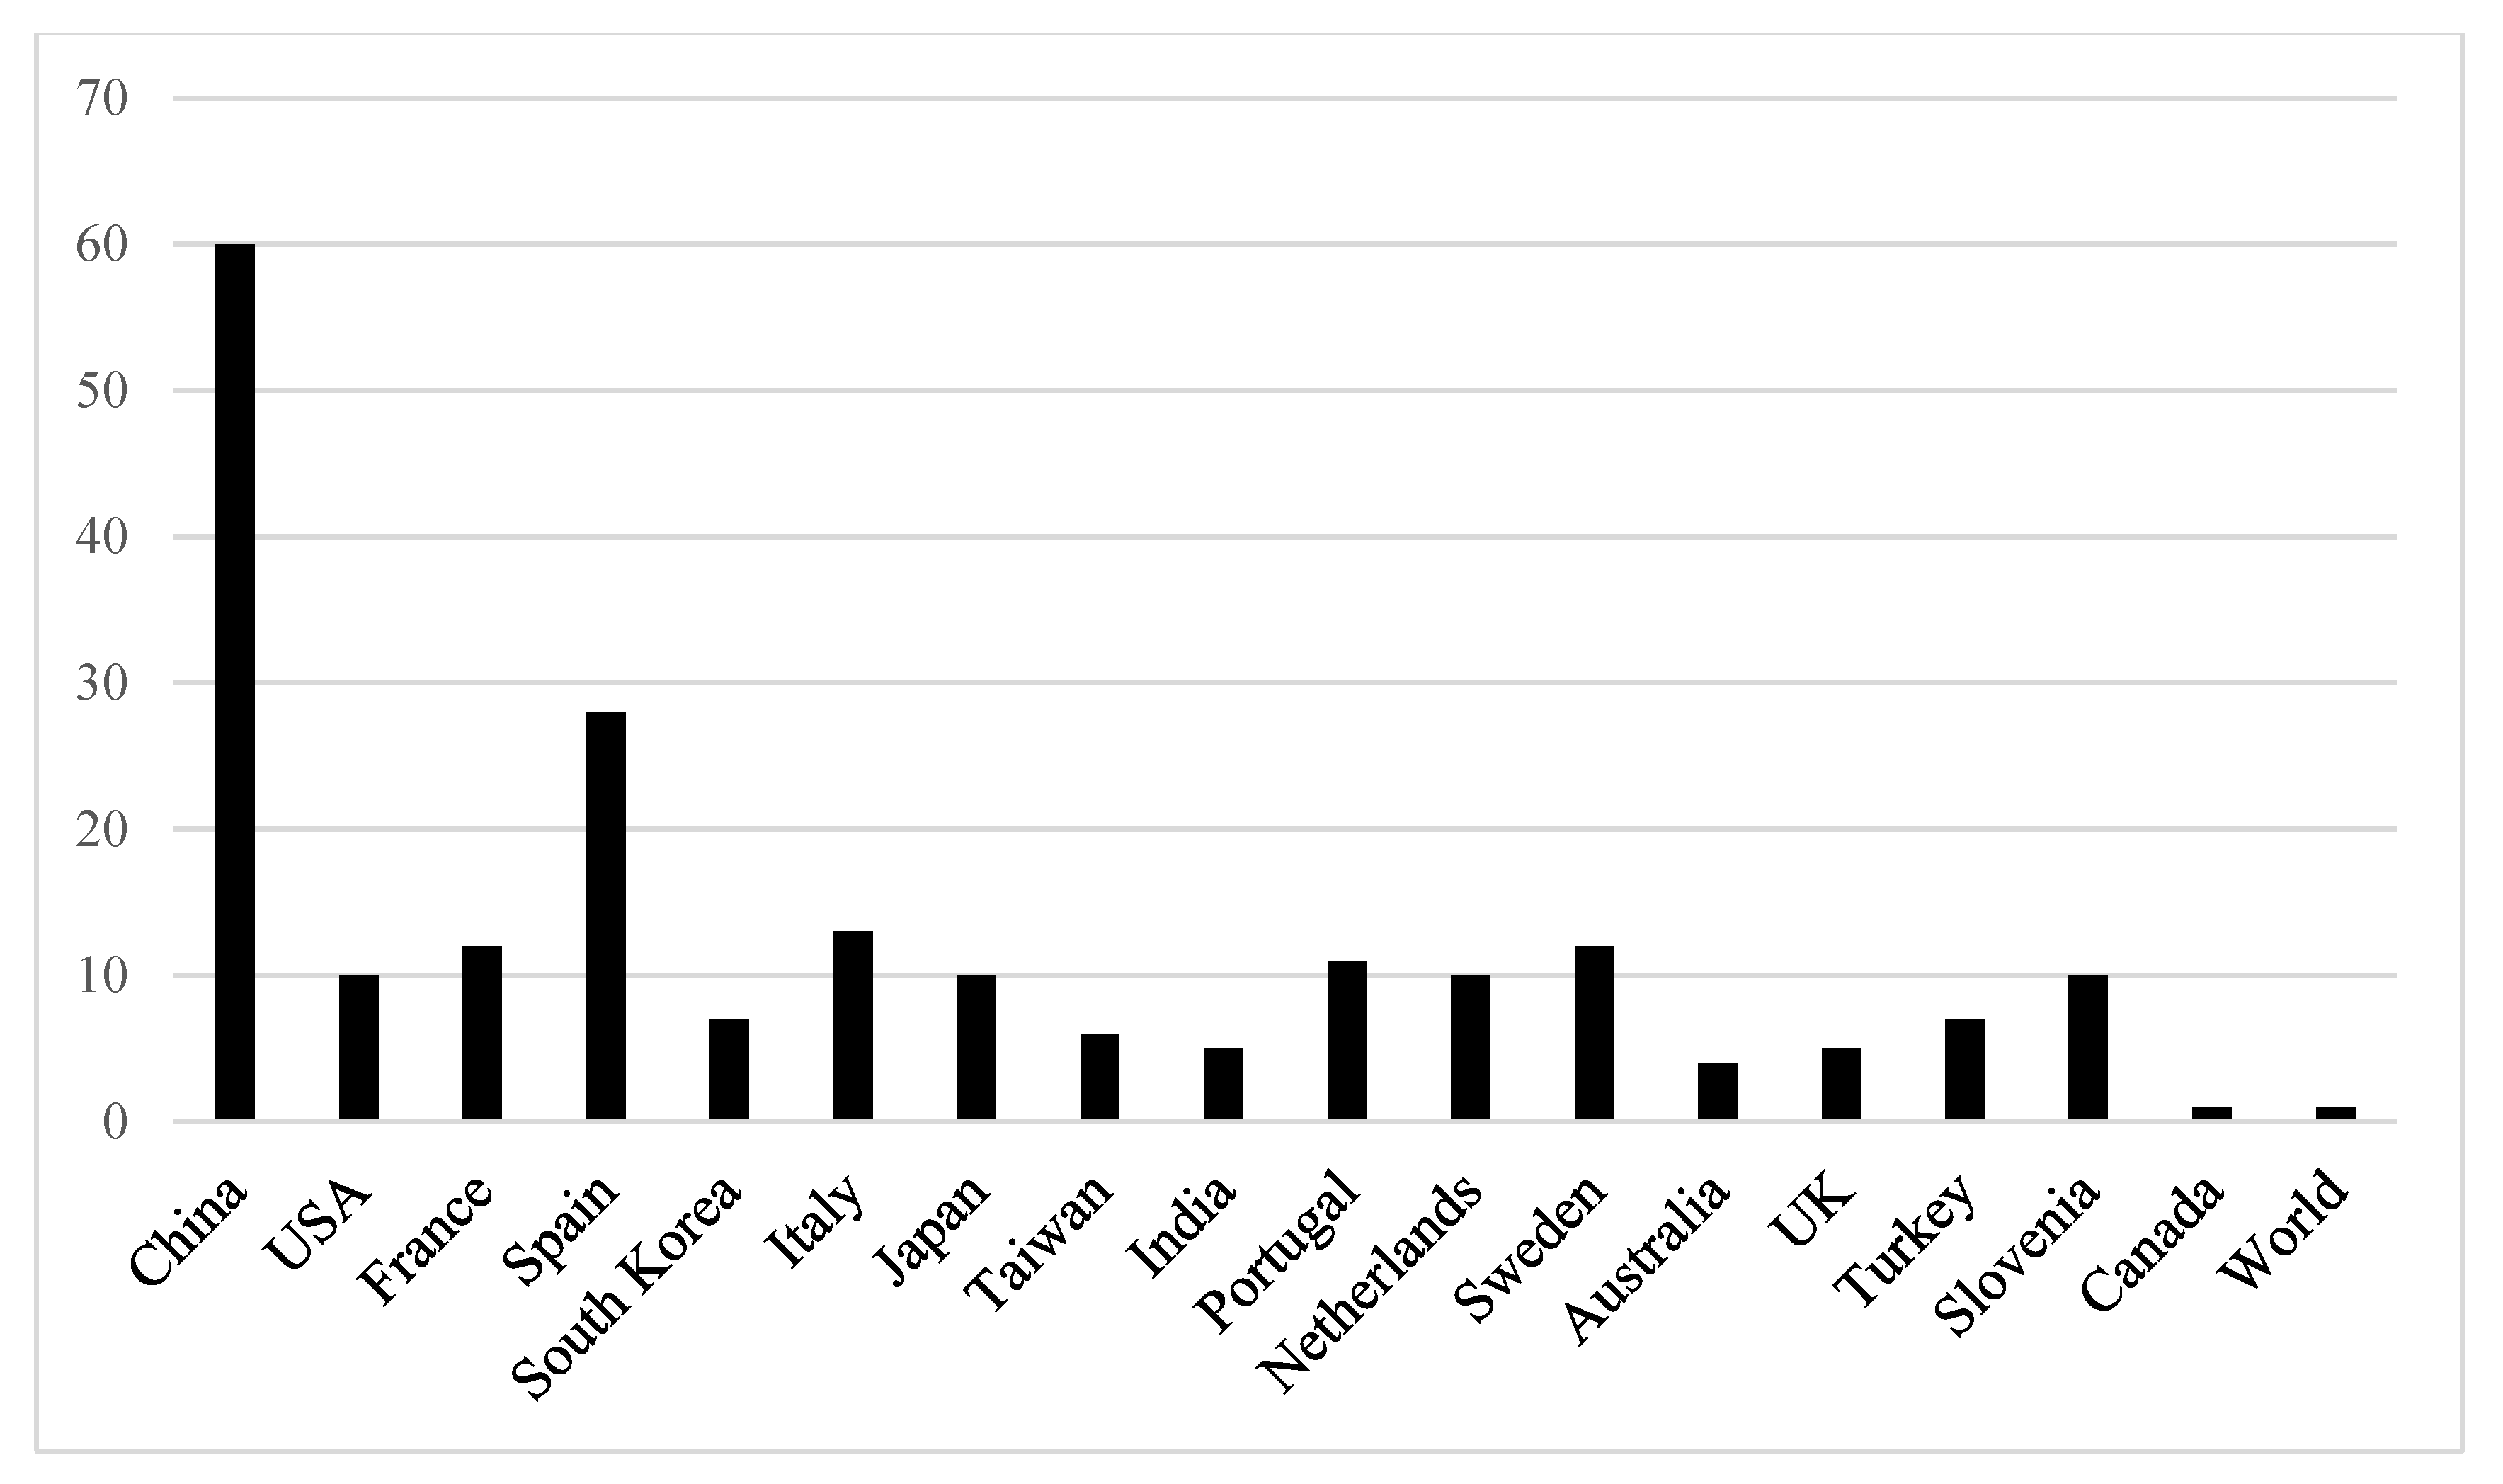
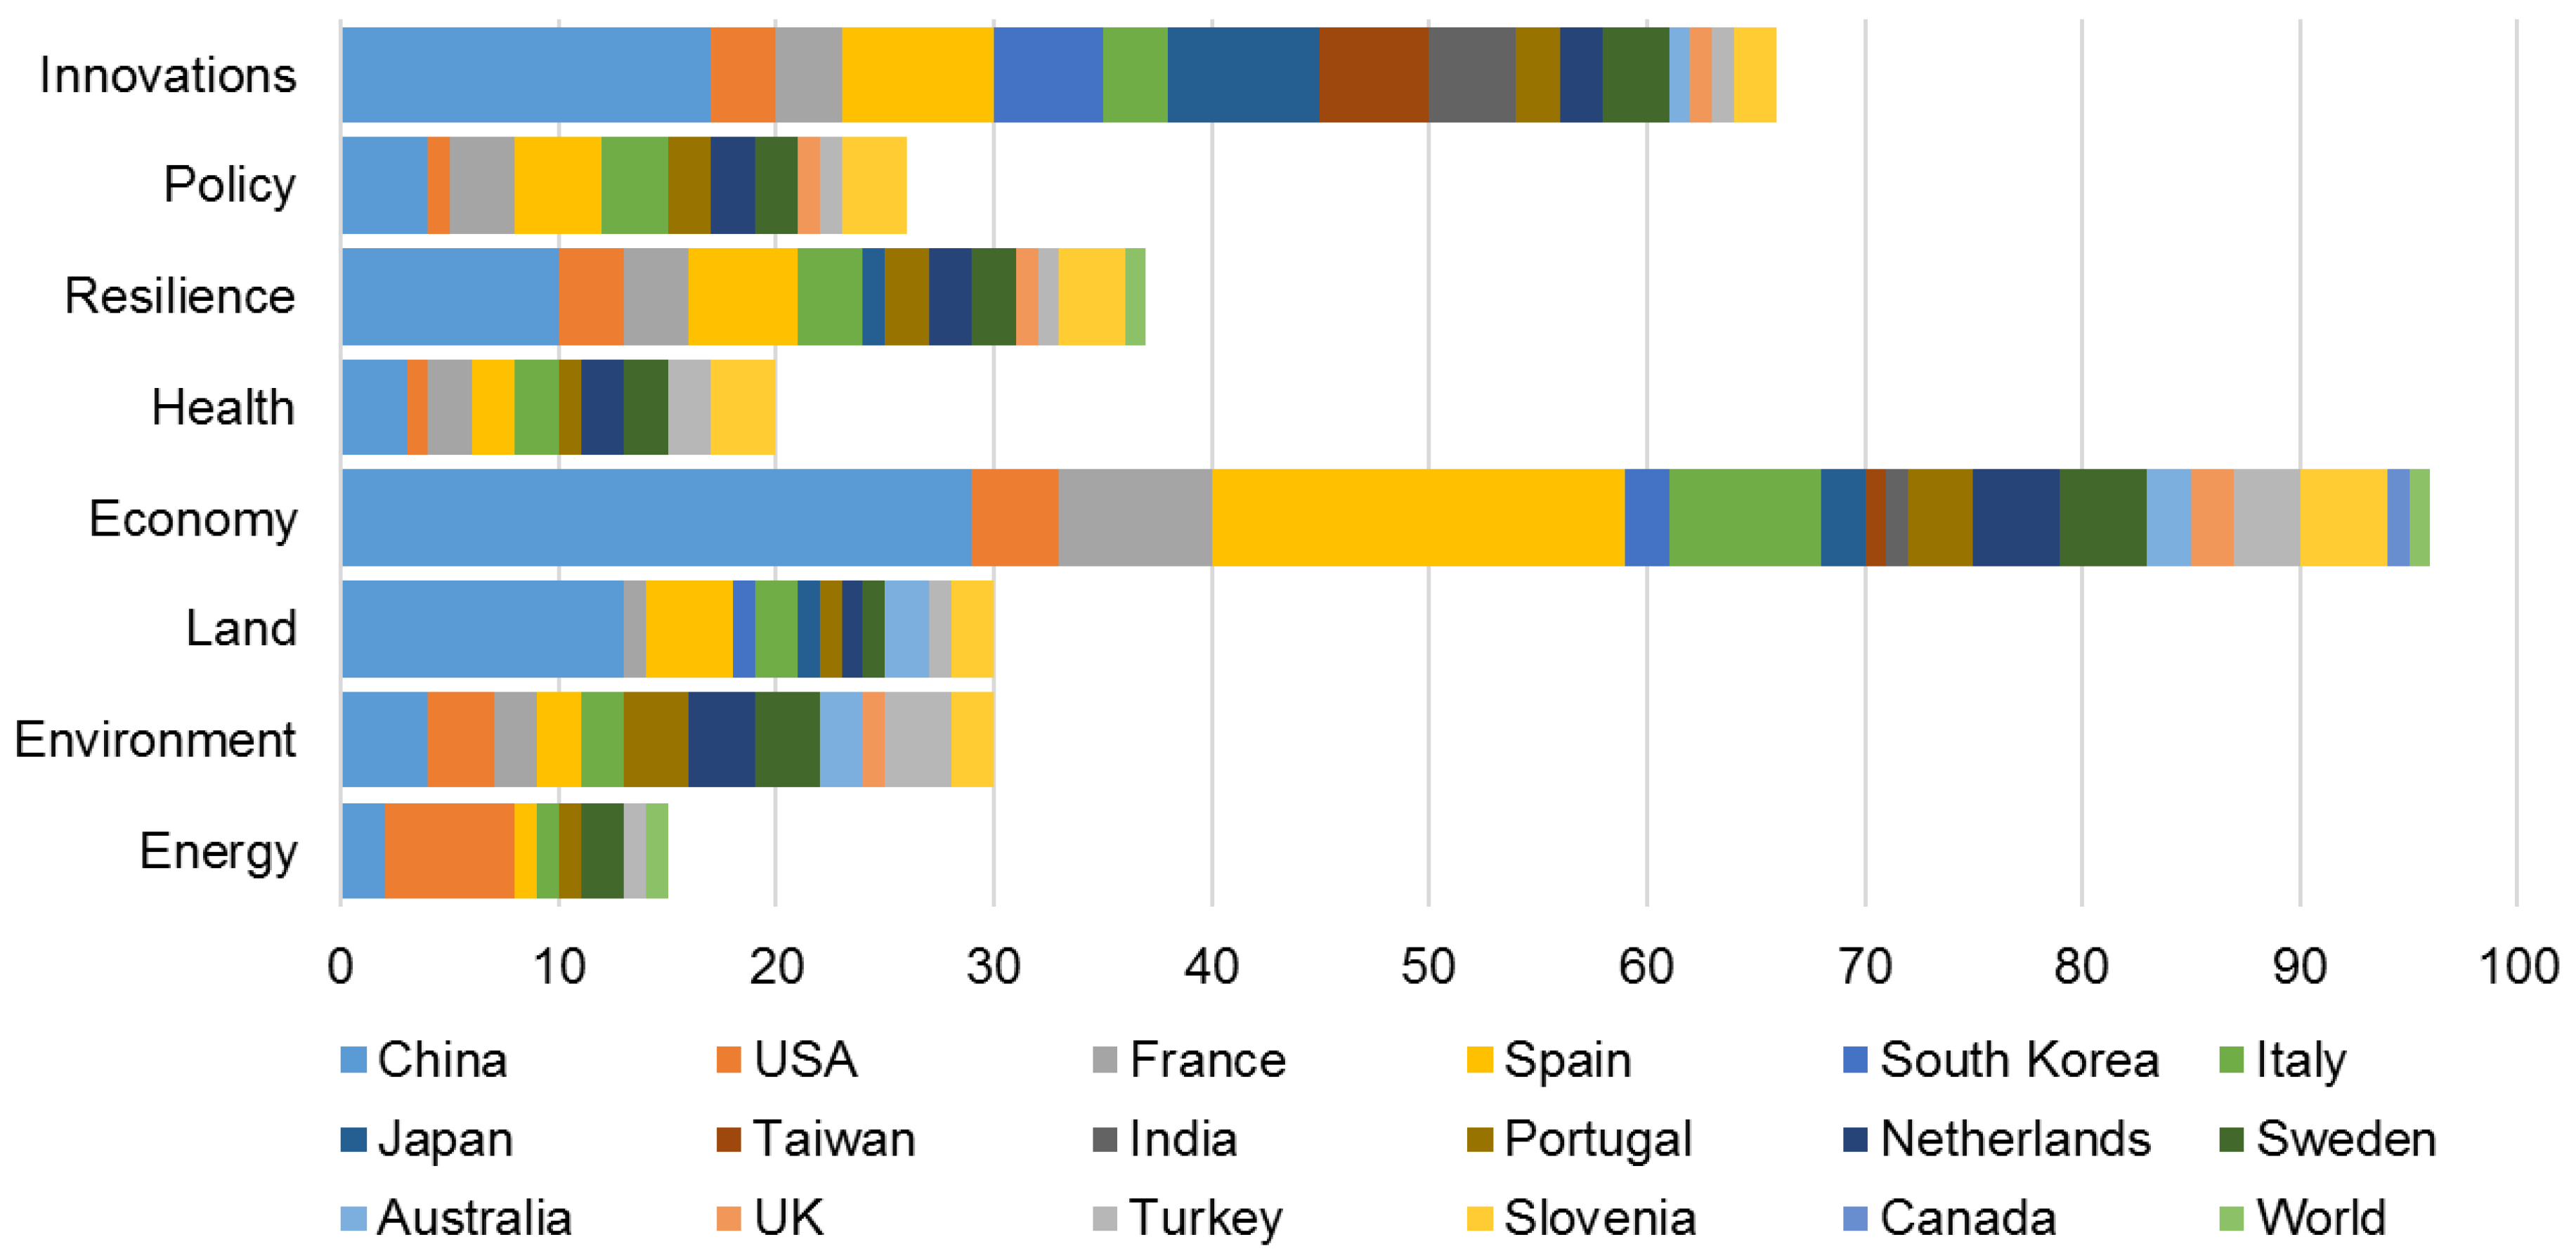
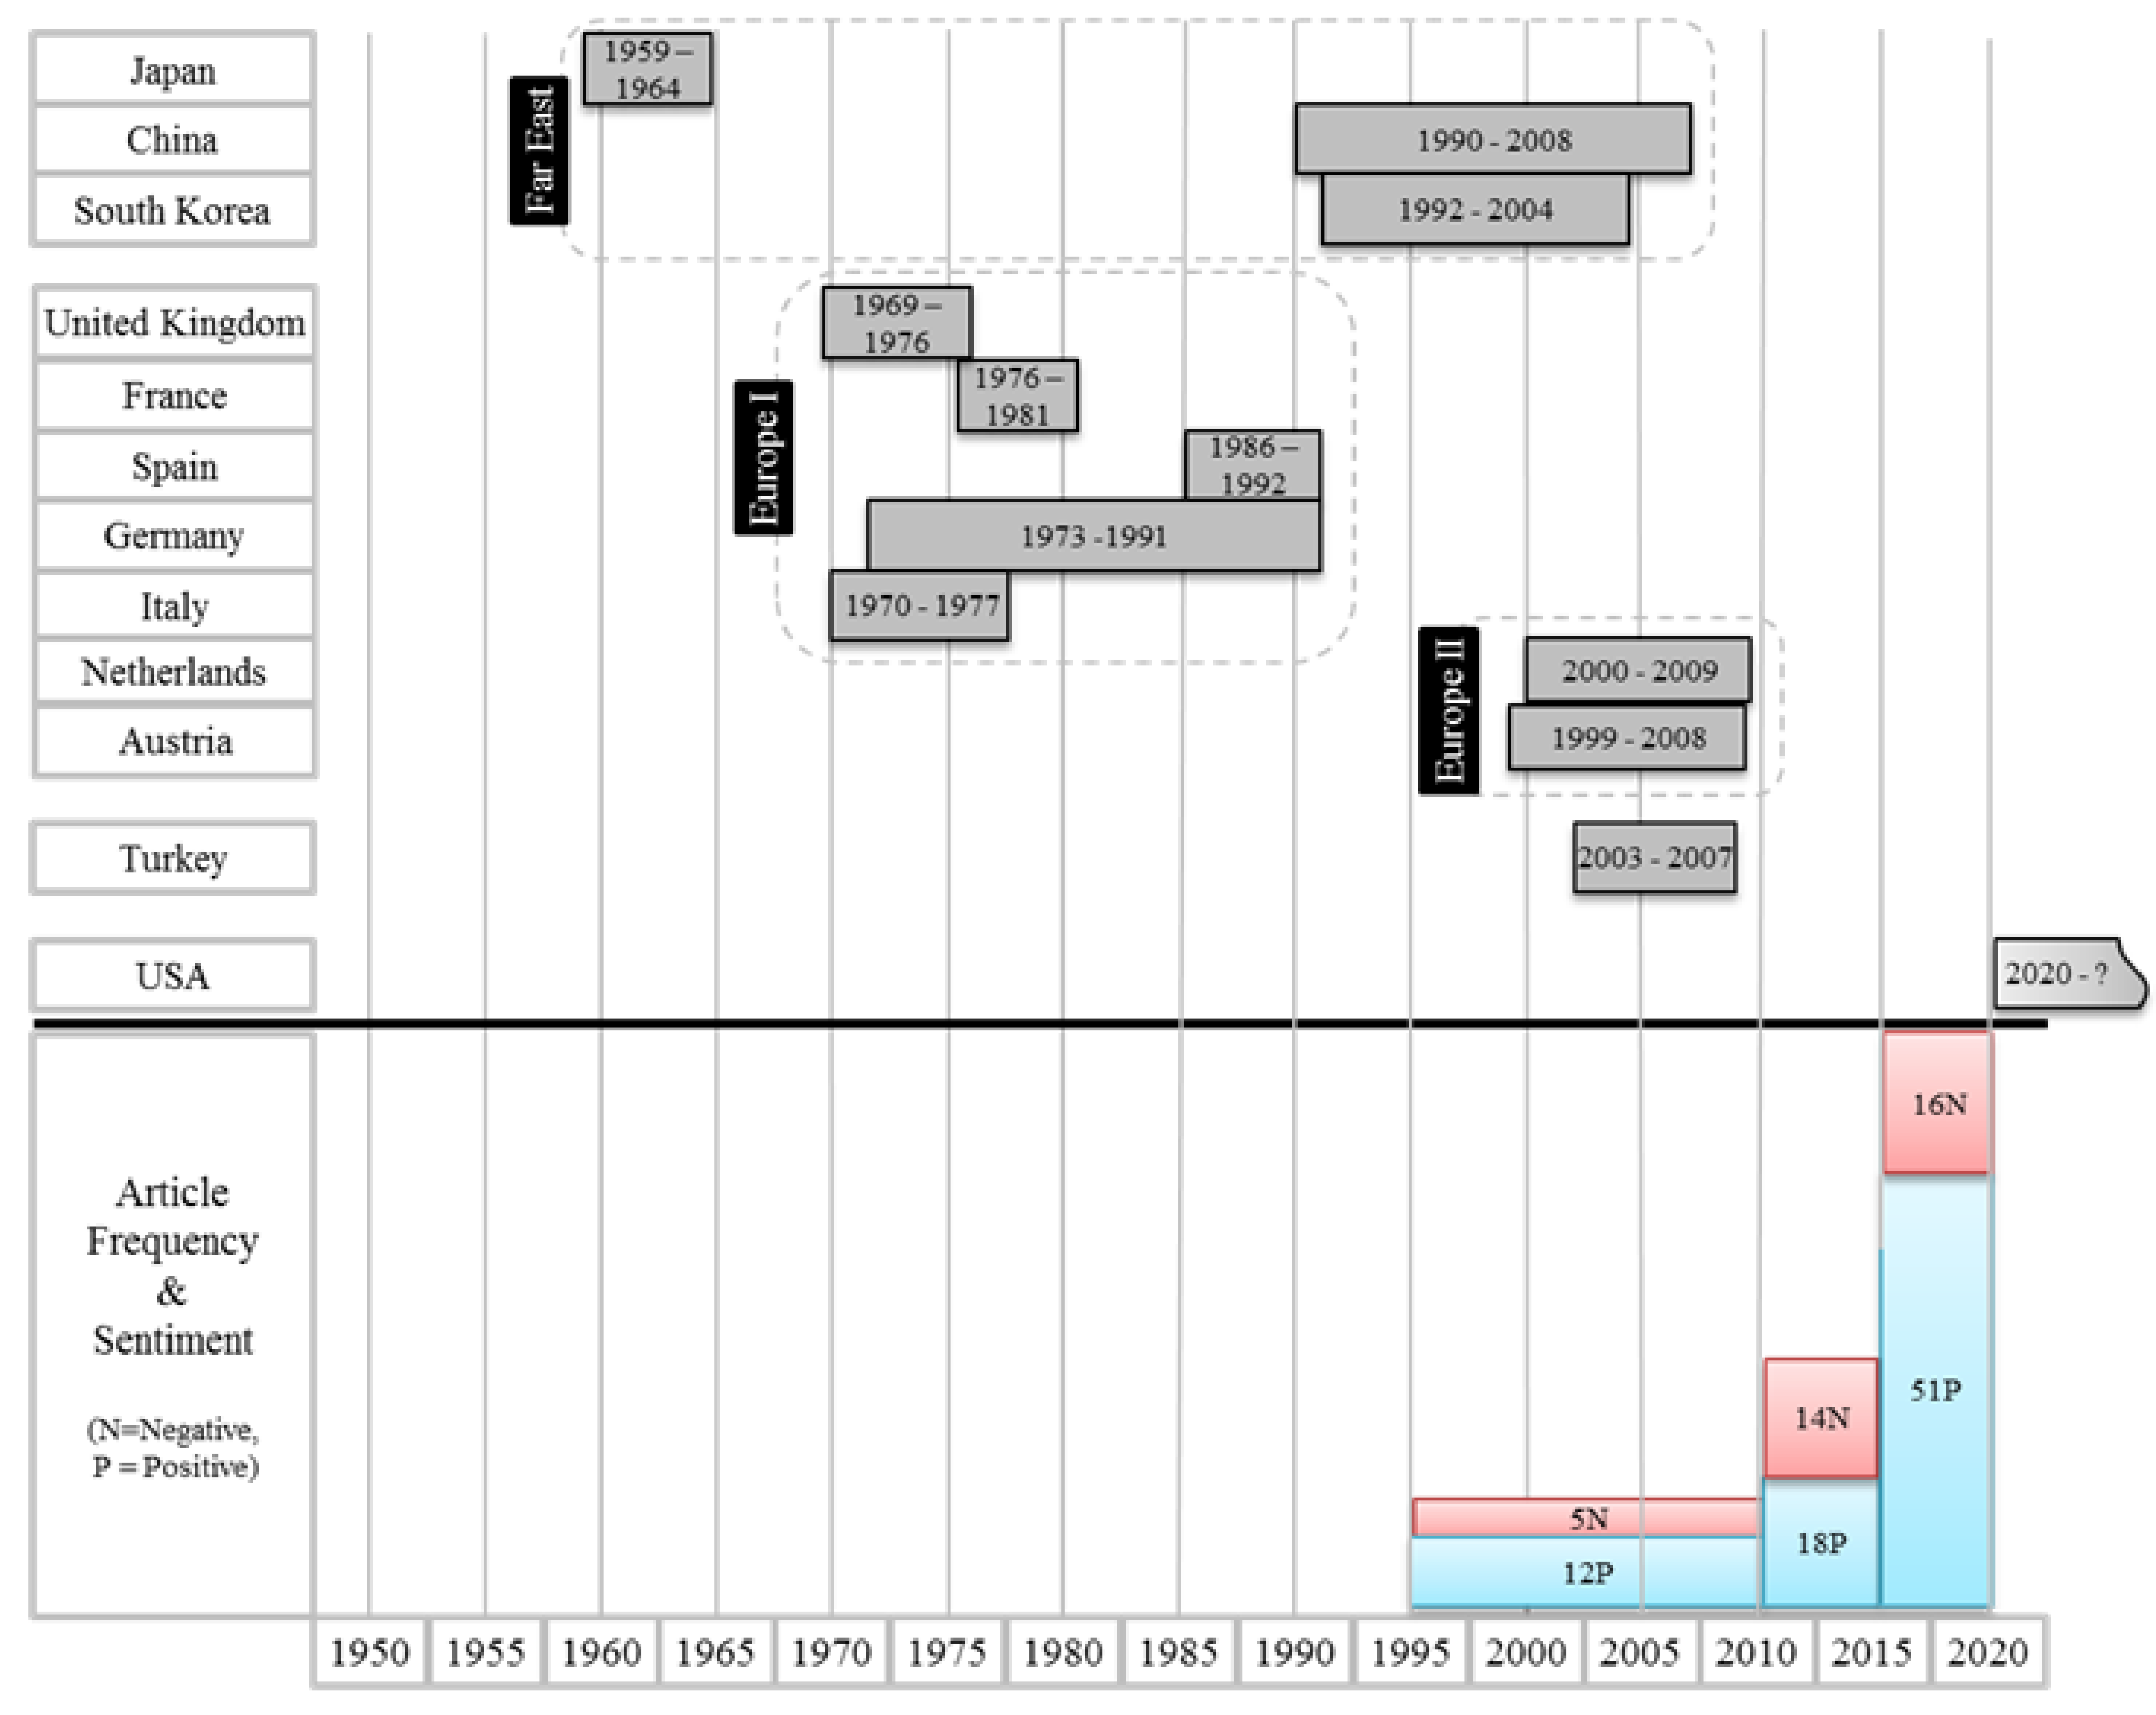
3.2. Location Distribution
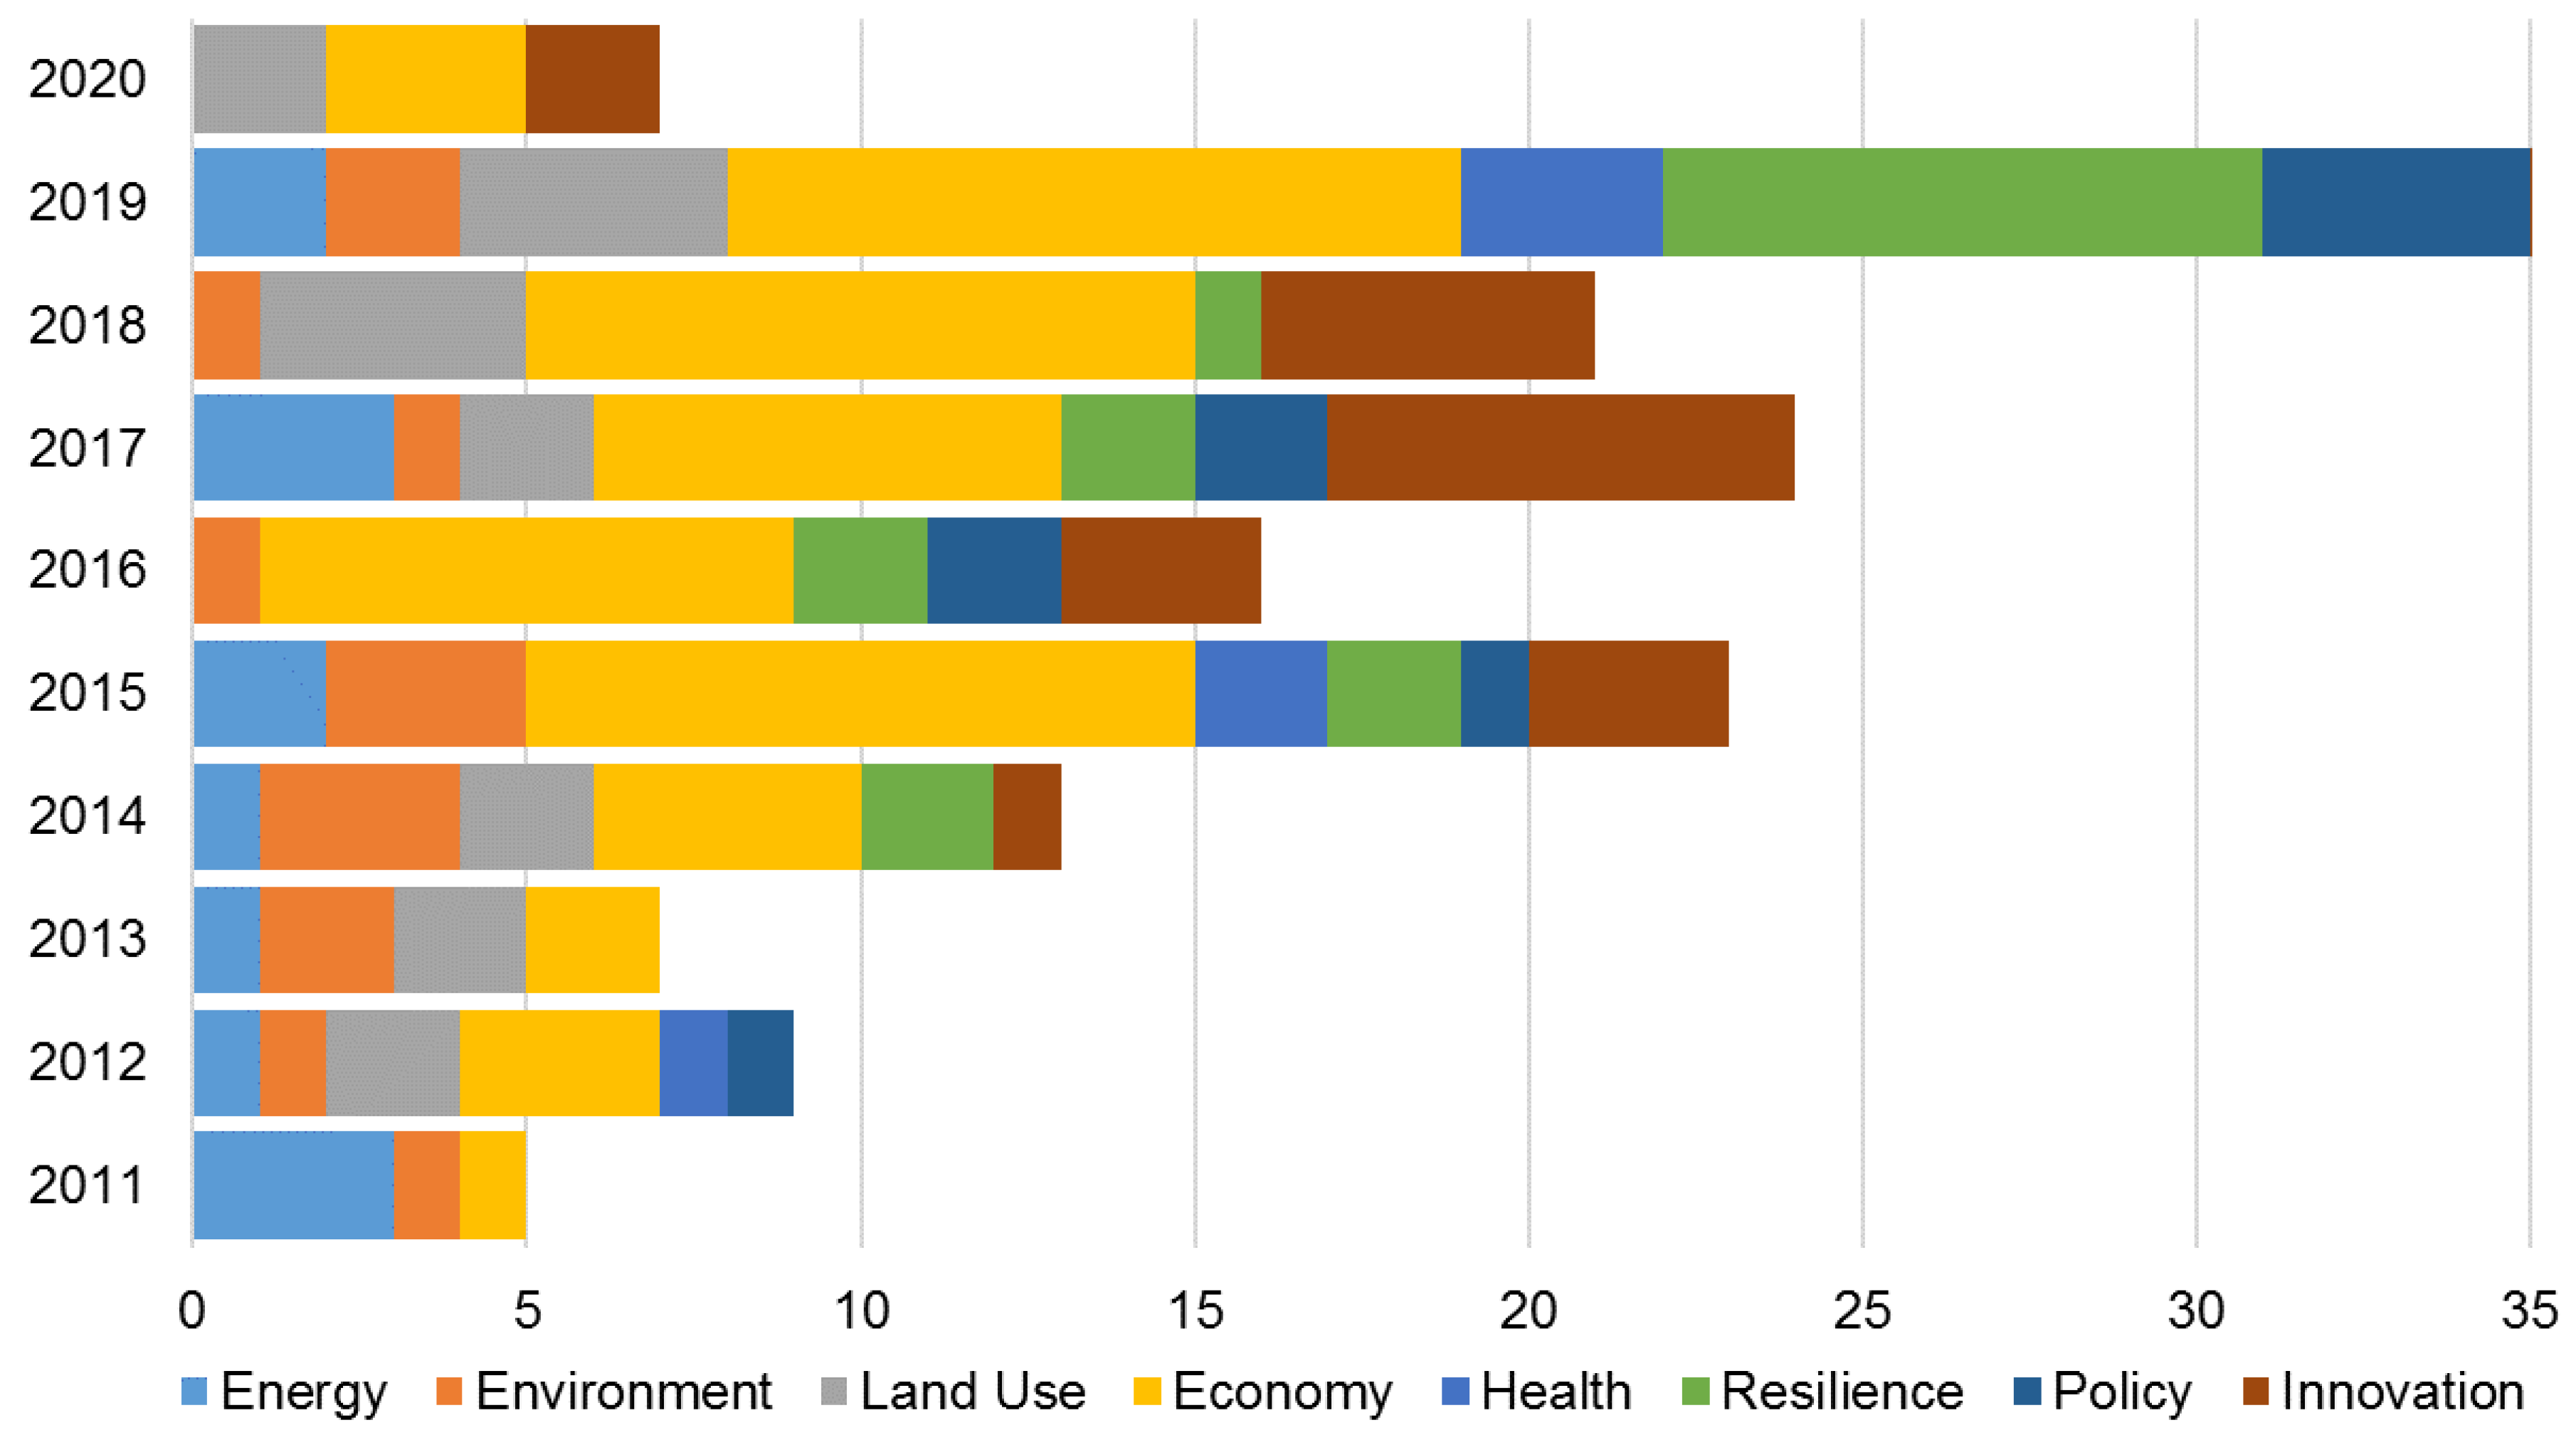
3.3. Impact Area Distribution
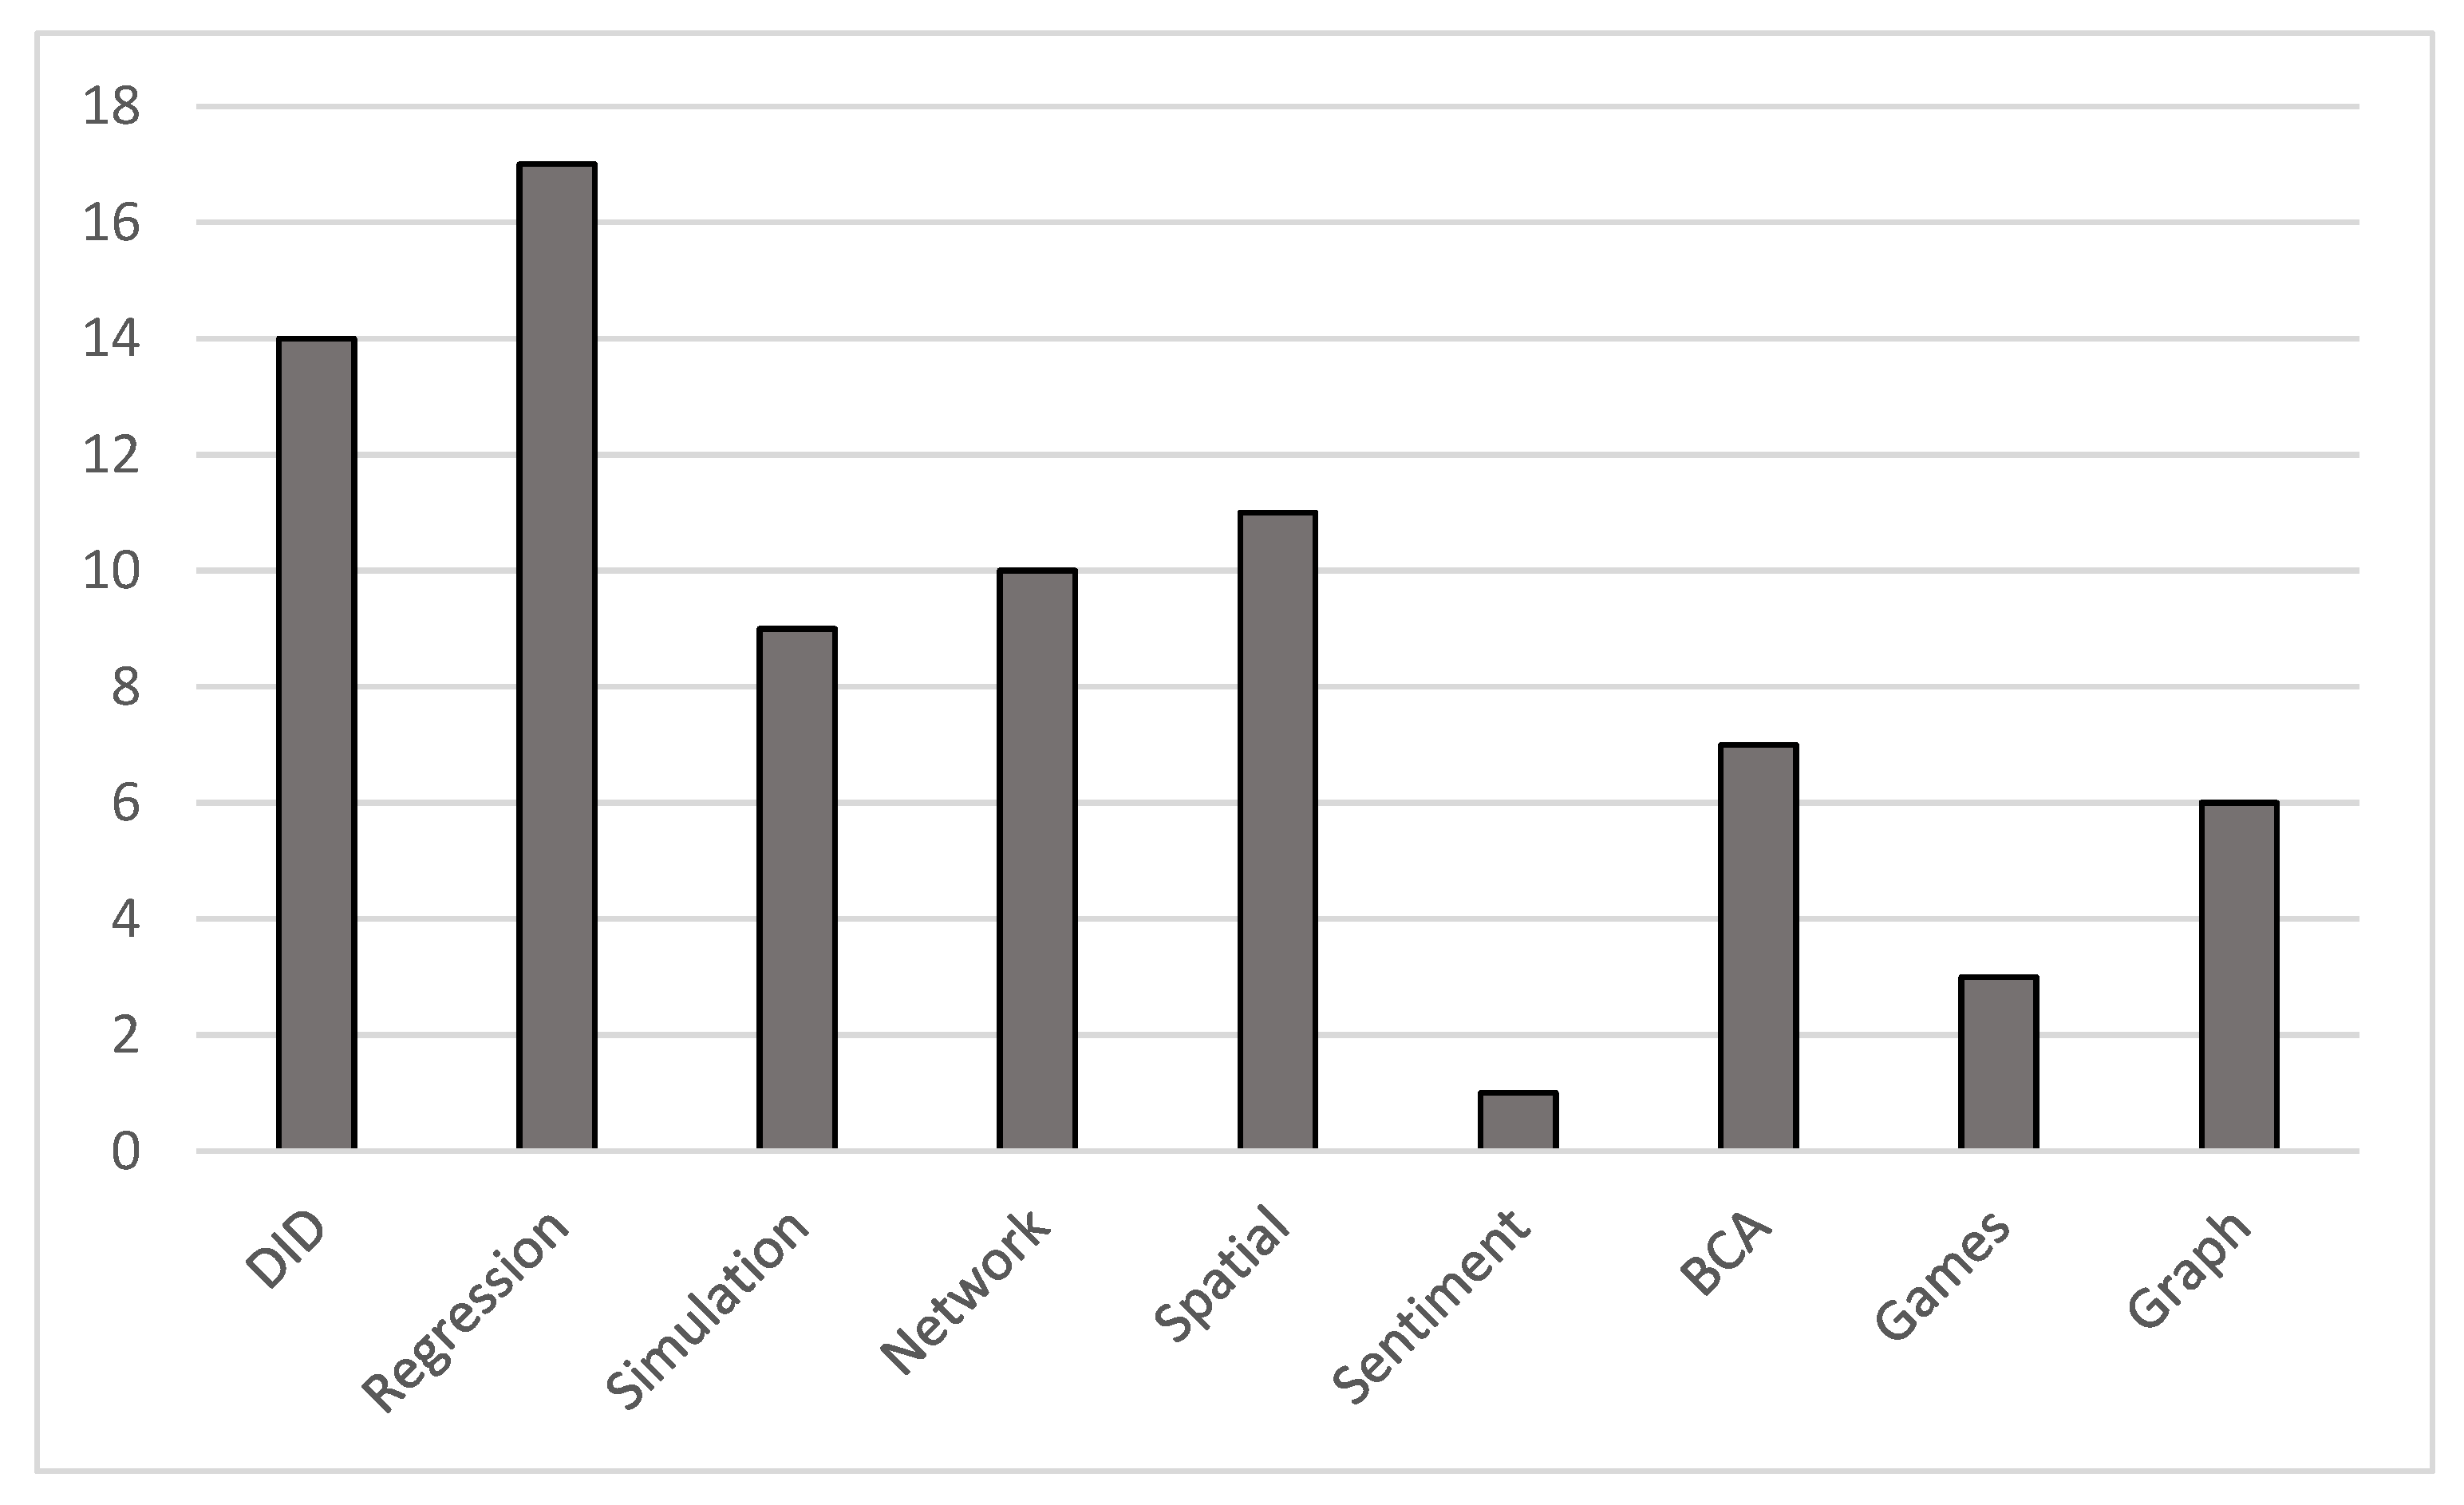
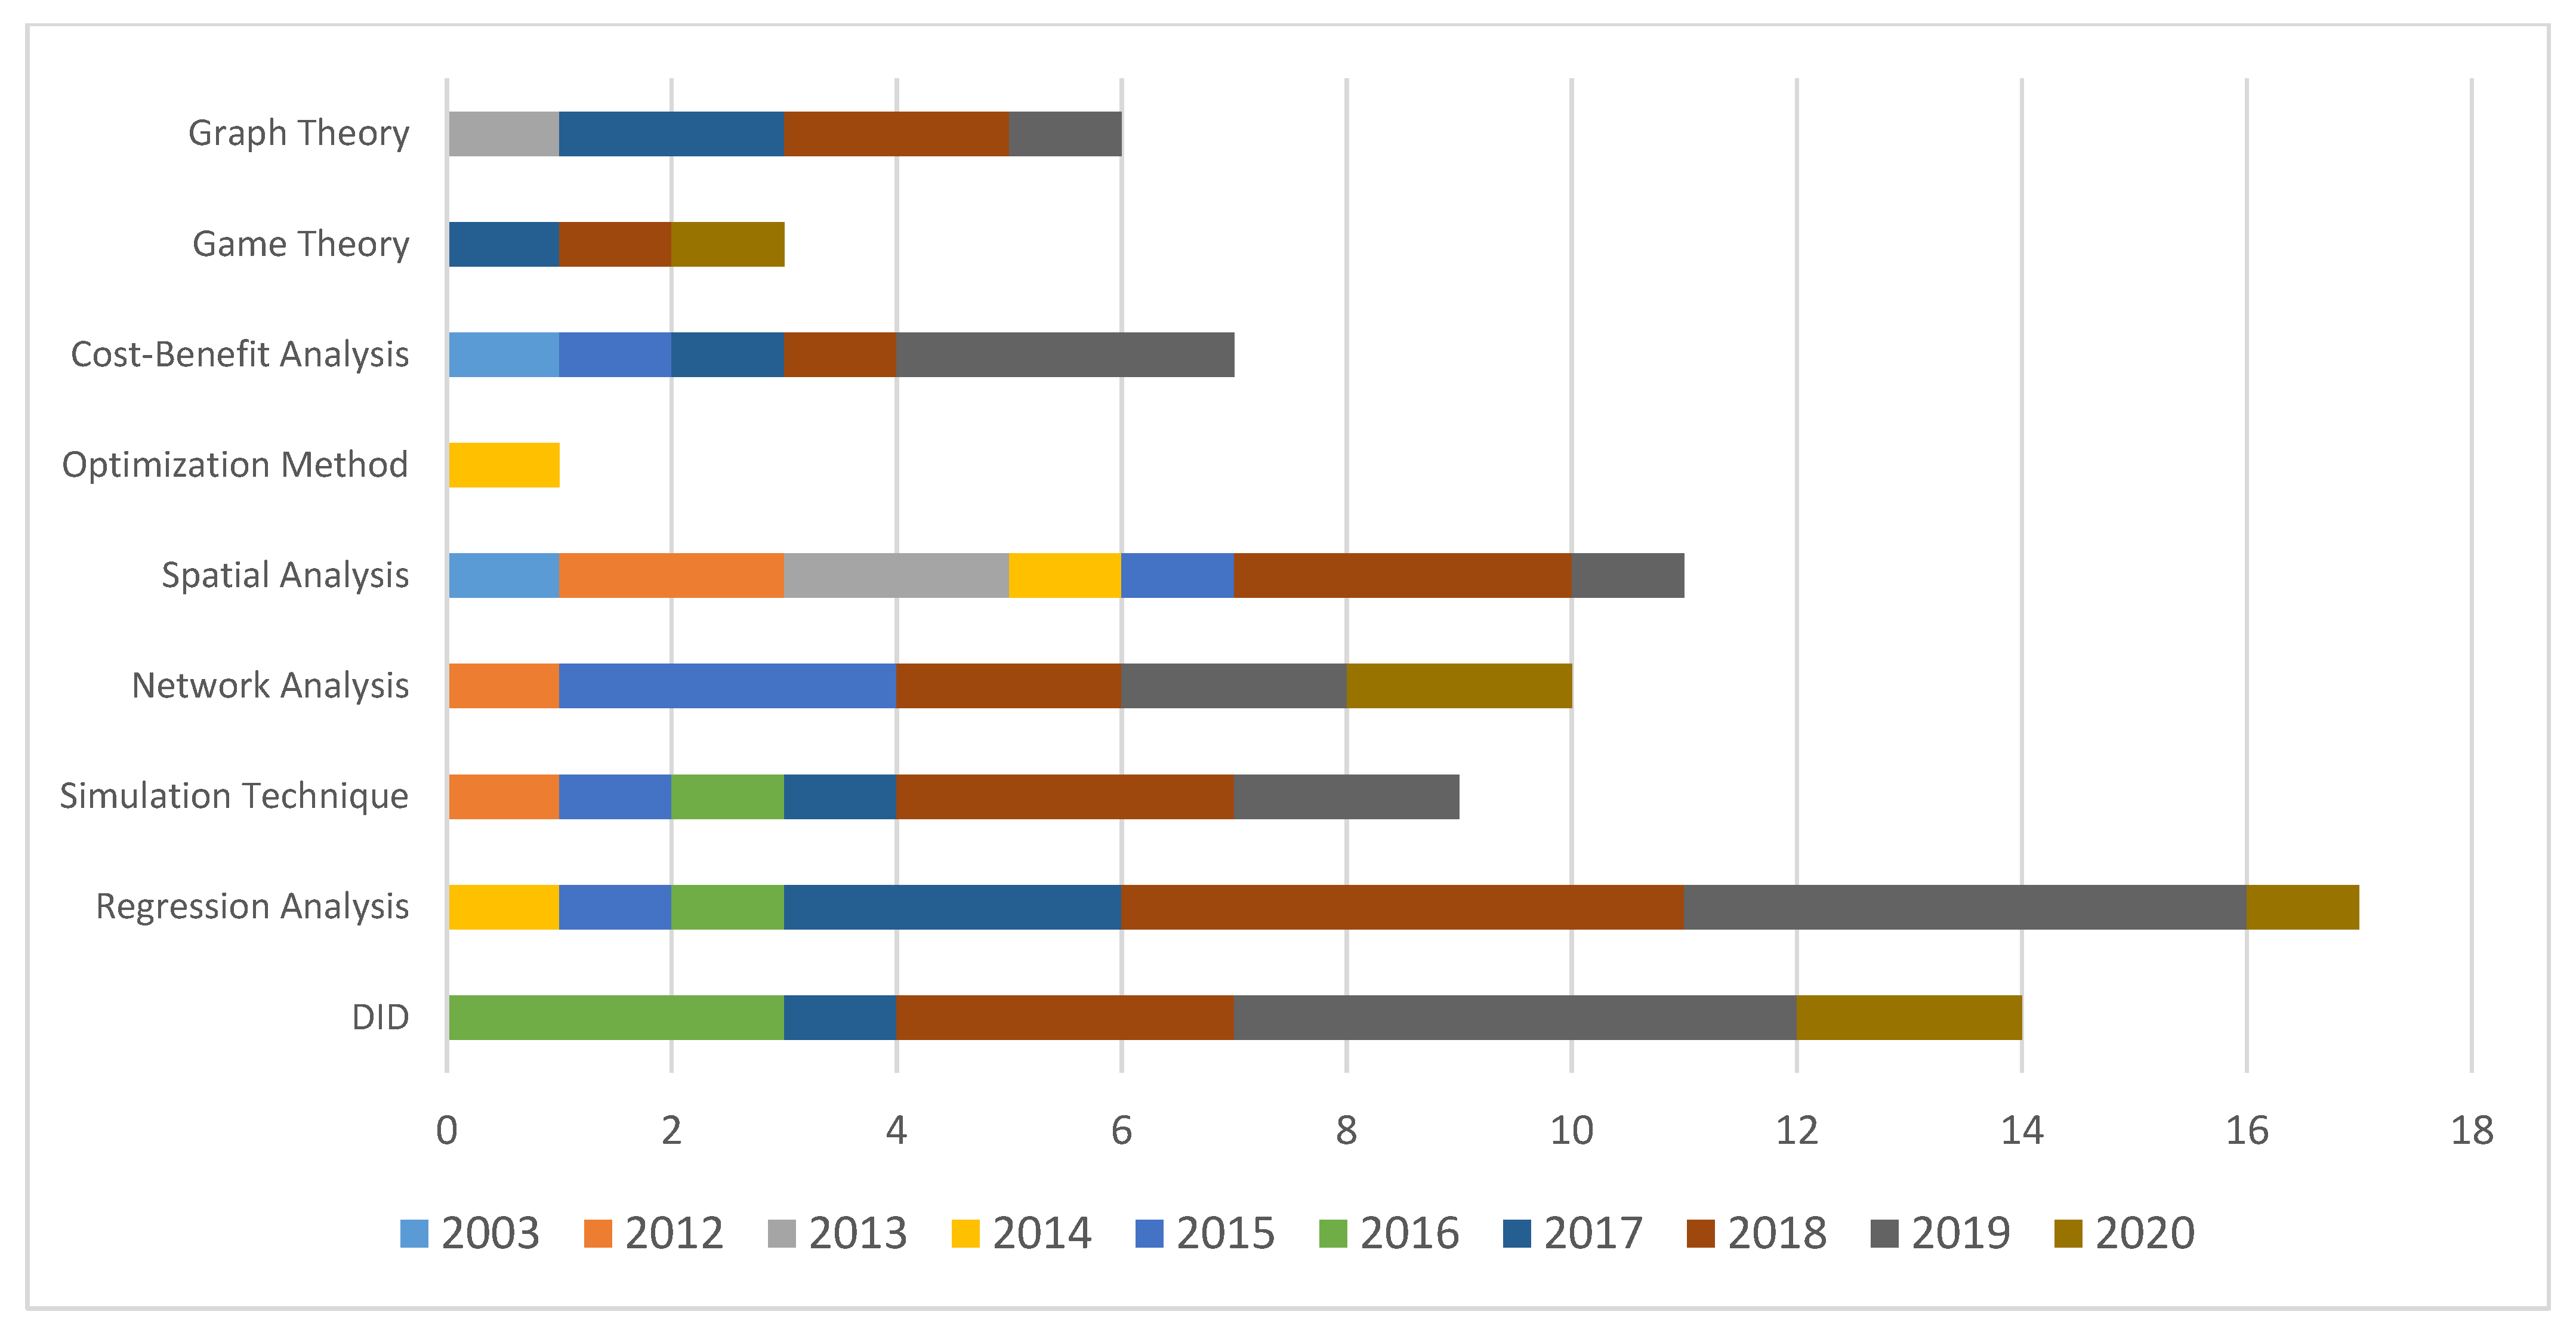
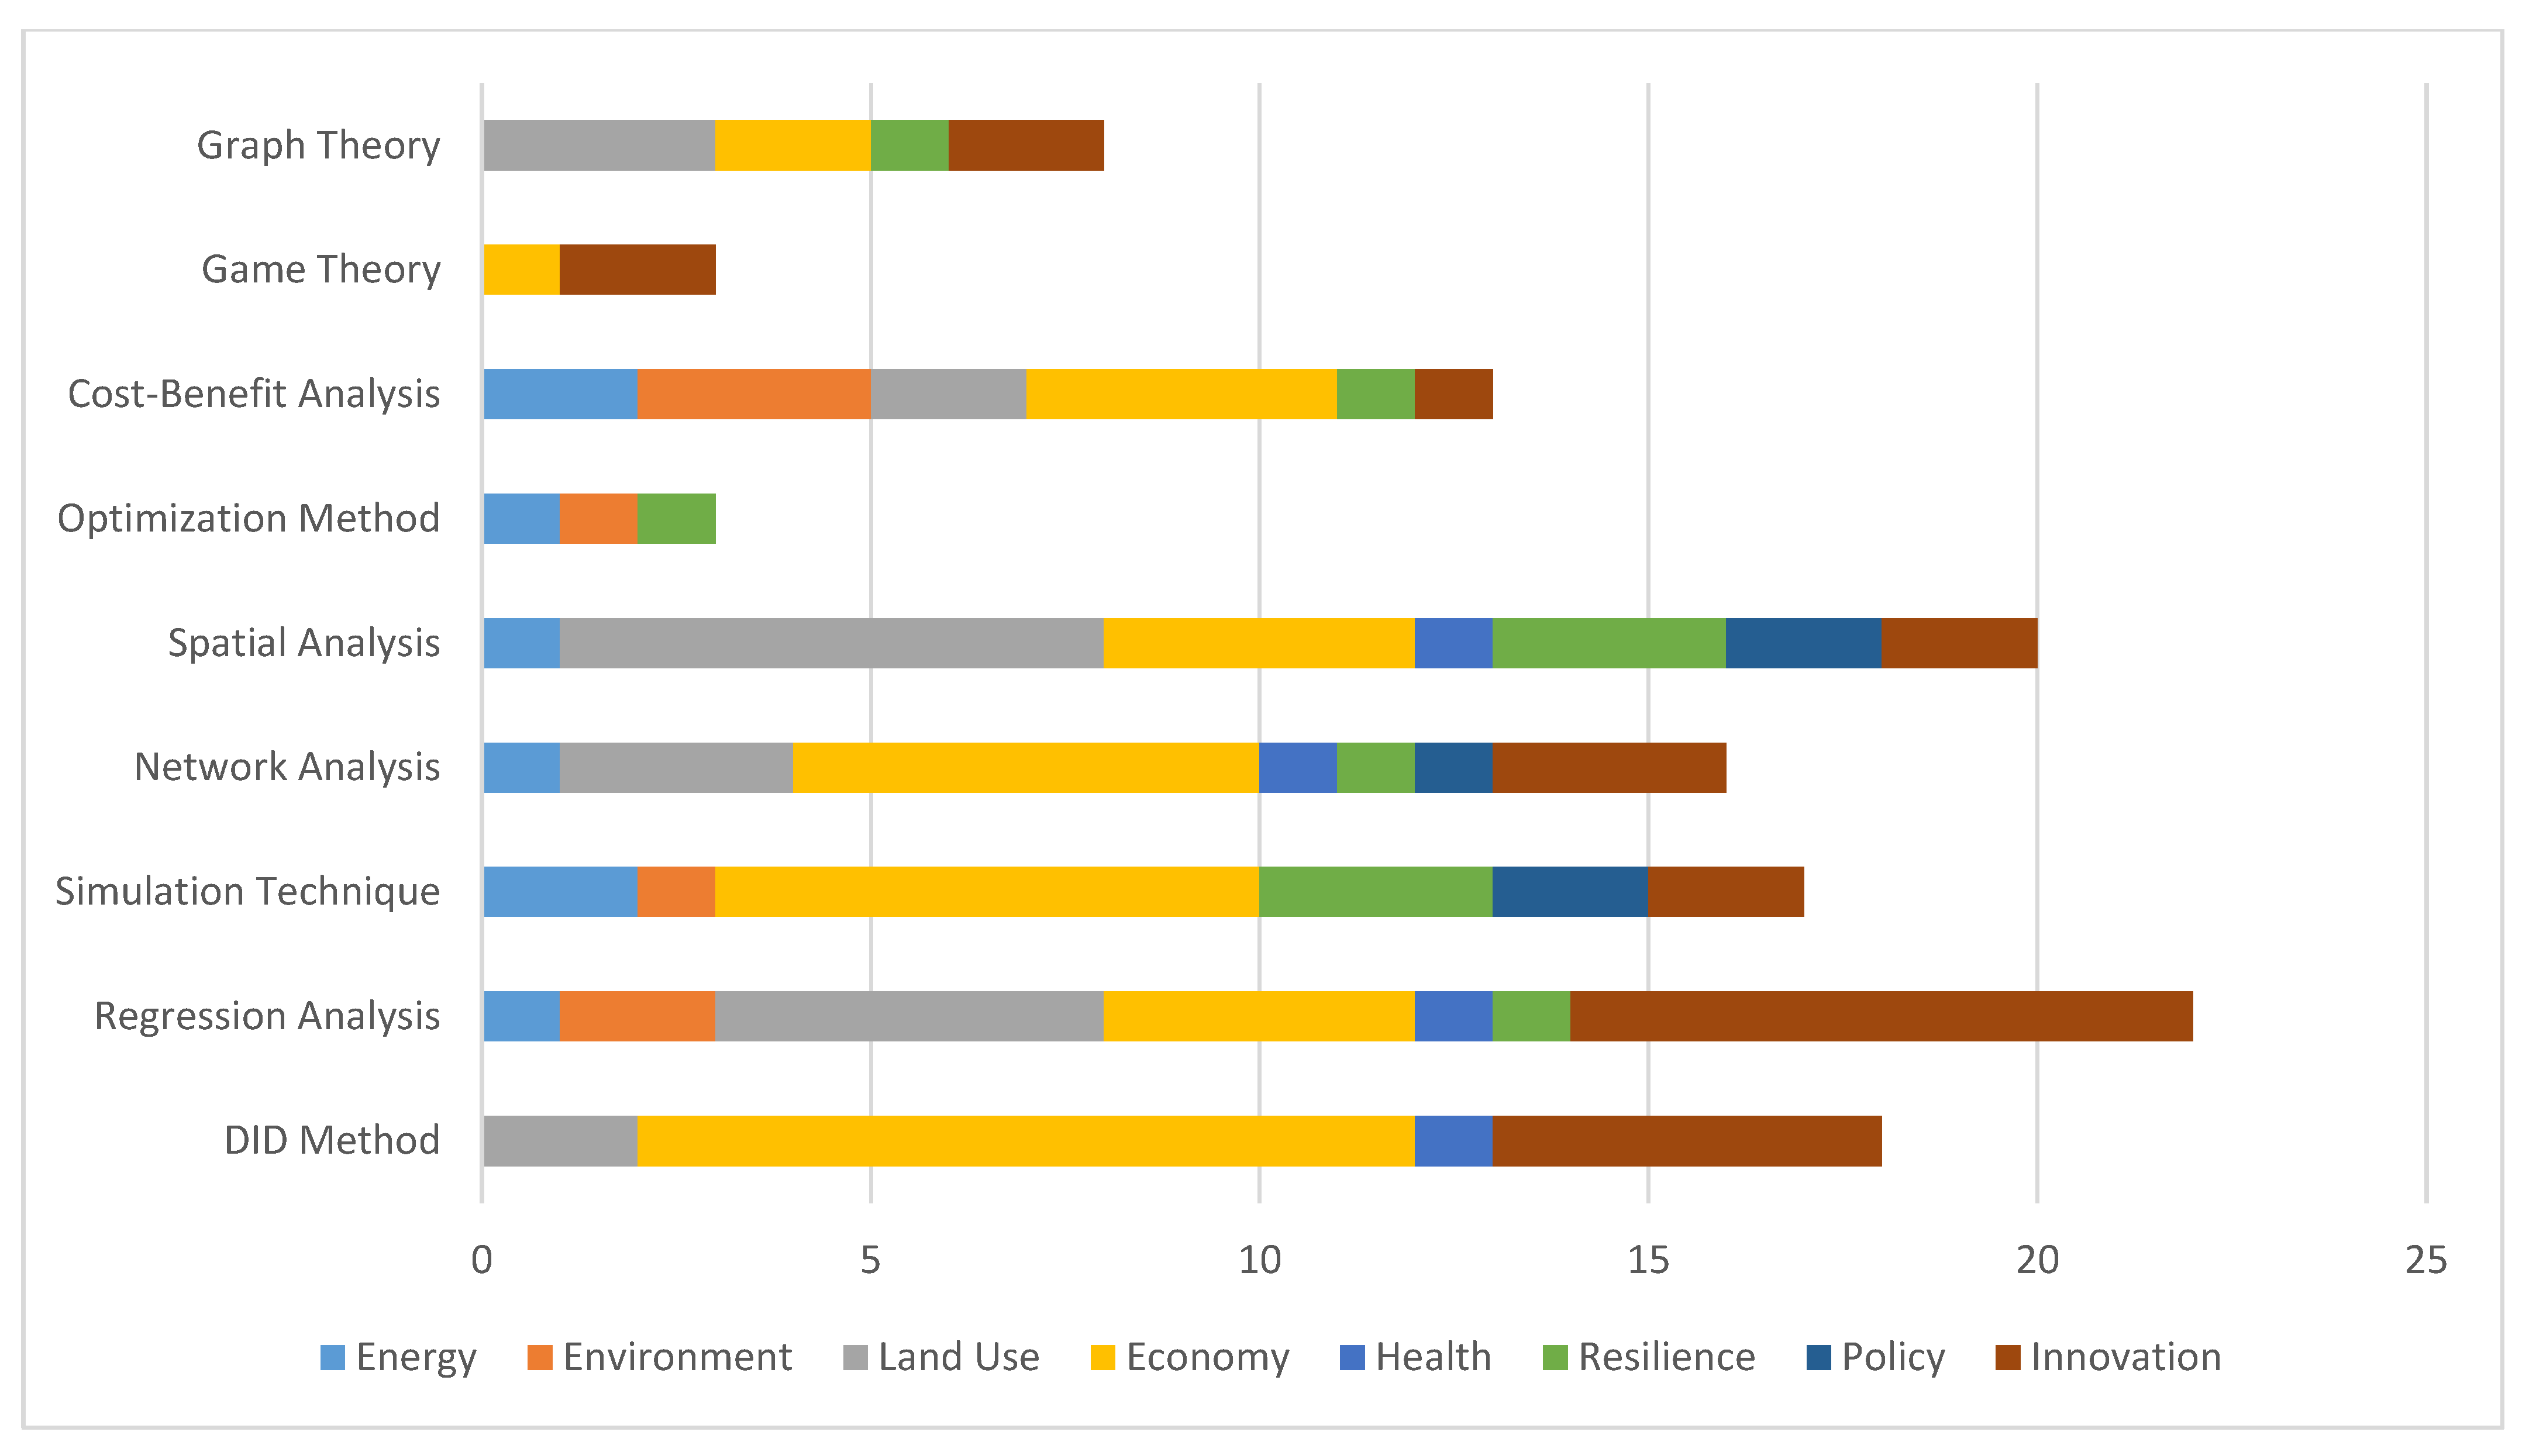
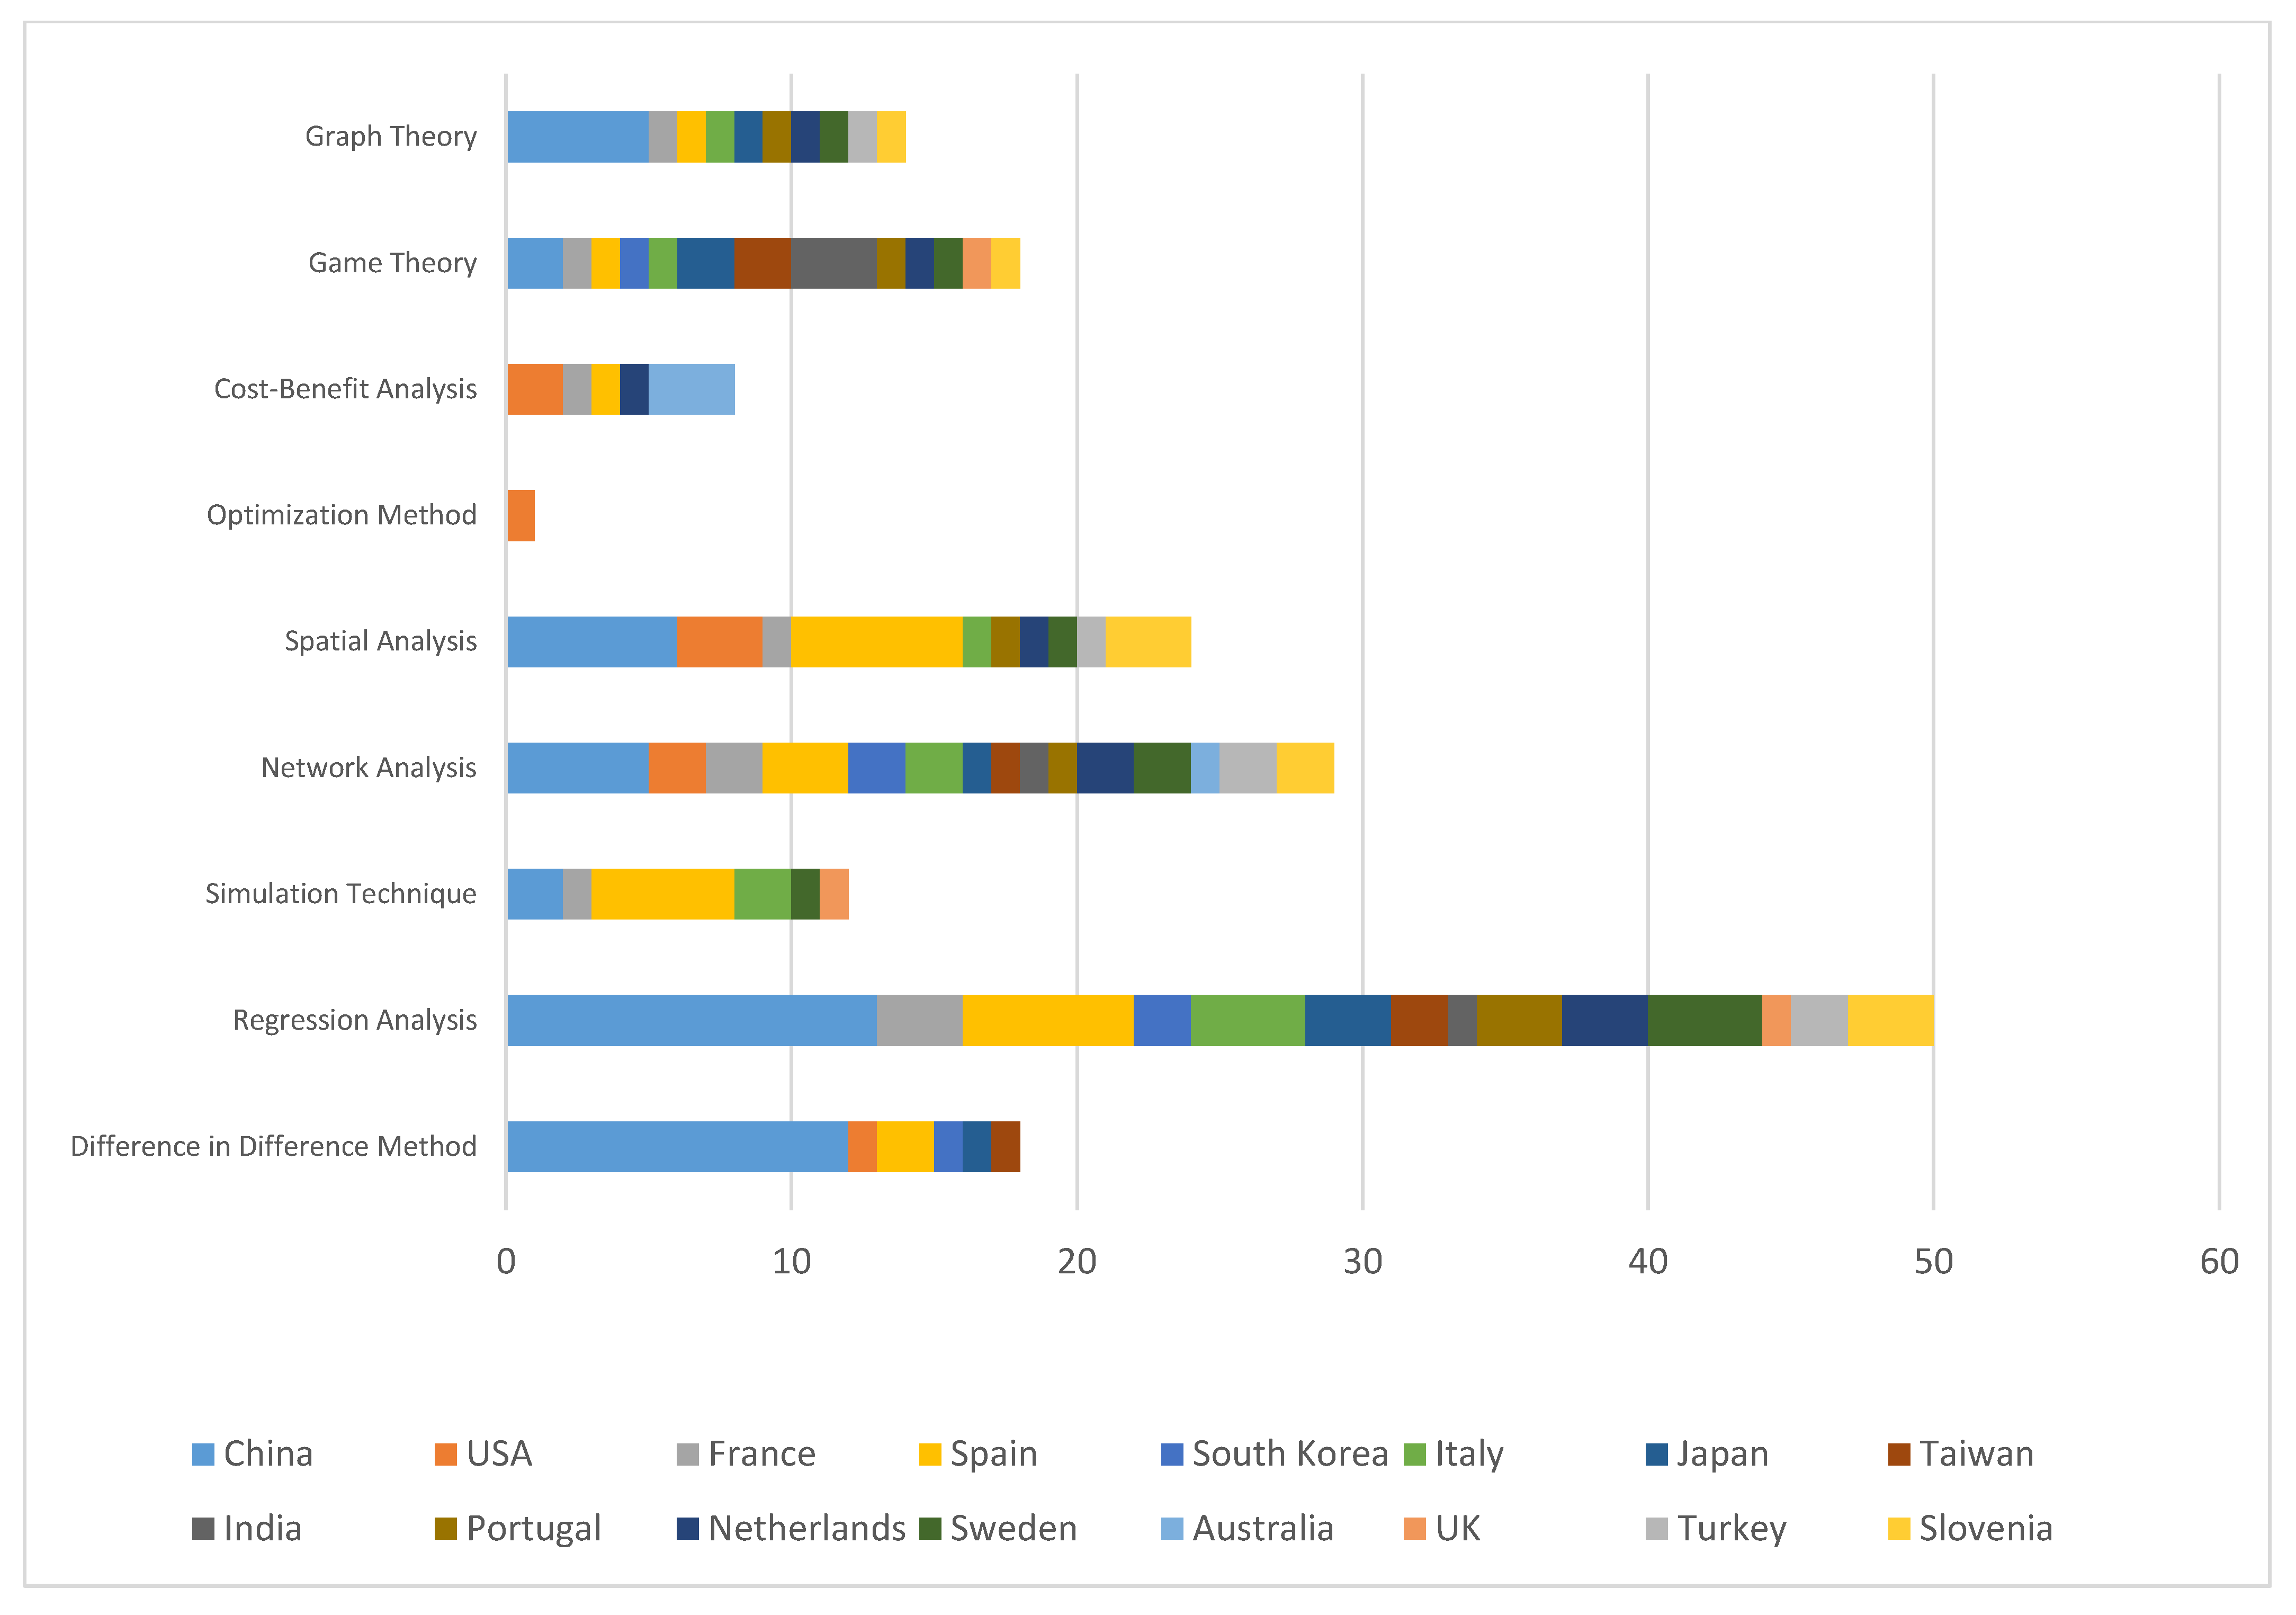
3.4. Analysis Technique Distribution
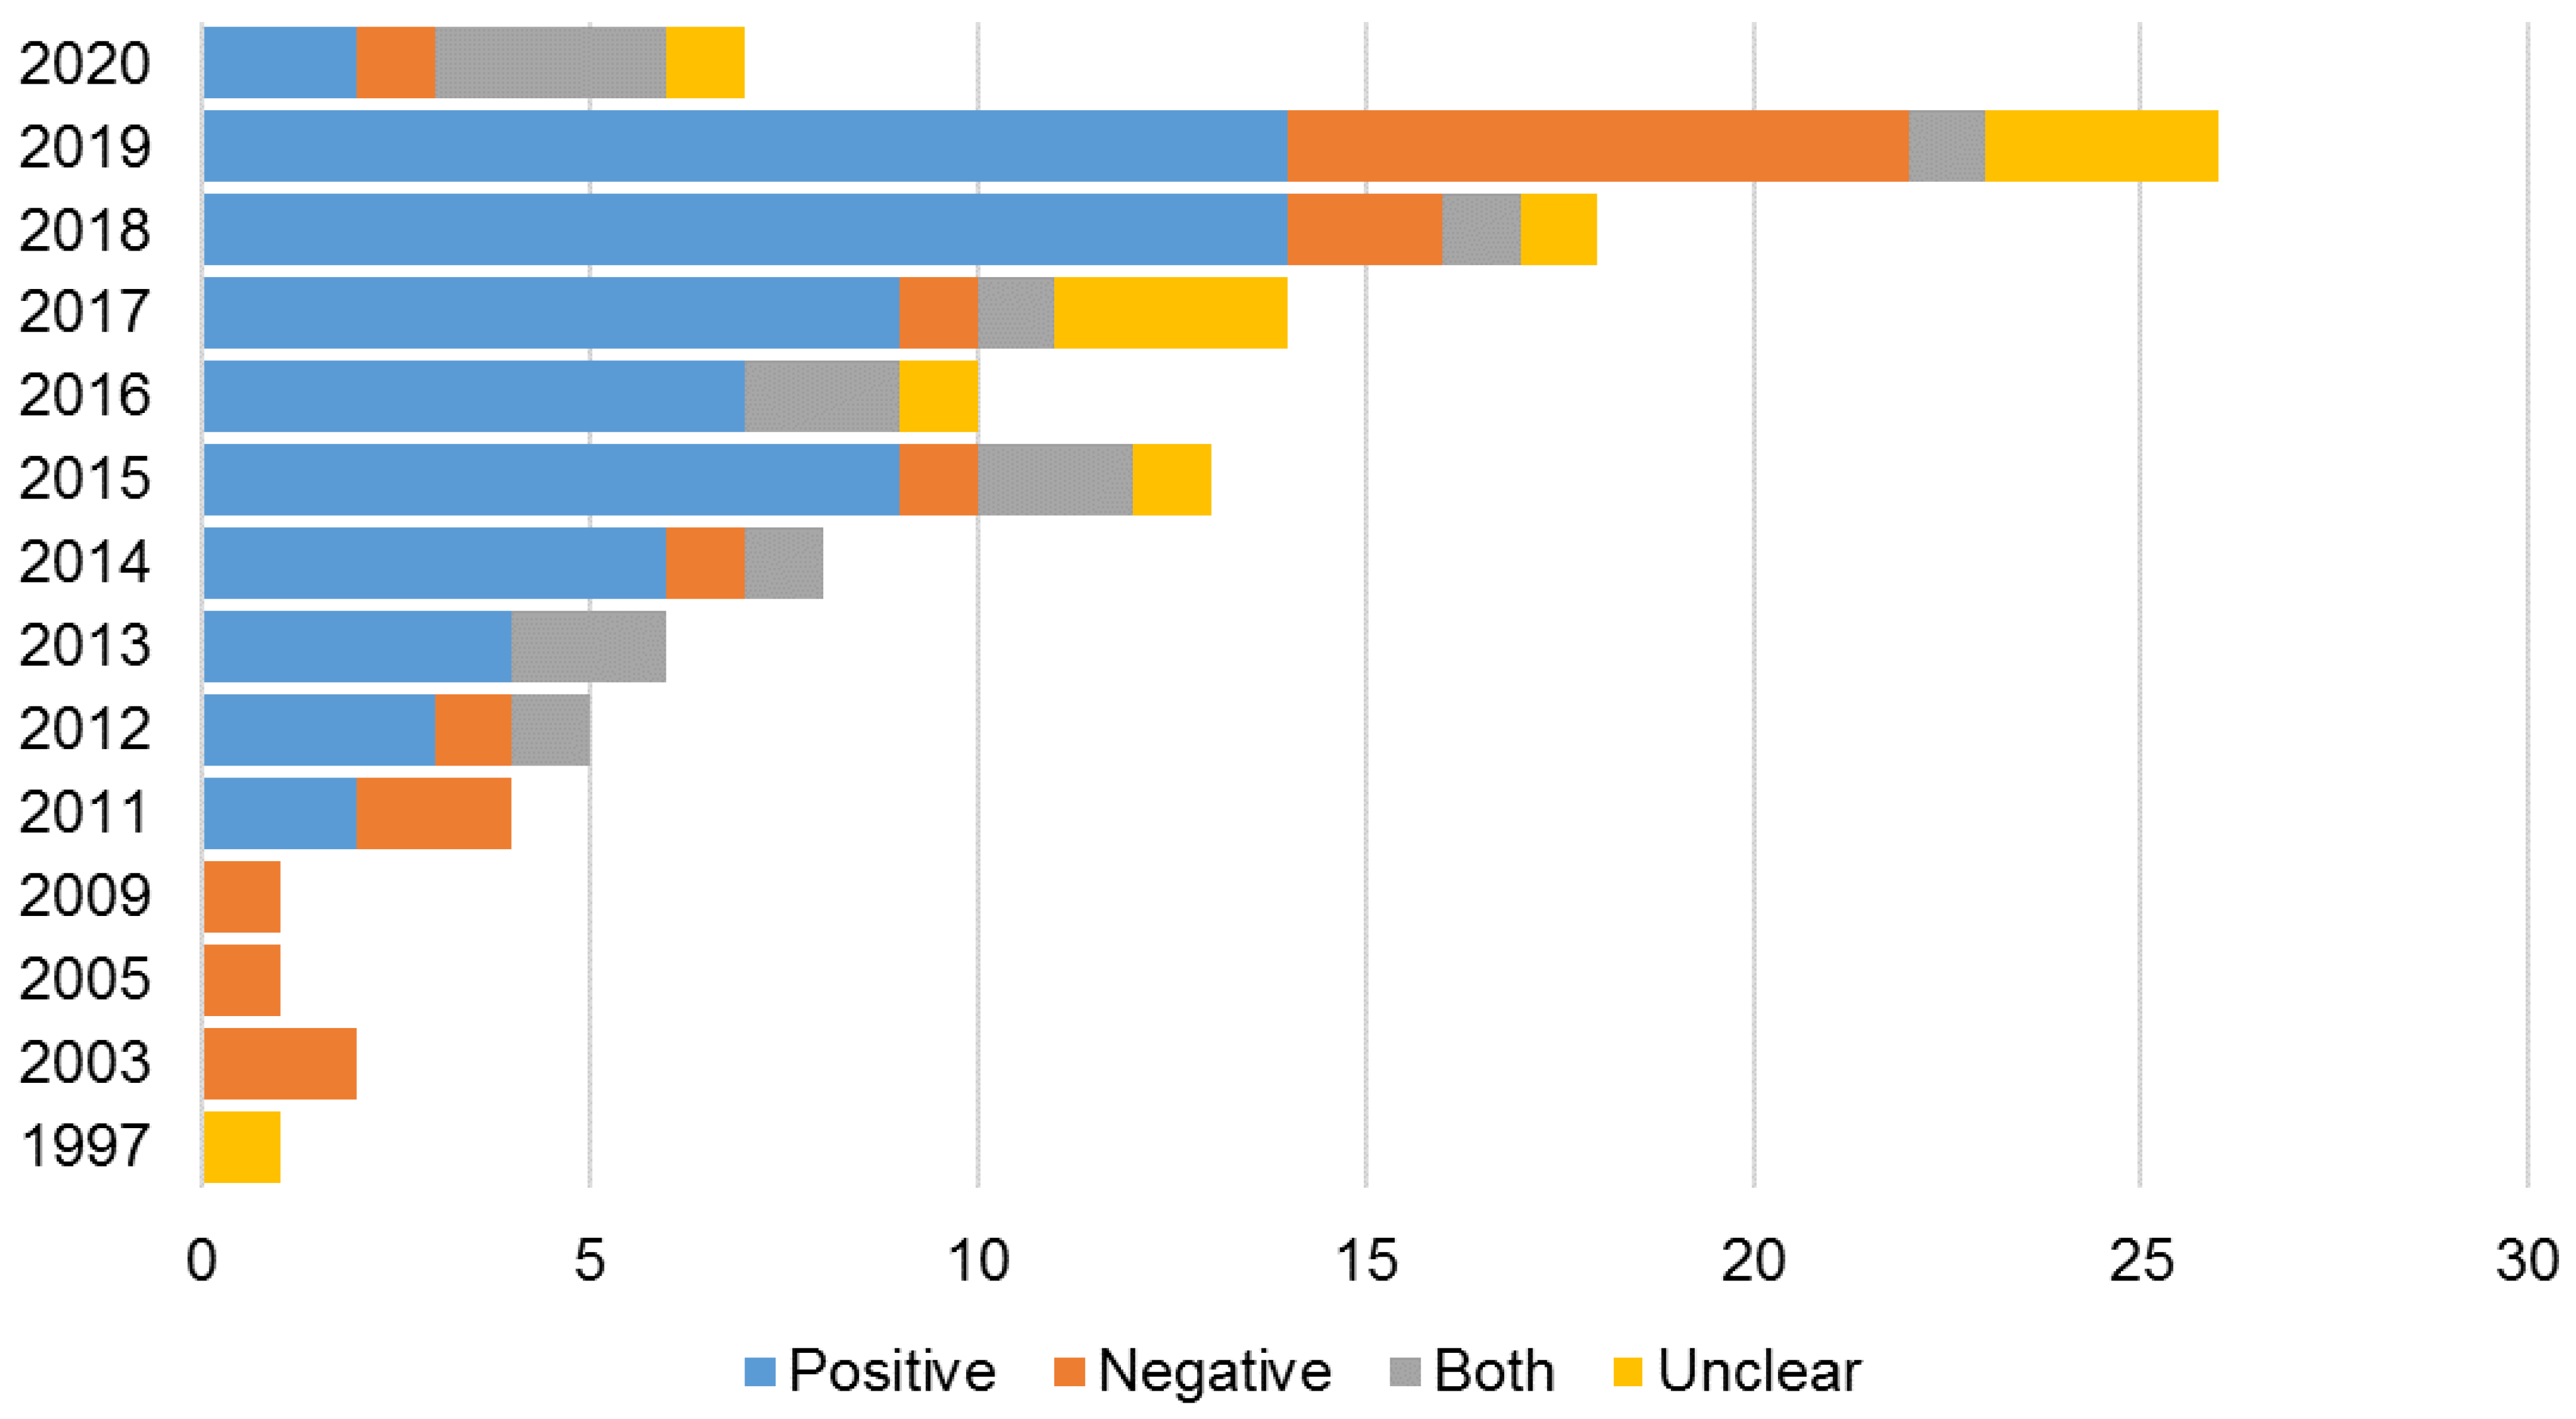
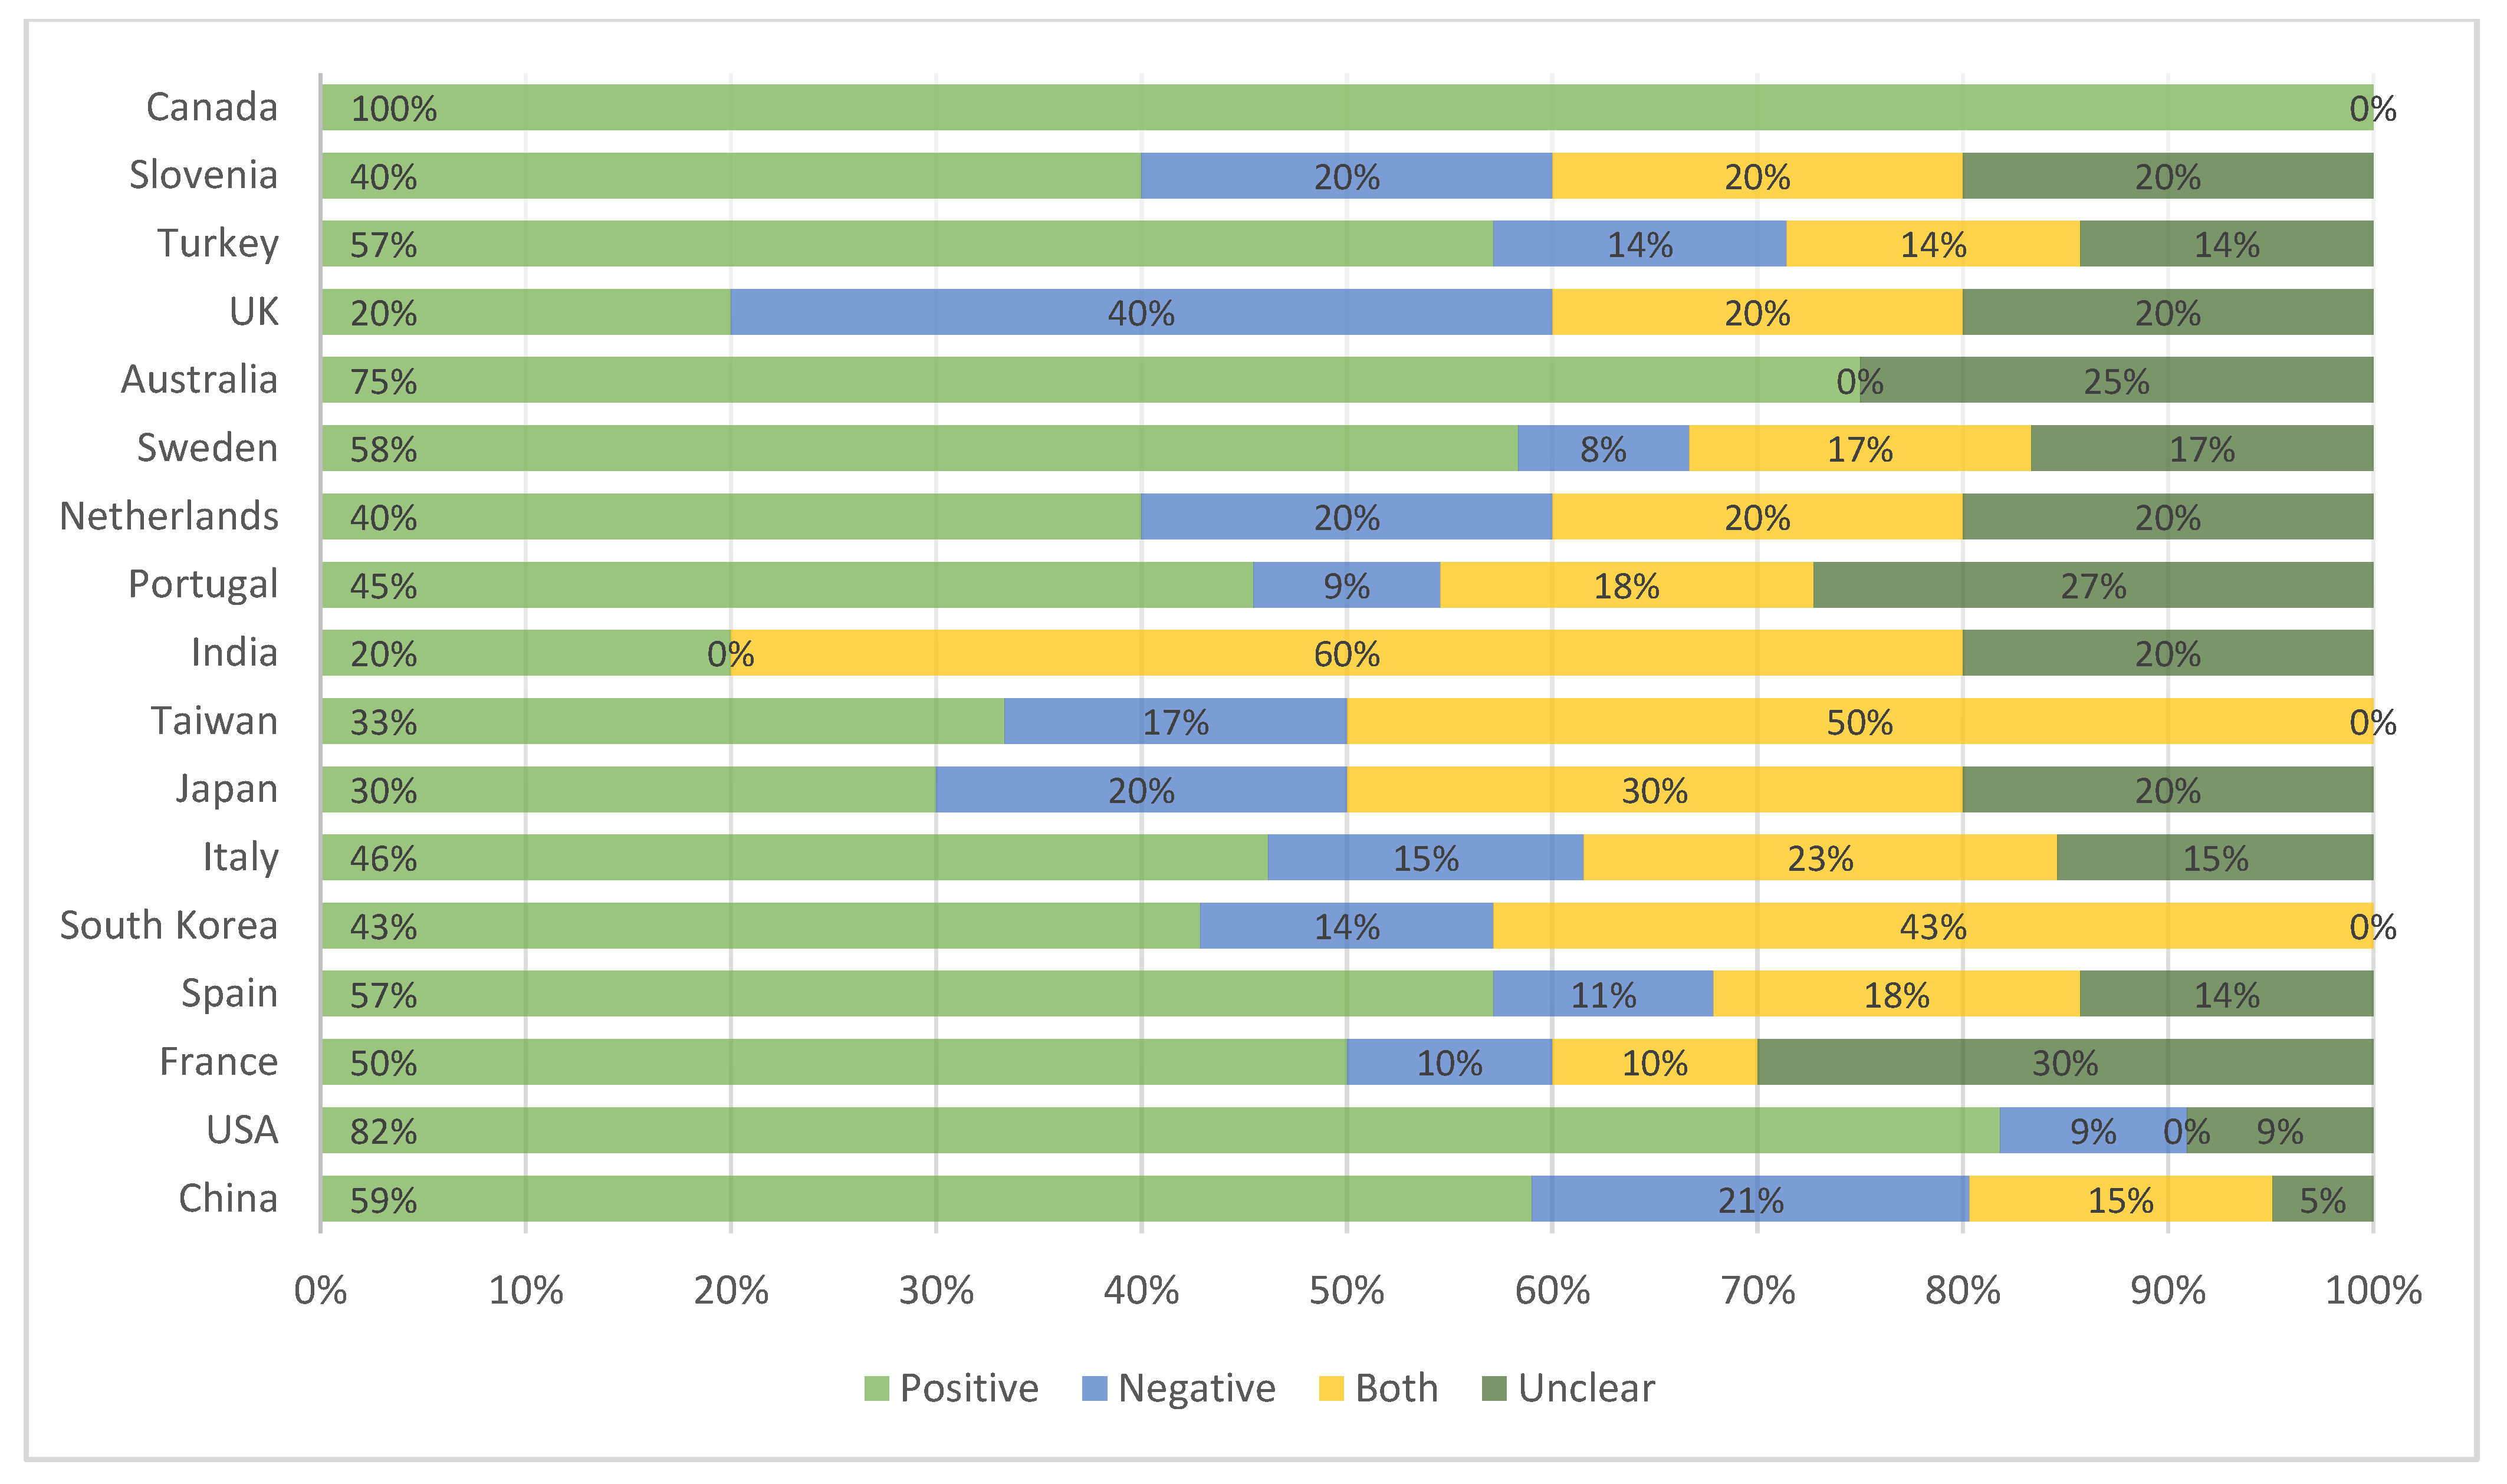
3.5. Article Sentiment Distribution
4. Discussion
4.1. Journal Distribution
4.2. Location Distribution
4.3. Impact Area Distribution
4.4. Analysis Technique Distribution
4.5. Article Sentiment Distribution
4.6. Gap Assessment
5. Conclusions
Author Contributions
Funding
Institutional Review Board Statement
Informed Consent Statement
Data Availability Statement
Conflicts of Interest
Appendix A

| Article | Assessment | Article | Assessment | Article | Assessment |
|---|---|---|---|---|---|
| Campos et al. [5] | Actual cost values of building and maintaining a high-speed rail infrastructure | Diao et al. [68] | Rail travel time | Albalate et al. [62] | Tourism outcomes |
| Kendall et al. [118] | HSR infrastructure | Liu et al. [66] | Degree centrality (to reflect connectivity) and the harmonic centrality (to reflect accessibility) | Weng et al. [86] | Accessibility |
| Kerman et al. [20] | Life cycle cost | Wang et al. [61] | Population mobility and urbanization | Wang et al. [119] | Volumes, flows, and spatial patterns of traffic |
| Guirao et al. [24] | Labor mobility | Pagliara et al. [65] | Tourism market | Chen et al. [67] | Regional economic impact |
| Ortega et al. [29] | The territorial distribution of accessibility | Jin et al. [90] | Regional accessibility | Wang et al. [54] | Travel time and accessibility |
| Sanchez-Mateos et al. [30] | Accessibility of a station | Kaczensky et al. [91] | Brown bears | Dai et al. [82] | Surrounding subdivided industries |
| Chinowsky et al. [87] | Climate change | Kamga et al. [51] | Emerging travel trends and the resurgence of rail transport- high-speed rail and its station hubs | Yue et al. [19] | Vehicle, infrastructure, operation |
| Krishnan et al. [14] | Interstate passenger transportation portfolio, fuel, and electricity consumption, and 40-year cost and carbon dioxide emission | Delaplace et al. [79] | Cost of HSR relative to air and rail alternatives | Clauzel et al. [101] | The potential long-distance effect of a high-speed railway line |
| Jones et al. [120] | Train manufacturing, train operation, train maintenance, train disposal, track construction, track operation, and maintenance, and track disposal | Alvarez-sanjaime et al. [49] | Vertical structure of the rail sector | Liorca et al. [121] | The economic, social, and environmental impacts of transportation |
| Millard-Ball et al. [122] | Energy use and greenhouse gas emissions | Vikerman et al. [80] | Transport infrastructure | Wang et al. [71] | Satellite lighting data as the proxy variable of local economic development level |
| Xu et al. [123] | HSR carriages | Moyano et al. [81] | Accessibility indicators | Zhang et al. [124] | Airline market |
| Chen et al. [84] | Co-authorship, co-citation, and keywords co-occurrence in the preceding part of the text | Yu et al. [55] | Accessibility scores of the future HSR corridor during peak and off-peak hours | Fengjun et al. [125] | Transport circle and accessibility of HSR in East Asia |
| Zheng et al. [53] | The spatial spillover effect of HSR stations | Yin et al. [126] | Tourism spatial interactions | Raturi et al. [99] | Speed and passengers’ characteristics |
| Garmendia et al. [47] | HSR territorial strategies and station location | Levinson et al. [85] | State of HSR planning | Liu et al. [32] | Tourism arrivals |
| Wang et al. [88] | Urban tourism and nationwide accessibility of cities in non-HSR and HSR networks | Zhao et al. [127] | Travel time saving | Sperry et al. [128] | Mode choice |
| Andres et al. [89] | Accessibility indicators | Zhang et al. [129] | Demand | Tsunoda et al. [76] | Profit and social welfare |
| Shaw et al. [130] | Travel time, travel distance, and ticket fee. | Momenitabar et al. [131] | Travel time saving | Zhang et al. [60] | Air travel demand |
| Shen et al. [25] | Land cover change | Jia et al. [36] | Transportation development and economic growth path | Chen et al. [77] | Heterogeneous impacts of HSR entry on air travel |
| Jiao et al. [100] | Passenger trains | Dehdari Ebrahimi et al. [132] | Geographical coverage and mode choice | Gao et al. [56] | Level of innovation |
| Chen et al. [74] | Regional economic disparity | ||||
| Xu et al. [97] | Regional structure index and urban land development potential index | Cascetta et al. [133] | Demand | Li et al. [45] | Data of running timetable and position coordinates |
| Kim et al. [83] | Station’s role | Wang et al. [70] | Journey times | Doomernick et al. [12] | Network and the rolling stock assets |
| Wang et al. [64] | Regional accessibility | Li et al. [35] | Redistribution of economic activities | Hiramatsu et al. [33] | Context of regional economies and transportation |
References
- Railway-Technology. TGV France High Speed Railways Operated by SNCF—Railway Technology. Available online: https://www.railway-technology.com/projects/frenchtgv/ (accessed on 12 June 2020).
- Lane, B.W. On the utility and challenges of high-speed rail in the United States. J. Transp. Geogr. 2012, 22, 282–284. [Google Scholar] [CrossRef]
- Zhenga, S.; Kahn, M.E. China’s bullet trains facilitate market integration and mitigate the cost of megacity growth. Econ. Sci. 2013, 110, 1248–1253. [Google Scholar]
- Yale. High-Speed Trains Provide Environmental, Social Benefits, Study Says—Yale E360; Yale School of Forestry & Environmental Studies: New Haven, CT, USA, 2013; Available online: https://e360.yale.edu/digest/high-speed_trains_provide_environmental_social_benefits_study_says (accessed on 12 May 2020).
- Campos, J.; Rus, G.D. Some stylized facts about high-speed rail: A review of HSR experiences around the world. Transp. Policy 2009, 16, 19–28. [Google Scholar] [CrossRef] [Green Version]
- Benefits of High-Speed Rail for the United States—American Public Transportation Association. APTA. Available online: https://www.apta.com/research-technical-resources/high-speed-passenger-rail/benefits-of-high-speed-rail-for-the-united-states/ (accessed on 12 May 2020).
- Denyer, D.; Tranfield, D. Using qualitative research synthesis to build an actionable knowledge base. Manag. Decis. 2006, 44, 213–227. [Google Scholar] [CrossRef]
- Tranfield, D.; Denyer, D.; Smart, P. Towards a Methodology for Developing Evidence-Informed Management Knowledge by Means of Systematic Review. Br. J. Manag. 2003, 14, 207–222. [Google Scholar] [CrossRef]
- Harden, A.; Thomas, J. Methodological Issues in Combining Diverse Study Types in Systematic Reviews. Int. J. Soc. Res. Methodol. 2005, 3, 8. [Google Scholar] [CrossRef]
- Boyack, K.W.; Klavans, R.; Börner, K. Mapping the backbone of science. Scientometrics 2005, 64, 351–374. [Google Scholar] [CrossRef]
- Leeuwen, T.V. The application of bibliometric analyses in the evaluation of social science research. Who benefits from it, and why it is still feasible. Scientometrics 2006, 66, 133–154. [Google Scholar] [CrossRef]
- Doomernik, J.E. Performance and Efficiency of High-speed Rail Systems. Transp. Res. Procedia 2015, 8, 136–144. [Google Scholar] [CrossRef] [Green Version]
- Chiara, B.D.; Franco, D.D.; Coviello, N.; Pastrone, D. Comparative specific energy consumption between air transport and high-speed rail transport: A practical assessment. Transp. Res. Part D Transp. Environ. 2017, 52, 227–243. [Google Scholar]
- Krishnan, V.; Kastrouni, E.; Pyrialakou, V.D.; Gkritza, K.; McCalley, J.D. An optimization model of energy and transportation systems: Assessing the high-speed rail impacts in the United States. Transp. Res. Part C 2015, 54, 131–156. [Google Scholar] [CrossRef]
- Rozycki, C.V.; Koeser, H.; Schwarz, H. Ecology profile of the german high-speed rail passenger transport system, ICE. Int. J. Life Cycle Assess. 2003, 8, 83–91. [Google Scholar] [CrossRef]
- Zhang, S.; Zhang, W.; Li, Y.; Gao, L.; Gao, L.; Shaohui, Y. The Production of Carbon Nano-Onions and Wheat Stalk Nano-Chains over Stainless Steel Supported La0.95Mg0.05Ni0.8Co0.2O3 Catalyst. Synth. React. Inorg. Metal-Org. Nano-Metal Chem. 2013, 44, 222–226. [Google Scholar] [CrossRef]
- Miyoshi, C.; Givoni, M. The Environmental Case for the High-Speed Train in the UK: Examining the London-Manchester Route. Int. J. Sustain. Transp. 2014, 8, 107–126. [Google Scholar] [CrossRef]
- Chester, M.; Horvath, A. High-speed rail with emerging automobiles and aircraft can reduce environmental impacts in Californias future. Environ. Res. Lett. 2012, 7, 11. [Google Scholar] [CrossRef]
- Yue, Y.; Wang, T.; Liang, S.; Yang, J.; Houa, P.; Qu, S.; Zhou, J.; Jiae, X.; Wang, H.; Xu, M. Life cycle assessment of High-Speed Rail in China. Transp. Res. Part D Transp. Environ. 2015, 41, 367–376. [Google Scholar] [CrossRef]
- Kerman, J. The role of high-speed rail in mitigating climate change—The Swedish case Europabanan from a life cycle perspective. Transp. Res. Part D Transp. Environ. 2011, 16, 208–217. [Google Scholar]
- Bueno, G.; Hoyosb, D.; Capellán-Pérez, I. Evaluating the environmental performance of the high-speed rail project in the Basque Country, Spain. Res. Transp. Econ. 2017, 62, 44–56. [Google Scholar] [CrossRef]
- Robertson, S. The potential mitigation of CO2 emissions via modal substitution of high-speed rail for short-haul air travel from a life cycle perspective—An Australian case study. Transp. Res. Part D Transp. Environ. 2016, 46, 365–380. [Google Scholar] [CrossRef]
- Sun, Y.-Y.; Lin, Z.-W. Move fast, travel slow: The influence of high-speed rail on tourism in Taiwan. J. Sustain. Tour. 2018, 26, 433–450. [Google Scholar]
- Guirao, B.; Lara-Galera, A.; LuisCampa, J. High-Speed Rail commuting impacts on labor migration: The case of the concentration of metropolis in the Madrid functional area. Land Use Policy 2017, 66, 131–140. [Google Scholar] [CrossRef]
- Shen, Y.; Silva, J.d.A.e.; Martínez, L.M. Assessing High-Speed Rail’s impacts on land cover change in large urban areas based on spatial mixed logit methods: A case study of Madrid Atocha railway station from 1990 to 2006. J. Transp. Geogr. 2014, 41, 184–196. [Google Scholar]
- Gospodini, A. Urban development, redevelopment and regeneration encouraged by transport infrastructure projects: The case study of 12 European cities. Eur. Plan. Stud. 2007, 13, 1083–1111. [Google Scholar] [CrossRef]
- Chèze, C.; Nègre, R. Wider economic impacts of high-speed rail: Example of agglomeration benefits assessment on Bretagne Pays de Loire high-speed rail project. Transp. Res. Procedia 2017, 25, 5307–5324. [Google Scholar] [CrossRef]
- Brenner, N. Globalisation as reterritorialization: The re-scaling of urban governance in the European Union. Urban Stud. 1999, 36, 431–451. [Google Scholar] [CrossRef]
- Ortega, E.; López, E.; Monzón, A. Territorial cohesion impacts of high-speed rail at different planning levels. J. Transp. Geogr. 2012, 24, 130–141. [Google Scholar] [CrossRef]
- Sánchez-Mateos, H.S.M.; Givoni, M. The accessibility impact of a new High-Speed Rail line in the UK—A preliminary analysis of winners and losers. J. Transp. Geogr. 2012, 25, 105–114. [Google Scholar] [CrossRef]
- Sousa, C.; Roseta-Palma, C.; Martins, L.F. Economic growth and transport: On the road to sustainability. Nat. Resour. Forum 2015, 39, 3–14. [Google Scholar] [CrossRef]
- Liu, Y.; Shi, J. How inter-city high-speed rail influences tourism arrivals: Evidence from social media check-in data. Curr. Issues Tour. 2019, 22, 1025–1042. [Google Scholar] [CrossRef]
- Hiramatsu, T. Unequal regional impacts of high-speed rail on the tourism industry: A simulation analysis of the effects of KyushuShinkansen. Transportation 2018, 45, 677–701. [Google Scholar] [CrossRef]
- Diego, P. Agglomeration and cross-border infrastructure. EIB Pap. 2008, 13, 102–124. [Google Scholar]
- Li, X.; Huang, B.; Li, R.; Zhang, Y. Exploring the impact of high-speed railways on the spatial redistribution of economic activities—Yangtze River Delta urban agglomeration as a case study. J. Transp. Geogr. 2016, 57, 194–206. [Google Scholar]
- Jia, S.; Zhou, C.; Qin, C. No difference in effect of high-speed rail on regional economic growth based on match effect perspective? Transp. Res. Part A Policy Pract. 2017, 106, 144–157. [Google Scholar] [CrossRef]
- Aletà, N.B.; Alonso, C.M.; Ruiz, R.M.A. Smart Mobility and Smart Environment in the Spanish cities. Transp. Res. Procedia 2017, 24, 163–170. [Google Scholar] [CrossRef]
- Chen, C.-L.; Hall, P. The wider spatial-economic impacts of high-speed trains: A comparative case study of Manchester and Lille sub-regions. J. Transp. Geogr. 2012, 24, 89–110. [Google Scholar] [CrossRef]
- Yuan, H.; Wang, K.; Yang, H.; Wang, C. The impact of rail dispatch system reform on import by rail—Empirical evidence from a natural experiment in China. Transp. Policy 2019, 79, 165–176. [Google Scholar] [CrossRef]
- Ye, L.; Liu, S.; Chu, F.; Zhang, Q.; Guo, M. Effects of personality on job burnout and safety performance of high-speed rail drivers in China: The mediator of organizational identification. J. Transp. Saf. Secur. 2019, 13, 695–713. [Google Scholar] [CrossRef]
- D’Alfonso, T.; Jiang, C.; Bracaglia, V. Would competition between air transport and high-speed rail benefit environment and social welfare? Transp. Res. Part B 2015, 74, 118–137. [Google Scholar] [CrossRef]
- Bugalia, N.; Maemura, Y.; Ozawa, K. Demand risk management of private High-Speed Rail operators: A review of experiences in Japan and Taiwan. Transp. Policy 2019, in press. [Google Scholar] [CrossRef]
- He, G.; Mol, A.P.J.; Lu, Y. Public protests against the Beijing-Shenyang high-speed railway in China. Transp. Res. Part D Transp. Environ. 2016, 43, 1–16. [Google Scholar] [CrossRef] [Green Version]
- Woodburn, A. Rail network resilience and operational responsiveness during unplanned disruption: A rail freight case study. J. Transp. Geogr. 2019, 77, 59–69. [Google Scholar] [CrossRef]
- Li, T.; Rong, L.; Yan, K. Vulnerability analysis and critical area identification of public transport system: A case of high-speed rail and air transport coupling system in China. Transp. Res. Part A 2019, 127, 55–70. [Google Scholar]
- Liu, D.; Wang, Q.; Zhong, M.; Lu, Z.; Wang, J.; Wang, T.; Lv, S. Effect of wind speed variation on the dynamics of a high-speed train. Int. J. Veh. Mech. Mobil. 2019, 57, 247–268. [Google Scholar] [CrossRef]
- Garmendia, M.; Ribalaygua, C.; Urena, J.M. High-speed rail: Implication for cities. Cities 2012, 29, s26–s31. [Google Scholar] [CrossRef]
- Zembri, P.; Libourel, E. Towards oversized high-speed rail systems? Some lessons from France and Spain. Transp. Res. Procedia 2017, 25, 368–385. [Google Scholar]
- Álvarez-SanJaime, Ó.; Cantos-Sanchez, P.; Moner-Colonques, R.; Sempere-Monerris, J.J. Rail access charges and internal competition in high speed trains. Transp. Policy 2016, 49, 184–195. [Google Scholar] [CrossRef]
- Zhang, R.; Johnson, D.; Zhao, W.; Nash, C. Competition of airline and high-speed rail in terms of price and frequency: Empirical study from China. Transp. Policy 2019, 78, 8–18. [Google Scholar] [CrossRef]
- Kamga, C. Emerging travel trends, high-speed rail, and the public reinvention of U.S. transportation. Transp. Policy 2015, 37, 111–120. [Google Scholar] [CrossRef]
- Guo, B.; Ke, J. The Impacts of High-speed Rail on Sustainable Economic Development: Evidence from the Central Part of China. Sustainability 2020, 12, 2410. [Google Scholar] [CrossRef] [Green Version]
- Zheng, L.; Long, F.; Chang, Z.; Ye, J. Ghost town or city of hope? The spatial spillover effects of high-speed railway stations in China. Transp. Policy 2019, 81, 230–241. [Google Scholar] [CrossRef]
- Wang, L.; Liu, Y.; Sun, C.; Liu, Y. Accessibility impact of the present and future high-speed rail network: A case study of Jiangsu Province, China. J. Transp. Geogr. 2016, 54, 161–172. [Google Scholar] [CrossRef]
- Yu, M.; Fan, W. Accessibility impact of future high-speed rail corridor on the piedmont Atlantic megaregion. J. Transp. Geogr. 2018, 73, 1–12. [Google Scholar] [CrossRef]
- Gao, Y.; Zheng, J. The impact of high-speed rail on innovation: An empirical test of the companion innovation hypothesis of transportation improvement with China’s manufacturing firms. World Dev. 2020, 127, 104838. [Google Scholar]
- Arani, M.; Rezvani, M.M.; Davarikia, H.; Chan, Y. Routing of Electric Vehicles in a Stochastic Network with Non-recurrent Incidents: Behavioral Interpretation of Dynamic Traffic Assignment. ASCE-ASME J. Risk Uncertain. Eng. Syst. Part A Civil Eng. 2020, 6, 25–35. [Google Scholar]
- Li, H.; Strauss, J.; Lu, L. The impact of high-speed rail on civil aviation in China. Transp. Policy 2019, 74, 187–200. [Google Scholar] [CrossRef]
- Zhang, F.; Wang, F.; Ou, J.; Yao, S. Role of high-speed rail on social fixed assets investments in China. J. Chin. Econ. Bus. Stud. 2019, 17, 221–244. [Google Scholar] [CrossRef]
- Zhang, F.; Graham, D.J.; Wong, M.S.C. Quantifying the substitutability and complementarity between high-speed rail and air transport. Transp. Res. Part A Policy Pract. 2018, 118, 191–215. [Google Scholar] [CrossRef] [Green Version]
- Wang, F.; Wei, X.; Liu, J.; He, L.; Gao, M. Impact of high-speed rail on population mobility and urbanization: A case study on Yangtze River Delta urban agglomeration, China. Transp. Res. Part A Policy Pract. 2019, 127, 99–114. [Google Scholar]
- Albalate, D.; Fageda, X. High-speed rail and tourism: Empirical evidence from Spain. Transp. Res. Part A Policy Pract. 2016, 85, 174–185. [Google Scholar]
- Clewlow, R.R.; Sussman, J.M.; Balakrishnan, H. The impact of high-speed rail and low-cost carriers on European air passenger traffic. Transp. Policy 2014, 33, 136–143. [Google Scholar] [CrossRef]
- Wang, L. High-speed rail services development and regional accessibility restructuring in megaregions: A case of the Yangtze River Delta, China. Transp. Policy 2018, 72, 34–44. [Google Scholar] [CrossRef]
- Pagliara, F.; Mauriello, F. Modelling the impact of High-Speed Rail on tourists with Geographically Weighted Poisson Regression. Transp. Res. Part A Policy Pract. 2020, 132, 780–790. [Google Scholar] [CrossRef]
- Liu, S.; Wan, Y.; Ha, H.K.; Yoshida, Y.; Zhang, A. Impact of high-speed rail network development on airport traffic and traffic distribution: Evidence from China and Japan. Transp. Res. Part A Policy Pract. 2019, 127, 115–135. [Google Scholar] [CrossRef]
- Chen, Z. Measuring the regional economic impacts of highspeed rail using a dynamic SCGE model: The case of China. Eur. Plan. Stud. 2019, 27, 483–512. [Google Scholar]
- Diao, M. Does growth follow the rail? The potential impact of high-speed rail on the economic geography of China. Transp. Res. Part A 2018, 113, 279–290. [Google Scholar] [CrossRef]
- Yang, Z.; Li, T. Does high-speed rail boost urban tourism economy in China? Curr. Issues Tour. 2019, 23, 1973–1989. [Google Scholar] [CrossRef]
- Wang, L.; Liu, Y.; Liu, Y.; Sun, C.; Huang, Q. Use of isochrone maps to assess the impact of high-speed rail network development on journey times: A case study of Nanjing city, Jiangsu province, China. J. Maps 2016, 12, 514–519. [Google Scholar] [CrossRef]
- Wang, C.; Meng, W.; Hou, X. The impact of high-speed rails on urban economy: An investigation using night lighting data of Chinese cities. Res. Transp. Econ. 2020, 80, 100819. [Google Scholar] [CrossRef]
- Chen, Z.; Wang, Y. Impacts of severe weather events on high-speed rail and aviation delays. Transp. Res. Part D Transp. Environ. 2019, 69, 168–183. [Google Scholar]
- Zhang, A.; Wan, Y.; Yang, H. Impacts of high-speed rail on airlines, airports and regional economies: A survey of recent research. Transp. Policy 2019, 81, A1–A19. [Google Scholar] [CrossRef]
- Chen, Z.; Haynes, K.E. Impact of high-speed rail on regional economic disparity in China. J. Transp. Geogr. 2017, 65, 80–91. [Google Scholar]
- Chen, Z.; Haynes, K.E. Impact of high-speed rail on housing values: An observation from the Beijing–Shanghai line. J. Transp. Geogr. 2015, 43, 91–100. [Google Scholar] [CrossRef]
- Tsunoda, Y. Transportation policy for high-speed rail competing with airlines. Transp. Res. Part A 2018, 116, 350–360. [Google Scholar]
- Chen, Z.; Wang, Z.; Jiang, H. Analyzing the heterogeneous impacts of high-speed rail entry on air travel in China: A hierarchical panel regression approach. Transp. Res. Part A Policy Pract. 2019, 127, 86–98. [Google Scholar] [CrossRef]
- Westin, J.; Kågeson, P. Can high-speed rail offset its embedded emissions? Transp. Res. Part D Transp. Environ. 2012, 17, 1–7. [Google Scholar] [CrossRef] [Green Version]
- Delaplace, M.; Dobruszkes, F. From low-cost airlines to low-cost high-speed rail? The French case. Transp. Policy 2015, 38, 73–85. [Google Scholar] [CrossRef]
- Vickerman, R. Can high-speed rail have a transformative effect on the economy? Transp. Policy 2018, 62, 31–37. [Google Scholar] [CrossRef] [Green Version]
- Moyano, A.; Martínez, H.S.; Coronado, J.M. From network to services: A comparative accessibility analysis of the Spanish high-speed rail system. Transp. Policy 2018, 63, 51–60. [Google Scholar] [CrossRef]
- Dai, X.; Xu, M.; Wang, N. The industrial impact of the Beijing-Shanghai high-speed rail. Travel Behav. Soc. 2018, 12, 23–29. [Google Scholar] [CrossRef]
- Kim, H.; Sultana, S.; Weber, J. A geographic assessment of the economic development impact of Korean high-speed rail stations. Transp. Policy 2018, 66, 127–137. [Google Scholar] [CrossRef]
- Chen, X.; Liu, Y. Visualization analysis of high-speed railway research based on CiteSpace. Transp. Policy 2020, 85, 1–17. [Google Scholar] [CrossRef]
- Levinson, D.M. Accessibility impacts of high-speed rail. J. Transp. Geogr. 2012, 22, 288–291. [Google Scholar] [CrossRef] [Green Version]
- Weng, J.; Zhu, X.; Li, X. Impact of High-speed Rail on Destination Accessibility: A Case Study of China. J. China Tour. Res. 2020, 16, 494–509. [Google Scholar] [CrossRef]
- Chinowsky, P.; Helman, J.; Gulati, S.; Neumann, J.; Martinich, J. Impacts of climate change on operation of the US rail network. Transp. Policy 2019, 75, 183–191. [Google Scholar]
- Wang, D.-G.; Niu, Y.; Qian, J. Evolution and optimization of China’s urban tourism spatial structure: A high-speed rail perspective. Tour. Manag. 2018, 64, 218–232. [Google Scholar]
- Andrés, M.; Ortega, E.; López, E. Efficiency and spatial equity impacts of high-speed rail extensions in urban areas. Cities 2013, 30, 18–30. [Google Scholar]
- Jin, C.; Xu, J.; Lu, Y.; Huang, Z. The impact of Chinese Shanghai-Nanjing high-speed rail on regional accessibility. Geogr. Tidsskr.-Dan. J. Geogr. 2013, 113, 133–145. [Google Scholar]
- Kaczensky, P.; Knauer, F.; Krze, B.; Jonozovic, M.; Adamic, M.; Gossow, H. The impact of high-speed, high volume traffic axes on brown bears in Slovenia. Biol. Conserv. 2003, 111, 191–204. [Google Scholar] [CrossRef]
- Liu, L.; Zhang, M. High-speed rail impacts on travel times, accessibility, and economic productivity: A benchmarking analysis in city-cluster regions of China. J. Transp. Geogr. 2018, 73, 25–40. [Google Scholar]
- Kamga, C.; Yazici, M.A. Achieving environmental sustainability beyond technological improvements: Potential role of high-speed rail in the United States of America. Transp. Res. Part D Transp. Environ. 2014, 31, 148–164. [Google Scholar] [CrossRef]
- Matute, J.M.; Chester, M.V. Cost-effectiveness of reductions in greenhouse gas emissions from High-Speed Rail and urban transportation projects in California. Transp. Res. Part D Transp. Environ. 2015, 40, 104–113. [Google Scholar] [CrossRef]
- Weea, B.v.; Brinkb, R.v.d.; Nijland, H. Environmental impacts of high-speed rail links in cost-benefit analyses: A case study of the Dutch Zuider Zee line. Transp. Res. Part D 2003, 8, 299–314. [Google Scholar]
- Bukovac, S.; Douglas, I. The potential impact of High-Speed Rail development on Australian aviation. J. Air Transp. Manag. 2019, 78, 164–174. [Google Scholar] [CrossRef]
- Long, Y.; Zhang, W. Prioritizing future funding and construction of the planned high-speed rail corridors of China—According to regional structure and urban land development potential indices. Transp. Policy 2019, 81, 381–395. [Google Scholar]
- Raturi, V.; Verma, A. Analyzing competition between High-Speed Rail and Bus mode using market entry game analysis. Transp. Res. Procedia 2017, 25, 2373–2384. [Google Scholar]
- Raturi, V.; Verma, A. A game-theoretic approach to analyze inter-modal competition between high-speed rail and airlines in the Indian context. Transp. Plan. Technol. 2019, 43, 20–47. [Google Scholar] [CrossRef]
- Jiao, J.; Wang, J.; Jin, F. Impacts of high-speed rail lines on the city network in China. J. Transp. Geogr. 2017, 60, 257–266. [Google Scholar] [CrossRef]
- Clauzel, C.; Girardet, X.; Foltête, J.-C. Impact assessment of a high-speed railway line on species distribution: Application to the European tree frog (Hyla arborea) in Franche-Comté. J. Environ. Manag. 2013, 127, 125–134. [Google Scholar]
- Xu, W.; Zhou, J.; Yang, L.; Li, L. The implications of high-speed rail for Chinese cities: Connectivity and accessibility. Transp. Res. Part A Policy Pract. 2018, 116, 308–326. [Google Scholar]
- Wang, B.; Loo, B.P.Y. Travel time use and its impact on high-speed-railway passengers’ travel satisfaction in the e-society. Int. J. Sustain. Transp. 2019, 13, 197–209. [Google Scholar] [CrossRef]
- Li, L.S.; Yang, F.X.; Cui, C. High-speed rail and tourism in China: An urban agglomeration perspective. Int. J. Tour. Res. 2019, 21, 45–60. [Google Scholar] [CrossRef] [Green Version]
- Dalkic, G.; Balaban, O.; Tuydes-Yaman, H.; Celikkol-Kocak, T. An assessment of the CO2 emissions reduction in high-speed rail lines: Two case studies from Turkey. J. Clean. Prod. 2017, 165, 746–761. [Google Scholar]
- Post, W. High-Speed Rail Lines by Country. Available online: https://www.washingtonpost.com/wp-srv/world/highspeedrail.html?tid=grpromo (accessed on 11 July 2020).
- Alberico, U. Director. The “Direttissima” Rome—Florence Railway Line (1983)—YouTube. Film. Available online: https://www.youtube.com/watch?v=Wo35fZAe65g&t=8s (accessed on 12 September 2020).
- Railway-Technology. High Speed 2 (HS2) Railway, UK—Railway Technology. Available online: https://www.railway-technology.com/projects/high-speed-2-hs2/ (accessed on 12 September 2020).
- Railway-Technology. Germany InterCity Express High-Speed Rail Network Operated by Deutsche Bahn—Railway Technology. Available online: https://www.railway-technology.com/projects/ice-high-speed-rail/ (accessed on 12 September 2020).
- China High-Speed Rail Evolution: A Timeline of the Evolution. Available online: https://www.railway-technology.com/features/china-high-speed-rail-evolution/ (accessed on 11 July 2020).
- Railway-Technology. Norway Tilt Trains Operated by Norwegian State Railways—Railway Technology. Available online: https://www.railway-technology.com/projects/norway/ (accessed on 12 September 2020).
- Railway-Technology. TGV South Korea High-Speed Rail Route Operated by Korail—Railway Technology. Available online: https://www.railway-technology.com/projects/koreatgv/ (accessed on 12 September 2020).
- Bullet Train: Everything You Wanted to Know about Bullet Trains—What Is a High-Speed Railway? The Economic Times. Available online: https://economictimes.indiatimes.com/industry/transportation/railways/everything-you-wanted-to-know-about-bullet-trains/what-is-a-high-speed-railway/slideshow/60731138.cms (accessed on 11 July 2020).
- Map of American High-Speed Rail Network—Business Insider. Available online: https://www.businessinsider.com/map-of-american-high-speed-rail-network-2013-2 (accessed on 11 July 2020).
- Chan, Y.; Fowe, J.A.; Arani, M. Routing in a Stochastic Network with Nonrecurrent Incidents: Behavioral Interpretation of Dynamic Traffic Assignment. ASCE-ASME J. Risk Uncertain. Eng. Syst. Part A Civil Eng. 2020, 6, 04020002. [Google Scholar] [CrossRef]
- Tutton, M. How Green Is High-Speed Rail?—CNN. Available online: https://www.cnn.com/2011/11/18/world/how-green-is-hsr/index.html (accessed on 19 November 2011).
- Ohnsman, A. High-Speed LA-to-Las Vegas Virgin Train Wins $600 Million California Bond Allocation. Available online: https://www.forbes.com/sites/alanohnsman/2020/04/14/high-speed-la-to-las-vegas-virgin-train-wins-600-million-california-bond-allocation/#4c29ef6594f6 (accessed on 14 April 2020).
- Kendall, A.; Chang, B. Life cycle greenhouse gas assessment of infrastructure construction for California’s high-speed rail system. Transp. Res. Part D Transp. Environ. 2011, 16, 429–434. [Google Scholar]
- Wang, D.; Qian, J.; Chen, T.; Zhao, M.; Zhang, Y. Influence of the High-Speed Rail on the Spatial Pattern of Regional Tourism—Taken Beijing–Shanghai High-Speed Rail of China as Example. Asia Pac. J. Tour. Res. 2014, 19, 890–912. [Google Scholar]
- Jones, H.; Moura, F.; Domingos, T. Life cycle assessment of high-speed rail: A case study in Portugal. Int. J. Life Cycle Assess. 2017, 22, 410–422. [Google Scholar] [CrossRef]
- Llorca, C.; Ji, J.; Molloy, J.; Moeckel, R. The usage of location-based big data and trip planning services for the estimation of a long-distance travel demand model. Predicting the impacts of a new high-speed rail corridor. Res. Transp. Econ. 2018, 72, 27–36. [Google Scholar] [CrossRef]
- Millard-Ball, A.; Schipper, L. Are We Reaching Peak Travel? Trends in Passenger Transport in Eight Industrialized Countries. Transp. Rev. 2011, 31, 358–378. [Google Scholar] [CrossRef]
- Xu, B.; Cui, P.; Xu, H.; Chen, H.; Lin, Y. Commuter exposure to particle matter and carbon dioxide inside high-speed rail carriages. Transp. Res. Part D Transp. Environ. 2013, 20, 1–6. [Google Scholar]
- Zhang, Q.; Yang, H.; Wang, Q.; Zhang, A.; Zhang, Y. Impact of high-speed rail on market concentration and Lerner index in China’s airline market. J. Air Transp. Manag. 2020, 83, 101755. [Google Scholar] [CrossRef]
- Fengjun, J.; Jingjuan, J.; Yuanjing, Q.; Yu, Y. Evolution and geographic effects of high-speed rail in East Asia: An accessibility approach. J. Geogr. Sci. 2017, 27, 515–532. [Google Scholar]
- Yin, P.; Lin, Z.; Prideaux, B. The impact of the high-speed railway on tourism spatial structures between two adjoining metropolitan cities in China: Beijing and Tianjin. J. Transp. Geogr. 2019, 80, 102495. [Google Scholar] [CrossRef] [PubMed]
- Zhao, J.; Zhao, Y.; Li, Y. The variation in the value of travel-time savings and the dilemma of high-speed rail in China. Transp. Res. Part A Policy Pract. 2015, 82, 130–140. [Google Scholar] [CrossRef]
- Sperry, B.R.; Burris, M.; Woosnam, K.M. Investigating the impact of high-speed rail equipment visualization on mode choice models: Case study in central Texas. Case Stud. Transp. Policy 2017, 5, 560–572. [Google Scholar] [CrossRef]
- Zhang, Q.; Yang, H.; Wang, Q. Impact of high-speed rail on China’s Big Three airlines. Transp. Res. Part A Policy Pract. 2017, 98, 77–85. [Google Scholar] [CrossRef]
- Shaw, S.-L.; Fang, Z.; Lu, S.; Tao, R. Impacts of high-speed rail on railroad network accessibility in China. J. Transp. Geogr. 2014, 40, 112–122. [Google Scholar]
- Momenitabar, M.; Mattson, J. A Multi-Objective Meta-Heuristic Approach to Improve the Bus Transit Network: A Case Study of Fargo-Moorhead Area. Sustainability 2021, 13, 10885. [Google Scholar] [CrossRef]
- Dehdari Ebrahimi, Z.; Bridgelall, R.; Momenitabar, M. Extending Micromobility Deployments: A Concept and Local Case Study. In Advances in Data Science and Information Engineering, Transactions on Computational Science and Computational Intelligence; Stahlbock, R., Weiss, G.M., Abou-Nasr, M., Yang, C.Y., Arabnia, H.R., Deligiannidis, L., Eds.; Springer: Cham, Switzerland. [CrossRef]
- Cascetta, E.; Papola, A.; Pagliara, F.; Marzano, V. Analysis of mobility impacts of the high-speed Rome-Naples rail link using withinday dynamic mode service choice models. J. Transp. Geogr. 2011, 19, 635–643. [Google Scholar] [CrossRef]


| Method | Description of Method | References |
|---|---|---|
| DID | Panel data techniques to measure outcome differences between groups subjected to the variable of interest and others. This technique is popular in economics to estimate the effects of sharp changes in the economy and policies. | [36,39,54,55,56,58,59,60,61,62,68,69,70,71] |
| Regression | The estimation of a function to follow a pattern in data. The function can make predictions on new data, based on changes in the variables that “explain” the spread in the data. | [23,24,32,35,40,42,44,55,60,63,64,65,66,68,72,73,74,75,76,77] |
| Simulations | The statistical or computer modeling of a process to gain insights and understanding. An ability to model different scenarios and outcomes mitigates risks associated with change management that could otherwise affect the actual environment. | [13,46,49,58,78,79,80,81,82] |
| Networks | The depiction of relationships among actors to analyze social structures and phenomena. Nodes are associated with actors and their relations as lines among pairs of nodes that enable the application of matrix algebra and other mathematical techniques. | [12,14,41,45,53,81,83,84,85,86] |
| Spatial | Analysis of a mapped representation of variables across space to detect patterns and associations that may suggest underlying causes of any observed structure. | [25,29,47,51,55,87,88,89,90,91,92] |
| Sentiment | Analysis of the extent to which people hold favorable expectancies for their future. Research linked higher optimism to higher engagement and lower avoidance. Optimism is linked to proactive measures for safeguarding health whereas pessimism is associated with behaviors that adversely affect health. | [93] |
| BCA | A systematic prediction of social benefits and social costs to assess the economic effects of suggested public policies over time. The Benefit-Cost Analysis technique may incorporate principles of willingness-to-pay and opportunity cost. The outcome of a BCA is often policy decisions that would maximize net community benefits in monetary equivalents. | [27,83,87,94,95,96,97] |
| Games | Study of ways that the interactions among agents and economic factors produce outcomes relative to choices made. | [76,98,99] |
| Graphs | Representation of transport networks as nodes and weighted links to model and understand flows, throughput, distributions, mode selection, noise, bottlenecks, connectivity, accessibility, and other factors. | [66,68,74,100,101,102] |
| Journal | Summary of Scope | Summary of Articles |
|---|---|---|
| Transport Policy | Design of innovative policy, management practices, and applications bridging the gap between transport theory and practice. | Government, management, and industry strategies across all transport modes. Topics include international transport economics, strategies that influence policy, and effects monitoring. |
| Transport Geography | Issues and technological advances spanning the spatial dimensions of transportation, organization, structure, and operations that affect the globalization of economies. Deals with the effects of transport policy and governance on regions and places. | Articles analyze the impacts of transport investment on mobility, livelihoods, social networks, the spatial economy, patterns of development, travel behavior, and accessibility. |
| Transportation Research Part A: Policy and Practice | Policy analysis, design, formulation, and evaluation; planning; interaction with the political socioeconomic and physical environments; management and evaluation of transport systems. | The paper focuses on a clear policy concern with research covering topics from disciplines including economics, engineering, psychology, sociology, and urbanism. |
| Transportation Research Part D: Transport and Environment | The environmental impacts of transportation and policy responses, implications for the design, planning, and management of transportation systems. | Covers all factors relating to environmental impacts including, air quality, ecosystems, global climate, economic development, quality of life, public health, and land use. |
| Country | Operating Lines (km) | New Lines (km) | Approved | Service Start | Build Start | Max Speed (km/h) | Time (Years) |
|---|---|---|---|---|---|---|---|
| China | 26,869 | 10,738 | 1268 | 2008 | 1990 | 380 | 18 |
| Spain | 3100 | 1800 | 471 | 1992 | 1986 | 250 | 6 |
| Japan | 3041 | 402 | 194 | 1964 | 1959 | 320 | 5 |
| France | 3220 | 125 | 0 | 1981 | 1976 | 320 | 5 |
| Germany | 3038 | 330 | 0 | 1991 | 1973 | 300 | 18 |
| Sweden | 1706 | 180 | 0 | 1985 | 1979 | 200 | 6 |
| UK | 1377 | 230 | 320 | 1976 | 1969 | 201 | 7 |
| South Korea | 1104 | 376 | 49 | 2004 | 1992 | 300 | 12 |
| Italy | 999 | 116 | 0 | 1977 | 1970 | 250 | 7 |
| Turkey | 802 | 1208 | 1127 | 2007 | 2003 | 250 | 4 |
| Russia | 845 | 0 | 770 | 2012 | 2009 | 250 | 3 |
| Finland | 609 | 0 | 0 | 2006 | 2005 | 200 | 1 |
| Uzbekistan | 344 | 0 | 0 | 2011 | 2011 | 250 | 0 |
| Austria | 352 | 208 | 0 | 2008 | 1999 | 230 | 9 |
| Taiwan | 354 | 0 | 0 | 2007 | 1998 | 300 | 9 |
| Belgium | 326 | 0 | 0 | 1997 | 1997 | 260 | 5 |
| Poland | 224 | 0 | 484 | 2014 | 2011 | 200 | 3 |
| Netherlands | 175 | 0 | 0 | 2009 | 2000 | 300 | 9 |
| Switzerland | 144 | 15 | 0 | 2005 | 2000 | 200 | 5 |
| Luxembourg | 142 | 0 | 0 | 2007 | 2002 | 320 | 5 |
| Norway | 64 | 54 | 0 | 1998 | 1997 | 210 | 1 |
| USA | 54 | 192 | 1710 | 2030 | 2020 | 240 | 10 |
| Saudi Arabia | 453 | 453 | 0 | 2018 | 2009 | 299 | 9 |
| Denmark | 60 | 56 | 0 | 2019 | 2012 | 180 | 7 |
| Thailand | 0 | 873 | 615 | 2023 | 2017 | 250 | 6 |
| Iran | 0 | 410 | 1351 | 2021 | 2015 | 270 | 6 |
| Indonesia | 0 | 0 | 712 | 2021 | 2015 | 250 | 6 |
| India | 0 | 0 | 508 | 2023 | 2018 | 250 | 5 |
| Malaysia | 0 | 0 | 350 | 2031 | 2019 | 250 | 12 |
| Israel | 0 | 0 | 85 | 2018 | 2001 | 250 | 17 |
| Portugal | 0 | 0 | 550 | 2015 | 2000 | 250 | 15 |
| Czech Rep. | 0 | 0 | 660 | 2030 | 2017 | 250 | 13 |
| Greece | 0 | 500 | 200 | 2021 | 2018 | 250 | 3 |
| Advantage | Disadvantage | |
|---|---|---|
| DID | A simple method of comparing changes between a treated and an untreated time series, assuming that the latter is unaffected but similar. | Requires similar and stable data from both series. |
| Regression | The coefficients of the functional relationship model can convey the relative importance of variables. | Assumes that the cause-and-effect relationship between variables remains unchanged. May lead to erroneous and misleading results if the assumptions do not hold. |
| Simulation | Provides practical feedback when designing real-world systems, before construction. Allows for the efficient exploration of various scenarios before investments and construction. | Can be computationally intensive, which could delay results. May not accurately model the phenomenon. |
| Network | Accounts for dependencies and relationships to produce insights for improving management, planning, scheduling, and project control. | Evaluations could involve complex interactions that are difficult to visualize. Could be computationally complex. |
| Spatial | Accounts for locational aspects of attributes and considers spatial dependencies and correlations. | Spatial interactions destroy the assumption of variable independence. |
| Sentiment | Associates’ population growth with patterns in technology adoption based on waves of optimism, pessimism, and uncertainty in the marketplace. | Does not account for failures in innovation due to fear, uncertainty, doubt, or reduction of funding and political support. |
| BCA | Well-studied, simple, objective, and requires goal settings, for example, payback period. | Benefits often require quantification of intangibles and require determination of a discount rate, which may be unknown. |
| Graphs | Well-studied with fertile theoretical constructs that can represent complex flows and interactions to solve a wide variety of transport and logistical problems. | Representation of the network may be too simplified to account for unexpected disruptions such as terrorism or natural disasters. |
| Games | Often arrives at an optimal strategy when rules are well-defined. | Complete information is required for all parties involved. It can involve recursive thinking and dependencies among opponents, which can be intractable for humans to follow. |
Publisher’s Note: MDPI stays neutral with regard to jurisdictional claims in published maps and institutional affiliations. |
© 2021 by the authors. Licensee MDPI, Basel, Switzerland. This article is an open access article distributed under the terms and conditions of the Creative Commons Attribution (CC BY) license (https://creativecommons.org/licenses/by/4.0/).
Share and Cite
Momenitabar, M.; Bridgelall, R.; Dehdari Ebrahimi, Z.; Arani, M. Literature Review of Socioeconomic and Environmental Impacts of High-Speed Rail in the World. Sustainability 2021, 13, 12231. https://doi.org/10.3390/su132112231
Momenitabar M, Bridgelall R, Dehdari Ebrahimi Z, Arani M. Literature Review of Socioeconomic and Environmental Impacts of High-Speed Rail in the World. Sustainability. 2021; 13(21):12231. https://doi.org/10.3390/su132112231
Chicago/Turabian StyleMomenitabar, Mohsen, Raj Bridgelall, Zhila Dehdari Ebrahimi, and Mohammad Arani. 2021. "Literature Review of Socioeconomic and Environmental Impacts of High-Speed Rail in the World" Sustainability 13, no. 21: 12231. https://doi.org/10.3390/su132112231