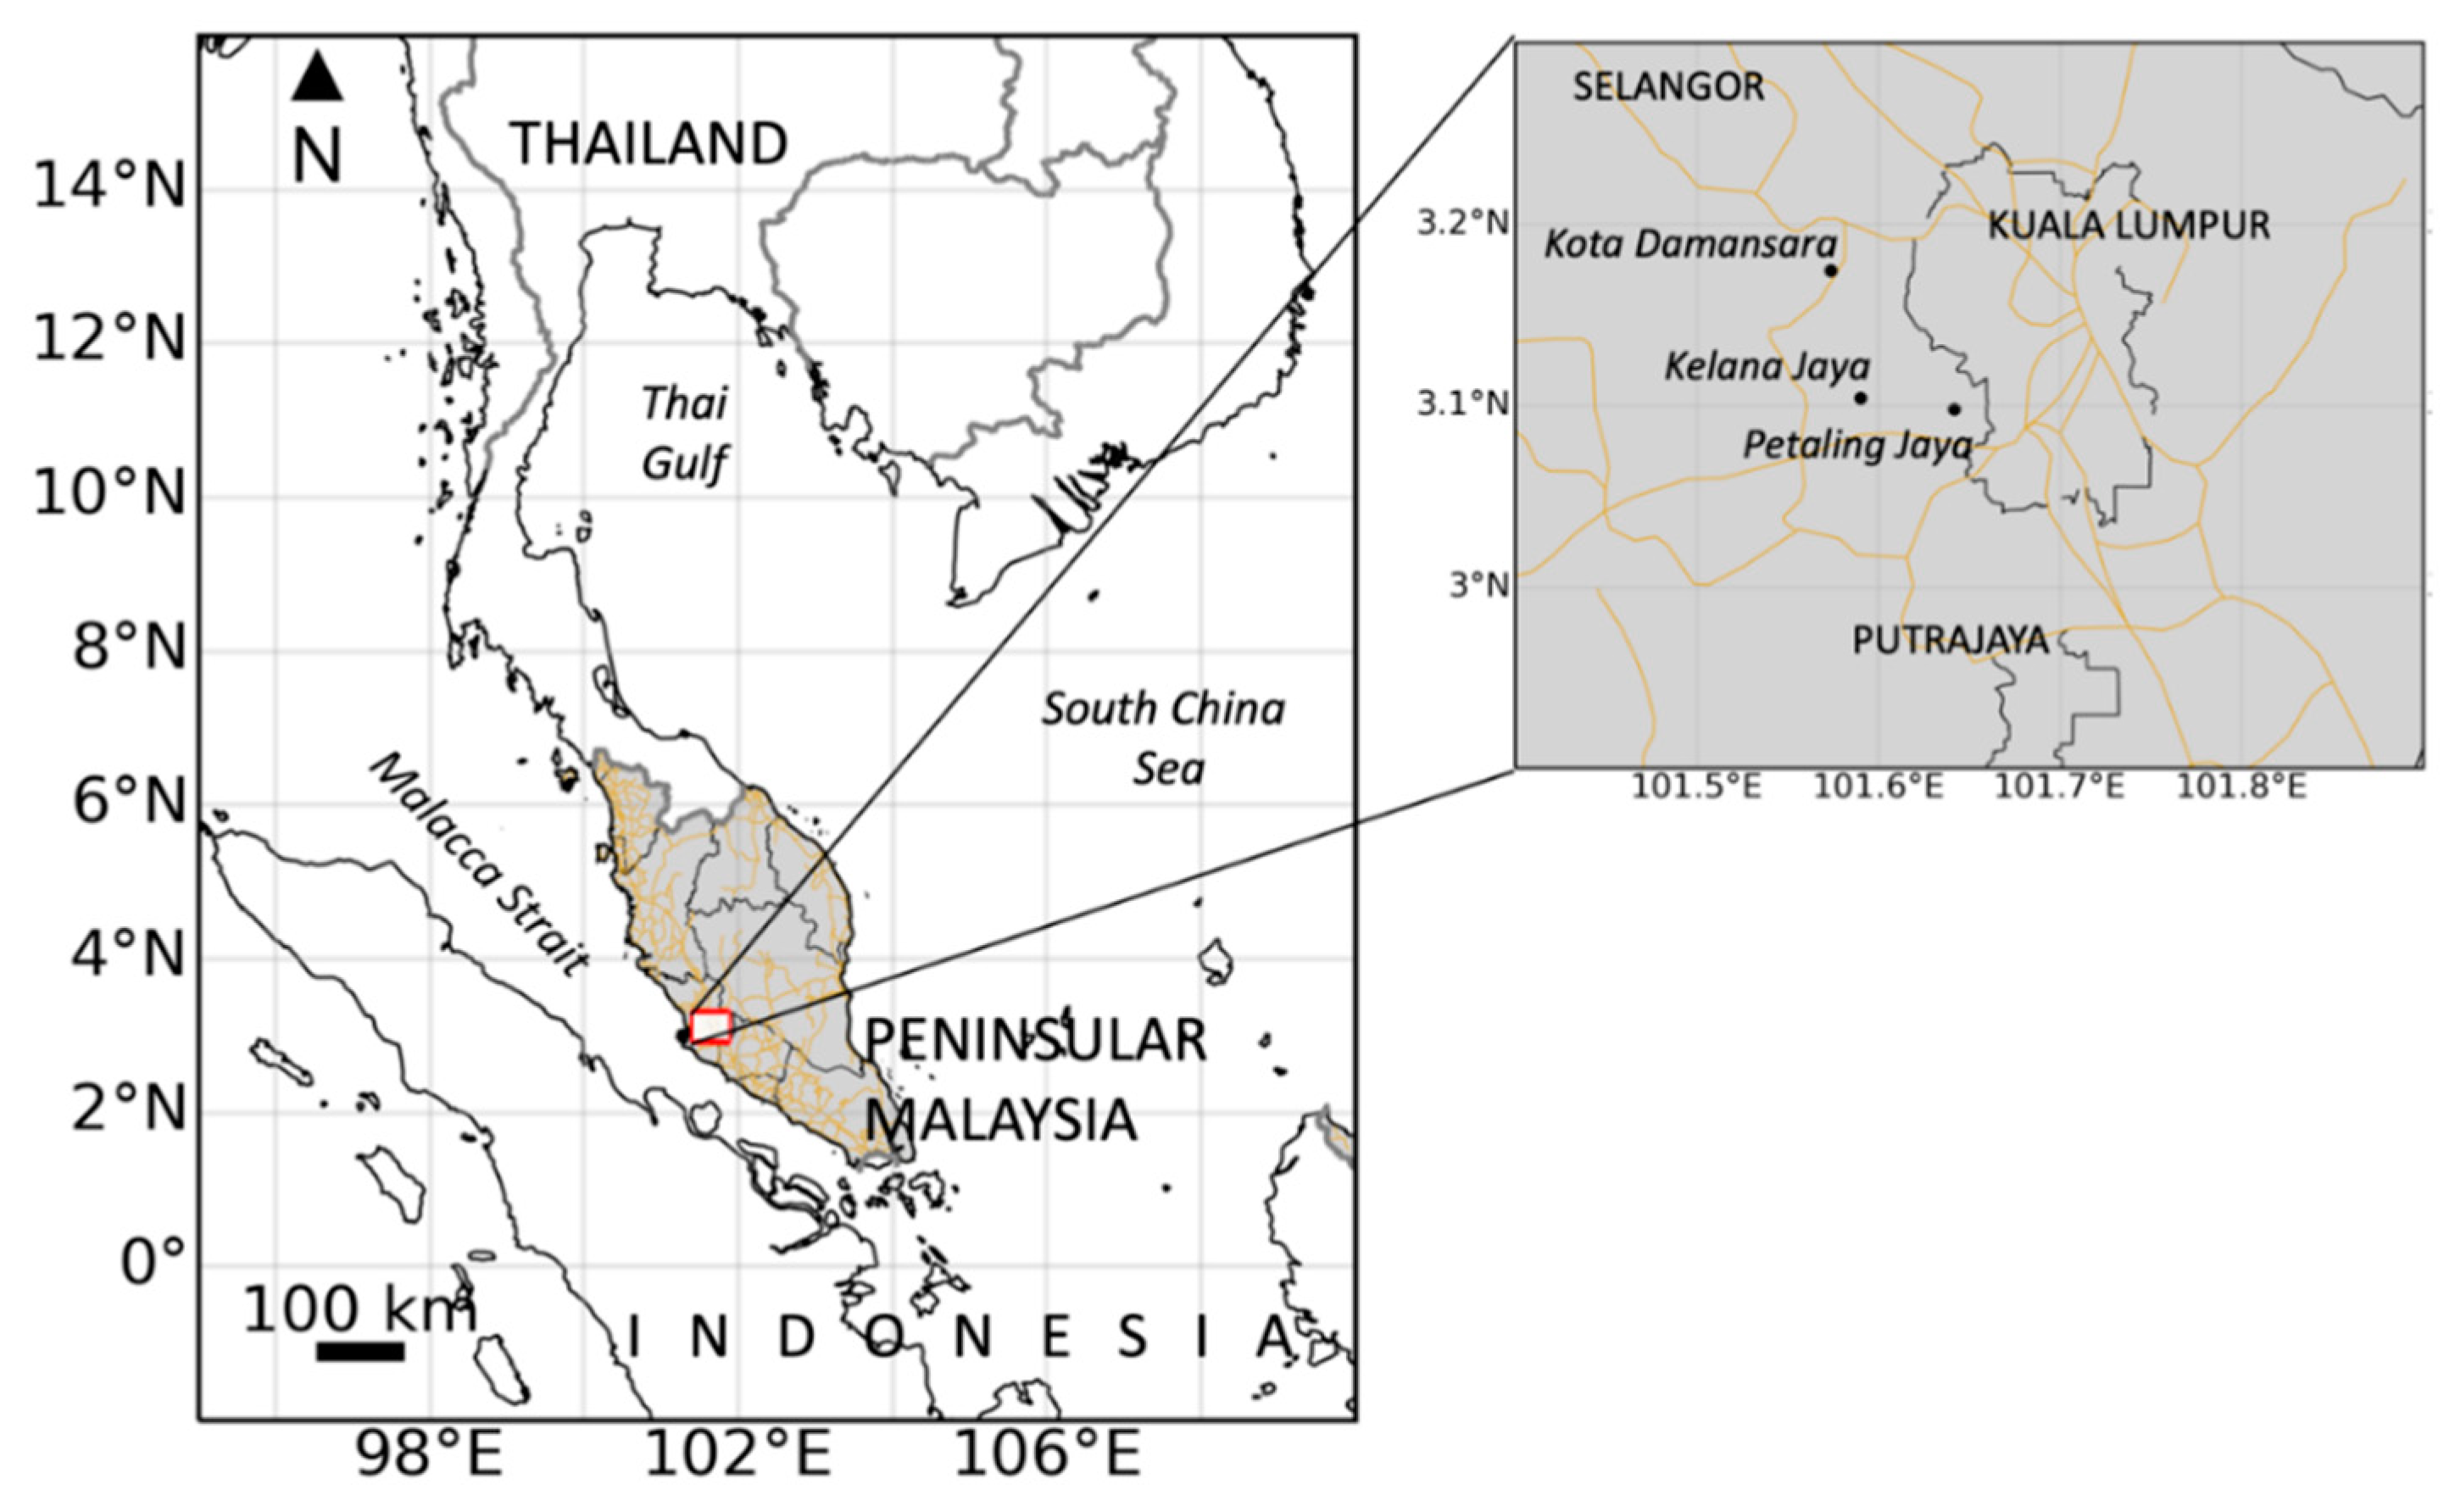
Figure 1.
Location of the sensor units.
Figure 1.
Location of the sensor units.
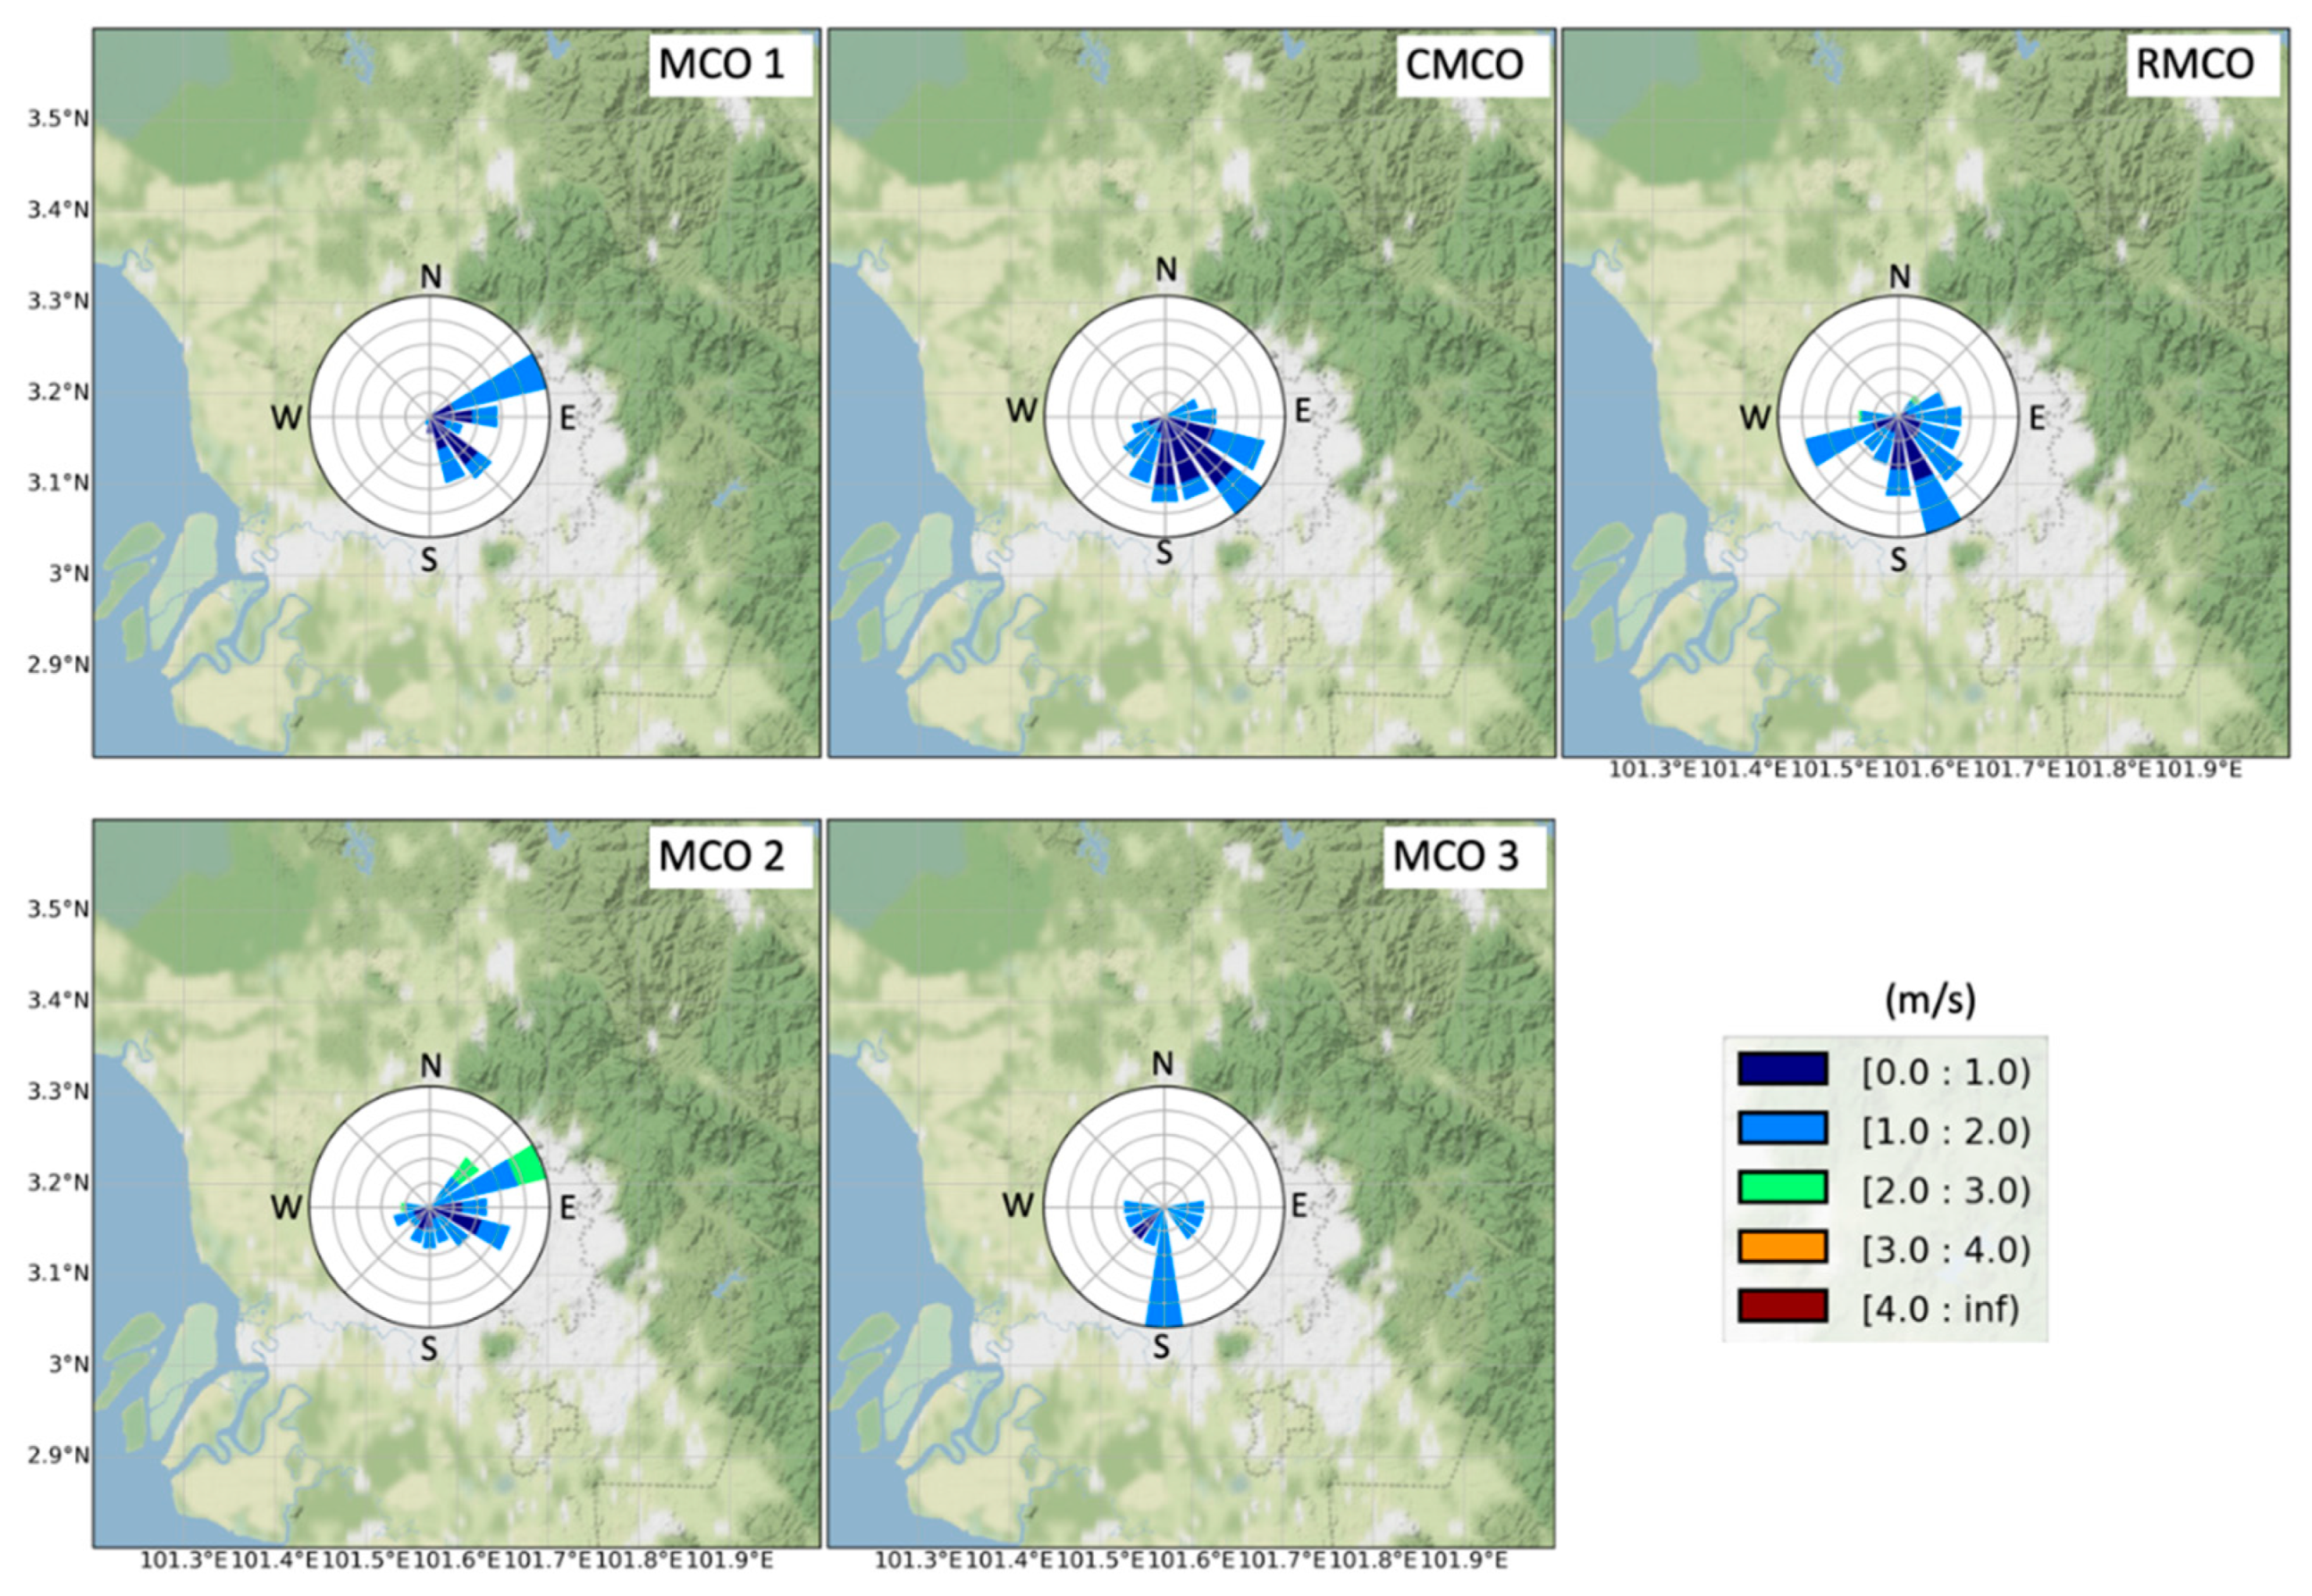
Figure 2.
Windroses showing the frequency (%) of wind direction during each lockdown phase.
Figure 2.
Windroses showing the frequency (%) of wind direction during each lockdown phase.
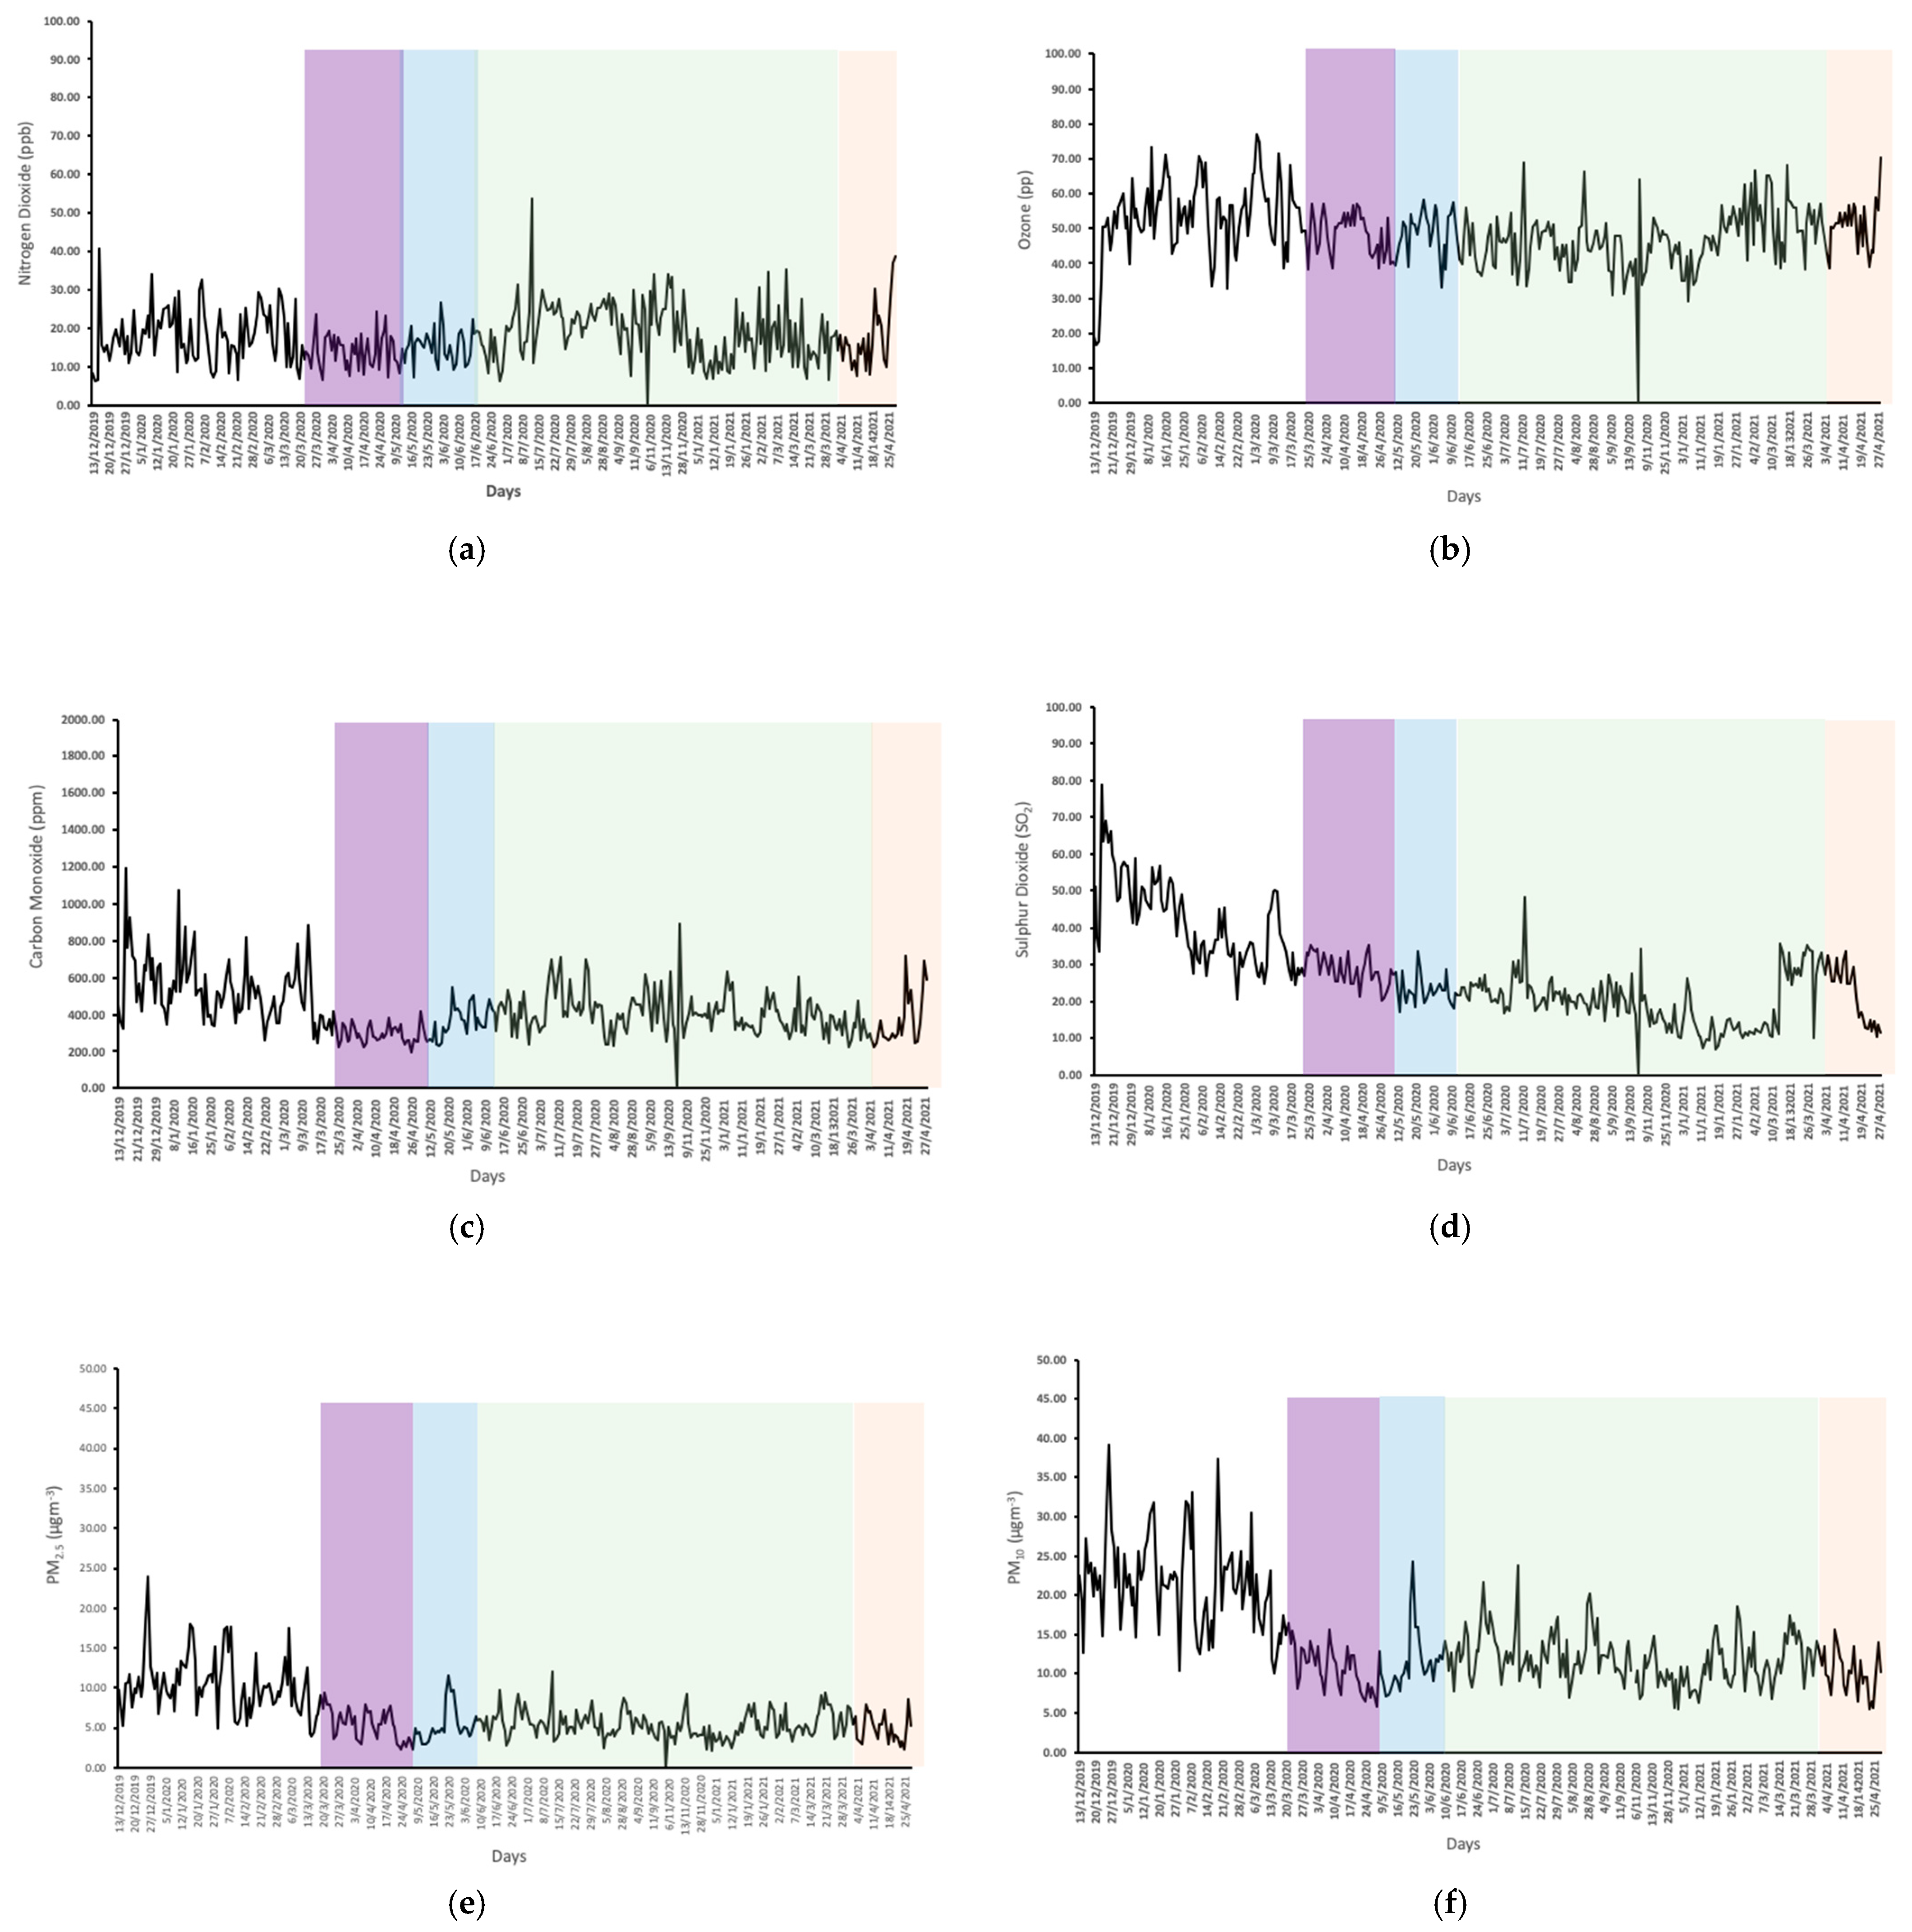
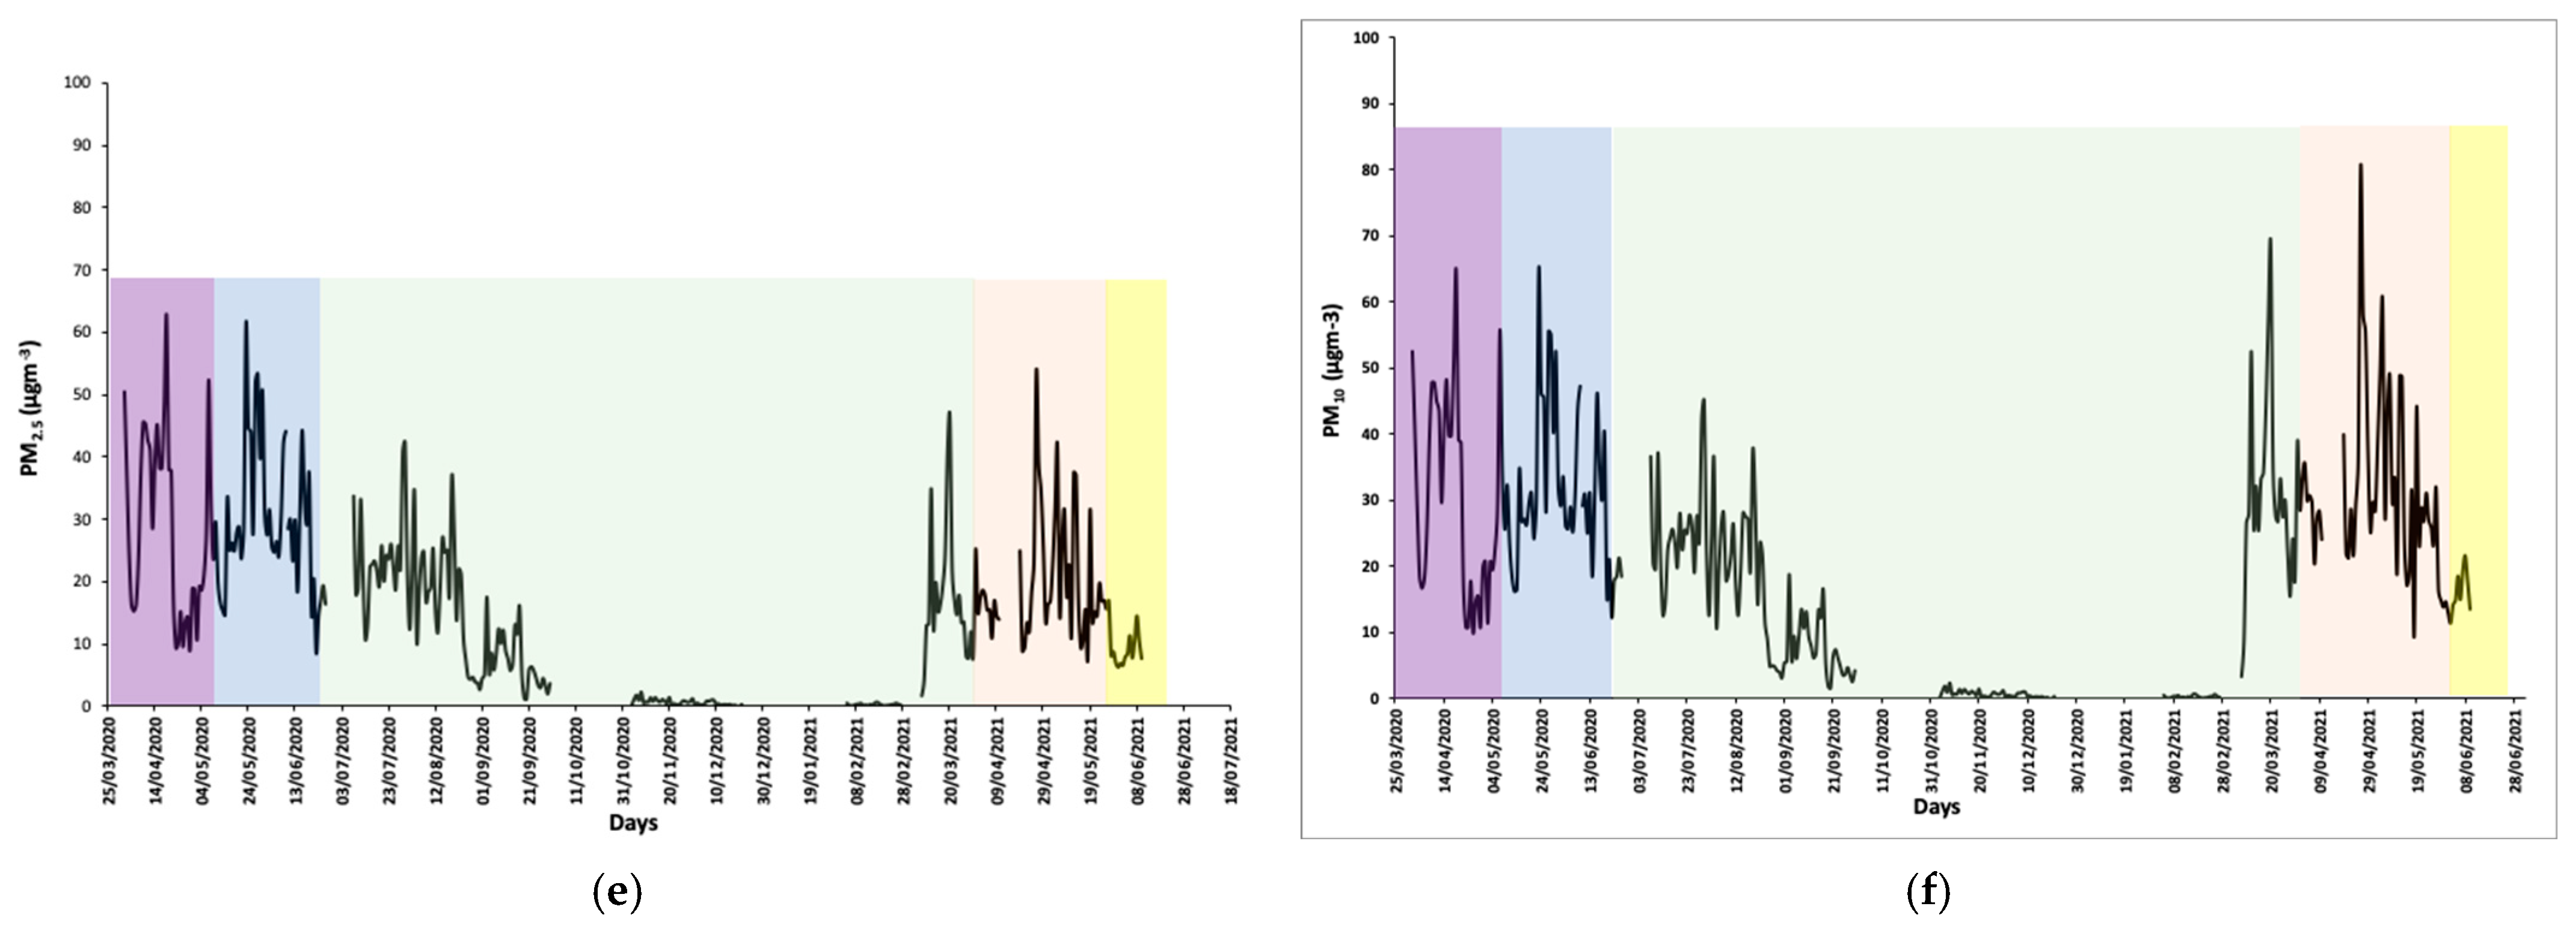
Figure 3.
(a–f). Daily concentration of (a) NO2, (b) O3, (c) CO, (d) SO2, (e) PM2.5 and (f) PM10 during normal days, MCO 1, CMCO, RMCO, MCO 2 over PJS. (Note: color bands represent different phases, white (normal), purple (MCO 1), blue (CMCO), green (RMCO) and orange (MCO 2).
Figure 3.
(a–f). Daily concentration of (a) NO2, (b) O3, (c) CO, (d) SO2, (e) PM2.5 and (f) PM10 during normal days, MCO 1, CMCO, RMCO, MCO 2 over PJS. (Note: color bands represent different phases, white (normal), purple (MCO 1), blue (CMCO), green (RMCO) and orange (MCO 2).
Figure 4.
(a–f) Daily concentration of (a) NO2, (b) CO, (c) O3, (d) SO2, (e) PM2.5 and (f) PM10 during normal days, MCO 1, CMCO, RMCO, MCO 2 and MCO 3 over KJ. (Note: color bands represent different phases, white (normal), purple (MCO 1), blue (CMCO), green (RMCO), orange (MCO 2) and yellow (MCO 3).
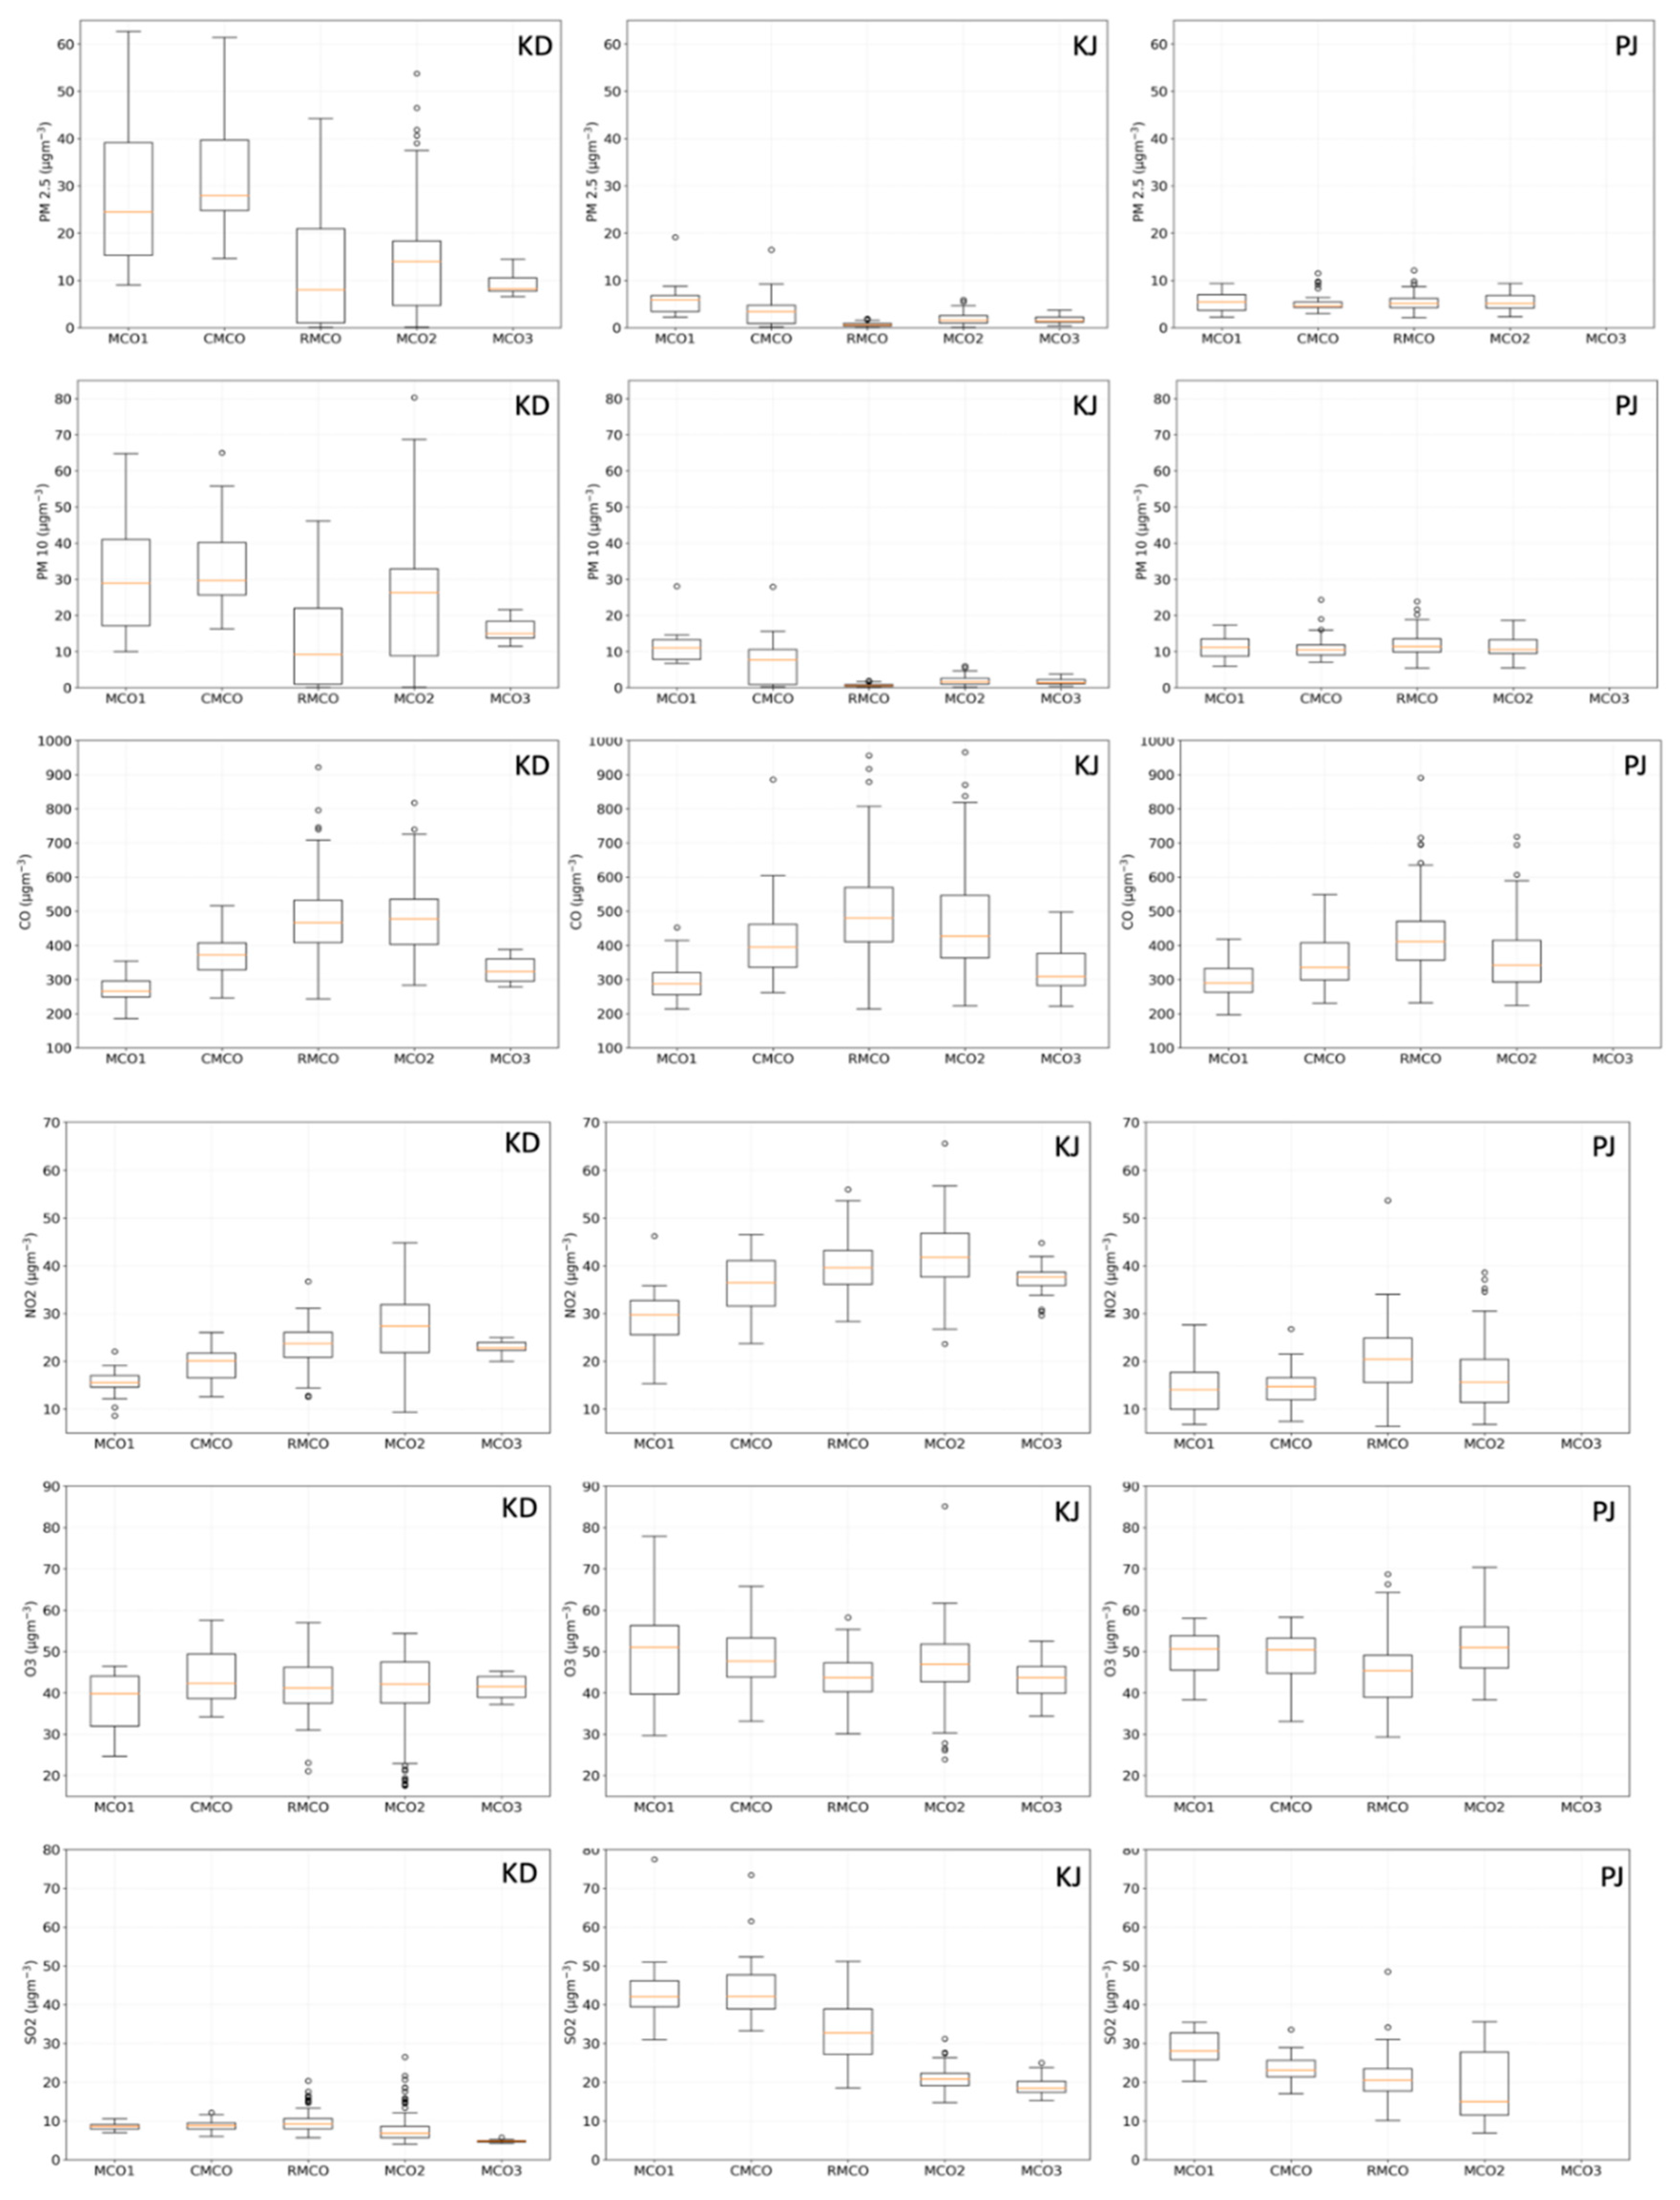
Figure 5.
Boxplot of all measured air pollutants at the three stations.
Figure 5.
Boxplot of all measured air pollutants at the three stations.
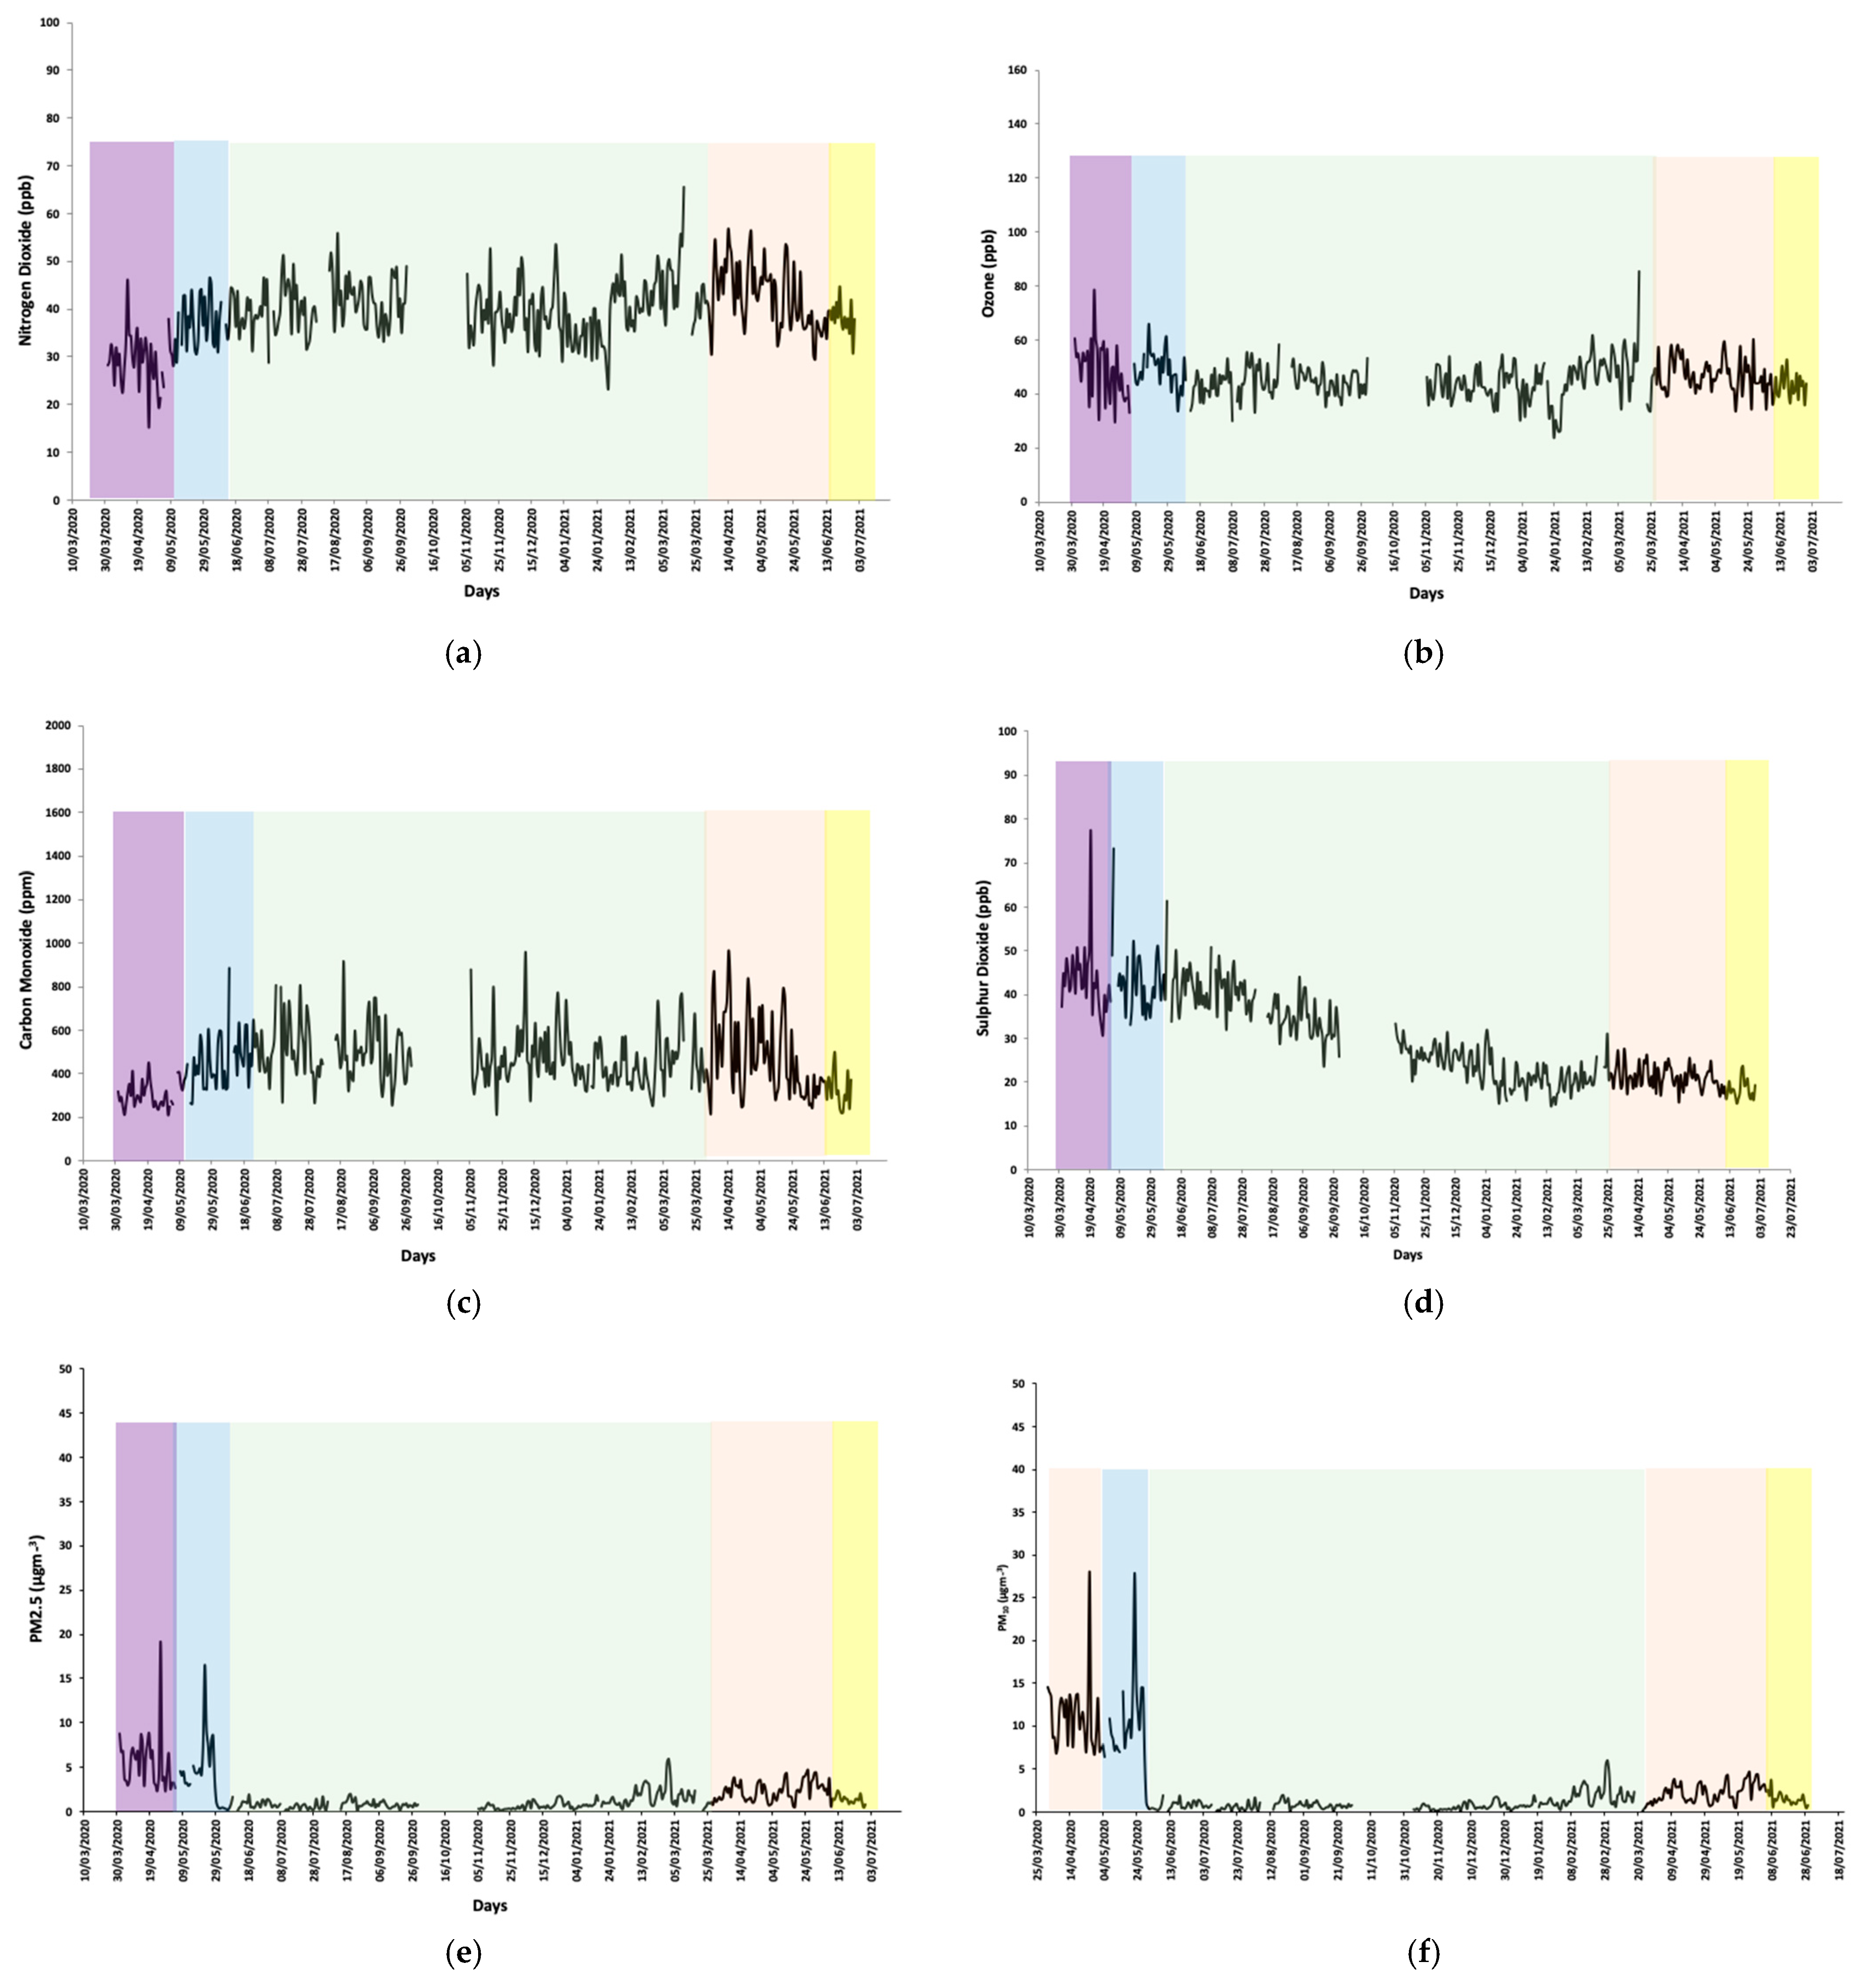
Figure 6.
Daily concentrations of (a) NO2, (b) CO, (c) O3, (d) SO2, (e) PM2.5 and (f) PM10 during normal days, MCO 1, CMCO, RMCO, MCO 2 and MCO 3 over Kota Damansara (KD). (Note: color bands represent different phases, white (normal), purple (MCO 1), blue (CMCO), green (RMCO), orange (MCO 2) and yellow (MCO 3).
Table 1.
Lockdown phases in Malaysia.
Table 1.
Lockdown phases in Malaysia.
| Movement Control Order (MCO), 18 March 2020–3 May 2020 |
|---|
| Phase | Date |
| Phase 1 | 18 March 2020–31 March 2020 |
| Phase 2 | 1 April 2020–14 April 2020 |
| Phase 3 | 15 April 2020–28 April 2020 |
| Phase 4 | 29 April 2020–3 May 2020 |
| Conditional Movement Control Order (CMCO), 4 May 2020–9 June 2020 |
| Phase 1 | 4 May 2020–12 May 2020 |
| Phase 2 | 13 May 2020–9 June 2020 |
| Recovery Movement Control Order (RMCO), 10 June 2020–31 March 2021 |
| Phase 1 | 10 June 2020–31 August 2020 |
| Phase 2 | 1 September 2020–31 December 2020 |
| Phase 3 | 1 January 2021–31 March 2021 |
MCO 2 by states, 11 January 2021–31 May 2021
* Each state switched between MCO, CMCO, RMCO |
| MCO 3, 1 June 2021–28 June 2021 |
| Enhanced Movement Control Order (EMCO), 3 July 2021 onwards |
Table 2.
Daily concentrations of PM10, PM2.5, SO2, NO2, O3 and CO over PJS (note: unit for PM is in μgm−3, SO2, NO2, O3 and CO are in ppb).
Table 2.
Daily concentrations of PM10, PM2.5, SO2, NO2, O3 and CO over PJS (note: unit for PM is in μgm−3, SO2, NO2, O3 and CO are in ppb).
| Normal |
|---|
| | PM10 | PM2.5 | SO2 | NO2 | O3 | CO |
| min | 10.0 | 3.9 | 20.7 | 6.3 | 16.7 | 245.7 |
| max | 39.2 | 23.9 | 78.7 | 40.7 | 76.8 | 1191.0 |
| average | 21.7 | 10.4 | 42.4 | 18.1 | 53.5 | 546.7 |
| MCO 1 |
| | PM10 | PM2.5 | SO2 | NO2 | O3 | CO |
| min | 5.9 | 2.3 | 20.2 | 6.8 | 38.3 | 196.9 |
| max | 17.4 | 9.4 | 35.4 | 27.6 | 58.0 | 418.1 |
| average | 11.1 | 5.5 | 28.6 | 14.5 | 49.7 | 300.4 |
| CMCO |
| | PM10 | PM2.5 | SO2 | NO2 | O3 | CO |
| min | 7.1 | 2.9 | 17.0 | 7.4 | 33.1 | 230.6 |
| max | 24.4 | 11.5 | 33.5 | 26.7 | 58.3 | 549.2 |
| average | 11.4 | 5.5 | 23.3 | 14.8 | 48.0 | 351.7 |
| RMCO |
| | PM10 | PM2.5 | SO2 | NO2 | O3 | CO |
| min | 5.4 | 2.1 | 6.8 | 6.4 | 29.2 | 227.0 |
| max | 23.9 | 12.1 | 48.5 | 53.7 | 68.7 | 890.7 |
| average | 11.8 | 5.4 | 19.7 | 18.9 | 46.8 | 411.4 |
| | | | MCO 2 | | | |
| | PM10 | PM2.5 | SO2 | NO2 | O3 | CO |
| min | 5.45 | 2.32 | 10.51 | 224.15 | 38.54 | 6.77 |
| max | 15.61 | 8.59 | 33.47 | 718.14 | 70.37 | 38.63 |
| average | 10.37 | 5.12 | 22.92 | 60.25 | 51.16 | 17.49 |
Table 3.
Malaysian Ambient Air Quality Standards (MAAQS) values (24 h averaging time) (note: n.a. = not available).
Table 3.
Malaysian Ambient Air Quality Standards (MAAQS) values (24 h averaging time) (note: n.a. = not available).
| Pollutants | Averaging Time | MAAQS |
|---|
| PM10 | 24 h | 50 μgm−3 |
| PM2.5 | 24 h | 25 μgm−3 |
| SO2 | 24 h | 30.5 ppb |
| NO2 | 24 h | 42.5 ppb |
| O3 | 24 h | n.a. |
| CO | 24 h | n.a. |
Table 4.
Percentage increase and reduction of pollutants during normal days to MCO, MCO to RMCO and RMCO to CMCO over PJS (note: − reduction and + increase).
Table 4.
Percentage increase and reduction of pollutants during normal days to MCO, MCO to RMCO and RMCO to CMCO over PJS (note: − reduction and + increase).
| Normal-MCO | MCO-CMCO | CMCO-RMCO | RMCO-MCO 2 |
|---|
| Percentage % | Percentage % | Percentage % | Percentage % |
|---|
| PM10 | −55.74 | PM10 | +40.25 | PM10 | +2.03 | PM10 | +12.4 |
| PM2.5 | −60.86 | PM2.5 | +22.91 | PM2.5 | +5.55 | PM2.5 | +5.79 |
| SO2 | −55.03 | SO2 | +5.51 | SO2 | +44.56 | SO2 | −15.94 |
| NO2 | −32.24 | NO2 | +3.22 | NO2 | +10.78 | NO2 | −8.05 |
| O3 | −24.37 | O3 | +0.41 | O3 | +17.83 | O3 | +8.53 |
| CO | −64.90 | CO | +31.34 | CO | +62.20 | CO | +12.44 |
Table 5.
Daily concentrations of PM10, PM2.5, SO2, NO2, O3 and CO over KJ. (Note: unit for PM is in μgm−3, SO2, NO2, O3 and CO are in ppb).
Table 5.
Daily concentrations of PM10, PM2.5, SO2, NO2, O3 and CO over KJ. (Note: unit for PM is in μgm−3, SO2, NO2, O3 and CO are in ppb).
| | | | MCO | | | |
|---|
| | PM10 | PM2.5 | SO2 | NO2 | O3 | CO |
|---|
| min | 6.73 | 2.26 | 30.92 | 15.28 | 29.64 | 213.48 |
| max | 28.10 | 19.14 | 77.43 | 46.22 | 77.93 | 452.49 |
| average | 11.07 | 5.62 | 43.28 | 29.24 | 49.13 | 297.20 |
| CMCO |
| | PM10 | PM2.5 | SO2 | NO2 | O3 | CO |
| min | 0.21 | 16.49 | 33.21 | 23.73 | 33.11 | 261.40 |
| max | 27.93 | 0.17 | 73.39 | 46.58 | 65.75 | 885.69 |
| average | 7.44 | 3.85 | 43.69 | 36.10 | 48.35 | 418.03 |
| | | | RMCO | | | |
| | PM10 | PM2.5 | SO2 | NO2 | O3 | CO |
| min | 0.05 | 0.04 | 33.95 | 23.64 | 23.91 | 213.59 |
| max | 6.01 | 5.91 | 51.11 | 65.62 | 85.15 | 955.72 |
| average | 0.95 | 0.93 | 41.84 | 40.33 | 44.58 | 480.82 |
| | | | MCO 2 | | | |
| | PM10 | PM2.5 | SO2 | NO2 | O3 | CO |
| min | 0.09 | 0.09 | 14.72 | 23.64 | 23.91 | 223.20 |
| max | 6.01 | 5.91 | 51.11 | 65.62 | 85.15 | 965.79 |
| average | 1.92 | 2.00 | 21.11 | 43.09 | 47.14 | 469.82 |
| | | | MCO 3 | | | |
| | PM10 | PM2.5 | SO2 | NO2 | O3 | CO |
| min | 0.41 | 0.41 | 15.24 | 29.58 | 34.35 | 221.88 |
| max | 3.73 | 3.73 | 24.98 | 44.80 | 52.52 | 497.32 |
| average | 1.51 | 1.51 | 18.89 | 37.17 | 42.99 | 325.82 |
Table 6.
Percentage increase and decrease of pollutants during different phases of MCO over KJ (note: − reduction and + increase).
Table 6.
Percentage increase and decrease of pollutants during different phases of MCO over KJ (note: − reduction and + increase).
| MCO-CMCO | CMCO-RMCO | RMCO-MCO 2 | MCO 2-MCO 3 |
|---|
| Percentage % | Percentage % | Percentage % | Percentage % |
|---|
| PM10 | −0.58 | PM10 | −78.47 | PM10 | +50.76 | PM10 | −27.40 |
| PM2.5 | −13.81 | PM2.5 | −64.19 | PM2.5 | +53.74 | PM2.5 | −20.12 |
| SO2 | −5.23 | SO2 | −30.36 | SO2 | +49.56 | SO2 | −11.75 |
| NO2 | +0.79 | NO2 | −9.01 | NO2 | +6.41 | NO2 | −15.93 |
| O3 | −15.63 | O3 | +29.51 | O3 | +5.43 | O3 | −9.66 |
| CO | +65.74 | CO | +7.91 | CO | −2.34 | CO | −44.19 |
Table 7.
Daily concentrations of PM10, PM2.5, SO2, NO2, O3 and CO over KD (note: unit for PM is in μgm−3; SO2, NO2, O3 and CO are in ppb).
Table 7.
Daily concentrations of PM10, PM2.5, SO2, NO2, O3 and CO over KD (note: unit for PM is in μgm−3; SO2, NO2, O3 and CO are in ppb).
| Normal |
|---|
| | PM10 | PM2.5 | SO2 | NO2 | O3 | CO |
|---|
| min | 10.02 | 3.95 | 20.72 | 6.28 | 16.67 | 245.68 |
| max | 39.22 | 23.90 | 78.70 | 40.74 | 76.77 | 1191.08 |
| average | 21.68 | 10.40 | 42.37 | 18.11 | 53.51 | 546.74 |
| | | | MCO | | | |
| | PM10 | PM2.5 | SO2 | NO2 | O3 | CO |
| min | 5.86 | 2.26 | 20.20 | 6.77 | 38.31 | 196.98 |
| max | 17.36 | 9.36 | 35.39 | 27.60 | 58.06 | 418.13 |
| average | 11.14 | 5.51 | 28.65 | 14.47 | 49.73 | 300.36 |
| | | | CMCO | | | |
| | PM10 | PM2.5 | SO2 | NO2 | O3 | CO |
| min | 7.09 | 2.97 | 17.02 | 7.40 | 33.05 | 230.61 |
| max | 24.35 | 11.50 | 33.54 | 26.74 | 58.30 | 549.15 |
| average | 11.44 | 5.48 | 23.32 | 14.81 | 48.03 | 351.71 |
| | | | RMCO | | | |
| | PM10 | PM2.5 | SO2 | NO2 | O3 | CO |
| min | 5.43 | 2.15 | 6.86 | 6.40 | 29.28 | 227.07 |
| max | 23.86 | 12.14 | 48.49 | 53.69 | 68.69 | 890.69 |
| average | 11.84 | 5.44 | 19.77 | 18.90 | 46.80 | 411.43 |
| | | | MCO 2 | | | |
| | PM10 | PM2.5 | SO2 | NO2 | O3 | CO |
| min | 3.39 | 0.26 | 4.60 | 12.73 | 17.72 | 283.20 |
| max | 68.72 | 46.50 | 14.78 | 44.84 | 54.35 | 817.66 |
| average | 29.82 | 16.05 | 7.65 | 29.48 | 42.08 | 505.26 |
| | | | MCO 3 | | | |
| | PM10 | PM2.5 | SO2 | NO2 | O3 | CO |
| min | 9.47 | 6.33 | 4.02 | 15.31 | 23.83 | 278.20 |
| max | 60.09 | 53.72 | 14.54 | 39.83 | 51.78 | 694.75 |
| average | 26.51 | 17.89 | 6.13 | 27.29 | 42.73 | 453.10 |
Table 8.
Percentage increase and decrease in pollutants during normal days to MCO, MCO to RMCO and RMCO to CMCO over KD (note: − reduction and + increase).
Table 8.
Percentage increase and decrease in pollutants during normal days to MCO, MCO to RMCO and RMCO to CMCO over KD (note: − reduction and + increase).
| MCO-CMCO | CMCO-RMCO | RMCO-MCO 2 | MCO 2-MCO 3 |
|---|
| Percentage % | Percentage % | Percentage % | Percentage % |
|---|
| PM10 | +0.31 | PM10 | +23.50 | PM10 | +42.42 | PM10 | +11.12 |
| PM2.5 | −2.03 | PM2.5 | −12.46 | M2.5 | +20.52 | PM2.5 | +10.25 |
| SO2 | +15.07 | SO2 | +54.09 | SO2 | −15.40 | SO2 | −19.81 |
| NO2 | +18.09 | NO2 | +72.22 | NO2 | +16.66 | NO2 | +7.44 |
| O3 | +23.90 | O3 | −0.99 | O3 | +2.57 | O3 | +1.52 |
| CO | +45.67 | CO | +78.60 | CO | −5.00 | CO | −11.51 |
Table 9.
Analysis of the relationships between individual air pollutants at all stations based on Pearson’s correlation coefficients (r2, p < 0.01).
Table 9.
Analysis of the relationships between individual air pollutants at all stations based on Pearson’s correlation coefficients (r2, p < 0.01).
| Pollutants | PJ |
|---|
| NO2 | O3 | SO2 | CO | PM2.5 | PM10 |
|---|
| NO2 | 1 | 0.13 | 0.0004 | 0.23 | 0.031 | 0.023 |
| O3 | 0.13 | 1 | 0.03 | 0.14 | 0.32 | 0.20 |
| SO2 | 0.0004 | 0.03 | 1 | 0.23 | 0.33 | 0.40 |
| CO | 0.23 | 0.14 | 0.23 | 1 | 0.33 | 0.32 |
| PM2.5 | 0.031 | 0.32 | 0.33 | 0.33 | 1 | 0.91 |
| PM10 | 0.023 | 0.20 | 0.40 | 0.32 | 0.91 | 1 |
| | KJ |
| NO2 | O3 | SO2 | CO | PM2.5 | PM10 |
| NO2 | 1 | 0.48 | 0.0012 | 0.002 | 0.12 | 0.17 |
| O3 | 0.48 | 1 | 0.020 | 0.25 | 0.006 | 0.0012 |
| SO2 | 0.0012 | 0.020 | 1 | 0.25 | 0.007 | 0.019 |
| CO | 0.42 | 0.25 | 0.25 | 1 | 0.002 | 0.0017 |
| PM2.5 | 0.12 | 0.006 | 0.007 | 0.002 | 1 | 0.92 |
| PM10 | 0.17 | 0.0012 | 0.019 | 0.0017 | 0.92 | 1 |
| | KD |
| NO2 | O3 | SO2 | CO | PM2.5 | PM10 |
| NO2 | 1 | 0.36 | 0.045 | 0.41 | 0.010 | 0.084 |
| O3 | 0.36 | 1 | 0.061 | 0.020 | 0.010 | 0.18 |
| SO2 | 0.045 | 0.061 | 1 | 0.068 | 0.0002 | 0.015 |
| CO | 0.41 | 0.020 | 0.068 | 1 | 0.0007 | 0.005 |
| PM2.5 | 0.010 | 0.010 | 0.0002 | 0.0007 | 1 | 0.90 |
| PM10 | 0.084 | 0.18 | 0.015 | 0.005 | 0.90 | 1 |
Table 10.
Pearson’s correlation coefficients (r2) for air pollutants and meteorological factors (temperature and RH) at all stations.
Table 10.
Pearson’s correlation coefficients (r2) for air pollutants and meteorological factors (temperature and RH) at all stations.
| PJS |
|---|
| Air Pollutants | Temp (°C) | Relative Humidity (%) |
|---|
| NO2 | 0.03 | −0.081 |
| O3 | 0.08 | −0.003 |
| SO2 | −0.03 | −0.010 |
| CO | 0.02 | 0.11 |
| PM2.5 | −0.01 | −0.006 |
| PM10 | −0.01 | −0.006 |
| | KJ |
| Air Pollutants | Temp (°C) | Relative Humidity (%) |
| NO2 | −0.003 | −0.0014 |
| O3 | −0.04 | −0.0462 |
| SO2 | 0.67 | 0.538 |
| CO | 0.1214 | 0.1435 |
| PM2.5 | −0.0111 | −0.0168 |
| PM10 | −0.0446 | −0.0589 |
| | KD |
| Air Pollutants | Temp (°C) | Relative Humidity (%) |
| NO2 | −0.027 | −0.027 |
| O3 | −0.044 | −0.006 |
| SO2 | −0.015 | −0.039 |
| CO | −0.077 | −0.029 |
| PM2.5 | −0.007 | −0.030 |
| PM10 | −0.047 | −0.047 |
Table 11.
Hazard quotients and cancer risk for ambient air pollutants in KD.
Table 11.
Hazard quotients and cancer risk for ambient air pollutants in KD.
| | MCO |
|---|
| | | PM10 | PM2.5 | SO2 | NO2 | O3 | CO |
|---|
| Infant (0–1 year) | HQ | 2.36 × 10⁻¹ | 6.33 × 10⁻¹ | 2.19 × 10⁻¹ | 3.25 × 10⁻¹ | 5.96 × 10⁻¹ | 2.42 × 10+1 |
| | CR | | 2.53 × 10⁻³ | | | | |
| Child (2–5 years) | HQ | 2.14 × 10⁻¹ | 5.76 × 10⁻¹ | 1.99 × 10⁻¹ | 2.96 × 10⁻¹ | 5.42 × 10⁻¹ | 2.20 × 10+1 |
| | CR | | 1.38 × 10+2 | | | | |
| Child (6–12 years) | HQ | 1.34 × 10⁻¹ | 3.61 × 10⁻¹ | 1.25 × 10⁻¹ | 1.85 × 10⁻¹ | 3.40 × 10⁻¹ | 1.38 × 10+1 |
| | CR | | 1.73 × 10⁻² | | | | |
| Adult (19–75 years) | HQ | 8.63 × 10⁻² | 2.32 × 10⁻¹ | 8.02 × 10⁻² | 1.19 × 10⁻¹ | 2.18 × 10⁻¹ | 8.84 × 10 |
| | CR | | 2.78 × 10⁻² | | | | |
| | CMCO |
| Infant (0–1 years) | HQ | 2.60 × 10⁻¹ | 7.05 × 10⁻¹ | 2.28× 10⁻¹ | 2.64 × 10⁻¹ | 6.98 × 10⁻¹ | 2.20 × 10+1 |
| | CR | | 2.82 × 10⁻³ | | | | |
| Child (2–5 years) | HQ | 2.37 × 10⁻¹ | 6.42 × 10⁻¹ | 2.07 × 10⁻¹ | 2.40 × 10⁻¹ | 6.35 × 10⁻¹ | 2.01 × 10+1 |
| | CR | | 1.54 × 10⁻² | | | | |
| Child (6–12 years) | HQ | 1.48 × 10⁻¹ | 4.02 × 10⁻¹ | 1.30 × 10⁻¹ | 1.50 × 10⁻¹ | 3.98 × 10⁻¹ | 1.26 × 10+1 |
| | CR | | 1.93 × 10⁻² | | | | |
| Adult (19–75 years) | HQ | 9.53 × 10⁻² | 2.58 × 10⁻¹ | 8.35 × 10⁻² | 9.66 × 10⁻² | 2.56 × 10⁻¹ | 8.07 × 10 |
| | CR | | 3.10 × 10⁻² | | | | |
| | | RMCO |
| Infant (0–1 year) | HQ | 1.34 × 10⁻¹ | 2.85 × 10⁻¹ | 2.31 × 10⁻¹ | 5.15 × 10⁻¹ | 6.40 × 10⁻¹ | 4.29 × 10+1 |
| | CR | | 1.14 × 10⁻³ | | | | |
| Child (2–5 years) | HQ | 1.22 × 10⁻¹ | 2.59 × 10⁻¹ | 2.10 × 10⁻¹ | 4.69 × 10⁻¹ | 5.82 × 10⁻¹ | 3.90 × 10+1 |
| | CR | | 6.21 × 10⁻³ | | | | |
| Child (6–12 years) | HQ | 7.64 × 10⁻² | 1.62 × 10⁻¹ | 1.32 × 10⁻¹ | 2.94 × 10⁻¹ | 3.65 × 10⁻¹ | 2.45 × 10+1 |
| | CR | | 7.79 × 10⁻³ | | | | |
| Adult (19–75 years) | HQ | 4.91 × 10⁻² | 1.04 × 10⁻¹ | 8.46 × 10⁻² | 1.89 × 10⁻¹ | 2.34 × 10⁻¹ | 1.57 × 10+1 |
| | CR | | 1.25 × 10⁻² | | | | |
Table 12.
Hazard quotients and cancer risk for ambient air pollutants in KJ.
Table 12.
Hazard quotients and cancer risk for ambient air pollutants in KJ.
| | | MCO |
|---|
| | | PM10 | PM2.5 | SO2 | NO2 | O3 | CO |
|---|
| Infant (0–1 year) | HQ | 8.64 × 10⁻² | 1.25 × 10⁻¹ | 1.11 × 10 | 6.13 × 10⁻¹ | 7.67 × 10⁻¹ | 2.66 × 10+1 |
| | CR | | 5.01 × 10⁻⁴ | | | | |
| Child (2–5 years) | HQ | 7.86 × 10⁻² | 1.14 × 10⁻¹ | 1.01 × 10 | 5.58 × 10⁻¹ | 6.98 × 10⁻¹ | 2.42 × 10+1 |
| | CR | | 2.74 × 10⁻³ | | | | |
| Child (6–12 years) | HQ | 4.93 × 10⁻² | 7.14 × 10⁻² | 6.31 × 10⁻¹ | 3.49 × 10⁻¹ | 4.37 × 10⁻¹ | 1.51 × 10+1 |
| | CR | | 3.43 × 10⁻³ | | | | |
| Adult (19–75 years) | HQ | 3.16 × 10⁻² | 4.59 × 10⁻² | 4.05 × 10⁻¹ | 2.24 × 10⁻¹ | 2.81 × 10⁻¹ | 9.73 × 10 |
| | CR | | 5.51 × 10⁻³ | | | | |
| | | CMCO |
| Infant (0–1 years) | HQ | 5.81 × 10⁻² | 8.59 × 10⁻² | 1.12 × 10 | 7.57 × 10⁻¹ | 7.55 × 10⁻¹ | 3.74 × 10+1 |
| | CR | | 3.44 × 10⁻⁴ | | | | |
| Child (2–5 years) | HQ | 5.28 × 10⁻² | 7.81 × 10⁻² | 1.02 × 10 | 6.89 × 10⁻¹ | 6.87 × 10⁻¹ | 3.40 × 10+1 |
| | CR | | 1.88 × 10⁻³ | | | | |
| Child (6–12 years) | HQ | 3.31 × 10⁻² | 4.89 × 10⁻² | 6.37 × 10 | 4.31 × 10⁻¹ | 4.30 × 10⁻¹ | 2.13 × 10+1 |
| | CR | | 2.35 × 10⁻³ | | | | |
| Adult (19–75 years) | HQ | 2.13 × 10⁻² | 3.14 × 10⁻² | 4.09 × 10 | 2.77 × 10⁻¹ | 2.76 × 10⁻¹ | 1.37 × 10+1 |
| | CR | | 3.77 × 10⁻³ | | | | |
| | | RMCO |
| Infant (0–1 year) | HQ | 7.42 × 10⁻³ | 2.07 × 10⁻² | 1.07 × 10 | 8.46 × 10⁻¹ | 6.96 × 10⁻¹ | 4.30 × 10⁻¹ |
| | CR | | 8.30 × 10⁻⁵ | | | | |
| Child (2–5 years) | HQ | 6.75 × 10⁻³ | 1.89 × 10⁻² | 9.73 × 10⁻¹ | 7.69 × 10⁻¹ | 6.33 × 10⁻¹ | 3.91 × 10⁻¹ |
| | CR | | 4.53 × 10⁻⁴ | | | | |
| Child (6–12 years) | HQ | 4.23 × 10⁻³ | 1.18 × 10⁻² | 6.10 × 10⁻¹ | 4.82 × 10⁻¹ | 3.97 × 10⁻¹ | 2.45 × 10⁻¹ |
| | CR | | 5.67 × 10⁻⁴ | | | | |
| Adult (19–75 years) | HQ | 2.72 × 10⁻³ | 7.59 × 10⁻³ | 3.92 × 10⁻¹ | 3.10 × 10⁻¹ | 2.55 × 10⁻¹ | 1.57 × 10⁻¹ |
| | CR | | 9.11 × 10⁻⁴ | | | | |
Table 13.
Hazard quotients and cancer risk for ambient air pollutants in PJ.
Table 13.
Hazard quotients and cancer risk for ambient air pollutants in PJ.
| | | MCO |
|---|
| | | PM10 | PM2.5 | SO2 | NO2 | O3 | CO |
|---|
| Infant (0–1 y) | HQ | 8.70 × 10⁻² | 1.23 × 10⁻¹ | 7.32 × 10⁻¹ | 3.03 × 10⁻¹ | 7.77 × 10⁻¹ | 2.68 × 10⁻¹ |
| | CR | | 4.92 × 10⁻⁴ | | | | |
| Child (2–5 years) | HQ | 7.91 × 10⁻² | 1.12 × 10⁻¹ | 6.66 × 10⁻¹ | 2.76 × 10⁻¹ | 7.07 × 10⁻¹ | 2.44 × 10⁻¹ |
| | CR | | 2.68 × 10⁻³ | | | | |
| Child (6–12 years) | HQ | 4.96 × 10⁻² | 7.00 × 10⁻² | 4.17 × 10⁻¹ | 1.73 × 10⁻¹ | 4.43 × 10⁻¹ | 1.53 × 10⁻¹ |
| | CR | | 3.36 × 10⁻³ | | | | |
| Adult (19–75 years) | HQ | 3.18 × 10⁻² | 4.50 × 10⁻² | 2.68 × 10⁻¹ | 1.11 × 10⁻¹ | 2.84 × 10⁻¹ | 9.83 × 10 |
| | CR | | 5.40 × 10⁻³ | | | | |
| | | CMCO |
| Infant (0–1 year) | HQ | 8.93 × 10⁻² | 1.22 × 10⁻¹ | 5.96 × 10⁻¹ | 3.11 × 10⁻¹ | 7.50 × 10⁻¹ | 3.14 × 10+1 |
| | CR | | 4.89 × 10⁻⁴ | | | | |
| Child (2–5 years) | HQ | 8.13 × 10⁻² | 1.11 × 10⁻¹ | 5.43 × 10⁻¹ | 2.83 × 10⁻¹ | 6.82 × 10⁻¹ | 2.86 × 10+1 |
| | CR | | 2.67 × 10⁻³ | | | | |
| Child (6–12 years) | HQ | 5.09 × 10⁻² | 6.97 × 10⁻² | 3.40 × 10⁻¹ | 1.77 × 10⁻¹ | 4.27 × 10⁻¹ | 1.79 × 10+1 |
| | CR | | 3.34 × 10⁻³ | | | | |
| Adult (19–75 years) | HQ | 3.27 × 10⁻² | 4.47 × 10⁻² | 2.18 × 10⁻¹ | 1.14 × 10⁻¹ | 2.75 × 10+1 | 1.15 × 10+1 |
| | CR | | 5.37 × 10⁻³ | | | | |
| | | RMCO |
| Infant (0–1 year) | HQ | 9.24 × 10⁻² | 1.21 × 10⁻¹ | 5.05 × 10⁻¹ | 3.96 × 10⁻¹ | 7.31 × 10⁻¹ | 3.68 × 10+1 |
| | CR | | 4.85 × 10⁻⁴ | | | | |
| Child (2–5 years) | HQ | 8.41 × 10⁻² | 1.10 × 10⁻¹ | 4.60 × 10⁻¹ | 3.61 × 10⁻¹ | 6.65 × 10⁻¹ | 3.35 × 10+1 |
| | CR | | 2.65 × 10⁻³ | | | | |
| Child (6–12 years) | HQ | 5.27 × 10⁻² | 6.92 × 10⁻² | 2.88 × 10⁻¹ | 2.26 × 10⁻¹ | 4.16 × 10⁻¹ | 2.10 × 10+1 |
| | CR | | 3.32 × 10⁻³ | | | | |
| Adult (19–75 years) | HQ | 3.38 × 10⁻² | 4.44 × 10⁻² | 1.85 × 10⁻¹ | 1.45 × 10⁻¹ | 2.68 × 10⁻¹ | 1.35 × 10+1 |
| | CR | | 5.33 × 10⁻³ | | | | |
Table 14.
Exposure factor parameters for health risk assessment calculation.
Table 14.
Exposure factor parameters for health risk assessment calculation.
| | | Value for Age Categories |
|---|
| Parameter | Definition | Infant
(0–1 year) | Child
(2–5 years) | Child
(6–12 years) | Adult
(19–75 years) |
|---|
| C | Mean Concentration of NO2, SO2, CO, PM10 and PM2.5 (μg/m3) | | | | |
| EF | Exposure frequency (days/year) | 350 | 350 | 350 | 350 |
| ED | Exposure duration (years) | 1 | 6 | 12 | 30 |
| AT noncarc | Averaging time (days) AT = ED × 365 days | 365 | 2190 | 4380 | 10,950 |
| AT carc | Averaging time AT = 70 × 365 days | 25,550 | 25,550 | 25,550 | 25,550 |
| BW | Body weight (kg) | 11.3 | 22.6 | 45.3 | 71.8 |
| InhR | Inhalation rate (m3/day) | 9.2 | 16.74 | 21.02 | 21.4 |


 ,
, 


