3.1. Model Structuring
Sustainability is a very broad concept, and, when related to transport, it is usually expressed in three dimensions: environmental, economic, and social. Such dimensions cannot be evaluated separately, as they are interdependent. Sustainability ideas and concepts need to have operational forms in order to influence and take place on the regulation of transport systems, and indicators are often evoked as important elements in this regard [
45]. Indicators are important resources for goal setting, performance assessment, monitoring, management, and decision-making [
46].
Sdoukopoulos et al. [
47] carried out a study where sustainable transport indicators have the environmental pillar as the most important in relation to society, especially when compared to the economy, followed by mobility, accessibility, and safety. Quantifying the sustainability of urban transport is important, as evidenced by a growing number of studies to measure sustainability in transport [
42]. However, the assessment of sustainability is associated with three challenges: environmental, mobility, and efficiency, and it is practically impossible to dissociate them [
48].
One of the problems when measuring sustainability with indicators is the fact that, in general, they only reflect elements from one of the sustainability dimensions, whether economic, social, or environmental [
48]. Thus, the indicators found in the literature are not the best metrics to carry out an integrated analysis between transport and urban logistics, because they measure sustainability dimensions singly. Hence, this work proposes a hierarchical model that works with initiatives and public policies for the sustainable and integrated development of urban transport and logistics as indicators.
3.1.1. Definition of Actions and Initiatives of Urban Transport and Logistics
The initiatives used in the model, selected through the literature review, are described by policy category in
Table 1,
Table 2 and
Table 3, as well as the measures to be taken to implement each of the initiatives.
Table 1 presents the initiatives to encourage the use of public transport, involving actions to improve infrastructure, tax incentives, physical accessibility, and new incentives for urban public transport. The initiatives related to the encouragement of active modes of transport are presented with a focus, mainly, on the displacement of pedestrians and cyclists, with emphasis also on public safety as an incentive to these modes of transport.
Table 2 portrays the actions of policies for land use restriction and Sharing in Logistics and Transport. The creation of environmental zones with restrictions on the flow of both freight and passenger vehicles, according to their size, fuel, and occupation, stands out. Restrictions also include actions to charge parking and create exclusive spaces for loading and unloading goods. The sharing initiatives in logistics and transport have new proposals for last-mile delivery services, such as Crowdshipping, collection and delivery stations, and clean vehicles, also including actions to reduce the circulation of freight vehicles in urban centers, through distribution centers, transport of goods in UPT, and underground logistics.
The initiatives for clean transport and environmental education are shown in
Table 3. The analysis of the articles listed in the literature review suggests the need to raise awareness among the population about transport and sustainable development, in order to incorporate new technologies correctly and widely in daily urban transport.
Breaking habits is the most critical point in sustainable development; therefore, including environmental education for children is fundamental for long-term success.
Table 3 also shows the initiatives for direct and open communication between the government, the population, and the private sector, as well as the promotion of clean fuels through tax incentives in addition to adequate infrastructure and preventive road maintenance.
Once the indicators were selected, the Hierarchical Structure of the policies and initiatives was elaborated following the AHP approach. So, the Hierarchical Structure of the policies and initiatives was elaborated. All interviews had to be carried out remotely, so an AHP Application System was developed for the online assessment of transport experts at the hierarchical structure built, in order to facilitate the comparison of initiatives. The system consists of the Construction of Pairwise Comparison Matrices for each group of public policies and their respective initiatives. After the judgment of each matrix, the system performs its Consistency Check, automatically calculating the consistency index. With the confirmation of judgment consistency, a new matrix is made available for evaluation, and so on, successively, until the last matrix of the hierarchical structure. The next step is to define the Degree of Importance of each initiative and policy, which generates the weighting of the indicators.
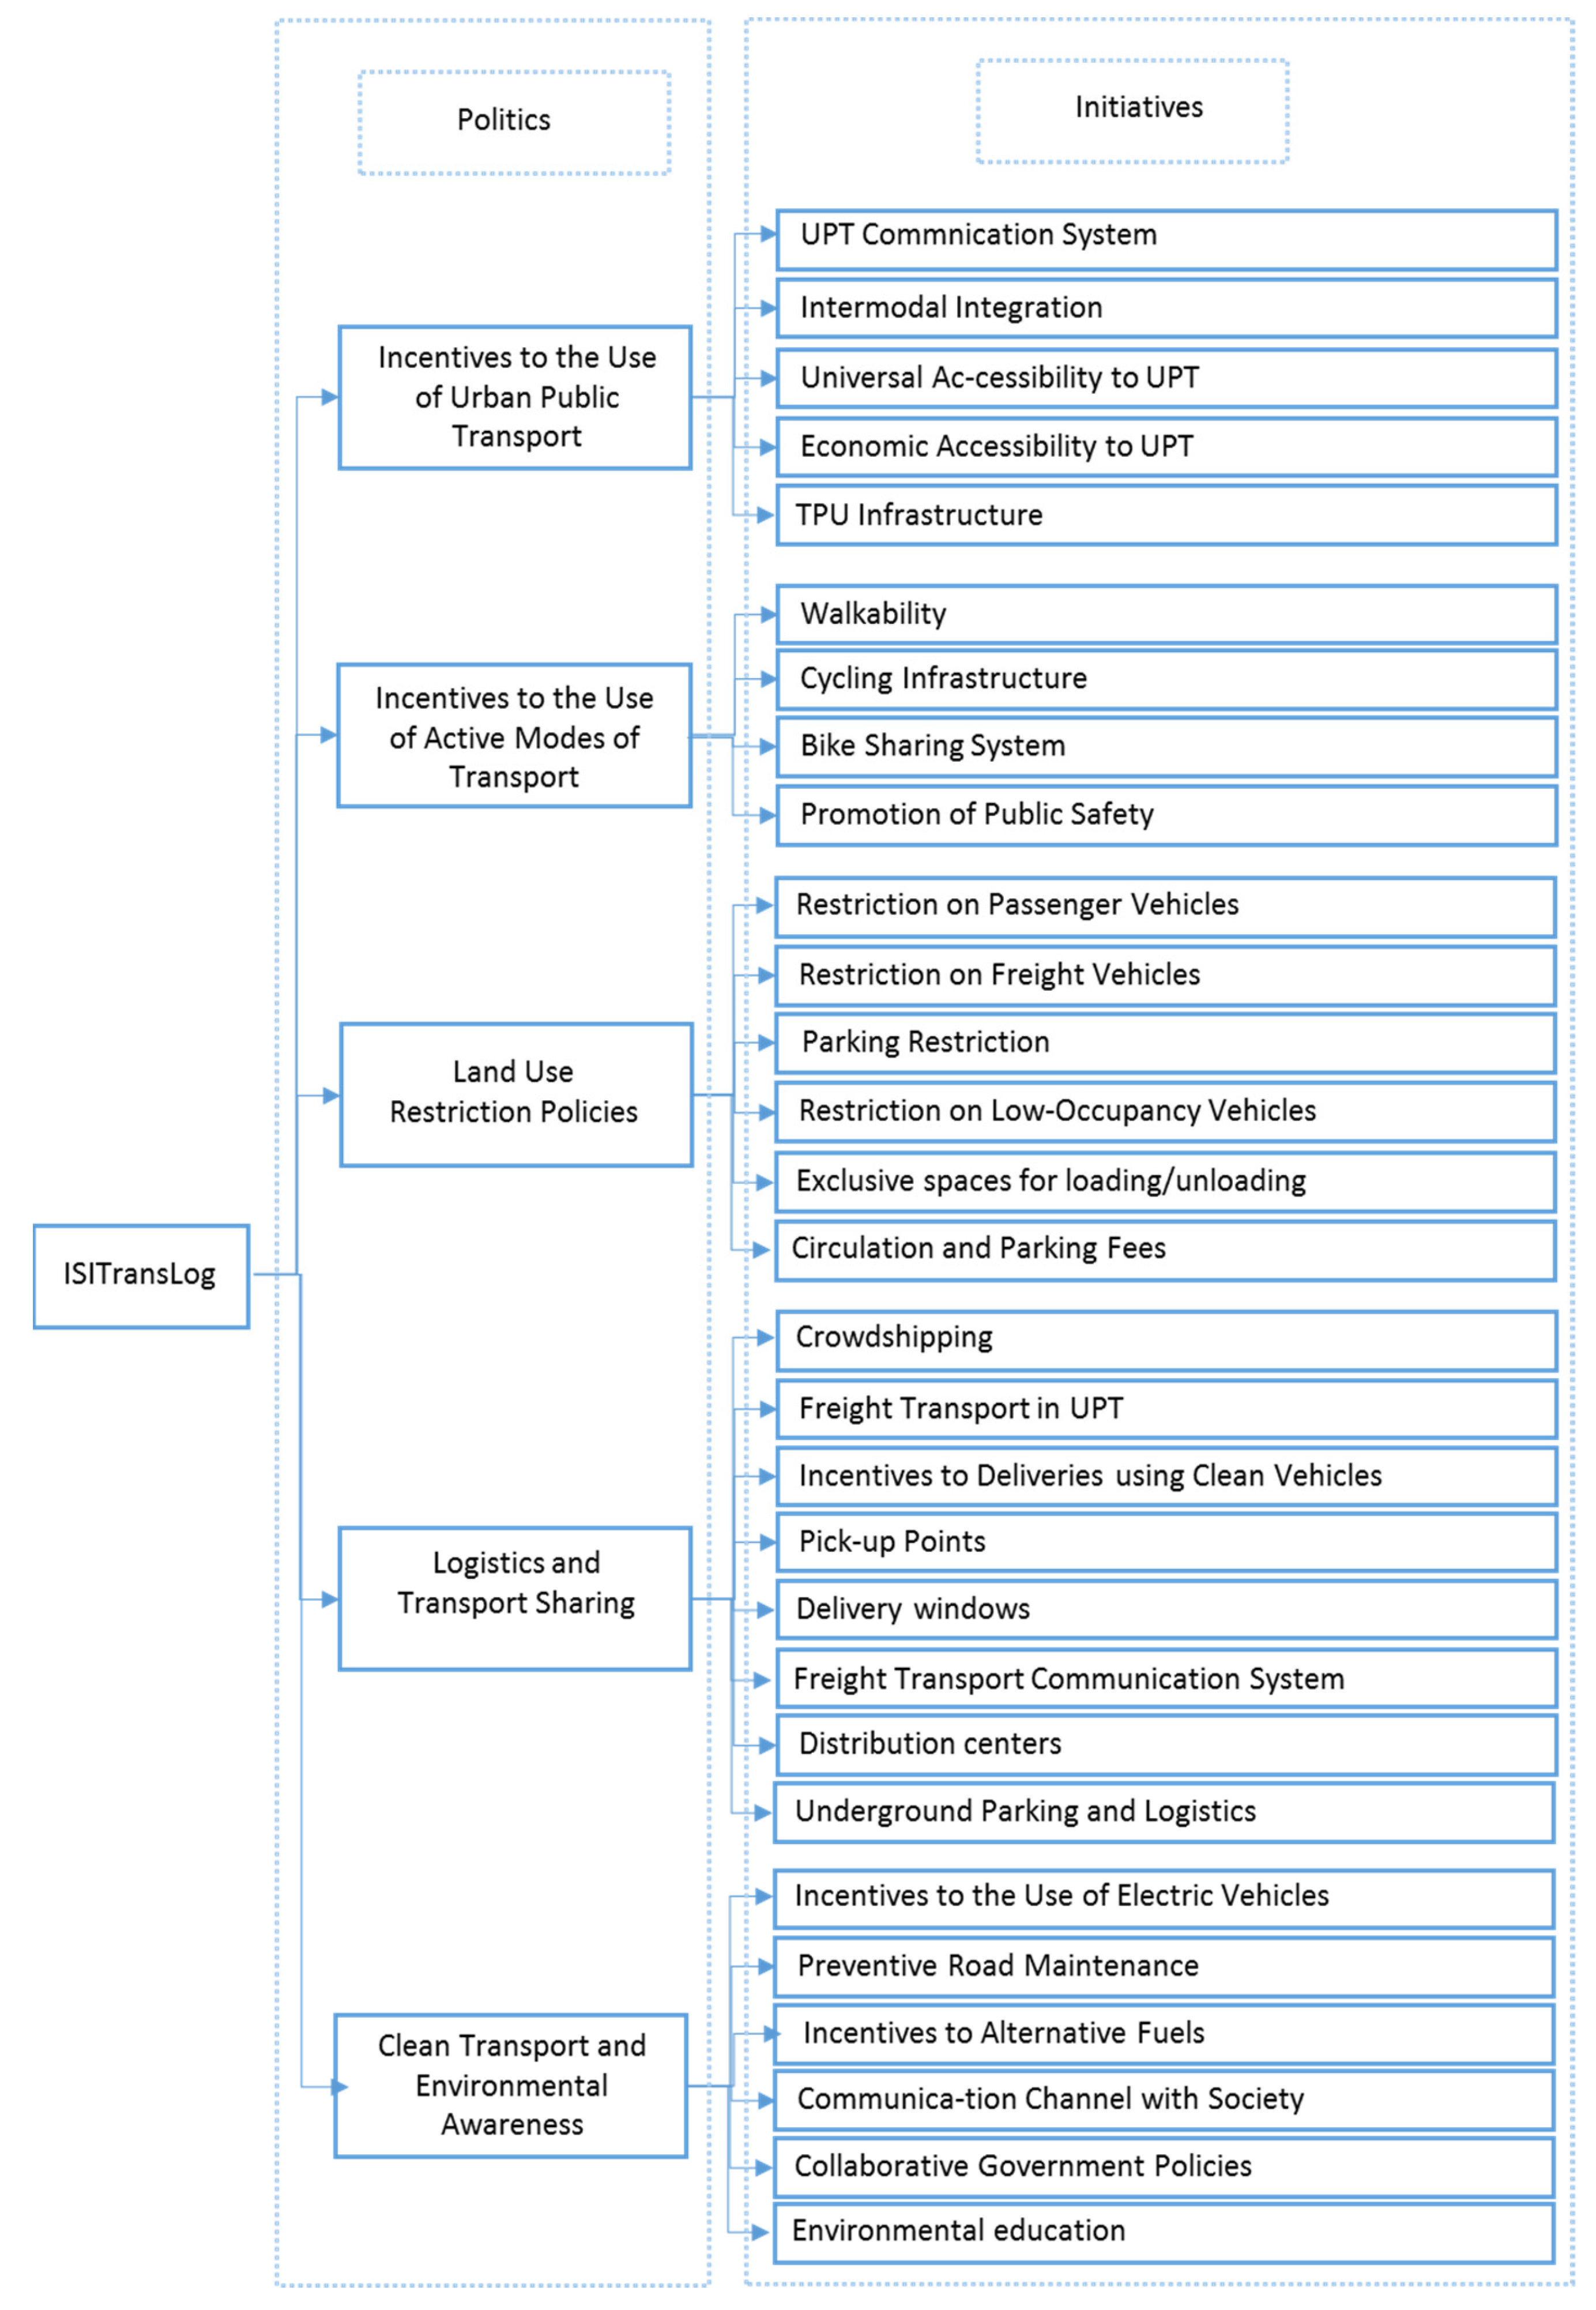
The result of the hierarchical structuring of the indicators is shown in
Figure 2, through the Index of Sustainability and Integration of Transport and Urban Logistics (ISITransLog). Public policies were classified as: encouraging the use of the UPT; Encouraging the use of active modes of transport; restriction of land use; sharing of transport and logistics and; and clean transport and environmental awareness. These policies were then divided into initiatives, as detailed in
Table 1,
Table 2 and
Table 3.
3.1.2. Online System for Applying AHP Matrices
The system developed to apply the online AHP method was based on the PHP (Hypertext Preprocessor) programming language in association with the MySQL (Structured Query Language) database so that the evaluators could compare the initiatives in pairs regarding their importance. The system has a home screen where instructions are given the opportunity to register the email or login into the system. Once logged into the system, the evaluator is presented to the hierarchy of the model to be evaluated and also receives a link for the evaluation of each matrix of the model. As the evaluator’s e-mail is registered to each evaluated matrix, this process can be carried out as many times as he deems necessary, choosing the order in which the matrices will be evaluated. A total of 14 specialists, with training and experience in the areas of logistics and transport, participated in the evaluation of the AHP hierarchical model, filling up all matrices.
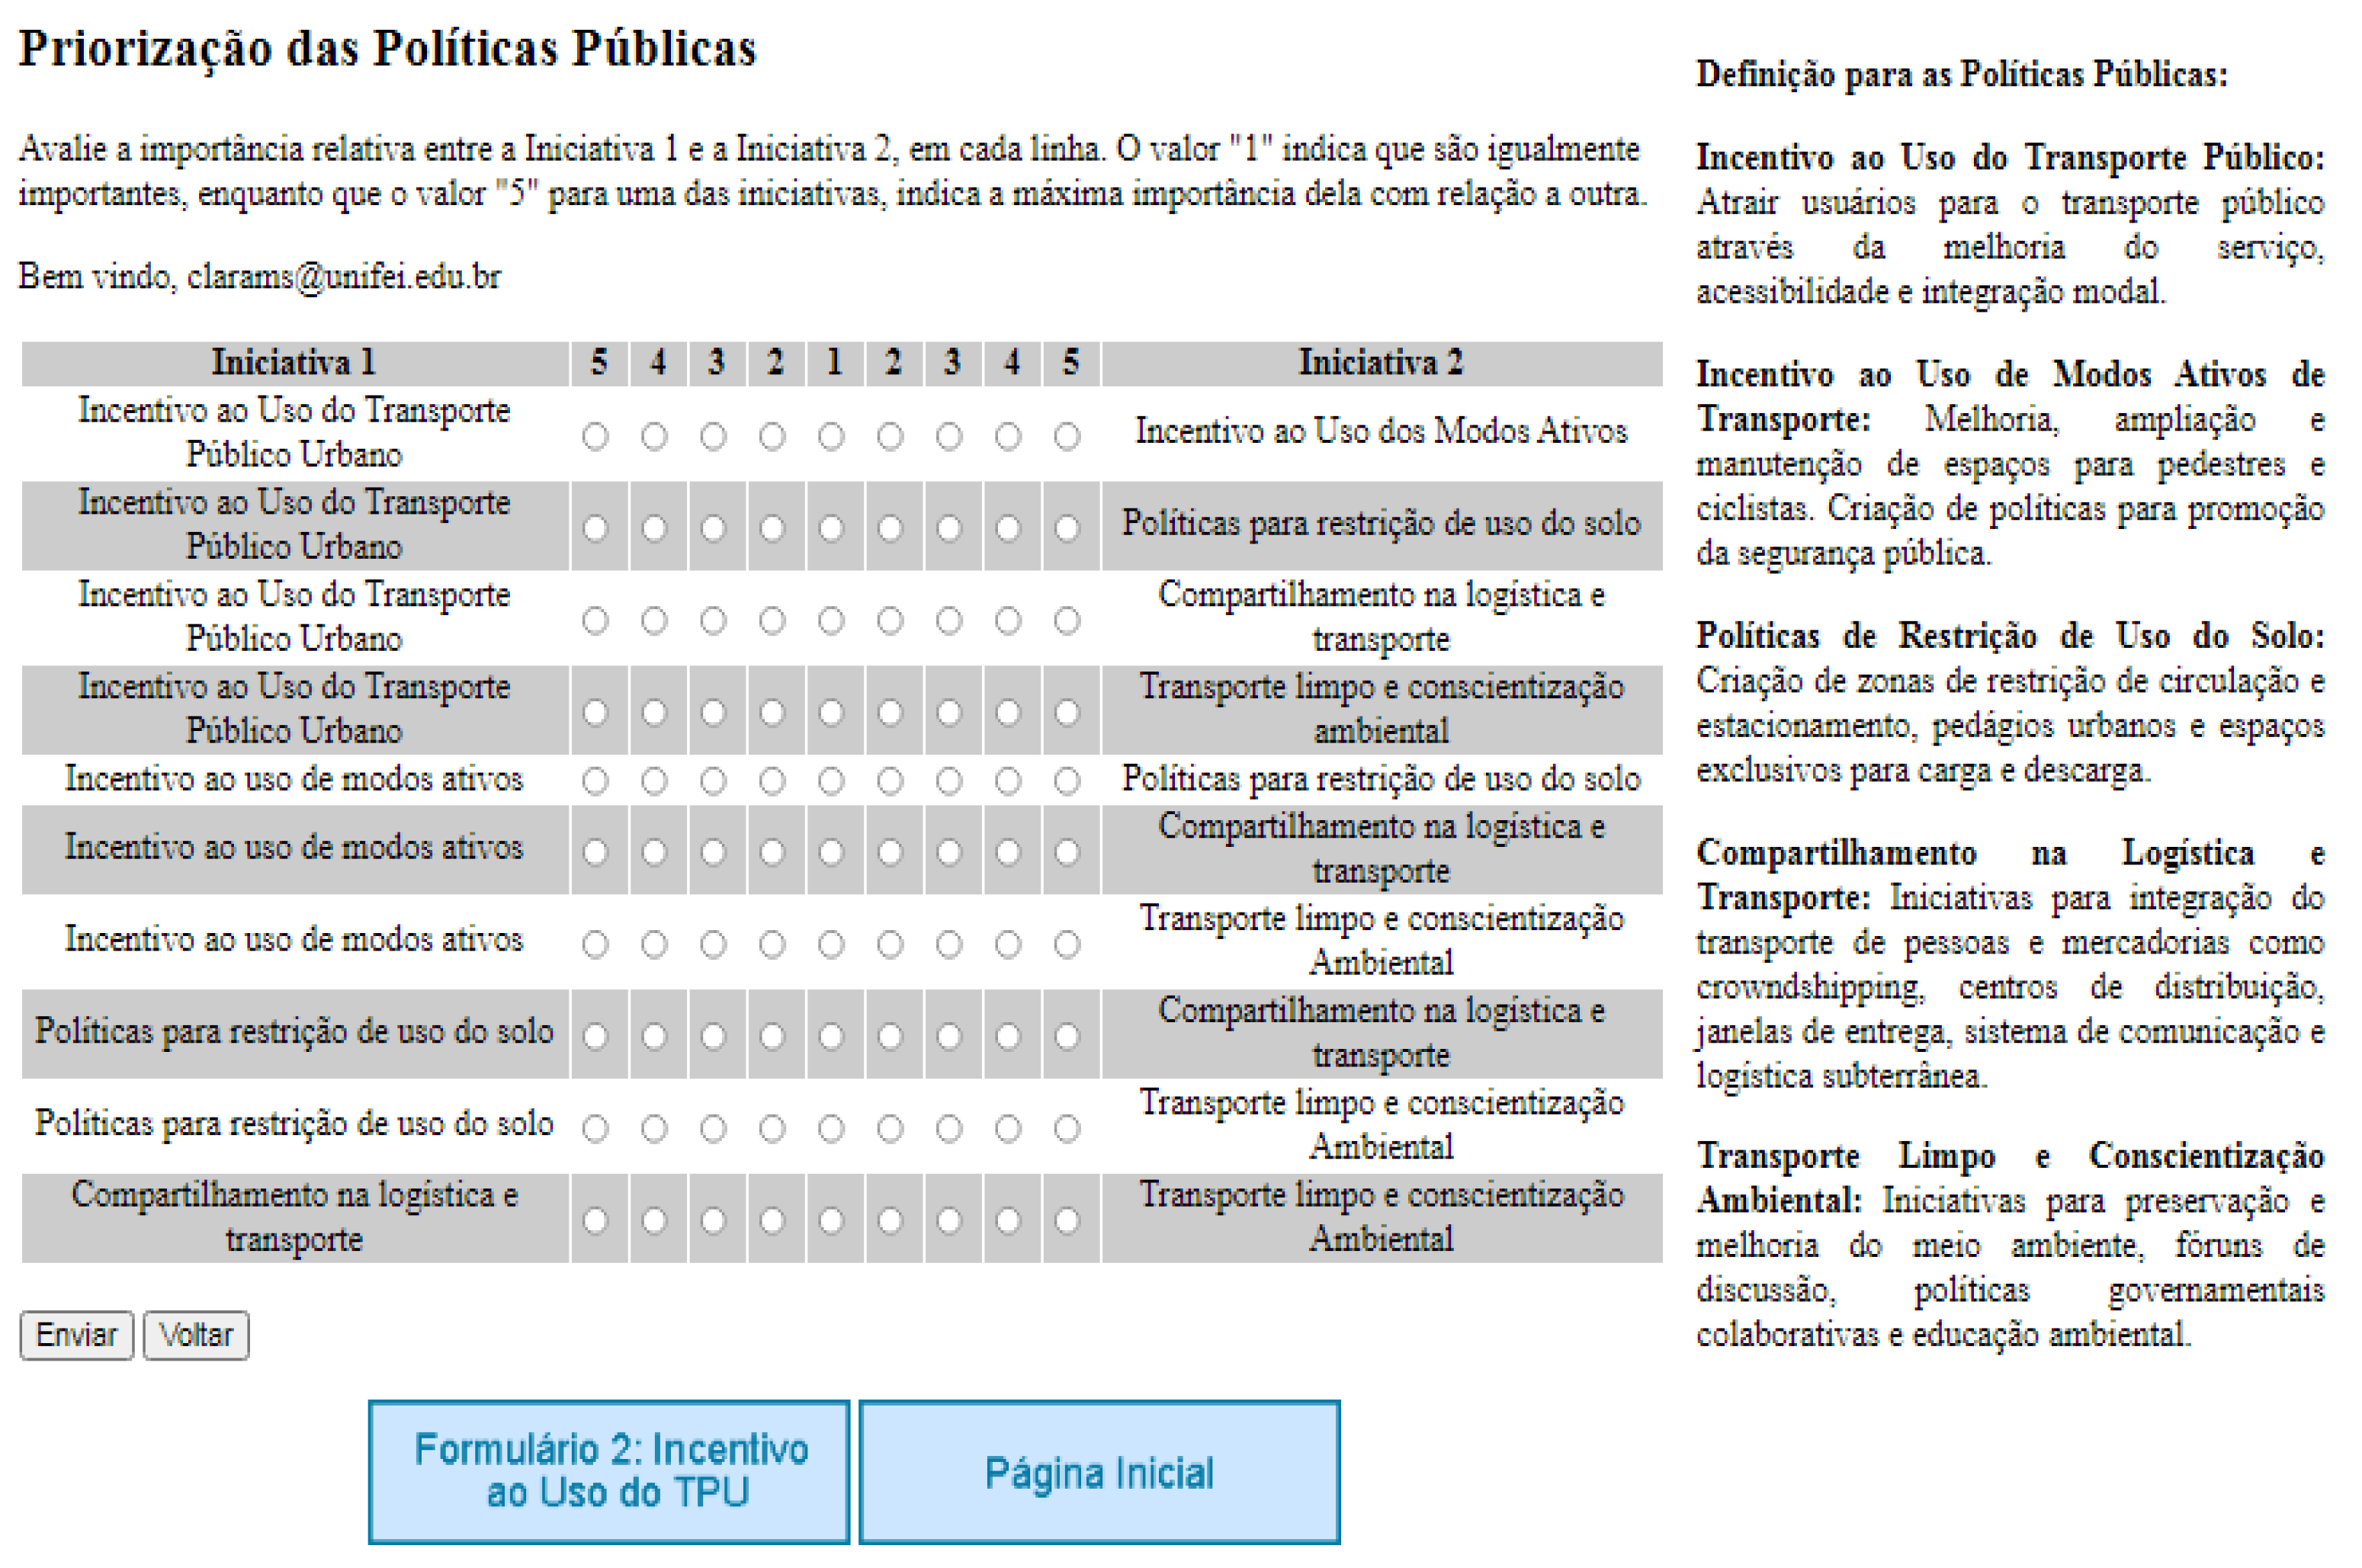
One of the model’s evaluation screens is shown in
Figure 3. In the presented case, the evaluation of the group of public policies is carried out, in the second level of the hierarchy. In order to guide the assessment, there is a column on the right containing the definition of each item assessed on the current screen. The comparison of policies is made line by line, on a scale that follows the values proposed by Saaty and Vargas [
49], but which is expressed by values between 1 (equally important) and 5 (extremely more important), to facilitate the evaluator’s visualization.
When completing all the lines of the assessment, the expert must click on the Submit button. At this moment, the system calculates the consistency of the evaluated matrix and, in a notification window, exhibits the outcome: “consistent judgments”, when the index is less than 0.1; or “review your judgments”, along with the inconsistent evaluation matrix, otherwise.
3.1.3. Results of the Experts’ Judgments
The evaluation of the initiatives regarding Incentives to the use of urban public transport and Sharing in logistics and transport obtained 92.85% of consistent results. The Incentive to Active Modes of Transport, Land Use Restrictions, and Clean Transport and Environmental Awareness matrices obtained a consistent response rate of 86.71%. The worst result was for the Public Policies evaluation matrix, with 78.57% of consistent answers.
There was a latent concern about the results of these assessments, especially of the Sharing in logistics and transport matrix, as it is a set of 8 initiatives, making it more complex to assess. However, its high consistency rate reveals that the mode of presentation developed in the previously mentioned system helped the evaluators to see the importance of these initiatives more clearly. The way the initiative comparisons were presented was based on the paid software Expert Choice. Overall, the quality of the responses obtained ensures a good weighting of the initiatives because reaching a satisfactory level of consistency is seen as a desirable property for the model. The more consistent the decision-maker’s preferences are, the more likely he is to be a reliable expert, to have deep insights into the problem, and to carefully and meticulously act on the problem he is facing [
50].
Table 4 presents the final result of the weighting of public initiatives and policies evaluated by the specialists. Among the Public Policy groups, encouraging the use of the UPT reached 31% of the total relevance, following the trend highlighted in the literature review articles, for encouraging the use of public transport is a strategy that promotes sustainable consumption practices [
51]. User behavior is the most significant parameter in encouraging the use of the UPT due to the lack of a reliable public transport network and its comfort level. Therefore, there is a clear need to develop transport policies that encourage people to use the public transport system [
2].
Among the initiatives corresponding to the highest importance factors are Economic Accessibility in the UPT (9.4%), Universal Accessibility to the UPT (9%), and Promotion of public safety (8.6%), which corroborates the study of Sdoukopoulos [
47], where mobility, accessibility, and safety are identified as the most significant topics included in a wide range of initiatives. From an economic point of view, accessibility is considered an important competitiveness factor that can explain a higher economic growth [
52]. Likewise, the introduction of accessibility metrics in public transport planning allows the development of new evidence and arguments for the redistribution of means of transport that can reduce the environmental and spatial pressure of urban road transport [
53,
54].
Of the better-ranked initiatives, the first two are part of the Incentive policies to the use of the UPT group, and the third one is part of the Incentives to the use of active modes of transport group, which is the second most important group according to the assessment of experts. Hiking and cycling are being promoted as sustainable alternatives to motor vehicles. The increase in the use of these sustainable means of transport reduces the number of vehicles flowing in the city, thus reducing traffic congestion, pollutant emissions, and health problems associated with such emissions [
55]. Active modes of transport work more efficiently when there is a strong collaboration across all modes. Thus, providing convenient connections and access to the physical infrastructure of active modes plays a crucial role in encouraging the use of an efficient sustainable transport system [
56].
According to the evaluators, the group of policies that least impacts sustainability in urban centers is restrictions on land use (10.8%). In addition, this group contains the initiative evaluated with the lowest score: circulation and parking rates, whose importance factor is 1.1%. This assessment is justified by the indirect relationship of land use restriction initiatives with sustainable transport, for they are actions implemented as a way to discourage the use of private vehicles and the flow of freight vehicles in urban centers. Hence, methods for discouraging the use of private vehicles can be implemented, such as: restricting parking spaces and increasing driving costs through increasing the prices of fuel, car registration fees, and driving licenses, for example [
57].
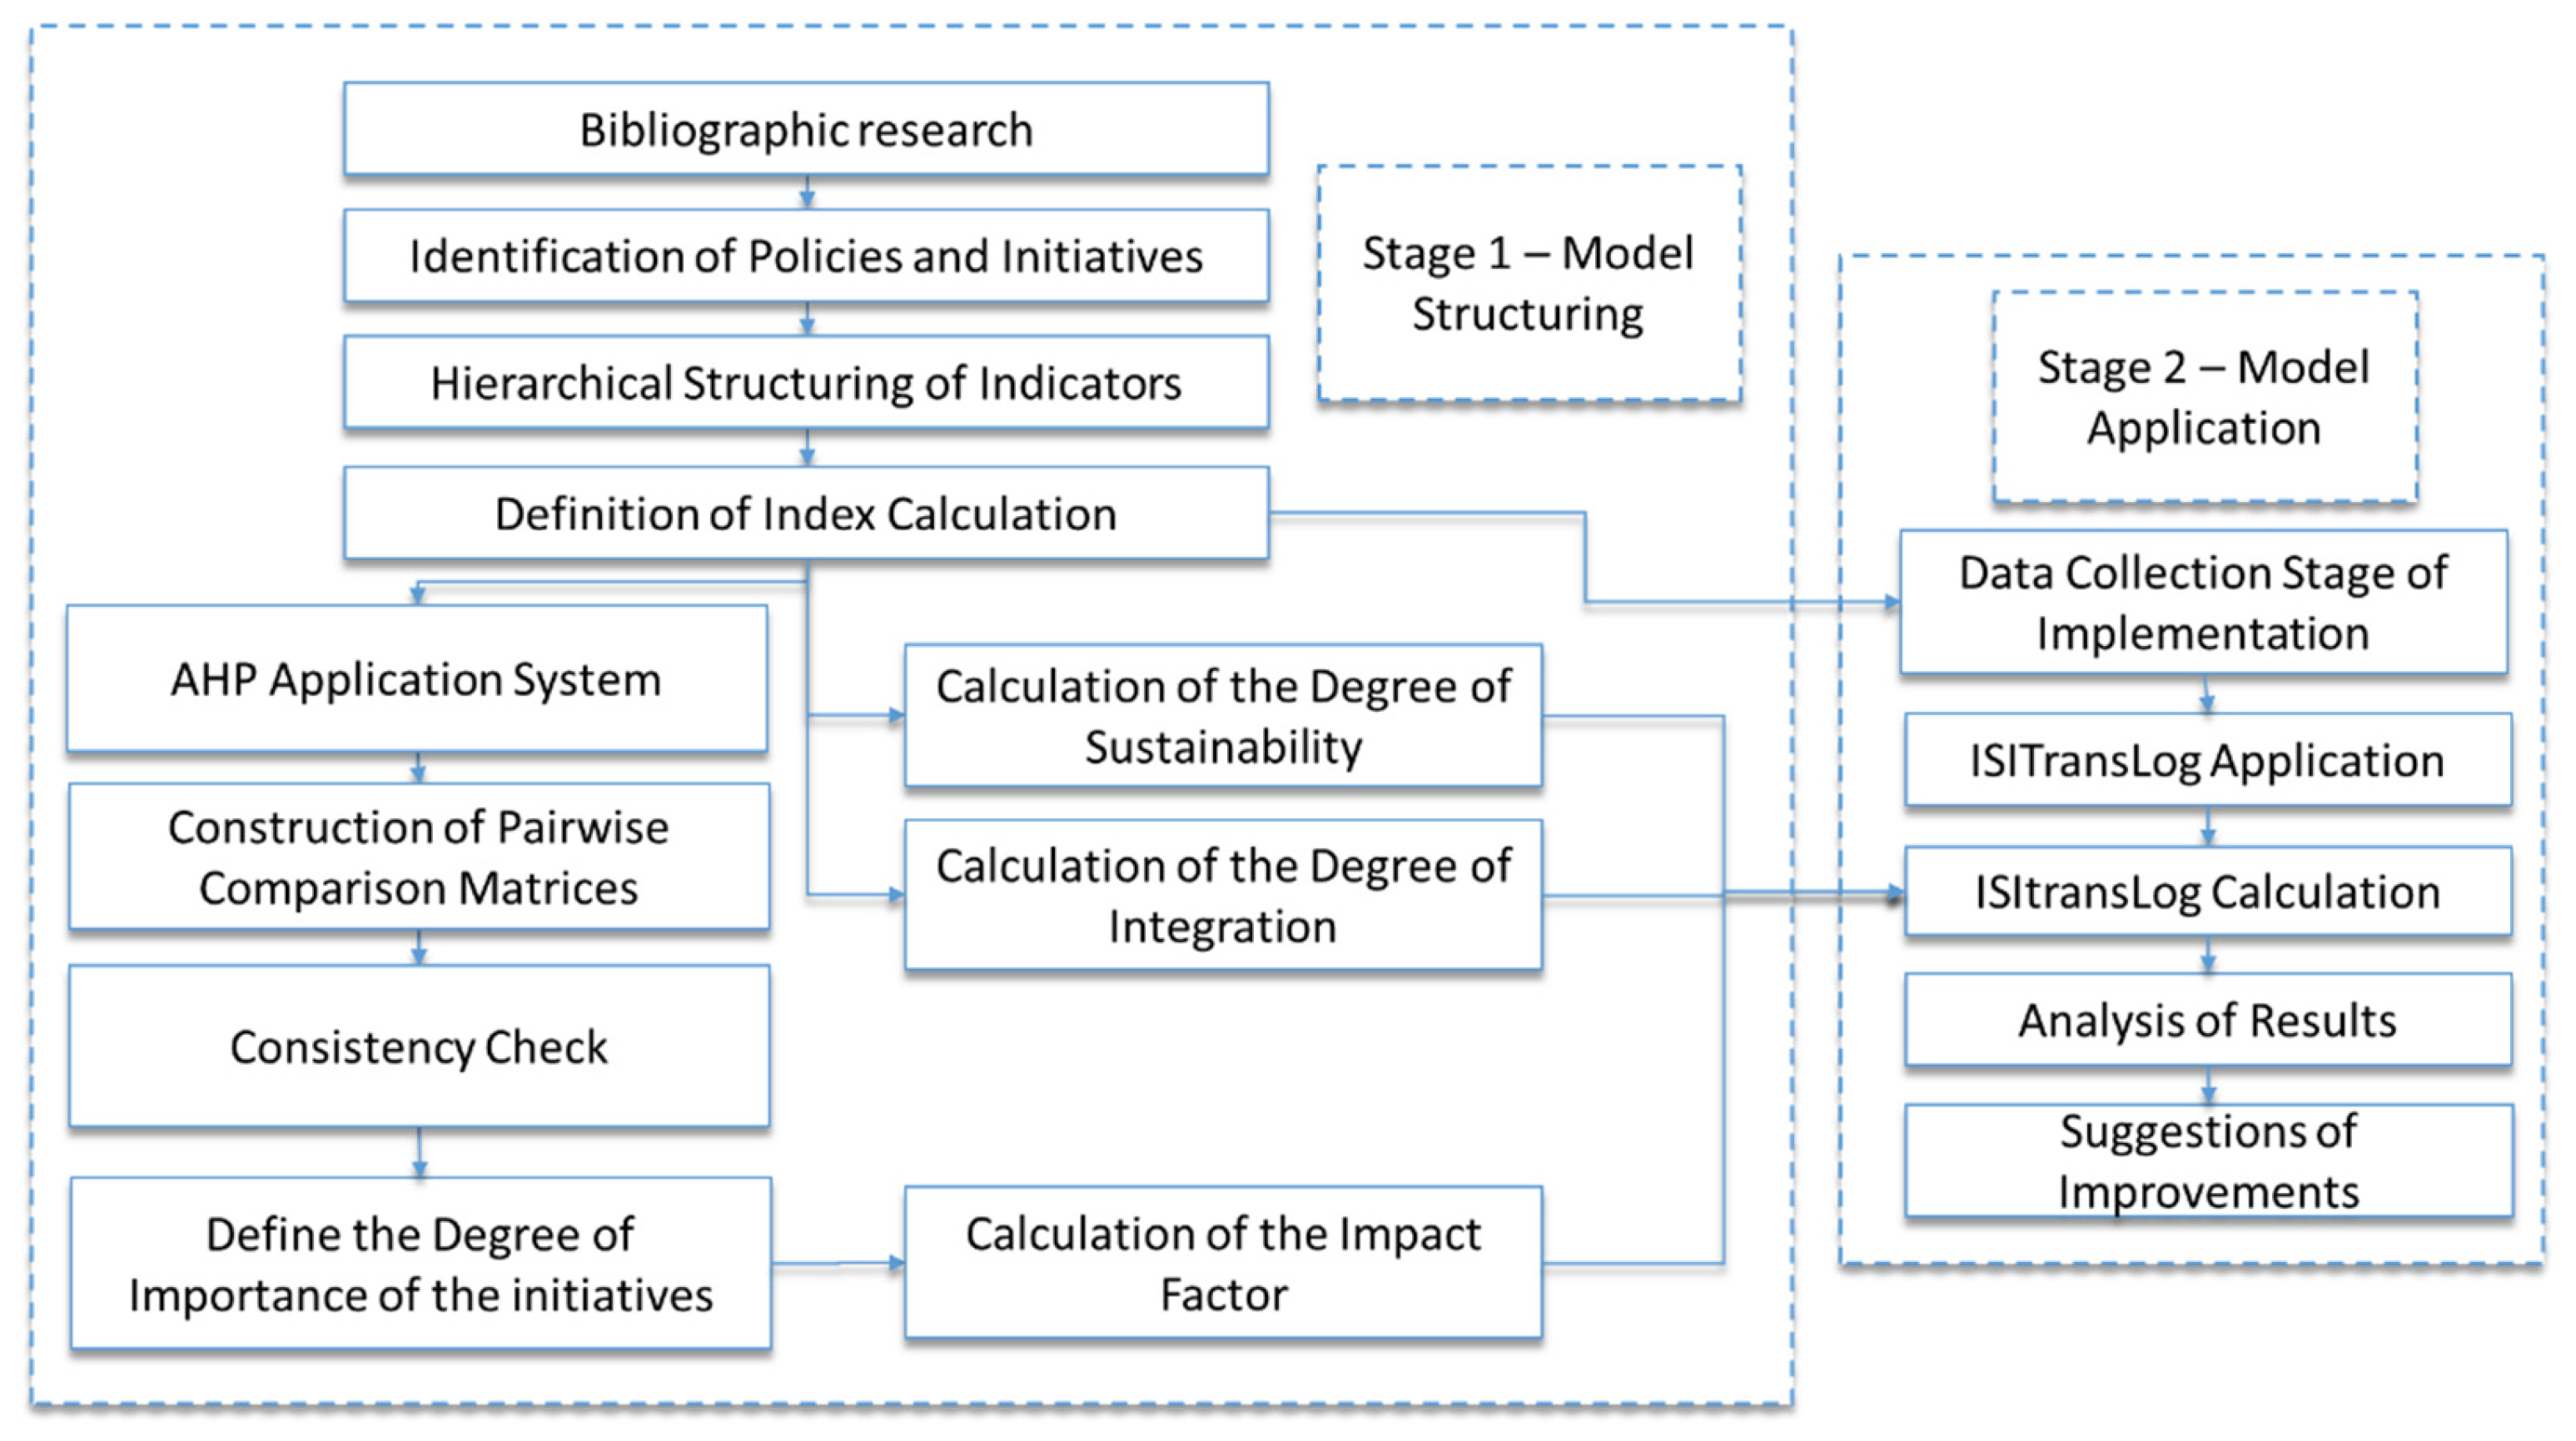
In addition, in
Figure 1, for the Definition of the Index Calculation, the results of the aforementioned Degree of Importance of the Initiatives are used, as well as the Calculation of the Degree of Sustainability and the Calculation of the Degree of Integration of each initiative, completing Step 1 of the study.
3.1.4. Calculation of the Sustainability and Integration in Transportation and Logistics Urban Index (ISITransLog)
To calculate the ISITransLog, firstly, each initiative must be categorized as to its Stage of Implementation. Implementation stages can be classified into non-existent, project, planning, implementation, or running, each with a predefined score. The second stage of the evaluation is given by the Impact Factor of the initiative, by the Degree of Importance of the initiatives, as explained above. The third partial assessment of the index refers to the Degree of Sustainability, which is calculated based on the percentage of the sustainability objectives directly achieved by the initiative. The objectives were collected during the literature review and were evaluated by experts in the same weighting system as the initiatives, at a later stage of the process, where twelve responses were obtained. The objectives and their description are detailed in
Table 5.
Finally, the integration degree of the initiatives evaluates the overlap between freight and passenger systems, both in their infrastructure and in their policies. In regard to its degree of integration, an initiative can be classified into exclusive, priority, mixed, or total. The categorization of initiatives as to their results is detailed in
Table 6. Such partial results are then linearly combined, generating the score for each initiative.
After obtaining all the partial weights of the initiatives, that is, the Impact Factor, Degree of Sustainability and Degree of Integration scores, in the model structuring phase, the final index for the city is given by the sum of the score of each model initiative. Unlike the rest of partial weights, the Stage of Implementation is not calculated. The Stage of Implementation of each initiative is given by data collection in the city where the index will be applied. Equation (1) presents the calculation of an initiative’s score Ini, where S is the value obtained from the Stage of Implementation of the initiative, If is the Impact Factor, Ds is the Degree of Sustainability, and Di is the Degree of Integration. Equation (2) shows the final calculation of ISITransLog, given by the sum of the individual values of the initiatives.
The second stage of the research consists of the Application of the Model, wherein the first task to be performed is Data Collection. Originally, data would be collected from both direct (City Hall, Administrative Offices, traffic and transport management bodies, etc.) and indirect sources (official websites of the City Hall and Administrative Offices, data and studies published by educational and research institutions, etc.). However, due to the COVID-19 pandemic, some adjustments were needed to obtain the data for the ISITransLog calculation. Thus, interviews and visits to institutions were canceled, and all information was obtained through the official city hall’s digital communication channels. Then, the collected data are used in the ISITransLog Application, that is, for the calculation of each initiative’s results. With the partial results in hand, the ISITransLog is calculated for the selected city, so that the Analysis of Results can be performed. According to the results obtained, some suggestions of Improvements are made for the city to execute.
3.2. Model Application in São Paulo-SP, Brazil
ISITransLog was structured so that it contains the most widespread world initiatives, according to the literature, emphasizing the sustainability of transport systems. Thus, when inserted into the Brazilian reality, it was found that only large cities (with populations larger than 500 thousand) would have access to information on mobility studies and actions carried out with emphasis on sustainability. Therefore, the efficiency of the index is greater for large cities, even though they correspond to only 8.5% of Brazilian municipalities [
58].
São Paulo was selected for being the largest Brazilian city, with 12.2 million inhabitants and a demographic density of 8054.7 inhabitants/km
2 [
58], besides having a good range of online information available.
Trips by motorized modes amount to 28.280 million daily trips in the city, compared to 13.727 million daily trips by non-motorized modes. The latter is subdivided into 13,350 million trips on foot and 377 thousand trips by bicycle [
59]. The time interval between changes in traffic lights in the city of São Paulo is not enough for 97.8% of the elderly to cross the street [
60]. Of the admissions at the IOT-HCFMUSP (Institute of Orthopedics and Traumatology, Hospital das Clínicas, University of São Paulo), one out of five admissions due to falls took place on sidewalks. The social costs generated by falls on sidewalks in São Paulo reach R
$2.9 billion a year, while the renovation of all sidewalks in the city would cost R
$7 billion [
60]. These data indicate the need for improvements in transport and logistics in the city as a whole. This scenario suggests that São Paulo is a suitable object of study for the application of ISITransLog.
Table 7 shows the application of ISITransLog to São Paulo, based on public initiatives and policies in force in 2010 and 2020. The final result of ISITransLog for the application in 2010 was 17.718, which corresponds to 56% of the higher score. Twenty-nine initiatives were evaluated, among which 10 were non-existent at the time of the reference year, 6 were in the design phase, 3 were being implemented, and 10 were under execution. None of them were at the planning stage. Among the initiatives that were already underway in 2010, it is worth highlighting the Multimodal Integration and Economic Accessibility in the UPT, part of the Incentives to the use of the UPT group, whose first projects were conceived in the 1970s and have had their population reach increased since then.
In the group of public policies for the Incentive to active modes of transport, only the Walkability initiative was underway in 2010, which began with the refurbishment of the sidewalks on Avenida Paulista in 2007, with the implementation of a concrete pavement molded with brass expansion joints in situ [
61].
The application of ISITransLog to São Paulo in 2020 reveals a notable improvement in the initiatives underway for the sustainability and integration of transport and urban logistics in the period. As shown in
Table 7, only two initiatives still receive the value of non-existent in their implementation stage: Crowdshipping and freight in UPT. As a consequence, São Paulo reached a total of 89% of the maximum score for ISITransLog in 2020.
All initiatives from the Incentives to the Use of UPT group were running in 2020. To leverage communication systems in UPT initiatives, São Paulo presented, in 2019, 15 electric buses that will be available at the “6030/10 Unisa-Campus1/Terminal Santo Amaro” line. The vehicles will already be equipped with NFC (Near Field Communication) technology, allowing fare payment by debit or credit cards, through digital payment platforms on smartphones or smartwatches [
62]. To increase multimodal integration, in 2018, the city hall regulated the sharing of bicycles in the city, opening the possibility for companies to act as shared bicycle operators upon registration at the Municipal Committee for Road Use (CMUV) [
63]. In addition, they created 26,300 spaces in 40 parking lots adjacent to the rail system to encourage the integration of the individual and the collective transport [
64].
As established in the National Urban Mobility Policy (PNMU), the prioritization of active modes (non-motorized) and public transport was considered the guiding principle of PlanMob/SP 2015 in São Paulo [
65]. Encouraging the use of active and collective modes of transport to the detriment of individual motorized transport must involve the adoption of policies that make this transformation feasible. This finding is in line with the most relevant initiative in the sustainability of transport and urban logistics according to ISITransLog: Walkability. This initiative is related not only to the encouragement of active modes of transport but also to the safety of pedestrians and the incentive to daily use of intermodal passenger means of transport since better conditions for walking provide greater freedom in shifting modes of transport, either collective or individual. Sidewalks play a fundamental role in making cities places for social interaction, creative development, and economic growth.
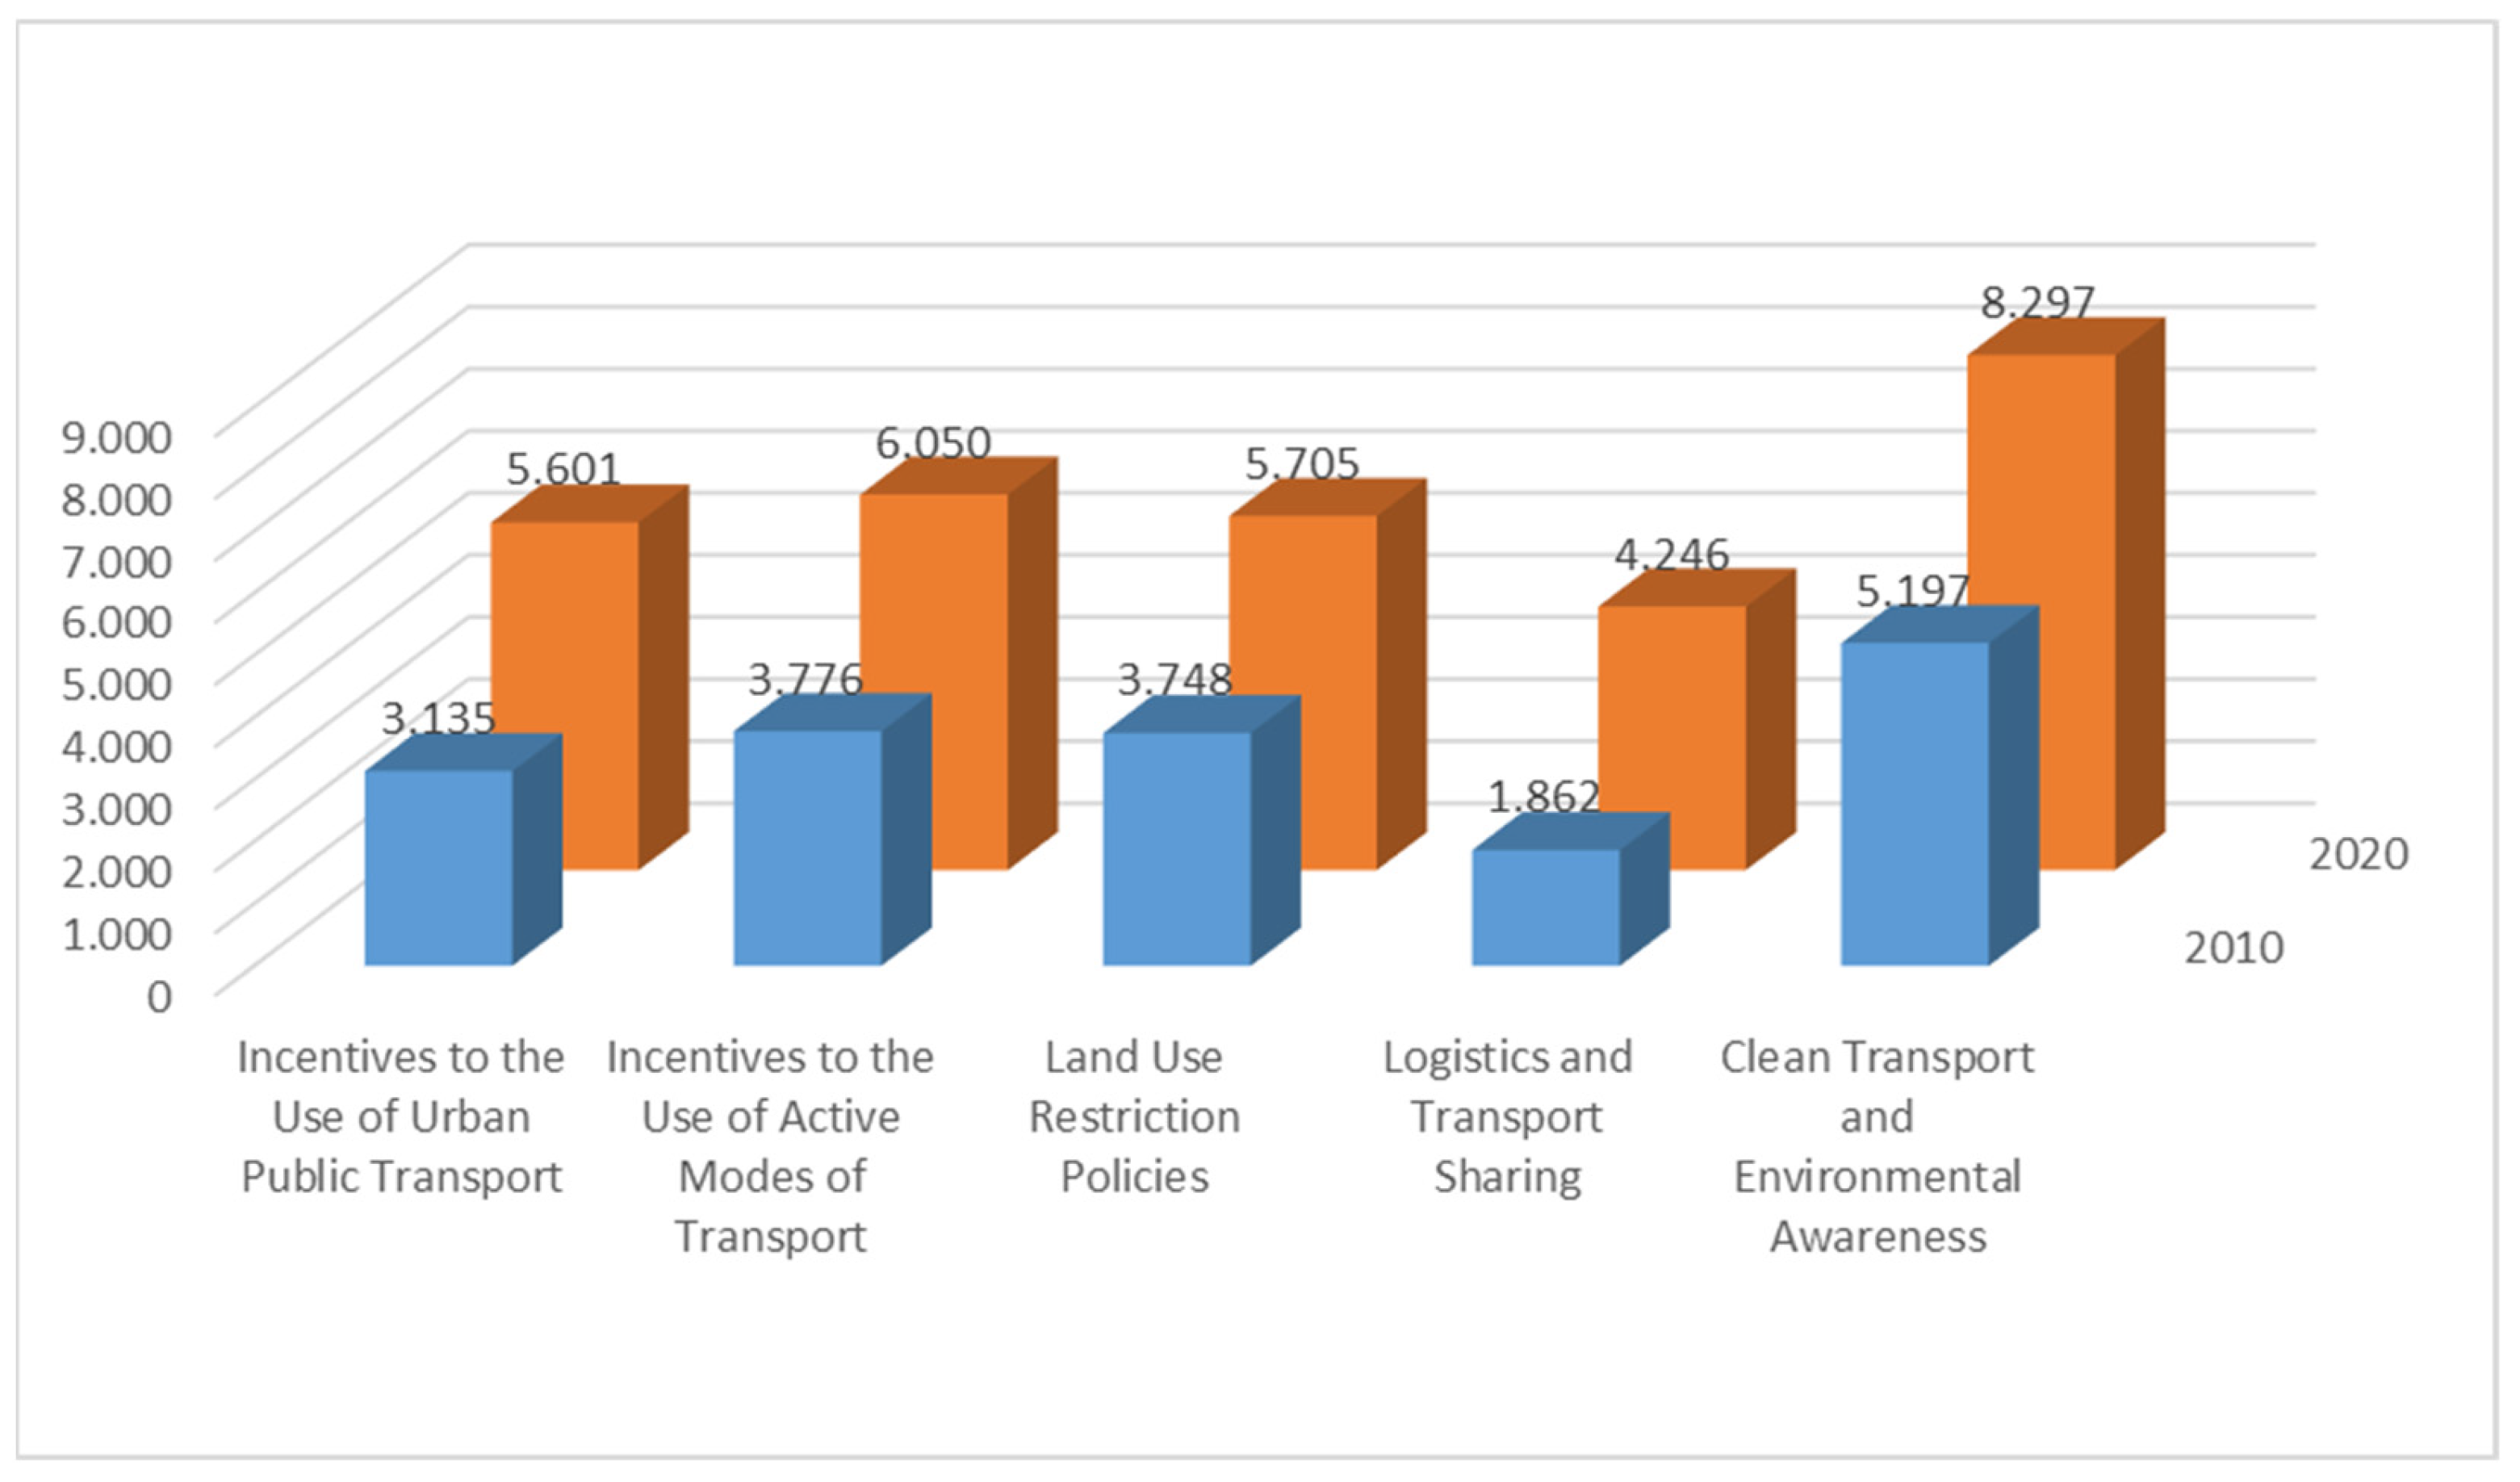
Figure 4 is a bar chart that shows the comparison of São Paulo’s performance in terms of ISITransLog for each group of public policies from the model, in 2010 (blue) and 2020 (orange). All groups had their performance improved in 2020 when compared to 2010; however, the biggest difference in performance was for Clean Transport and Environmental Awareness policies. This difference is due to the fact that, in 2010, only the preventive road maintenance and environmental education initiatives were running, while the entire policy group was running in 2020.
Among the Incentives to the use of UBT policies, the Initiatives to Infrastructure for UBT group got the second-highest increase in the ISITransLog score from 2010 to 2020; it stands out because, although already in execution in 2010, it had only improved its effectiveness by 2020, with the completion of new bus lanes. The bus lane system (dedicated road with specific infrastructure and signaling) was expanded to 132 km. Besides the implementation of a system consisting of exclusive lanes which extend for 500 km, composed were a set of operational measures that reserve one or more lanes of the general traffic lane for the exclusive flow of buses or taxis, at specific times of the day [
66]. On average, a moving vehicle occupies 40 m
2; add it to the fact that São Paulo has a fleet of 4.5 million cars. Therefore, if all of them were flowing, they would occupy 180 km
2 of urban space. The implementation of exclusive lanes for buses increases their average speed by 45.1% (21 km/h) compared to 20 km/h for bicycles and 14.1 km/h for cars [
67].
Still, regarding the Incentives to use the UPT, the investment in Multimodal Integration reveals significant growth in the use of the subway (53%), metropolitan train (73%), school transport (58%), and motorcycle (48%), in the period from 2007 to 2017. The use of taxis is noteworthy, despite being responsible for only 1.1% of daily trips in the RMSP (large metropolitan area located in the São Paulo state in Brazil) in 2007, because it increased by 397% in the last decade due to the new form of requesting the service, through applications whose regularization took place in 2014. Buses had an increase in their use of 4% in 2017; however, their part in the total number of trips slightly decreased from 27% to 25% along the same period [
68].
Logistics and Transport Sharing policies had the third-highest increase in the index’s performance. However, among the initiatives of this group, only the Delivery Window was running in 2010. This group of policies is the one that contains the most innovative initiatives, precisely because it mixes passenger and freight systems, which is not yet a reality in Brazil. Even in 2020, two of those initiatives, namely Crowdshipping and UPT freight transport, were not even listed for planning in São Paulo.
Despite ranking in the last, but for one, position among public policy groups, the incentives to active modes of transport had a great impact on the population of São Paulo, especially on the initiatives related to the use of bicycles. Between 2007 and 2017, bicycle trips increased by 24% [
66].


