Article

Nitrogen Fertilizer Driven Bacterial Community Structure in a Semi-Arid Region of Northeast China

1
Institute of Agricultural Environment and Resources Research, Jilin Academy of Agricultural Sciences, Changchun 130033, China
2
Key Laboratory of Soil Resource Sustainable Utilization for Jilin Province Commodity Grain Bases, College of Resource and Environmental Science, Jilin Agricultural University, Changchun 130118, China
*
Author to whom correspondence should be addressed.
These authors contributed equally to this work.
Sustainability 2021, 13(21), 11967; https://doi.org/10.3390/su132111967
Submission received: 13 September 2021 / Revised: 19 October 2021 / Accepted: 26 October 2021 / Published: 29 October 2021

Abstract

:
The soil nitrogen (N) cycle is an essential role of the biogeochemical cycle. Bacteria play an irreplaceable part in the soil N cycle, but the impact of different N gradients on bacterial communities remains unclear. The purpose of this research was to explore the bacterial abundance, community composition, and diversity under different N application rates in a water-limited area. We investigated the bacterial abundance, diversity, community composition, and structure under five different N gradients (0, 90, 150, 210, and 270 kg ha−1) using real-time quantitative PCR and high-throughput sequencing, and then explored bacterial functional groups with FAPROTAX. N application significantly affected bacterial abundance and community composition. Bacterial diversity was enhanced at low N application rates and reduced at higher N application rates. Principal coordinate analysis showed that bacterial community structure was separated into two groups between low N application rates and high N application rates; these differences in bacterial community structure may be driven by available nitrogen (AN). The results of FAPROTAX revealed that N application promoted the functions of Aerobic_nitrite_oxidation, Nitrate_reduction, and Aerobic_ammonia_oxidation, but inhibited the Nitrogen_fixation function of the bacterial community. The high N network caused the reduction of network structure stability. Our results revealed that N fertilizer driven bacterial community structure and soil nutrients were the main influential factors in the variation of bacterial community structure. We suggest that the optimal N application rate in this study may be approximately 150 kg ha−1, based on the variations of soil properties and bacterial community structure in semi-arid areas.

1. Introduction

Nitrogen (N) is an essential nutrient element for plant growth. The annual N input into agricultural systems accounts for about 25% of global N use, of which about 100 Tg of N fertilizer per year enters the N cycle in agricultural ecosystems [1,2]. Several studies have reported that increasing N absorption can increase maize yield, which has led to excessive N application in agricultural ecosystems [3]. The N rates applied by farmers in North China are much higher than the N absorption rates of crops. In some areas, the N application rates for farmers exceed 100% of N required by crops [4]. Vitousek et al. [5] confirmed that the N surplus of wheat–maize rotation systems in North China was as high as 227 kg ha−1. Similarly, Ju et al. [6] showed that decreasing the N application rates of wheat–maize rotation systems in North China from 588 kg ha−1 to 286 kg ha−1 had no remarkable influence on the crop yield. Tilman et al. [7] predicted that the global N application rates would reach 250 Mt year−1 by 2050, equivalent to an increase of 40% based on 178 Mt year−1 in 2010. China has the most considerable N application rates in the world, which account for 38% of N application rates globally [8]. In addition, superabundant chemical fertilizer application caused a variety of environmental concerns, for instance, greenhouse gas emissions, water eutrophication, and soil acidification [9,10,11].
Bacteria are important and diverse soil microbe that play an irreplaceable role in regulating soil ecosystem functions, such as nutrient cycles, organic matter decomposition, greenhouse gas production, and environmental pollutant purification, as well as the four main processes of the N cycle in agricultural ecosystems, namely, N fixation, nitrification, denitrification, and ammoniation [12,13]. The impact of fertilization on microbial community structure has been under recent debate. Bowles et al. [14] reported that organic fertilizers alter microbial community composition. Furthermore, Sun et al. [15] revealed that the addition of either pig or cow manure could maintain bacterial diversity to levels similar to those in the non-fertilized control. Finally, Chaudhry et al. [16] showed that the addition of livestock manures enhanced bacterial diversity. These studies focused on the effects of diverse fertilization regimes on microbial community structure in agricultural ecosystem. Conversely, the relatively large number of studies examining different N gradients have focused on the diversity and production of aboveground plants [17,18], whereas the available literature regarding the effects of N application on the belowground bacterial community structure and functional groups is limited.
In this study, we applied qPCR and high-throughput sequencing to examine bacterial abundance and community structure variation under different N gradients (N0, N90, N150, N210, and N270). We hypothesize that N fertilizer gradients drive bacterial community variation. The aims of this paper are (1) to investigate the bacterial abundance, community composition, and diversity under different N application rates, (2) to identify the main factors influencing soil bacterial community variation and the mechanisms of bacterial diversity loss, and (3) to identify the optimal N fertilizer application rate of maize in water-limited areas.

2. Materials and Methods

2.1. Study Site Description and Soil Sample Collection

The experimental site was located in Minle Village (45°26′ N, 125°88′ E), Jilin Province, Northeast China. The region has a continental monsoon climate, which is with hot and rainy summers and cold and dry winters. The mean annual precipitation is around 400 mm, with around 70% occurring from May to September. There are around 2867 h average yearly sunshine hours, the frost-free period is 135–140 days, and the mean annual temperature is 5.6 °C. The soil at the experimental area is chernozem sandy loam. The field experiment was established in 2017, after which the site was subjected to monoculture maize, with maize straw returned for mulched fertigation. Maize was planted in May and harvested in early October each year. The plot size of each treatment was 40 m2 with three replications and was arranged in a randomized complete block design. After the experimental set-up, crop type, planting density, fertilizer application amount, crop straw management, and mulched fertigation were consistent.
The study examined five treatments in which N fertilizer was applied at levels of 0, 90, 150, 210, and 270 kg ha−1 (N0, N1, N2, N3, and N4, respectively). The five N rate treatments were applied at five maize growth stages every year as follows: before sowing (30%), eighth leaf stage (30%), twelfth leaf stage (20%), flowering stage (10%), and milk stage (10%). All treatments received 90 kg P2O5 ha−1 and 90 kg K2O ha−1. The N, P, and K fertilizers were applied as urea, calcium superphosphate, and potassium sulfate, respectively. Soil samples were collected on 24 July 2019, at the flowering stage with three field replicates. The soil type is aeolian sandy soil. Five samples were collected from the soils of tillage layers (0–20 cm) in randomly selected positions and pooled together to form a soil sample. The soil samples were placed into separate sterile bags and transported to the laboratory in an icebox. Remove plant roots, residues and gravel from the samples, then pass them through a 2 mm soil sieve to homogenize them completely. The soil samples from which DNA was extracted were stored at −80 °C, and the remaining soils were air-dried at room temperature to determine soil chemical properties.

2.2. Soil Chemical Properties Measurements

Soil organic carbon (OC) was measured with an elemental analyzer (VarioEL III; Elementar, Hanau, Germany). Soil pH and soil electrical conductivity (EC) were measured with a pH meter in a soil water suspension (1:2.5 w/v). Soil ammonium nitrogen (NH4+-N) and nitrate nitrogen (NO3-N) were measured with a continuous flow analyzer (AA3; Seal, Germany). Soil available nitrogen (AN) content was analyzed by quantifying the alkali-hydrolyzable N in a Conway diffusion unit with Devarda’s alloy in the outer chamber and boric acid-indicator solution in the inner chamber.

2.3. Soil DNA Extraction and Quantitative Real-Time PCR (Q-PCR)

Microbial DNA was extracted from 0.5 g of fresh soil samples using a PowerSoil DNA Isolation Kit (MoBio, Carlsbad, CA, USA) according to the kit instructions. A figure of 1% agarose gel electrophoresis occurred to detect DNA quality. DNA concentration was determined using a Nanodrop 2000 (Thermo Scientific, Waltham, MA, USA). Q-PCR was used to quantify the bacterial 16S rRNA gene copy number of all samples in an ABI 7500 Real-Time PCR System (Applied Biosystems, Carlsbad, CA, USA), and the primers were set to F515 (5′-GTG CCA GCM GCC GCG G-3′) and R907 (5′-CCG TCA ATT CMT TTR AGT TT-3′) [19]. The PCR reactions contained AceQ® SYBR Green qPCR Master Mix (2X) 15 μL, Mg2+ (25 mM) 2 μL, 10 μM forward and reverse primer each 0.5 μL, template DNA 2.0 μL, and double-distilled H2O 10.0 μL in triplicate. The PCR reaction procedure was carried out for 3 min for denaturation at 95 °C, 30 cycles of 30 s at 94 °C, annealing at 60 °C for 30 s, and extension at 72 °C for 30 s. The PCR products were extracted from a 2% agarose gel, purified by the AxyPrep DNA Gel Extraction Kit (Axygen Biosciences, Union City, CA, USA), and quantified using QuantiFluor_ST (Promega, WI, USA) as the kit instructions.

2.4. Illumina MiSeq Sequencing

The V4–V5 region of 16S rRNA was amplified by PCR with the primer set F515/R907 in a thermocycling PCR system (GeneAmp 9700; Applied Biosystems) [19]. The PCR reactions were carried out using the following plan: denaturation at 95 °C for 5 min, 27 cycles for 30 s at 95 °C, annealing at 55 °C for 30 s, extension at 72 °C for 45 s, and the last extension at 72 °C for 10 min, followed by 10 °C until user stopped. The PCR reactions were performed with a 20-μL mixture in three replicates, and the mixture contained 5 × FastPfu Buffer 4 μL, 2.5 mM dNTPs2 μL, each primer (5 μM) 0.8 μL, FastPfu Polymerase 0.4 μL, and template DNA10 ng. The PCR products purification (AxyPrep PCR Clean-up Kit; Axygen Biosciences) before performing agarose gel electrophoresis. QuantiFluor-ST (Promega) was used to detect the concentration of the purified amplified products and sequencing was performed on the Illumina MiSeq platform of Shanghai Biozeron Biological Technology Co. Ltd. (Shanghai, China).

2.5. Processing of Sequencing Data

The raw 16S rRNA gene sequencing reads were subjected to demultiplexed, traumatic quality filtering and merged by FLASH according to the following criteria: (i) Truncated the 200-bp reads at any site receiving point with an average quality score of less than 20 with more than 50-bp sliding window, and truncated reads less than 50 bp were removed; reads containing equivocal characters were also removed; (ii) According to overlapping sequences, only overlapping sequences larger than 10 bp were spliced. The maximum mismatch rate in the overlapping area was 0.2; the reading that could not be assembled were removed; (iii) The samples were differentiated in the light of the barcode and primers, and the sequence direction was standard using precise barcode matching; there are two nucleotide mismatches in primer matching. Used UPARSE (version 10, http://drive5.com/uparse/ (accessed on 27 December 2019)) to cluster operational taxonomic units (OTUs) with a similarity cutoff rate of 97% [20], identified and removed chimeric sequences. For the 16S rRNA database, Silva (release 132, http://www.arb-silva.de (accessed on 27 December 2019)) were used to classify and analyze each OTU representative sequence with a confidence threshold of 0.8 [21]. All sequences have been stored in GenBank, and accession number was SRP278325.

2.6. Statistical Analysis

Soil properties and bacterial abundance were evaluated by one-way ANOVA using SPSS version 20 software (IBM Corp., Armonk, NY, USA). A pheatmap package was used for heat map analysis in the R environment (version 3.5.0) [22], and Student’s t-test used to estimate differences in bacterial composition between two groups with 95% confidence intervals in STAMP (http://kiwi.cs.dal.ca/Software/STAMP (accessed on 18 March 2020)) [23]. Principal coordinate analysis (PCoA) was used to examine beta-diversity, which was based on the Bray–Curtis distance. Linear discriminant analysis (LDA) effect size (LEfSe) was used to identify which taxa were likely responsible for differences between each treatment [24]. The LEfSe algorithm was used to draw a cladogram on the Huttenhower Galaxy web (http://huttenhower.sph.harvard.edu/galaxy/ (accessed on 26 March 2020)). The LDA was considered to be an important contributor, with an LDA score ≥ 2.0. The relationship of soil properties with bacterial community was demonstrated by Pearson correlation in the Performance Analytics package with R software (version 3.5.0) [22]. Co-occurrence network visualization was performed in Gephi software (0.9.2) with the robust Spearman correlations coefficient ρ > 0.7 and p < 0.05. The Functional Annotation of Prokaryotic Taxa database (FAPROTAX) was used to predict bacterial functional groups [25]. Canonical correspondence analysis (CCA) was performed in the vegan package with R software (version 3.5.0) [22].

3. Results

3.1. Soil Chemical Properties

Remarkable differences in soil chemical properties were observed at different N gradients (Table 1). Compared to the no N control (N0) and low N application rates (N1 and N2), the EC, NO3-N and AN content significantly increased at high N application rates (N3 and N4). By contrast, compared with N0, the soil OC content and pH significantly decreased at high N application rates (N4).

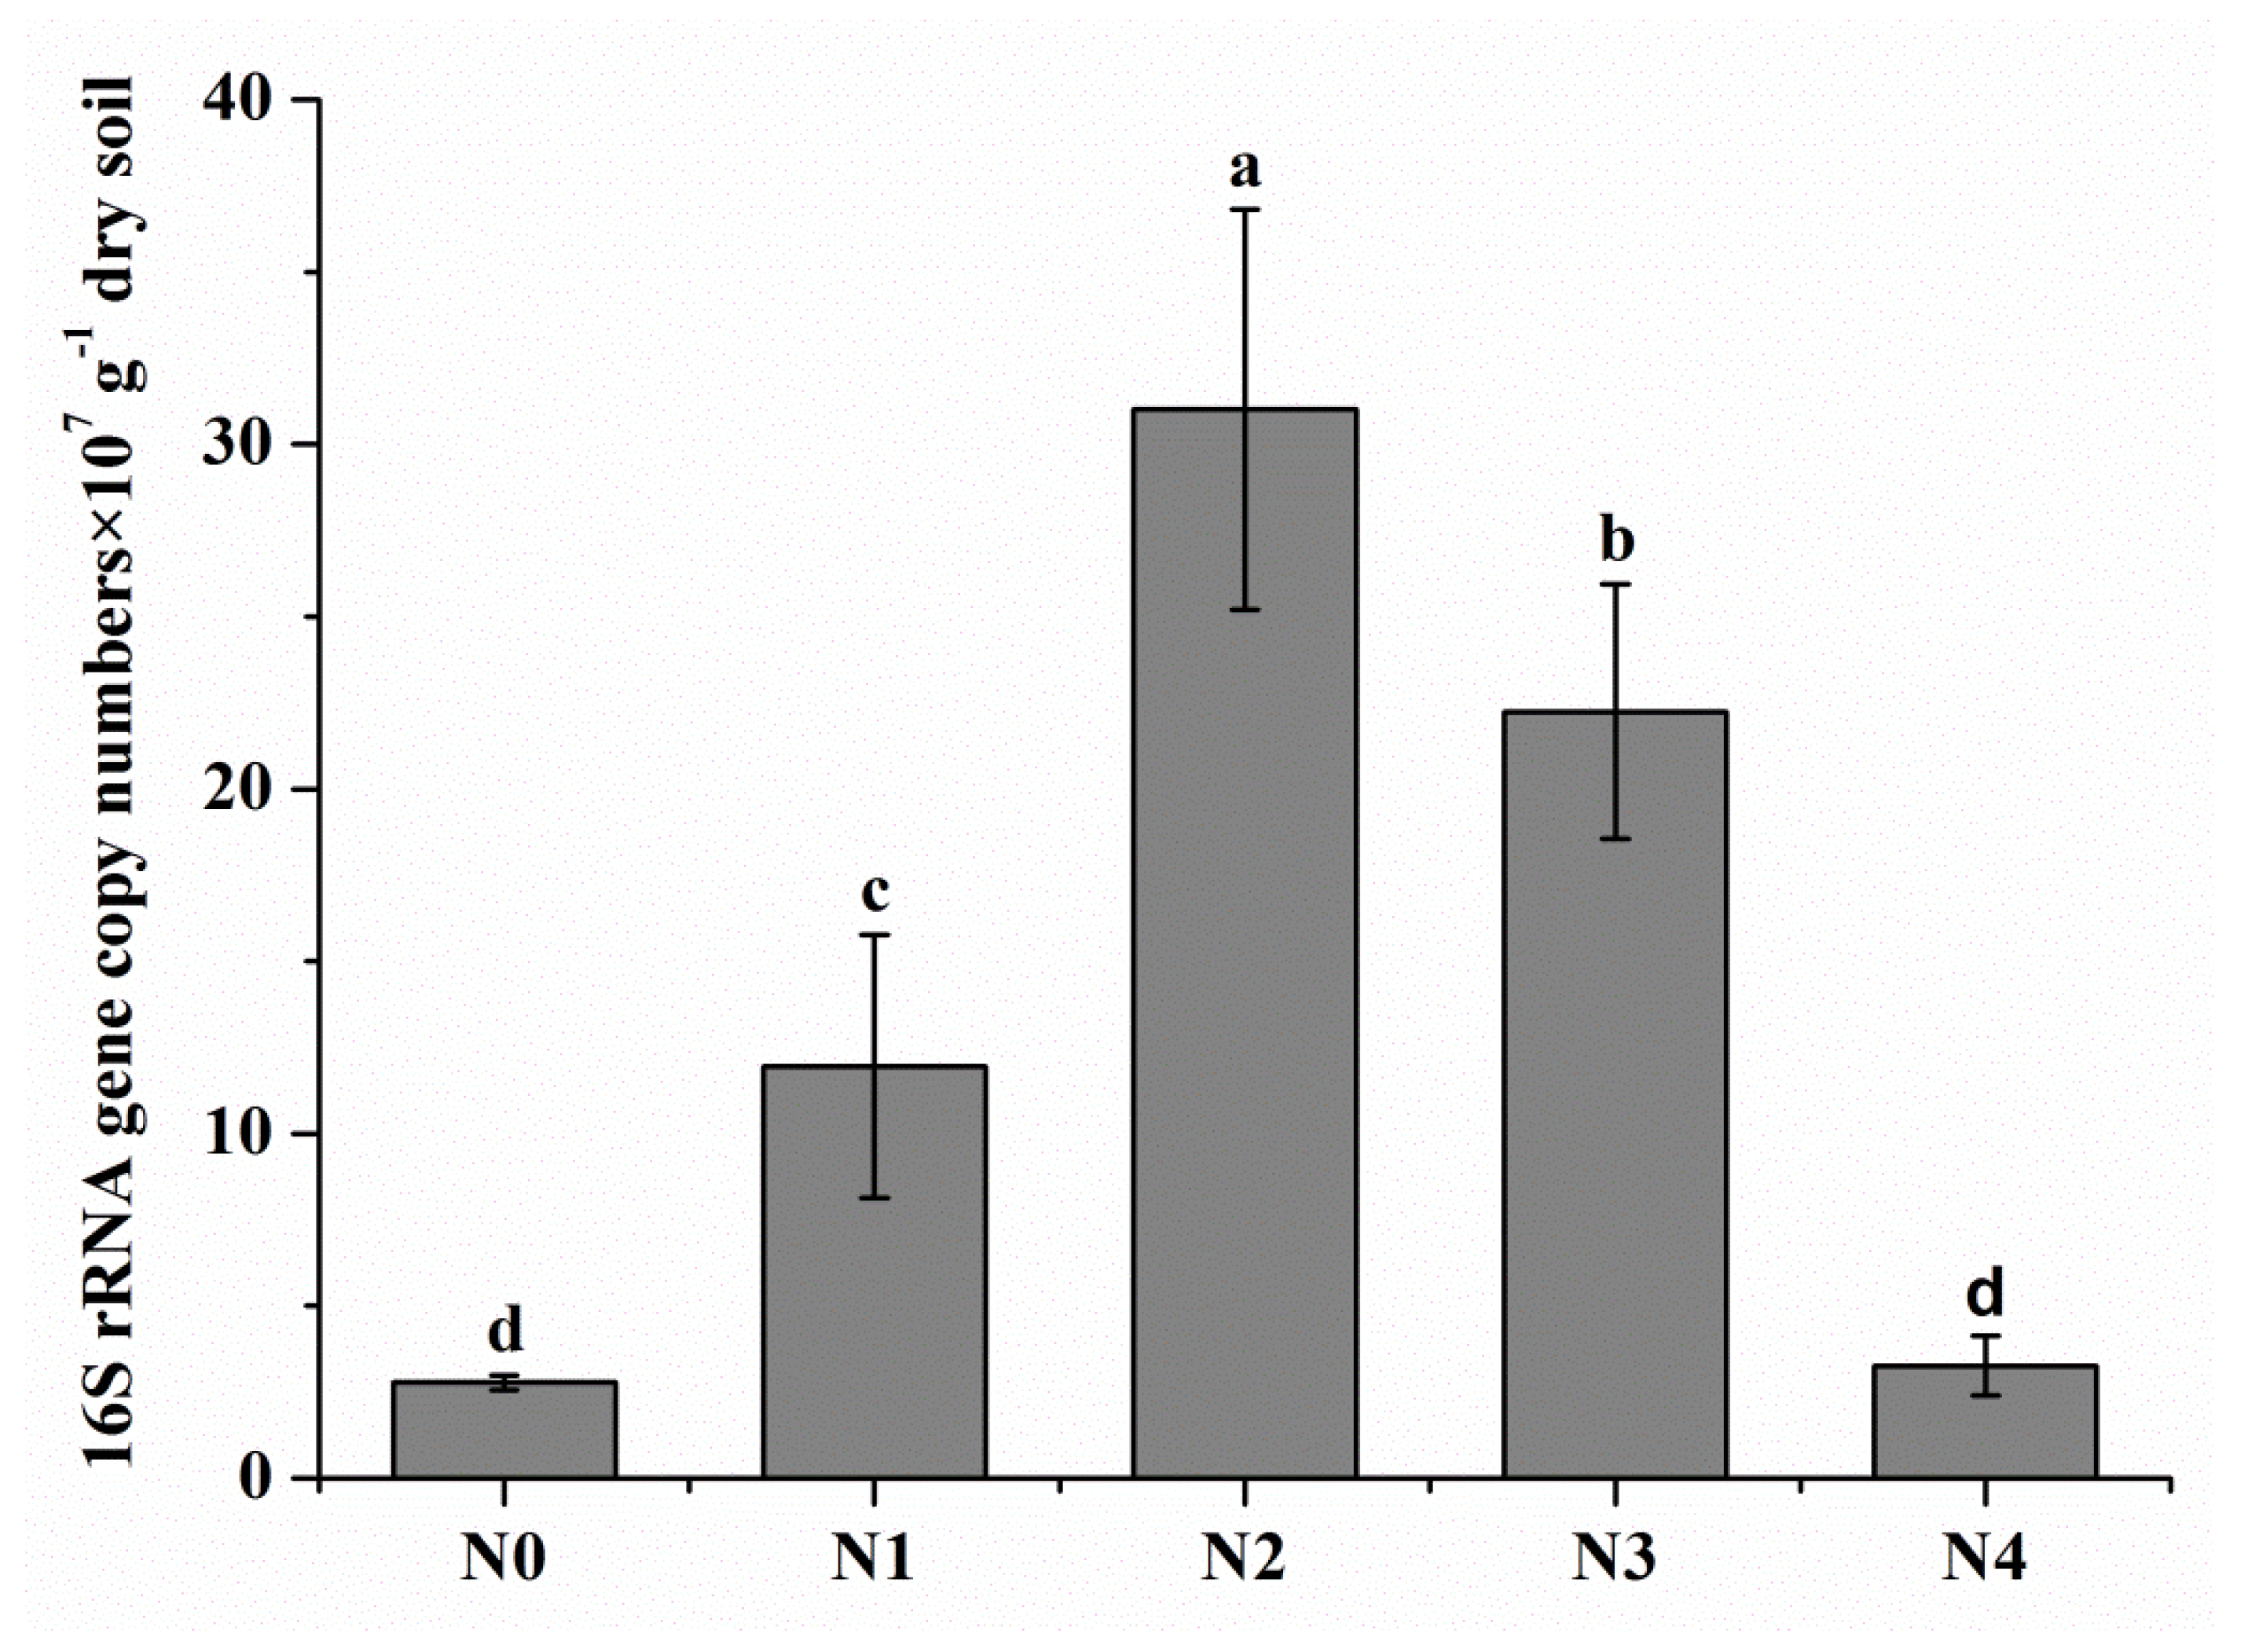
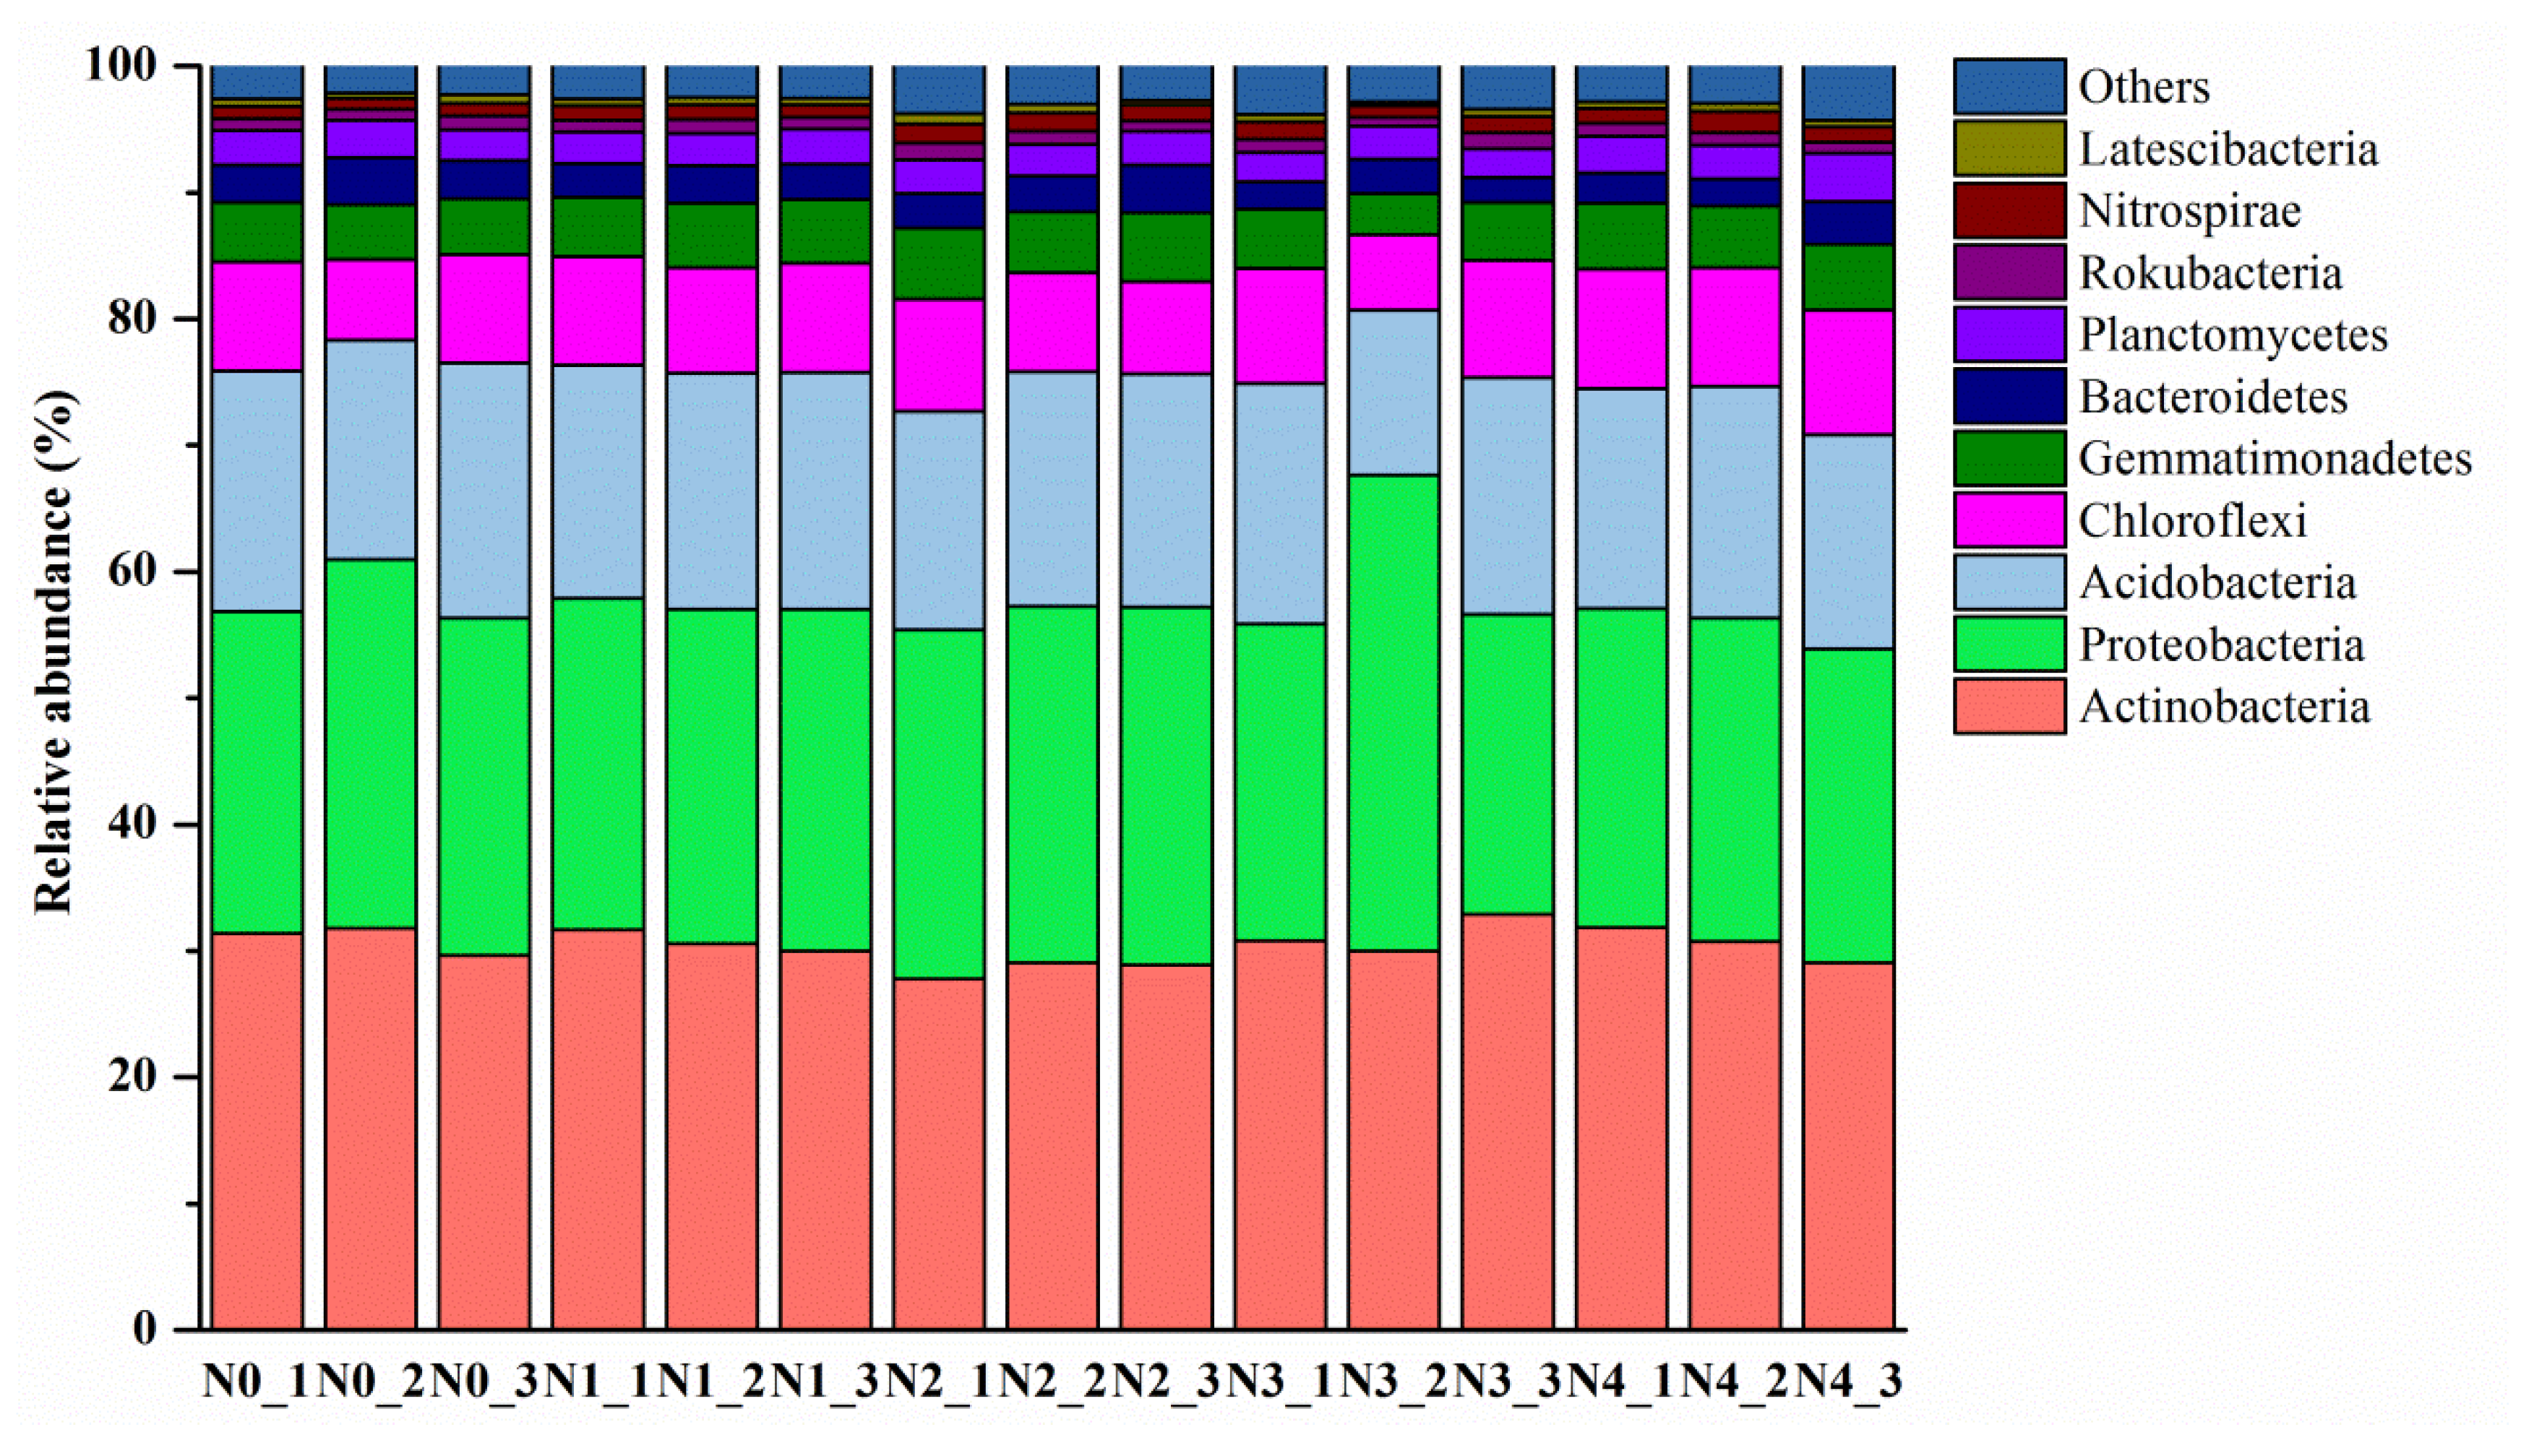
3.2. Soil Bacterial Abundance and Bacterial Community Composition

The bacterial abundance of different N gradients ranged from 2.78 × 10⁷ to 3.10 × 10⁸ copies g−1 soil (Figure 1). Compared to N0, there was noticeable elevation in bacterial abundance under N1, N2, and N3.
A total of 731,222 quality sequences were obtained from 15 soil samples, and 41,102–44,348 sequences were obtained per sample (Table S1). Following taxonomic assignment, the sequences were assigned to 24 bacterial phyla, and the top ten phyla were screened out (Figure 2). The dominant bacterial phyla were Actinobacteria, Proteobacteria, Acidobacteria, and Chloroflexi, accounting for 82.73–85.09% of the total sequences. The relative abundance of seven phyla was significantly altered under different N gradients (Table S2). The relative abundances of Gemmatimonadetes and Nitrospirae dramatically improved in N2 compared to N0. The relative abundances of Bacteroidetes and Deinococcus–Thermus decreased in N3 compared to N0, but Firmicutes increased in N3. The relative abundance of Proteobacteria decreased in N4 compared to N0, whereas Gemmatimonadetes and Firmicutes increased in N4.
Figure 3 showed a heatmap displaying the top 20 dominant genera. Nocardioides, Gaiella, Pseudarthrobacter, and Lysobacter were the dominant genera in the five N application gradients. N application also affected variation at the genus level. For instance, the relative abundance of Pseudarthrobacter in N0 was higher than that in N2 and N3, and the relative abundance of Gemmatimonas in N0 was prominently lower than that in N2 and N4. Interestingly, less abundant genera exhibited significant changes between the N0 control and N application conditions. In addition to unclassified and norank, 14, 12, 22, and 35 genera were affected, with significant differences in N0 compared to N1, N2, N3, and N4, respectively (Figure S1). The genera that displayed noticeable differences in relative abundance varied among the different N application gradients; 11, 8, 11, and 22 genera increased significantly in N1, N2, N3, and N4, respectively, relative to N0. In N1, the relative abundance of Dyadobacter, Singulisphaera, Craurococcus, Nitrolancea, and Promicromonospora markedly increased, with a greater increment in relative abundance than in N0. The relative abundances of Mizugakiibacter, Nitrospira, Brevibacillus, and Rhodanobacter in N2 were higher than those in N0. The relative abundances of Dyella, Skermanella, Aneurinibacillus, and Craurococcus in N3 were markedly enhanced compared with N0. Halomonas, Enterobacter, Microlunatus, Pseudonocardia, Skermanella, and Nitrolancea in N4 displayed dramatically enhanced abundances compared with N0.

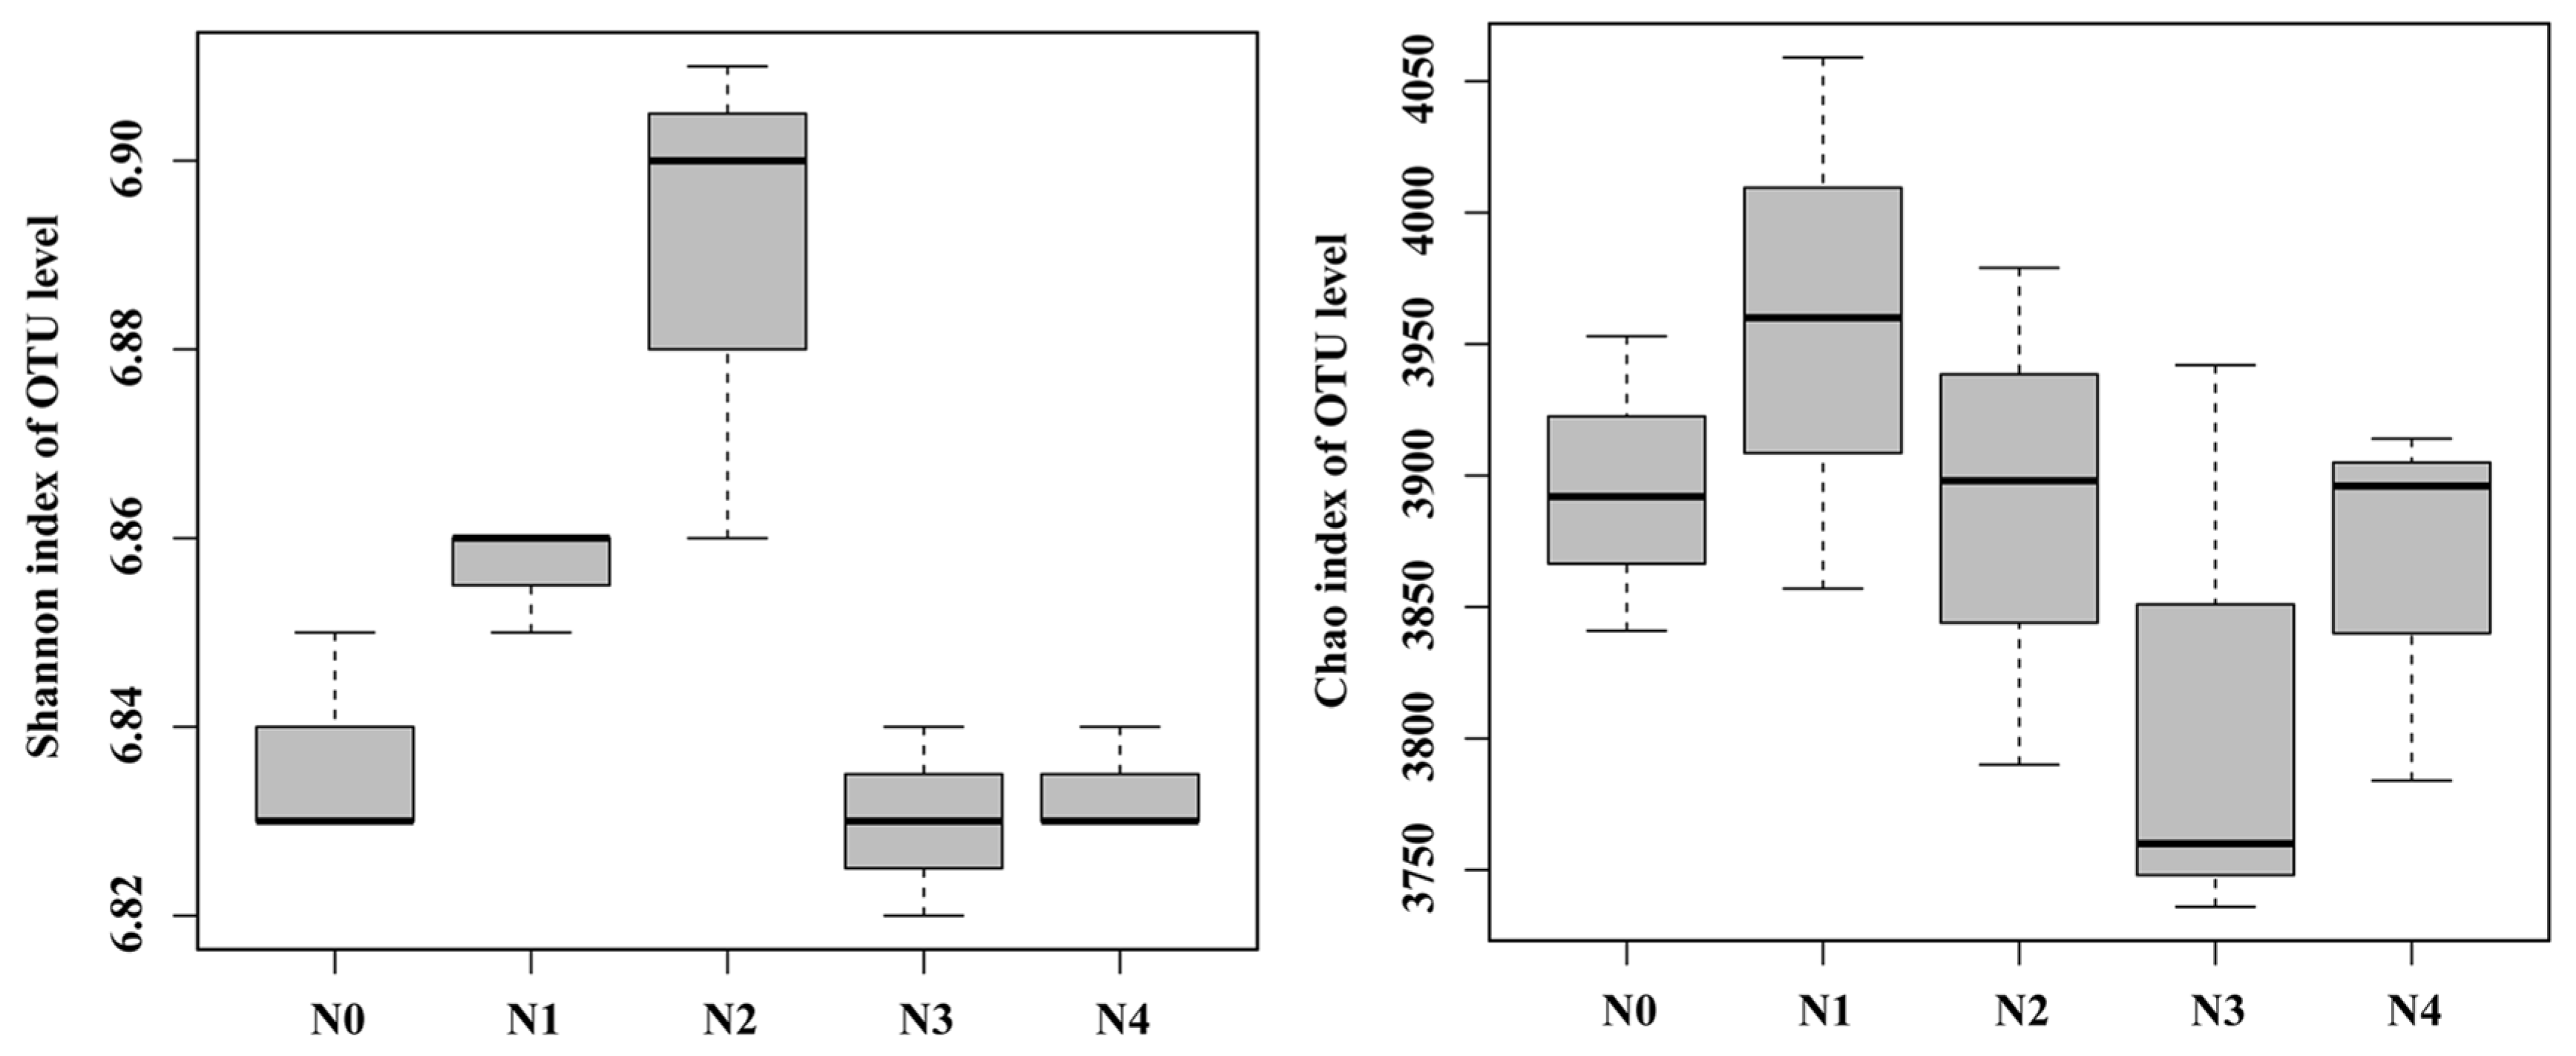
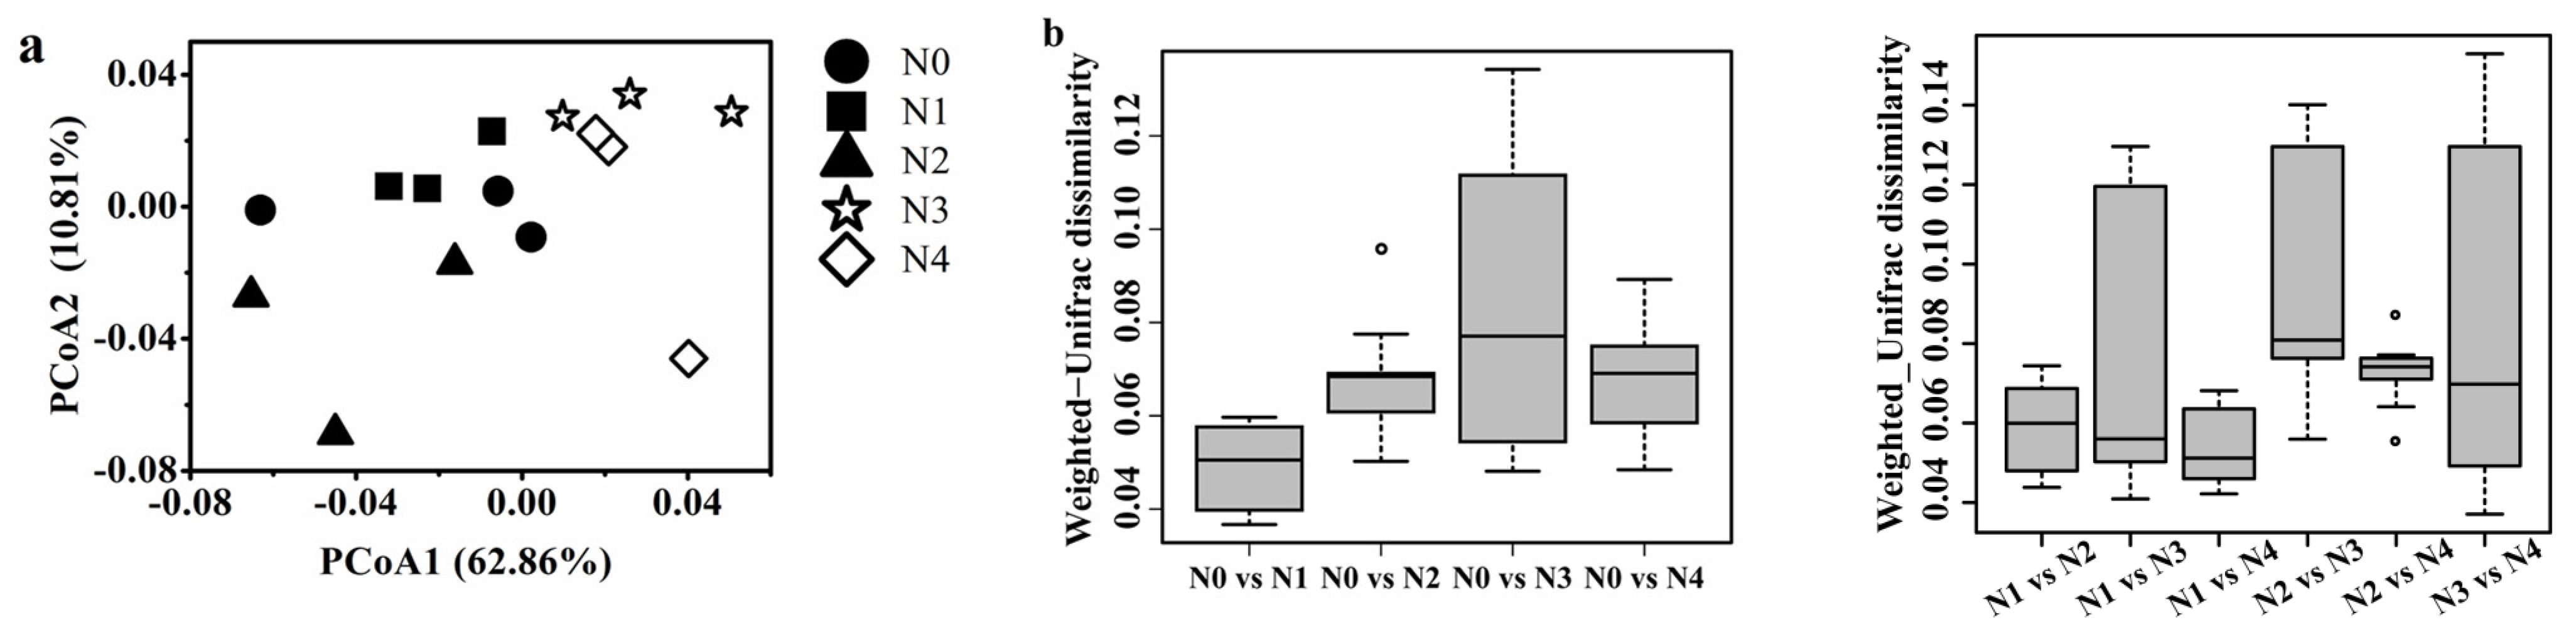
3.3. Soil Bacterial Community Diversity

As the N application rates increased, the Shannon index first increased in N1 and N2 and then declined sharply in N3 and N4 (Figure 4). Diversity calculated using the Chao index showed the same trend as the Shannon index, both calculations being statistically similar (Figure 4).
PCoA based on the OTUs confirmed that the bacterial community structures were distinct between low N application rates (N0, N1, and N2) and high N application rates (N3 and N4). The first and second principal coordinates explained 62.86 and 10.81% of the total variance in bacterial community structures, respectively (Figure 5a). N3 and N4 were grouped together, which were obviously separated from N0, N1, and N2 on PCoA1, indicating that the N application rate was the primary determinant of bacterial community structure (Table S3). To gain more insight, we calculated the weighted Unifrac dissimilarity among different N application rates (N1, N2, N3, and N4) (Figure 5b), which revealed that the dissimilarity between the N0 and N application treatments (N1, N2, N3, and N4) increased with higher N application rates. LEfSe analysis identified the predominant taxa with differences of bacterial composition in the five N application gradients (Figure 6, Table S4). At the genus level, N0 was differentially enriched with Stenotrophobacter, N1 was differentially enriched with Comamonas, N2 was differentially enriched with Gemmatimonas, N3 was differentially enriched with Bacillus, and N4 was differentially enriched with Pirellula.

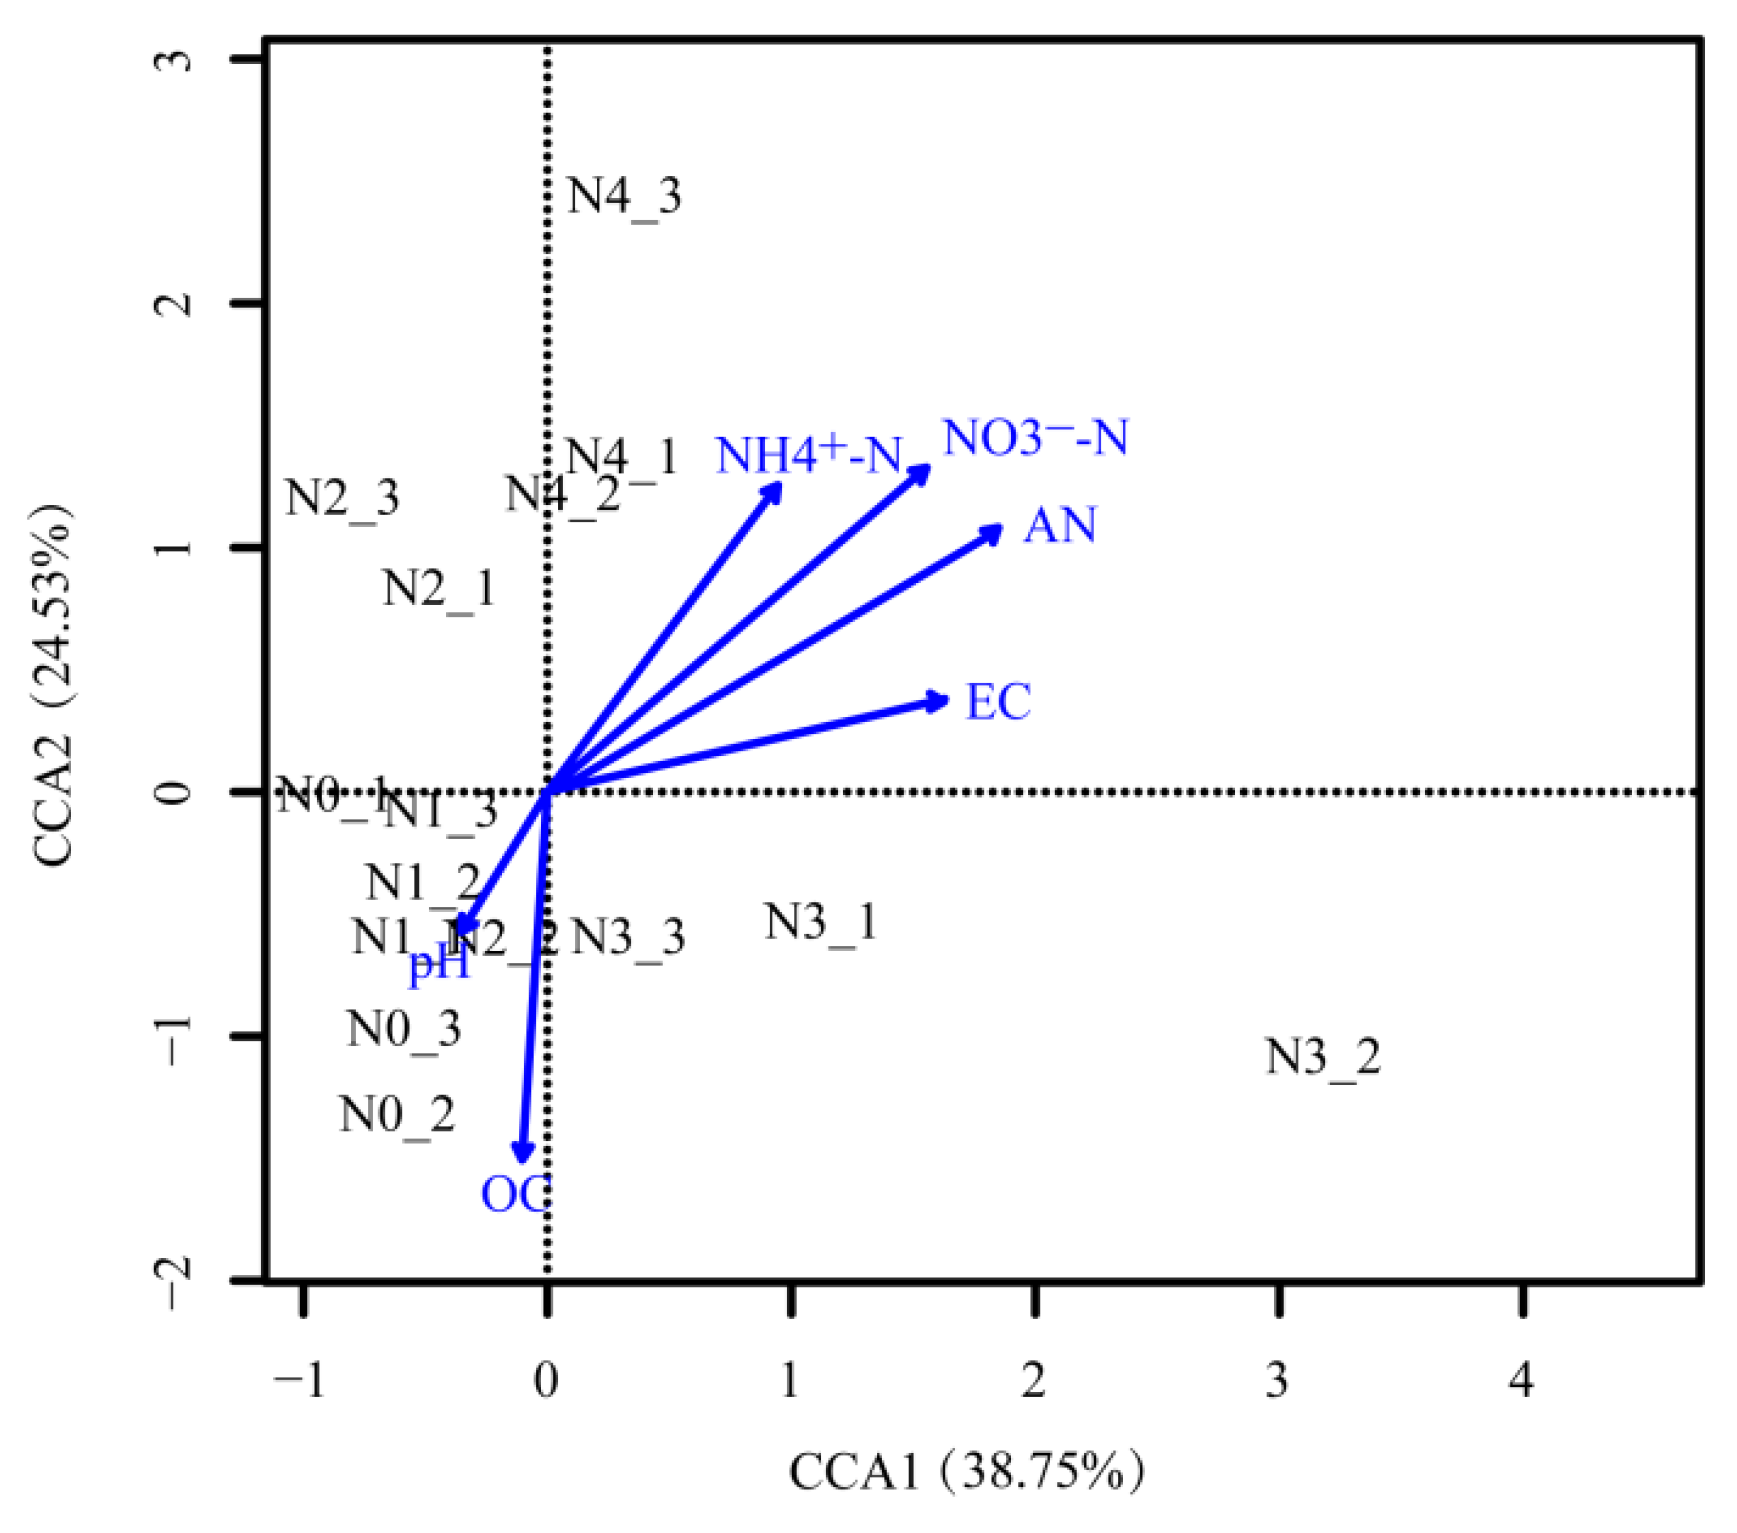
3.4. Relationships between Soil Bacterial Communities and Chemical Properties

The relationship of soil properties with bacterial community was demonstrated by Pearson correlation (Figure S2). OC was significantly positively correlated with bacterial abundance. EC, NO3-N, and AN were significantly positively correlated with PCO1. Shannon diversity was significantly negatively correlated with PCO1 and PCO2.
The CCA analysis indicated that the bacterial community structures differed under different N gradients (Figure 7). CCA1 and CCA2 explained 38.75 and 24.53% of the community structures, respectively. Among the soil properties examined, AN was the most crucial factor that changed the bacterial community along the CCA1 axis (Figure 7). In contrast, OC was the most critical factor that changed the bacterial community along the CCA2 axis.

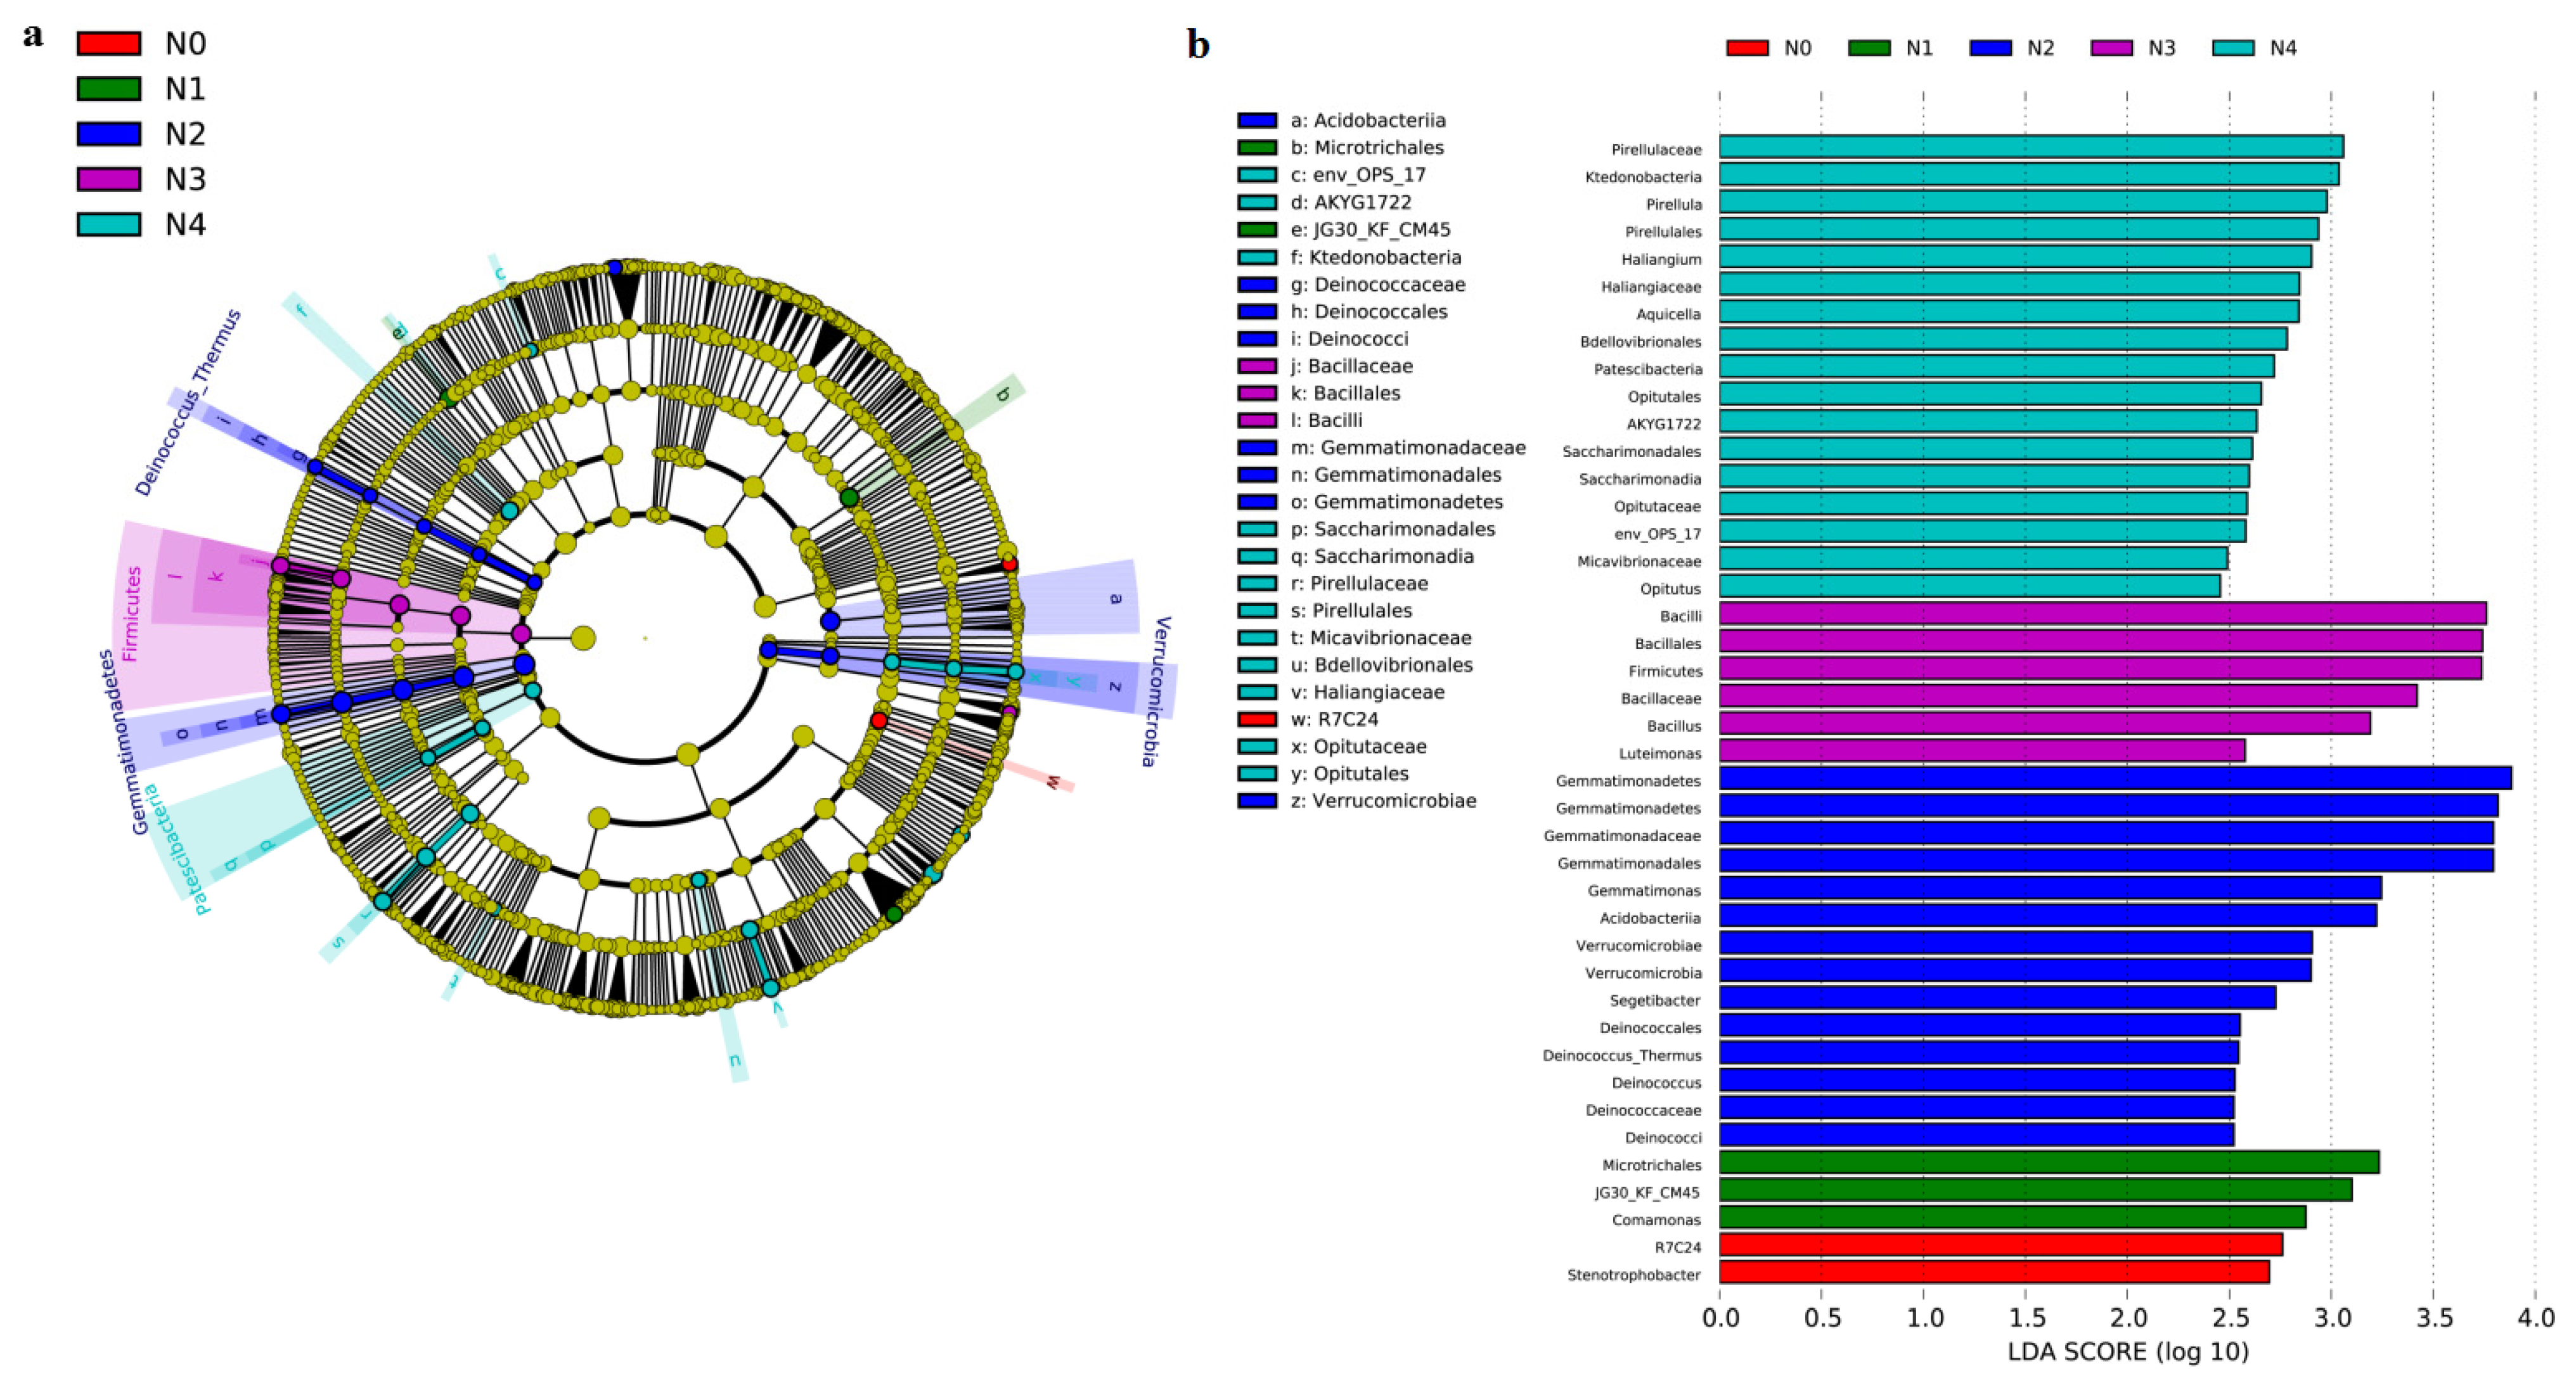
3.5. Soil Bacteria Functional Groups

The genera with significant differences were classified in the FAPROTAX database and sorted into eight dominant predicted functional groups related to N cycling (Table 2). The relative abundance of most functional groups related to N tended to increase after N application. N1 exhibited an increasing trend to N0 for the relative abundance of predicted functional groups associated with Aerobic_nitrite_oxidation. The relative abundances of Nitrate_reduction and Aerobic_ammonia_oxidation were higher in N2 than in N0. N4 led to an increase in the relative abundance of Aerobic_ammonia_oxidation and Aerobic_nitrite_oxidation with respect to N0. The relative abundances of Nitrogen_fixation and Nitrate_ammonification were reduced in N3 and N4.

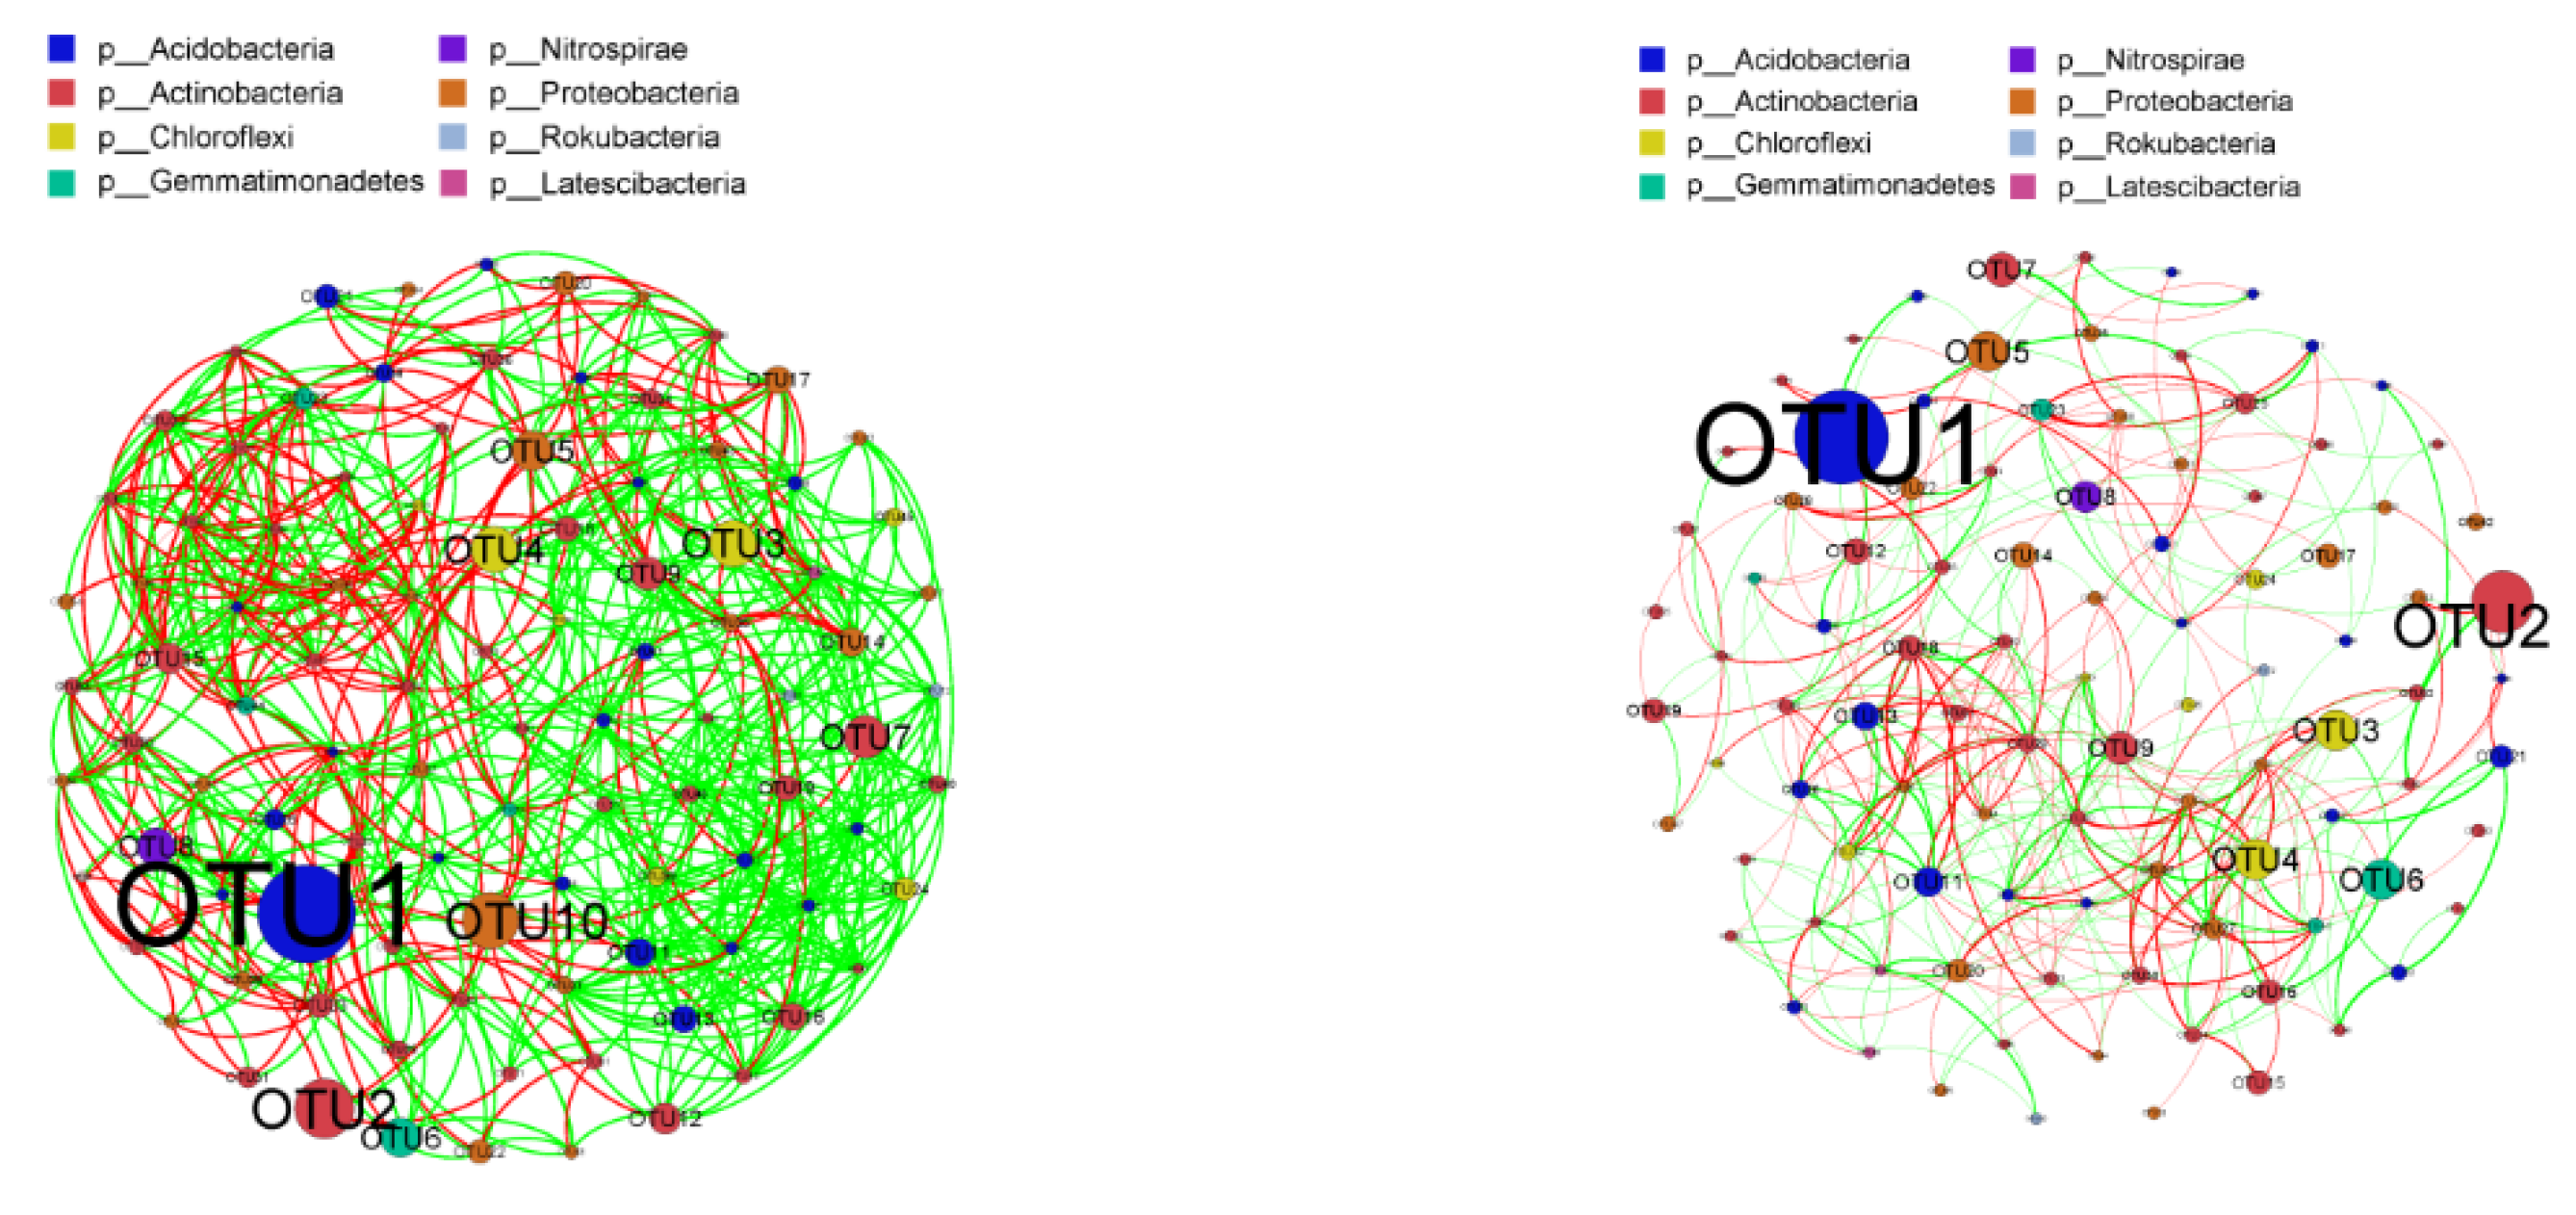
3.6. Bacterial Co-Occurrence Networks

The co-occurrence network analysis based on OTUs levels revealed the interaction of soil bacterial communities under different N gradients (Figure 8). The N application significantly changed the bacterial network structure. The low N and high N were regarded as two wholes, to construct a low N network and high N network. The co-occurrence network of low N and high N application rates consisted of 684 and 349 edges, respectively. The number of nodes and connections in low N network was significantly higher than that in high N network, and the proportion of positively correlated connections between nodes in low N network was higher than that in high N network.

4. Discussion

4.1. Variation in Soil Physicochemical Properties under Different N Gradients

In this present study, different N gradients resulted in changes in soil properties (Table 1). Application of N often causes soil acidification [26]. Similar results were observed in this study, where the pH value significantly decreased under high N application rates. This acidification may be due to the NH4+ generated by the hydrolysis of urea entering the soil, and a large amount of H+ is produced through nitrification, which leads to a drop in soil pH [27]. AN, NH4+-N and NO3-N significantly increased under high N application rates. Similar to previous reports, fertilizer application was demonstrated to promote the accumulation of soil nutrients, for example, NH4+-N and NO3-N [17].

4.2. Shifts in Bacterial Abundance and Community Composition in Response to Different N Gradients

Our results suggested that N application substantially enhanced bacterial abundance compared to the N0 (Figure 1). One study also suggested that N application could significantly increase the bacterial abundance in pasture soils, especially of saprophytic microorganisms [28]. N provides energy and nutrition for the growth and reproduction of microorganisms, and dramatically promotes the growth of some indigenous soil microorganisms [29]. However, Zhou et al. [30] showed that different N application rates significantly reduced bacterial abundance in intensively cultivated black soil. Soil microbial community structure and abundance were prominently correlated with soil pH [31]. The decrease in soil pH caused by N application may directly lead to a significant reduction in bacterial abundance.
In this study, N application caused changes in bacterial community composition at the phylum and genus levels. The relative abundances of Proteobacteria and Bacteroidetes decreased in N4 and N3 compared with N0 (Figure 2). Zeng et al. [32] also reported that N addition led to a remarkable shift in bacterial community composition, of which the relative abundance of Alphaproteobacteria and Bacteroidetes decreased following N enrichment. Proteobacteria and Bacteroides are considered to be eutrophic bacteria, which have high growth rates in carbon-rich environments. High N application rates were not conducive to the accumulation of soil nutrients, inhibiting the reproduction of eutrophic bacteria [33]. The bacterial community composition was significantly affected by pH. Soil acidification reduced the relative abundance of Proteobacteria and Bacteroidetes [34]. This study showed that the relative abundances of Gemmatimonadetes noticeable increased in N2 and N4 compared with N0 (Figure 2). These results were similar to those generated in a previous study, in which the soil bacterial community composition was shown to shift following N application with an increase in the relative abundance of Gemmatimonadetes [35]. Gemmatimonadetes may be necessary in the decomposition of recalcitrant C compounds [36]. Nocardioides, which belongs to the phylum Actinobacteria, was the dominant genus in the five N application gradients (Figure 3). Nocardioides is associated with the Nitrate_reduction function. Zhou et al. [37] also found that Nocardioides was the dominant genus of wheat and soybean in black soil, and that N application increased the relative abundance of Nocardioides. In this study, N application reduced the relative abundance of Pseudarthrobacter and enhanced the relative abundance of Gemmatimonas (Figure 3). Pseudarthrobacter, which belongs to the phylum Actinobacteria, is capable of mineralizing several substituted phenols, and of metabolizing phenol as its sole energy source under both mesophilic and psychrophilic conditions [38]. Gemmatimonas, which belongs to the phylum Gemmatimonadetes, decomposes fiber and plays a crucial role in soil carbon sequestration [39].

4.3. Effects of Different N Gradients on Bacterial Diversity

In this study, high N application rates (N3 and N4) significantly decreased soil bacterial community diversity compared to low N application rates (N1 and N2) (Figure 4). We had similar results to those of Zhou et al. [30], who demonstrated that excessive N application could lead to decreased bacterial community diversity. Fierer et al. [33] also discovered that N enrichment prompted a conspicuous reduction in bacterial community diversity in farmland. Acidification caused by long-term N application inhibited some of the species that are sensitive to acidic conditions, which consequently reduced species diversity. However, the accumulation of N in the soil on account of long-term N application led to the rapid growth and reproduction of nitrogenous microorganisms; their rapid growth competitively inhibited some species sensitive to nutrients [40,41]. This is in contrast with the findings of Ramirez et al. [42], who proposed that although N application affected bacterial community composition in grassland and agricultural fields, it had less of an effect on bacterial community diversity. This suggests that the effect of N application on bacterial diversity may be location dependent.
In the natural environment, species cannot exist alone, but form a complex ecological network with other species [43]. Analyzing the ecological network structure can not only reveal the complex relationship between species, but also characterize the stability of ecological network structure [44]. This study found that the connection between nodes in the low N network was closer, and high N network significantly simplified the bacterial network structure (Figure 8). The high N network caused the reduction of the bacterial network structure stability may be the key to the reduced bacterial community diversity, which may have adverse effects on maintaining the health and stability of soil microbial ecosystem.

4.4. The Main Factors Affecting Bacterial Community Structure Variation

The correlation analysis between bacterial community structure and environmental factors indicated that bacterial communities within different N application rates were affected by different environmental factors. AN was likely the primary driver of shifting bacterial communities due to the various N application rates (Figure 7). Our results declared that the effect of N application on bacterial community structure might be indirectly driven by changes in soil characteristics, this was related to the results of Zhong et al. [45] consistent, who indicated that long-term N application could alter soil physicochemical properties and eventually bring about variations in soil microbial community structure. Many studies have reported that bacterial community structure is affected by different factors. Zul et al. [46] suggested that both abiotic and biotic factors determined the microbial community structure. Wessén et al. [47] manifested that variation in bacterial abundance under different fertilization systems were mainly caused by soil pH. Zeng et al. [32] revealed that the variation in bacterial community composition was caused by changes in soil pH. By contrast, Ramirez et al. [48] claimed microbial respiration responded consistently to N application, no matter what soil type and N form, manifesting that the reaction was directly caused by N availability, as opposed to indirect effects by such as soil pH.

4.5. Effect of N Fertilizer on Soil Functional Bacteria

In this study, we obtained eight dominant predicted functional groups related to N cycling using FAPROTAX. N application exhibited an increasing trend for the relative abundance of predicted functional groups associated with Aerobic_nitrite_oxidation, Nitrate_reduction, and Aerobic_ammonia_oxidation, but a decreasing trend for the relative abundance of Nitrogen_fixation (Table 2). This suggests that N application promoted Aerobic_nitrite_oxidation, Nitrate_reduction, and Aerobic_ammonia_oxidation pathways, but inhibited Nitrogen_fixation function in the bacterial community. N application markedly increased the relative abundances of Dyadobacter, Craurococcus, Promicromonospora, Brevibacillus, Rhodanobacter, Dyella, Skermanella, Aneurinibacillus, Microlunatus, and Pseudonocardia associated with Nitrate_reduction [49], and Mizugakiibacter, Nitrospira, and Halomonas associated with Nitrate_respiration [50].

5. Conclusions

Our results showed that the impacts of diverse N application rates on soil properties varied significantly, and contributed to increases in soil nutrient levels. N application had a noteworthy effect on bacterial abundance and community composition. N application rates increased bacterial abundance, but reduced the relative abundance of eutrophic bacteria such as Proteobacteria and Bacteroidetes. Low N application rates caused an increase in bacterial diversity, which declined under high N application rates. The variations in bacterial community structure were clearly distinguished between the low and high N application rates, which were mainly driven by AN. The results of FAPROTAX revealed that N application promoted the Aerobic_nitrite_oxidation, Nitrate_reduction, Aerobic_ammonia_oxidation functional groups, but inhibited the Nitrogen_fixation function of the bacterial community. These findings provide new insight into how N application rates could be regulated to reduce N loss. The high N network caused the reduction of network structure stability and not suitable for stability of soil microbial ecosystem. We speculate that the optimal N application rate in this study may be approximately 150 kg ha−1 (N2) based on the differences in soil properties and bacterial community structure. The complex interactions among N, soil, and microorganisms should be considered in future studies.

Supplementary Materials

The following are available online at https://www.mdpi.com/article/10.3390/su132111967/s1, Table S1. Illumina MiSeq sequenced bacterial data (at 97% sequence similarity) based on the 16S rRNA gene. Table S2. Relative abundance (%) at bacterial phyla level under different N gradients. Table S3. The statistical analysis base on Weighted-Unifrac for distance of bacterial community beta diversity among different N gradients. Table S4. The statistical analysis and LDA score of different genera under five N fertilizer levels. Figure S1. The relative abundances of bacterial genera between different N gradients (N1, N2, N3 and N4) and the control (N0) (at 95% confidence intervals, Student’s t-test, equal variance). N0, N1, N2, N3, and N4 represent N fertilizer was used at a level of 0, 90, 150, 210, and 270 kg ha−1, respectively. Figure S2. Correlation coefficients between soil properties and bacterial community significant correlations (* 0.01 < p < 0.05, ** 0.001 < p < 0.01, *** p < 0.001). OC: soil organic carbon, EC: soil electrical conductivity, NH4+-N: soil ammonium nitrogen, NO3-N: soil nitrate nitrogen, AN: soil available nitrogen.

Author Contributions

L.W. (Lichun Wang) designed the field experiment. M.W. and Y.L. followed field applications. L.W. (Ling Wang) and Q.L. measured parameters. H.L. gathered related data. M.W. and L.W. (Ling Wang) designed the manuscript framework and organization, and the written manuscript. All authors have read and agreed to the published version of the manuscript.

Funding

This work was financially supported by Basic Scientific Research Projects of Jilin Academy of Agricultural Sciences (KYJF2021JQ106), and Agricultural Science and Technology Innovation Program of Jilin Province (C82230215, and C92070202).

Institutional Review Board Statement

Not applicable.

Informed Consent Statement

Not applicable.

Conflicts of Interest

The authors declare that they have no conflict of interest.

References

  1. Gruber, N.; Galloway, J.N. An Earth-system perspective of the global nitrogen cycle. Nature 2008, 451, 10–13. [Google Scholar] [CrossRef] [PubMed]
  2. Zhang, C.; Xu, R.; Su, F.; Roelcke, M.; Ju, X. Effects of enhanced efficiency nitrogen fertilizers on NH3 losses in a calcareous fluvo-aquic soil: A laboratory study. J. Soils Sediments 2020, 20, 1887–1896. [Google Scholar] [CrossRef]
  3. Cassman, K.G.; Dobermann, A.; Walters, D.T. Agroecosystems, nitrogen-use efficiency, and nitrogen management. Ambio 2002, 31, 132–140. [Google Scholar] [CrossRef]
  4. Cui, Z.; Zhang, F.; Chen, X.; Dou, Z.; Li, J. In-season nitrogen management strategy for winter wheat: Maximizing yields, minimizing environmental impact in an over-fertilization context. Field Crop. Res. 2010, 116, 140–146. [Google Scholar] [CrossRef]
  5. Vitousek, P.M.; Naylor, R.; Crews, T.; David, M.B.; Drinkwater, L.E.; Holland, E.; Johnes, P.J.; Katzenberger, J.; Martinelli, L.A.; Matson, P.A.; et al. Nutrient imbalances in agricultural development. Science 2009, 324, 1519–1520. [Google Scholar] [CrossRef] [PubMed]
  6. Ju, T.; Xing, G.; Chen, X.; Zhang, S.; Zhang, L.; Liu, X.; Cui, Z.; Yin, B.; Christie, P.; Zhu, Z.; et al. Reducing environmental risk by improving N management in intensive Chinese agricultural systems. Proc. Natl. Acad. Sci. USA 2009, 106, 3041–3046. [Google Scholar] [CrossRef] [PubMed] [Green Version]
  7. Tilman, D.; Cassman, K.G.; Matson, P.A.; Naylor, R.; Polasky, S. Agricultural sustainability and intensive production practices. Nature 2011, 418, 671–677. [Google Scholar] [CrossRef] [PubMed]
  8. FAO. FAOSTAT Database—Agriculture Production. 2012. Available online: http://www.fao.org/home/en/ (accessed on 23 August 2019).
  9. Guo, J.H.; Liu, X.J.; Zhang, Y.; Shen, J.L.; Han, W.X.; Zhang, W.F.; Christie, P.; Goulding, K.W.T.; Vitousek, P.M.; Zhang, F.S. Significant acidification in major chinese croplands. Science 2010, 327, 1008–1010. [Google Scholar] [CrossRef] [PubMed] [Green Version]
  10. Le, C.; Zha, Y.; Li, Y.; Sun, D.; Lu, H.; Yin, B. Eutrophication of lake waters in China: Cost, causes, and control. Environ. Manag. 2010, 45, 662–668. [Google Scholar] [CrossRef] [PubMed]
  11. Cui, Z.; Wang, G.; Yue, S.; Wu, L.; Zhang, W.; Zhang, F.; Chen, X. Closing the N-use efficiency gap to achieve food and environmental security. Environ. Sci. Technol. 2014, 48, 5780–5787. [Google Scholar] [CrossRef] [PubMed]
  12. Abujabhah, I.S.; Doyle, R.B.; Bound, S.A.; Bowman, J.P. Assessment of bacterial community composition, methanotrophic and nitrogen-cycling bacteria in three soils with different biochar application rates. J. Soils Sediments 2018, 18, 148–158. [Google Scholar] [CrossRef]
  13. Hu, H.; He, J. Comammox—A newly discovered nitrification process in the terrestrial nitrogen cycle. J. Soils Sediments 2017, 17, 2709–2717. [Google Scholar] [CrossRef]
  14. Bowles, T.M.; Acosta-Martínez, V.; Calderón, F.; Jackson, L.E. Soil enzyme activities, microbial communities, and carbon and nitrogen availability in organic agroecosystems across an intensively-managed agricultural landscape. Soil Biol. Biochem. 2014, 68, 252–262. [Google Scholar] [CrossRef]
  15. Sun, R.; Guo, X.; Wang, D.; Chu, H. Effects of long-term application of chemical and organic fertilizers on the abundance of microbial communities involved in the nitrogen cycle. Appl. Soil Ecol. 2015, 95, 171–178. [Google Scholar] [CrossRef]
  16. Chaudhry, V.; Rehman, A.; Mishra, A.; Chauhan, P.S.; Nautiyal, C.S. Changes in bacterial community structure of agricultural land due to long-term organic and chemical amendments. Microb. Ecol. 2012, 64, 450–460. [Google Scholar] [CrossRef] [PubMed]
  17. Wang, M.; Wang, L.; Cui, Z.; Chen, X.; Xie, J.; Hou, Y. Closing the yield gap and achieving high N use efficiency and low apparent N losses. Field Crop. Res. 2017, 209, 39–46. [Google Scholar] [CrossRef]
  18. Wang, M.; Wang, L.; Cui, Z.; Chen, X.; Hou, Y. Optimizing management of mulched fertigation systems to improve maize production efficiency in northeast China. Agron. J. 2019, 3149, 3140–3149. [Google Scholar] [CrossRef]
  19. Yusoff, M.Z.M.; Hu, A.; Feng, C.; Shirai, Y.; Hassan, M.A.; Yu, C.P. Influence of pretreated activated sludge for electricity generation in microbial fuel cell application. Bioresour. Technol. 2013, 145, 90–96. [Google Scholar] [CrossRef]
  20. Edgar, R.C. UPARSE: Highly accurate OTU sequences from microbial amplicon reads. Nat. Methods 2013, 10, 996–998. [Google Scholar] [CrossRef] [PubMed]
  21. Quast, C.; Pruesse, E.; Yilmaz, P.; Gerken, J.; Schweer, T.; Glo, F.O.; Yarza, P. The SILVA ribosomal RNA gene database project: Improved data processing and web-based tools. Nucleic Acids Res. 2013, 41, 590–596. [Google Scholar] [CrossRef]
  22. R-Project. A Language and Environment for Statistical Computing; R Foundation for Statistical Computing: Vienna, Austria, 2010; ISBN 3-900051-07-0. Available online: http://www.r-project.org (accessed on 30 March 2020).
  23. Parks, D.H.; Tyson, G.W.; Hugenholtz, P.; Beiko, R.G. STAMP: Statistical analysis of taxonomic and functional profiles. Bioinformatics 2014, 30, 3123–3124. [Google Scholar] [CrossRef] [Green Version]
  24. Segata, N.; Izard, J.; Waldron, L.; Gevers, D.; Miropolsky, L.; Garrett, W.S.; Huttenhower, C. Metagenomic biomarker discovery and explanation. Genome Biol. 2011, 12, R60. [Google Scholar] [CrossRef] [PubMed] [Green Version]
  25. Louca, S.; Parfrey, L.W.; Doebeli1, M. Decoupling function and taxonomy in the global ocean microbiome. Science 2016, 353, 1272–1277. [Google Scholar] [CrossRef]
  26. Shen, J.; Zhang, L.; Guo, J.; Ray, J.L.; He, J. Impact of long-term fertilization practices on the abundance and composition of soil bacterial communities in Northeast China. Appl. Soil Ecol. 2010, 46, 119–124. [Google Scholar] [CrossRef]
  27. Luo, P.; Han, X.; Wang, Y.; Han, M.; Shi, H.; Liu, N.; Bai, H. Influence of long-term fertilization on soil microbial biomass, dehydrogenase activity, and bacterial and fungal community structure in a brown soil of northeast China. Ann. Microbiol. 2015, 65, 533–542. [Google Scholar] [CrossRef] [PubMed] [Green Version]
  28. Hamer, M.; Chida, Y. Physical activity and risk of neurodegenerative disease: A systematic review of prospective evidence. Psychol. Med. 2009, 39, 3–11. [Google Scholar] [CrossRef]
  29. Chu, H.; Fujii, T.; Morimoto, S.; Lin, X.; Yagi, K.; Hu, J.; Zhang, J. Community structure of ammonia-oxidizing bacteria under long-term application of mineral fertilizer and organic manure in a sandy loam soil. Appl. Environ. Microbiol. 2007, 73, 485–491. [Google Scholar] [CrossRef] [PubMed] [Green Version]
  30. Zhou, J.; Guan, D.; Zhou, B.; Zhao, B.; Ma, M.; Qin, J. Influence of 34-years of fertilization on bacterial communities in an intensively cultivated black soil in northeast China. Soil Biol. Biochem. 2015, 90, 42–51. [Google Scholar] [CrossRef]
  31. Zhao, J.; Ni, T.; Li, Y.; Xiong, W.; Ran, W.; Shen, B.; Shen, Q.; Zhang, R. Responses of bacterial communities in arable soils in a rice-wheat cropping system to different fertilizer regimes and sampling times. PLoS ONE 2014, 9, e85301. [Google Scholar] [CrossRef] [PubMed]
  32. Zeng, J.; Liu, X.; Song, L.; Lin, X.; Zhang, H.H.; Shen, C.; Chu, H. Nitrogen fertilization directly affects soil bacterial diversity and indirectly affects bacterial community composition. Soil Biol. Biochem. 2016, 92, 41–49. [Google Scholar] [CrossRef]
  33. Fierer, N.; Lauber, C.L.; Ramirez, K.S.; Zaneveld, J.; Bradford, M.A.; Knight, R. Comparative metagenomic, phylogenetic and physiological analyses of soil microbial communities across nitrogen gradients. ISME J. 2012, 6, 1007–1017. [Google Scholar] [CrossRef] [PubMed] [Green Version]
  34. Rousk, J.; Bååth, E.; Brookes, P.C.; Lauber, C.L.; Lozupone, C.; Caporaso, J.G.; Knight, R.; Fierer, N. Soil bacterial and fungal communities across a pH gradient in an arable soil. ISME J. 2010, 4, 1340–1351. [Google Scholar] [CrossRef] [PubMed]
  35. Nemergut, D.R.; Townsend, A.R.; Sattin, S.R.; Freeman, K.R.; Fierer, N.; Neff, J.C.; Bowman, W.D.; Schadt, C.W.; Weintraub, M.N.; Schmidt, S.K. The effects of chronic nitrogen fertilization on alpine tundra soil microbial communities: Implications for carbon and nitrogen cycling. Environ. Microbiol. 2008, 10, 3093–3105. [Google Scholar] [CrossRef] [PubMed]
  36. Lipson, D.A.; Schmidt, S.K. Seasonal changes in an alpine soil bacterial community in the Colorado Rocky mountains. Appl. Environ. Microbiol. 2004, 70, 2867–2879. [Google Scholar] [CrossRef] [Green Version]
  37. Zhou, J.; Jiang, X.; Wei, D.; Zhao, B.; Ma, M.; Chen, S. Consistent effects of nitrogen fertilization on soil bacterial communities in black soils for two crop seasons in China. Sci. Rep. 2017, 7, 3267. [Google Scholar] [CrossRef] [Green Version]
  38. Zhang, H.; Sun, H.; Yang, R.; Li, S.; Zhou, M.; Gao, T.; An, L.; Chen, X.; Dyson, P. Complete genome sequence of a psychotrophic Pseudarthrobacter sulfonivorans strain Ar51 (CGMCC 4.7316), a novel crude oil and multi benzene compounds degradation strain. J. Biotechnol. 2016, 231, 81–82. [Google Scholar] [CrossRef] [PubMed] [Green Version]
  39. Guo, L.; Zheng, S.; Cao, C.; Li, C. Tillage practices and straw-returning methods affect topsoil bacterial community and organic C under a rice-wheat cropping system in central China. Sci. Rep. 2016, 6, 33155. [Google Scholar] [CrossRef] [Green Version]
  40. De Vries, F.T.; Hoffland, E.; Eekeren, N. Van Fungal/bacterial ratios in grasslands with contrasting nitrogen management. Soil Biol. Biochem. 2006, 38, 2092–2103. [Google Scholar] [CrossRef] [Green Version]
  41. Bobbink, R.; Hicks, K.; Galloway, J.; Spranger, T.; Alkemade, R.; Ashmore, M.; Cinderby, S.; Davidson, E.; Dentener, F.; Emmett, B.; et al. Global assessment of nitrogen deposition effects on terrestrial plant diversity: A synthesis stable. Ecol. Appl. 2010, 20, 30–59. [Google Scholar] [CrossRef] [Green Version]
  42. Ramirez, K.S.; Lauber, C.L.; Knight, R.; Bradford, M.A.; Fierer, N. Consistent effects of nitrogen fertilization on soil bacterial communities in contrasting systems. Ecology 2010, 91, 3463–3470. [Google Scholar] [CrossRef]
  43. Bascompte, J. Networks in ecology. Basic Appl. Ecol. 2007, 8, 485–490. [Google Scholar] [CrossRef]
  44. Layeghifard, M.; Hwang, D.M.; Guttman, D.S. Disentangling interactions in the microbiome: A network perspective. Trends Microbiol. 2017, 25, 217–228. [Google Scholar] [CrossRef] [PubMed]
  45. Zhong, Y.; Yan, W.; Shangguan, Z. Impact of long-term N additions upon coupling between soil microbial community structure and activity, and nutrient-use ef fi ciencies. Soil Biol. Biochem. 2015, 91, 151–159. [Google Scholar] [CrossRef]
  46. Zul, D.; Denzel, S.; Kotz, A. Effects of plant biomass, plant diversity, and water content on bacterial communities in soil lysimeters: Implications for the determinants of bacterial diversity. Appl. Environ. Microbiol. 2007, 73, 6916–6929. [Google Scholar] [CrossRef] [PubMed] [Green Version]
  47. Wessén, E.; Hallin, S.; Philippot, L. Differential responses of bacterial and archaeal groups at high taxonomical ranks to soil management. Soil Biol. Biochem. 2010, 42, 1759–1765. [Google Scholar] [CrossRef]
  48. Ramirez, K.S.; Craine, J.M.; Fierer, N. Nitrogen fertilization inhibits soil microbial respiration regardless of the form of nitrogen applied. Soil Biol. Biochem. 2010, 42, 2336–2338. [Google Scholar] [CrossRef]
  49. Garrity, E.G.; Brenner, D.J.; Krieg, N.R.; Eds, J.R.S. Bergey’s manual of systematic bacteriology one of the most comprehensive and authoritative works in the field of bacterial taxonomy Volume 1; Springer: Berlin, Germany, 2005; Volume 2, p. 24144. [Google Scholar] [CrossRef]
  50. Sorokin, D.Y.; Tourova, T.P.; Braker, G.; Muyzer, G. Thiohalomonas denitrificans gen. nov., sp. nov. and Thiohalomonas nitratireducens sp. nov., novel obligately chemolithoautotrophic, moderately halophilic, thiodenitrifying Gammaproteobacteria from hypersaline habitats. Int. J. Syst. Evol. Microbiol. 2007, 57, 1582–1589. [Google Scholar] [CrossRef] [PubMed]
Figure 1. Bacterial abundance detected by real-time PCR across different N gradients. Vertical bars are the standard errors of means. Diverse lowercase letters illustrated significant differences of bacterial abundance among treatments by one−way ANOVA (p < 0.05). N0, N1, N2, N3, and N4 represent N fertilizer was used at a level of 0, 90, 150, 210, and 270 kg ha−1, respectively.
Sustainability 13 11967 g001
Figure 2. Relative abundances of dominant bacterial phyla under different N gradients. N0, N1, N2, N3, and N4 represent N fertilizer being used at a level of 0, 90, 150, 210, and 270 kg ha−1, respectively.
Sustainability 13 11967 g002
Figure 3. The heatmap analysis of the relative abundance of the dominant bacterial genera under different N gradients. N0, N1, N2, N3, and N4 represent N fertilizer being used at a level of 0, 90, 150, 210, and 270 kg ha−1, respectively.
Sustainability 13 11967 g003
Figure 4. Shannon index and Chao index of bacterial communities under different N gradients. N0, N1, N2, N3, and N4 represent N fertilizer being used at a level of 0, 90, 150, 210, and 270 kg ha−1, respectively.
Sustainability 13 11967 g004
Figure 5. Principal coordinate analysis (PCoA) plots of bacterial communities based on OTUs under different N gradients (a). Weighted–Unifrac dissimilarity of the bacterial communities among different N gradients (N0, N1, N2, N3, and N4) (b). N0, N1, N2, N3, and N4 represent N fertilizer being used at a level of 0, 90, 150, 210, and 270 kg ha−1, respectively.
Sustainability 13 11967 g005
Figure 6. Linear discriminant analysis Effect Size (LEfSe) for different N gradients at different classification levels (a). The cladogram consists of phylum, class, order, family, and genus levels in order from inside to outside. Red, green, blue, purple, and cyan circles indicate taxa enriched in N0, N1, N2, N3, and N4, respectively, while the yellow circles represent the taxa without significant differences among the different N gradients. Histogram of the linear discriminant analysis (LDA) scores for differentially abundant genera (b). N0, N1, N2, N3, and N4 represent N fertilizer being used at a level of 0, 90, 150, 210, and 270 kg ha1, respectively.
Sustainability 13 11967 g006
Figure 7. Canonical correspondence analysis (CCA) of bacterial community changes with environmental variables under different N gradients. N0, N1, N2, N3, and N4 represent N fertilizer was used at a level of 0, 90, 150, 210, and 270 kg ha−1, respectively. OC: soil organic carbon, EC: soil electrical conductivity, NH4+-N: soil ammonium nitrogen, NO3-N: soil nitrate nitrogen, AN: soil available nitrogen.
Sustainability 13 11967 g007
Figure 8. Bacterial co-occurrence networks of different N gradients from OTUs. A connection represented a strong (Spearman’s correlation coefficient ρ > 0.7) and significant (p < 0.05) correlation. The node colors in the network represent different major phyla, the node size represents its relative abundance, the connection thickness of the edge represents the value of Spearman’s correlation coefficients, a red line indicates a negative correlation between two individual nodes, and a green line indicates a positive correlation.
Sustainability 13 11967 g008
Table 1. Soil physicochemical properties under different N gradients.
TreatmentOC
(mg kg−1)
pHECNH4+-N
(mg kg−1)
NO3-N
(mg kg−1)
AN
(mg kg−1)
N0 a12.56 ± 1.27a b6.96 ± 0.09a0.05 ± 0.03b0.34 ± 0.07b3.38 ± 0.27d92.65 ± 1.55c
N113.84 ± 0.20a6.86 ± 0.26ba0.08 ± 0.02b0.59 ± 0.09a4.36 ± 0.11d93.47 ± 0.76c
N214.10 ± 0.32a6.71 ± 0.11ba0.06 ± 0.03b0.71 ± 0.15a7.38 ± 0.53c94.01 ± 1.31c
N313.86 ± 0.74a6.69 ± 0.31ba0.18 ± 0.02a0.75 ± 0.03a9.82 ± 1.82b107.70 ± 6.56b
N410.39 ± 1.15b6.52 ± 0.30b0.14 ± 0.03a0.77 ± 0.13a12.38 ± 1.94a114.86 ± 3.23a
a N0, N1, N2, N3, and N4 represent N fertilizer was used at a level of 0, 90, 150, 210, and 270 kg ha−1, respectively. b Different letters within the same column indicate significant difference between treatments tested by one-way ANOVA (p < 0.05). Values are the means ± SE (n = 3). OC: soil organic carbon, EC: soil electrical conductivity, NH4+-N: soil ammonium nitrogen, NO3-N: soil nitrate nitrogen, AN: soil available nitrogen.
Table 2. Relative abundance (%) of predicted functional groups in the bacterial community under different N gradients.
Bacterial Functional GroupGenusN0 aN1N2N3N4
Nitrate_reduction162.14 ± 0.11b b2.33 ± 0.07ba2.42 ± 0.12a2.30 ± 0.11ba2.14 ± 0.12b
Ureolysis92.02 ± 0.02a2.03 ± 0.06a2.01 ± 0.13a1.92 ± 0.21a2.01 ± 0.10a
Nitrate_respiration61.81 ± 0.25ba1.67 ± 0.12b2.08 ± 0.06a1.97 ± 0.21ba1.86 ± 0.25ba
Nitrate_denitrification30.26 ± 0.04ba0.34 ± 0.11a0.35 ± 0.08a0.22 ± 0.01b0.21 ± 0.03b
Nitrogen_fixation20.56 ± 0.12a0.33 ± 0.04b0.50 ± 0.04a0.31 ± 0.03b0.29 ± 0.04b
Nitrate_ammonification20.56 ± 0.12a0.33 ± 0.04b0.50 ± 0.04a0.31 ± 0.03b0.29 ± 0.04b
Aerobic_ammonia_oxidation10.93 ± 0.07b1.12 ± 0.09ba1.40 ± 0.13a1.20 ± 0.24ba1.35 ± 0.26a
Aerobic_nitrite_oxidation10.02 ± 0.00c0.04 ± 0.01b0.03 ± 0.01c0.03 ± 0.01cb0.05 ± 0.01a
a N0, N1, N2, N3, and N4 represent N fertilizer being used at a level of 0, 90, 150, 210, and 270 kg ha−1, respectively. b Different letters within the same column indicate significant difference between treatments tested by one-way ANOVA (p < 0.05). Values are the means ± SE (n = 3).
Publisher’s Note: MDPI stays neutral with regard to jurisdictional claims in published maps and institutional affiliations.

