Article

Towards Equity in Micromobility: Spatial Analysis of Access to Bikes and Scooters amongst Disadvantaged Populations

Department of Civil and Environmental Engineering, Southern Methodist University, Dallas, TX 75275, USA
*
Author to whom correspondence should be addressed.
Sustainability 2021, 13(21), 11856; https://doi.org/10.3390/su132111856
Submission received: 2 September 2021 / Revised: 9 October 2021 / Accepted: 19 October 2021 / Published: 27 October 2021
(This article belongs to the Collection Transport Inequalities, Transport Poverty and Sustainability)

Abstract

:
In recent years, cities around the world have launched various micromobility programs to offer more convenient and efficient mobility options that make transit networks more accessible. However, the question of whether micromobility services are accessible to and equitably distributed amongst all populations still remains unanswered. In this study, we investigate the spatial accessibility of disadvantaged communities, such as racial and ethnic minorities, low-income populations, and transit-dependent populations, to scooter and bike services. The ultimate goal of this study is to examine associations between the level of access to bikes and scooters and the racial and social characteristics of communities throughout the City of Austin, Texas. To achieve this goal, first, equity analysis with a Lorenz curve was performed to understand how bike and scooter accessibility is distributed among the population. Then, both Ordinary Least Squares (OLS) and Geographically Weighted Regression (GWR) models were generated to explore factors associated with bike and scooter accessibility. The analysis of the residuals showed more consistent results in the GWR models than in the OLS models. The equity analysis with the Lorenz curve conducted herein reveals extreme inequity in access to micromobility services. Almost 80 percent of residents have no access to bikes and scooters. Access is even worse for transit-dependent people when compared to the general population. The regression models further revealed that areas with a higher proportion of Black residents were less likely to have access to both bikes and scooters, yet positive associations were found for both bike and scooter accessibility and low-income populations. Increased understanding of spatial access to bikes and scooters can support ongoing efforts to deliver equitable transportation systems, improve transportation alternatives for disadvantaged populations, and support future policy actions related to bike and scooter services.

1. Introduction

The transportation sector generates the largest share of greenhouse gas emissions [1] in the United States, and within the transportation sector, road transportation is the biggest source of CO2 emissions. Urban administrators have sought to encourage the use of micromobility as an effective means of mobility and a sustainable form of transportation to substitute for personal car trips. Micromobility has the potential to enhance transportation options, support urban sustainability goals, promote eco-friendly landscapes, and relieve burdens of vehicle ownership on cities and societies. Moreover, as a more socially distanced means of travel, micromobility has attracted attention during the global pandemic [2], which has extremely influenced travel behavior [3]. Micromobility, therefore, presents opportunities to address environmental, social, and economic sustainability goals.
Micromobility solutions include small-scale vehicles, such as bicycles, scooters, skateboards, segways, and hover-boards, can be human-powered or electric, and often cover short-distance trips [2,4]. Shared micromobility programs, such as docked and dockless bikes and, recently, dockless electric scooters (i.e., e-scooters), have become increasingly ubiquitous in cities worldwide [5]. Dockless e-scooters debuted in numerous US cities in 2018, and by the end of 2018, over 85,000 electric scooters were available for public use [6]. Scooters quickly gained popularity, offering approximately 38.5 million trips in 2018, compared to 52 million rides on shared bikes [7]. These programs, by offering short-term rental mobility devices, are potentially able to minimize the financial burden of owning and maintaining a personal vehicle, thus increasing mobility and accessibility for those who have fewer transportation alternatives due to a lack of access or financial limitations [5]. Moreover, the literature has widely highlighted the environmental and urban congestion benefits of micromobility in highly dense cities [6]. Despite the benefits of micromobility vehicles, barriers to accessibility for disabled and low-income individuals and unequal adoption across communities have also been noted by previous studies [8].
Evaluating the level of accessibility is a key component of transportation equity studies. According to Martens and Golub [9], in an equitable transportation system, everyone would have an adequate level of accessibility to benefits and opportunities. Accessibility is a measure of one’s involvement in society and ability to participate in a variety of activities given a set of constraints, including money, time, comfort, and resources [10]. Additionally, transport equity studies have applied the capability approach to transportation systems to measure the level of accessibility, where accessibility is considered in terms of an individual’s ability to access and use the transportation system [11,12,13]. Building on both the capability approach and Marten’s framework, Dill and McNeil [5] argued that shared vehicles can only increase accessibility if an individual is both physically close to the vehicle and able to use it to satisfy their travel needs. Therefore, this analysis of access to shared micromobility services is focused on these two measures: physical closeness and ability to use.
Accessibility is a crucial requirement for participating in life-enhancing activities, such as jobs, education, social networks, and healthcare [14]. Previous studies have situated access to public places as the beginning point of investigating micromobility programs [2]. A substantial amount of existing work has focused on analyzing and describing the wide disparities in accessibility across various groups as defined by gender, ethnicity, income, and mode availability [10,15,16,17]. Unequitable access to shared micromobility services may limit these advantages for unprivileged populations, therefore exacerbating inequities within a community. Although there have been studies investigating the concept of equity in bike accessibility, no study, to our knowledge, has analyzed the equity in electric scooter accessibility, as dockless e-scooter services have only recently been introduced to U.S. cities [5]. There is, therefore, a need to thoroughly analyze the spatial equity of these new systems and to compare them to other existing modes, such as docked and dockless bike-sharing systems.
This study investigates how scooters are spatially accessible across various socially disadvantaged populations. The ultimate goal of this study is to explore associations between bike and scooter accessibility and the racial and social characteristics of communities where these services are located. The research methodology takes advantage of publicly available micromobility data to calculate the level of accessibility across the City of Austin, Texas. Shared electric micromobility has operated in the City of Austin for the past two years. At one point, eight licensed micromobility companies operated approximately 15,000 shared electric scooters in Austin [18]. In this study, equity analysis with a Lorenz curve was performed to first understand how accessibility is distributed among the population. Then, a spatial autocorrelation analysis was conducted, where the spatial correlation of scooter accessibility distribution was evaluated by determining Moran’s Index. Finally, both Ordinary Least Squares (OLS) and Geographically Weighted Regression (GWR) models were generated to explore the association between bike and scooter accessibility and the social equity characteristics of the residents.
The research findings contribute to the existing literature in several ways. Very limited research, to date, has considered dockless micromobility vehicles and compared both scooter and bike accessibility. Although the transportation literature has addressed equity in bike accessibility, still little is known about the equity in shared scooters. Moreover, very few studies have compared OLS and GWR models in transportation studies. This paper is structured as follows: The next section provides a literature review of related and previous work. Next, the analysis methods are discussed. Then, the results are presented, followed by a discussion. Finally, concluding remarks are provided.

2. Literature Review

2.1. Spatial Equity

Specifically, equality, in a social context, emphasizes uniformity and sameness in burdens and opportunities experienced across populations. On the other hand, equity emphasizes fairness based on need in the allocation of resources and treatment of outcomes [19]. However, it is often not practical or efficient to provide the same level of accessibility to all residents in a city. Therefore, it becomes more crucial for local governments to find the most optimal allocation strategies to provide opportunities to those who cannot afford to access services or are from specific demographic communities with unique needs (i.e., equity). Tsou et al. [20] recommended a spatial analysis perspective for examining how appropriate public infrastructures and facilities have been distributed among inhabitants of the city. Hence, in the framework of public facility planning, spatial proximity—or spatial accessibility—can act as an indicator of equity [21]. Generally, spatial equity deals with the “reduction of spatial disparities” [22,23]. Spatial equity is particularly defined as addressing the benefits and opportunities at a level that is equitable or fair throughout a geographical space [24].

2.2. Accessibility of Micromobility Services

Following the introduction of micromobility services, their benefits for cities and contributions to the transportation network were broadly investigated [25]. However, many studies have focused on examining travel behavior [18,26,27,28], environmental impacts [29,30,31], interaction with public transit [32,33], social impacts [34,35], and public safety concerns [30,36,37,38,39,40,41].
Zakhem and Smith-Colin explored various methods for analyzing micromobility parking and high-used corridors [43]. Concerning travel behavior, several studies have revealed that dockless micromobility options are used for neither last-mile trips [43] nor commuting trips [27,44]. Jiao and Bai [18] showed that the usage of shared e-scooters in Austin, TX is correlated to different factors, such as high population density, higher educational attainment areas [45], recreational areas, and areas with lower income. However, studies have not shown the same correlation with income in other cities (e.g., in Minneapolis [26] or Washington D.C. [27]). In another study, Caspi et al. [25] used spatial regression techniques to explore how different factors affect scooter trip generation. They found out that areas with high student populations were associated with high scooter usage.
An additional factor to consider for sustainable mobility is gender equity. Although it has been shown that there are significant differences between the mobility demands and behaviors of women and men [46] in terms of mode choice, daily commutes, and journey planning [45], to name a few, still little is known about the impact of gender on micromobility riding behavior or choosing scooters or bikes over other modes of transportation. In this regard, Gonzalez-Sanchez et al. explored the challenges and strategies for gender equity and sustainable mobility. Moreover, Aman et al. utilized user-generated online reviews to identify the impact of gender on user perceptions toward scooters [47] and Mobility as a Service (MaaS) [48]. The findings showed that women were more satisfied and showed more positive sentiments toward the scooter-riding experience, although scooters were still a male-dominated mode of transportation. In yet another study, Nikiforiadis et al. conducted a survey to understand users’ and non-users’ opinions toward scooter services, and the results showed that men were more likely to use electric scooters [49]. In another study, Galvic et al. assessed individuals’ preferences for shifting to scooters for different scenarios. The findings indicated that available infrastructure has a great influence on user willingness to switch to scooters [50]. In this regard, Campisi et al. conducted a survey and investigated the socio-eco-friendly performance of electric scooters.
Qian and Niemeier quantitatively assessed the potential for docked bike-sharing systems to ensure disadvantaged communities’ better access to essential services and jobs [51]. By developing a spatial index, this study concluded that the accessibility to jobs and essential services increases by locating bike stations near disadvantaged communities. Qian and Jaller’s work focusing on docked bike-sharing system utilization in underprivileged communities used a binomial regression model to estimate ridership [52]. They found that two-thirds of the annual bike-sharing trips were generated in disadvantaged communities across all stations. Moreover, ridership increases with an increased employment rate in disadvantaged areas [51]. One of the first studies examining spatial equity in access to dockless bike-sharing systems was by Mooney et al. They found that more bikes were available in neighborhoods with higher incomes, higher educational attainment, and local community resources. Similarly, to previous docked bike-sharing system studies, they noted modest access inequality across sociodemographic lines [53]. Despite numerous studies on bike-sharing systems, there has been limited analysis of shared e-scooter systems and equity. Table 1 summarizes the findings and sociodemographic and economic indicators used in previous studies.

3. Methodology

In this study, a Lorenz curve was utilized to first understand how accessibility is distributed among different population groups. Then, a spatial autocorrelation analysis was conducted, where the spatial correlation of scooter and bike accessibility distribution was evaluated using Moran’s Index. Finally, both Ordinary Least Squares (OLS) and Geographically Weighted Regression (GWR) models were generated to explore the association between bike and scooter accessibility and the social characteristics of different areas within the city.

3.1. Accessibility

As mentioned earlier, building on both the capability approach and Marten’s framework, shared vehicles can only be called accessible if individuals are both physically close to the vehicle and able to use it to satisfy their travel needs [5]. In other words, it would be misleading to only consider the geographical proximity of micromobility vehicles as an accessibility indicator. In this study, analysis of accessibility for shared micromobility services is focused on two measures—physical closeness and ability to use. To capture these two measures, the average number of scooter and bike trips in each census tract during the time that micromobility vehicles were available and utilized in the area were used as a proxy for accessibility. Trip history not only showed that scooters were physically available for riders, but also that riders were able to overcome the barriers of renting micromobility vehicles. In other words, when a trip was made, it showed that vehicles were available, that the individual could afford to pay the fees by providing a credit or debit card for collateral, was physically and mentally able to ride, and had sufficient knowledge, skill, and ability to rent the vehicle using the mobile app technology.
The City of Austin’s open data platform provides daily trip data for different types of shared micromobility vehicles [55]. In this paper, we were interested in comparing two micromobility modes: e-scooters and bikes (both docked and dockless bikes). Thus, the authors extracted 5,725,436 e-scooter trips and 494,895 dockless bike trips, as well as 1,048,575 docked bike trips. As docked bikes were only available in very few census tracts, in this study, docked and dockless bike datasets were combined and were not analyzed separately. Trip data available beyond February 2020 were not used for the analysis due to travel irregularities resulting from the COVID-19 outbreak. The extracted dataset was cleaned by removing all out-of-bounds trips. Second, trips with a false start or with a very short duration (<2 min), a very short distance (<0.02 min.), long duration (>90 min), or long distance (>10 min.) were removed [44,45]. After cleaning, the final e-scooter dataset had 4,938,050 e-scooter trips, or 86.25% of the raw dataset. The final bike dataset (dockless and docked) had 1,427,761 bike trips, or 92.50% of the raw dataset. Table 2 provides the descriptive statistics for the two major performance measures: trip duration and distance traveled for bike and e-scooter vehicles. This table shows that the duration and distance traveled by bikes were higher than the duration and distance traveled by e-scooter vehicles. For example, the average duration for bike trips was 14.46 min, while the average duration for e-scooter trips was 11.02 min. The average distance for bike trips was 1.60 miles, whereas the average distance for e-scooter trips was 1.02 miles.

3.2. Social Characteristics

To identify socially disadvantaged groups across the city, census-tract-level datasets from the US Census Bureau were used (Figure 1). The percentage of the total population of socially disadvantaged groups living in each census tract was calculated and presented as a social equity indicator. The calculated percentages were grouped by quartiles. Tracts with the highest concentration of each social characteristic are shown in Figure 1 (Black, Asian, and Hispanic in Figure 1a, and transit dependents and low-income population in Figure 1b). As can be seen, Black individuals mostly reside in the eastern part of the city. Asians live mostly in the west. Transit-dependent residents are mostly located in the central part of the city. Low-income individuals are slightly more dispersed and are located in the east and the city center.

3.3. Lorenz Curve

An equity analysis with the Lorenz curve was used to further capture inequities that exist within the city in micromobility allocation. In the context of economic studies, the Lorenz curve is utilized to visually present the cumulative distribution of resources among people [56]. Various studies have adopted the Lorenz curve to depict the distribution of transportation infrastructure across the population (e.g., [19,57,58]). The graph expresses the percentiles of the residents in terms of wealth or resources on its horizontal and vertical axis, respectively. The straight diagonal line shows perfect equality, while the Lorenz curve, which is beneath the equality line, presents the existing distribution of resources. When the Lorenz curve overlaps with the equality line (i.e., the area between them is zero), complete equality happens, showing that wealth is evenly distributed.

3.4. Spatial Autocorrelation

The transportation literature has frequently utilized spatial autocorrelation analysis to evaluate spatial distribution (e.g., [59,60,61]). The spatial correlation of scooter accessibility was evaluated by determining Moran’s Index (I). Moran’s Index examines the significance level of spatial autocorrelation. The range of Moran’s Index is from −1 to 1. Values below zero indicate a negative spatial correlation, i.e., the neighboring census tracts tend to be dissimilar (concentration of high values with low values). The higher the Moran value (or lower for negative values), the higher the correlation. A Moran value of zero shows that census tracts are randomly distributed throughout the city. On the other hand, if the Moran value is positive, similar census tracts tend to be located close to each other (i.e., low values with low values and high values with high values) [62].

3.5. Regression Models

To understand the relationship between scooter accessibility and the social characteristics of the residents, two different models were generated. Various studies in transportation have generated GWR and OLS models, compared the results, and often reported that GWR models yield better-fitting results than those of OLS models (e.g., [63]). An Ordinary Least Squares (OLS) regression model was developed first. In this model, we assume that residuals are independently distributed. This assumption can be tested using Moran’s Index.
y = β 0 + x 1 β 1 + x 2 β 2 + + x n β n + ε
where:
y: dependent variable (scooter accessibility),
β0: intercept,
xi: social characteristics,
β0: regression coefficient of social characteristic i, and
ε: error term.
If Moran’s Index reveals a significant spatial autocorrelation in the residuals, a Geographically Weighted Regression (GWR) model should be implemented to avoid violating the independence assumption. In the case of the GWR, while generating a model, there is a need to consider the autocorrelation of the observations, which is the nature of spatial data. GWR takes into consideration the spatial aspect of a dataset. Unlike traditional statistical models, GWR provides a different coefficient for each social characteristic in different locations as defined by its coordinates (ui, vi). The dependent variable is estimated according to Equation (2):
y = β 0 + x 1 β 1 u 1 ,   v 1 + x 2 β 2 u 2 ,   v 2 + + x n β n u n ,   v n + ε
Cardozo et al. highlighted the advantages of the GWR models as follows: (1) GWR models are more detailed and accurate, (2) they help researchers investigate local spatial patterns, and (3) estimation errors are often lower than in models generated using OLS [64].

4. Results

Figure 2 shows the distribution of scooter, dockless bike, and docked bike accessibility in the City of Austin. As can be seen, micromobility services are more accessible in the central parts of the city (as represented by the lighter color shading).

4.1. Equity Analysis

As discussed above, in the economics literature, Lorenz curves are a graphical statement of the cumulative allocation function of wealth/resources in a population. The distribution of scooter and bike accessibility across populations of different demographics is depicted using the Lorenz curve (Figure 3 and Figure 4). The lines in Figure 3 and Figure 4 indicate an inequitable distribution of bike and scooter accessibility. As can be seen, approximately 80 percent of the total population, shown by the black line, has almost zero (less than 5 percent of resources) access to scooters. The fact that the majority of the population lives in rural areas and scooters can hardly be found in places other than the inner parts of the city can be the reason behind this. The findings also show that scooters have been distributed slightly more equitably than bikes. Although there is no huge difference between the distributions of accessibility according to the various social characteristics of residents, Asians and low-income populations have the highest accessibility, and transit-dependent and Black populations have the lowest accessibility comparing to the others. Although micromobility is claimed to work as a feeder for transit services, public-transit-dependent populations receive the lowest accessibility to the services compared to other population groups.

4.2. Regression Analysis

Scooter accessibility was modeled using both OLS and GWR. For modeling purposes, the ArcGIS Modeling Spatial Relationships Toolset was utilized. Models with various combinations of social characteristics were examined. Ultimately, the OLS model with the strongest explanatory power was selected. The selected model contains two different social characteristics for predicting scooter accessibility; a GWR model was also developed with the same social characteristics.
To examine if the variables were geographically independent, Moran’s Index was estimated (Table 3). All variables showed values of Moran’s Index that were higher than expected (E(I)); therefore, positive geographical autocorrelation is shown. The variables were all clustered. As mentioned before, a higher Moran value indicates a stronger spatial correlation. Thus, the Black, Hispanic, and low-income populations have the highest autocorrelations amongst all variables.
The bivariate correlation between the potential candidates for the regression analysis was estimated to examine the multicollinearity among the variables (Table 4). There was a strong positive correlation between the transit-dependent population and scooter accessibility (0.43), as well as between the low-income population and accessibility (0.27) and Asian residents and the total population (0.26). In addition, Asian and low-income residents both had a statistically positive significant correlation with bike accessibility. Scooter and bike accessibility also showed a significant correlation. On the other hand, there was a negative correlation between Hispanic and Asian residents (−0.46). Therefore, all correlation coefficients were lower than the “danger level” of 0.70 [65].
The goal of the generation of the models was to resolve a high descriptive capability with a low number of easily attained social characteristics in order to predict micromobility accessibility. The final model for the scooters featured two significant independent variables, of which one was race-related (Black) and the other represented low-income populations (Table 5). The VIFs that indicated redundancy among variables were all less than two, showing no multicollinearity issues among the variables (VIFs around 7.5 or higher are problematic). The F-statistic values and associated p-values showed the high statistical significance of the model. The Koenker statistic indicated unbiased standard errors. The statistically significant Jarque–Bera statistic revealed that the residuals deviated from a normal theoretical distribution. Diagnostics from the OLS model’s prediction suggest that the model cannot be trusted.
An OLS model was also developed for bikes (Table 6). The regression model shows that only Black and low-income residents had a significant explanatory effect on bike accessibility. The VIF was also computed for all variables, and the results showed no redundancy. The Jarque–Bera statistic shows when a model is biased and there is a need to perform GWR.
To avoid spatial heterogeneity, a GWR model was generated by forecasting the scooter and bike accessibility (Table 7). As can be seen in Table 7, the effective number value for the scooter model was 6.01 (23.5 for bikes), which was associated with the kernel bandwidth. The GWR models were compared based on their AIC values. In this study, the AIC value for the OLS model was 272.897, while for the GWR model, it was 197.861. So, there was a difference of 75.036, which is strong evidence for the improvement in the results based on the local model (GWR) relative to the global model (OLS). In the bike model, the improved value of R square based on the GWR model was 0.20, which was two times higher than that of the OLS model. The AIC values for the two models slightly differed by more than three; therefore, the GWR model resulted in a better fit than the OLS model. Moreover, the residual analysis revealed more consistent results in the GWR model than in the OLS model. As can be seen, there were positive associations between the low-income population and accessibility; however, the coefficient for the bike model was considerably higher than the one in the scooter model. Both Hispanic and transit-dependent populations showed a negative correlation with accessibility in both models. In the bike model, Black populations had both negative and positive associations with accessibility across the city. It should be noted that GWR models generate different coefficients for different parts of a geographic area while taking local characteristics into consideration.

5. Discussion

Cities across the United States have launched various micromobility programs to promote active modes of transportation and restore their public transit services. However, several organizations have complained about the “lack of ethnic and/or income diversity” among riders [66]. Although there have been some studies that investigate equity in bike accessibility, no study, to our knowledge, has assessed the equity of electric scooter accessibility. In this study, the ultimate goal was to explore if there was any association between bike and scooter accessibility and race/ethnicity (Black, Asian, and Hispanic), low-income residents, or the transit-dependent population. Another significant contribution of this paper is that it compares scooter and bike accessibility in one city.
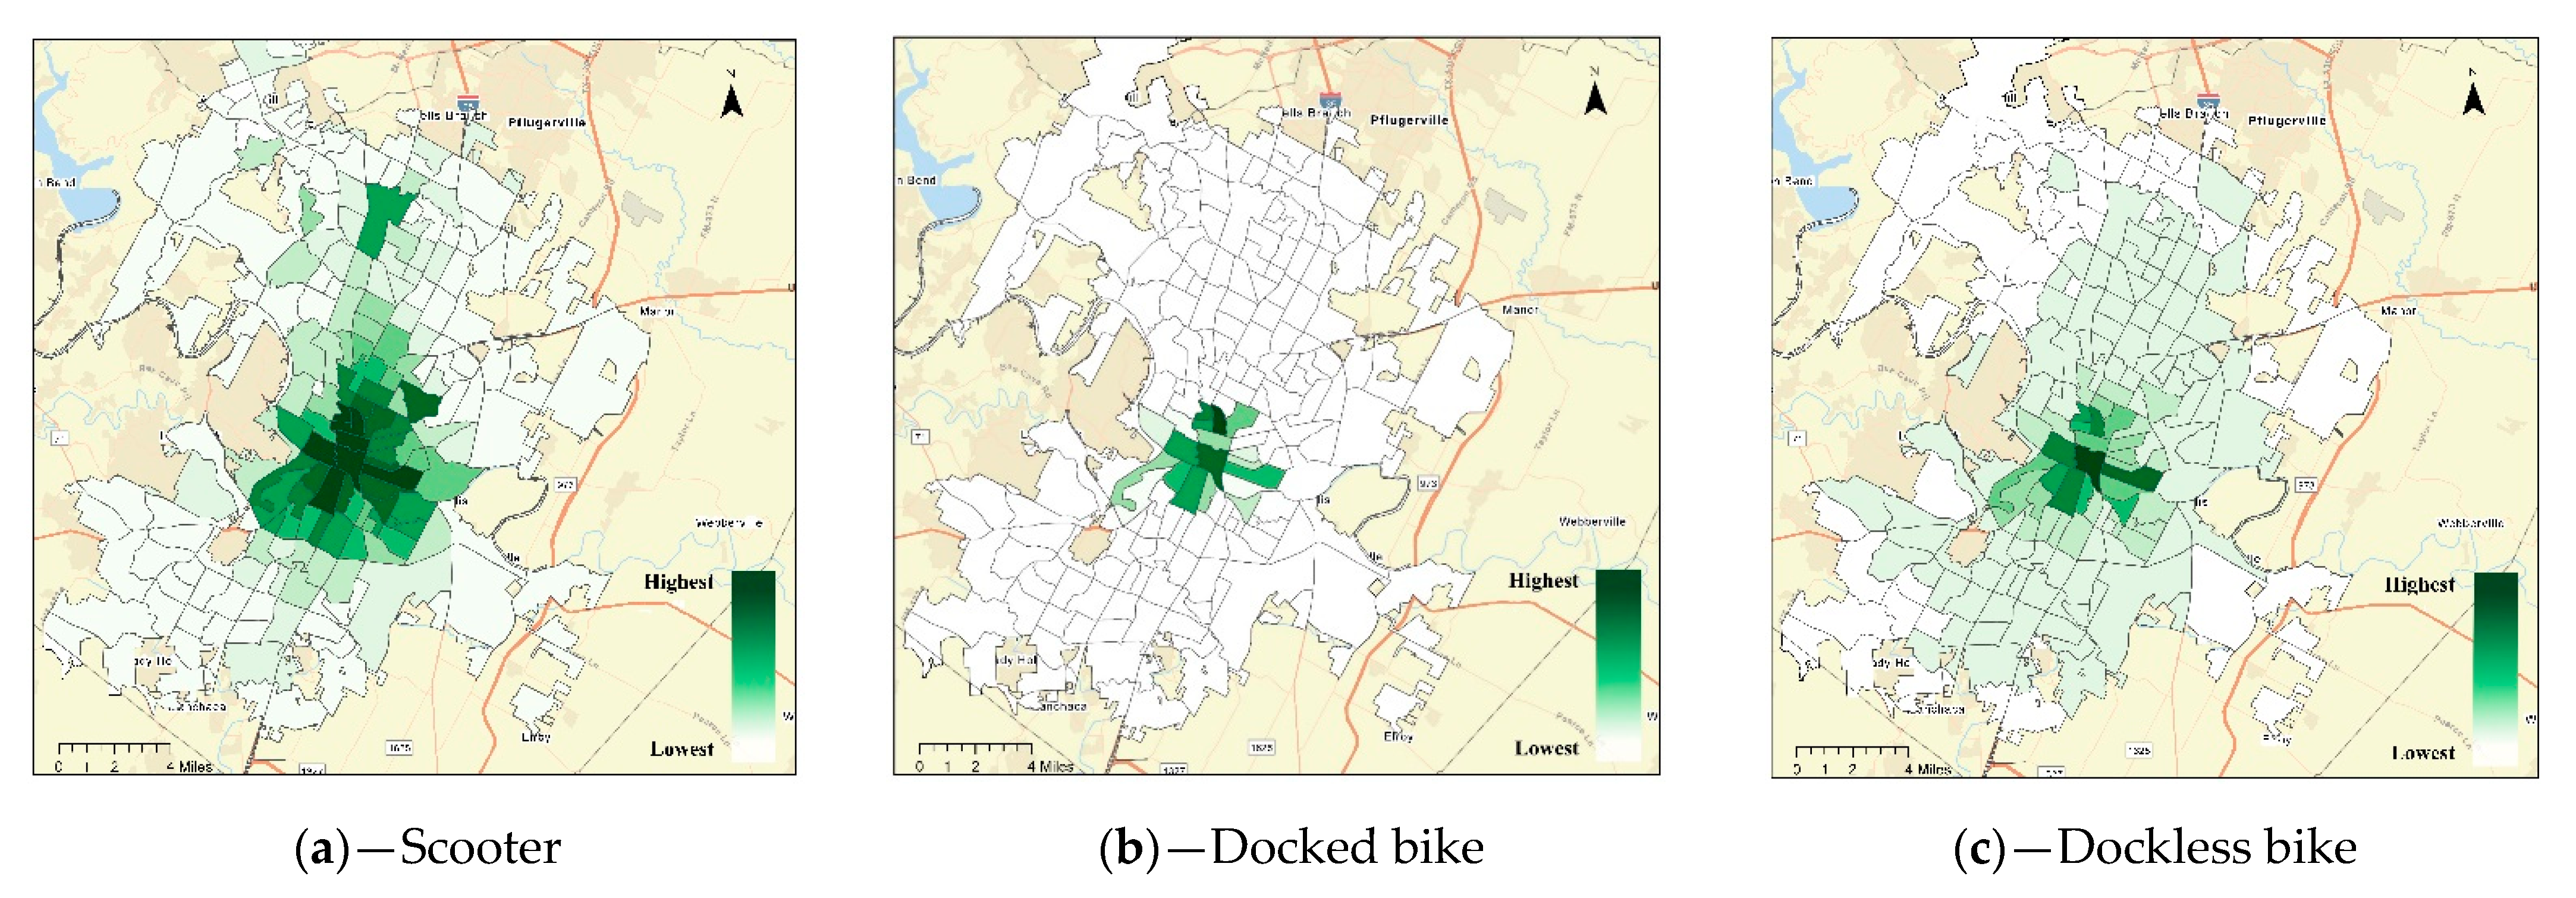
The results show that although the number of micromobility devices has grown rapidly across the city, the majority of the population has no access to these services. The equity analysis revealed that almost 80 percent of residents had no access to bikes or scooters. Both bikes and scooters were disproportionally more accessible in the central census tracts, where downtown and the University of Texas at Austin’s main campus are located. Within these areas, less racial and ethnic diversity can be seen, as minorities tend to be clustered in peripheral areas (mostly south and east) of the city. It is understood that different areas in terms of land use (e.g., residential, commercial, and entertainment, to name a few) have different spatial and temporal micromobility demands. However, the lack of access among underprivileged populations only highlights inequities for these communities.
Moderate evidence of differences in access to bikes and scooters by race at the census tract level was detected across the City of Austin. The regression models revealed that census tracts with a higher proportion of Black residents were less likely to have access to both bikes and scooters. As the literature has shown that the perceived value of micromobility vehicles can vary with socio-cultural aspects and community characteristics [67], differences in findings by race are not unexpected. Furthermore, bikes are frequently considered a potential mode of transportation for either very low-income or very high-income families [68]. The regression results support this, as positive associations for both bike and scooter accessibility amongst low-income populations were observed. Supporting these regression findings are Lorenz curve findings showing that Asians had a slightly higher level of accessibility to bikes and scooters than those of other social equity categories. It should be noted that the sociodemographic analysis also showed that Asians also resided in more affluent areas of the city. The correlation analysis also showed negative associations between the Asian population and the Hispanic and Black populations. Moreover, the Hispanic and Black populations often resided in less affluent areas.
Micromobility services were meant to act as a feeder for public transit and were intended to further address transit deserts [69]. Various studies have shown that, unlike private car users, public transit users are more likely to rent electric bikes or switch to e-bikes from public transit [70,71,72]. However, this equity analysis showed that 95 percent of transit-dependent populations had access to only 10 percent of the available micromobility services. As micromobility services and public transit systems are designed and managed by different organizations, a “consistent operation mechanism” between bike/scooter companies and public transportation organizations should be implemented and guided by local policy [73] to ensure access for transit-dependent users. For instance, Bieliński et al. proved that placing bikes close to public transportation stations is an effective strategy for increasing ridership [70].

6. Conclusions

Shared micromobility programs offer great promise for bridging the gap in first-mile/last-mile transportation needs and for expanding transportation options. However, bike and scooter allocation and planning programs seem to result in inequitable access across disadvantaged populations. A review of the literature showed that very few studies have explored the equity aspects of access to micromobility services. To fill this gap, in this study, we examined the associations between bike and scooter accessibility and the racial and social characteristics of communities where these services are located. The research findings contribute to the existing literature in several ways. Very limited research, to date, has considered dockless micromobility vehicles, including both scooter and bike accessibility, amongst disadvantaged populations. Moreover, very few studies have compared OLS and GWR models in transportation studies.
In the case of the City of Austin, although the number of micromobility devices has grown rapidly within the city, a large percentage of the population has no access to micromobility services. Both bikes and scooters are disproportionally more accessible in the central census tracts of the city, where downtown and the University of Texas at Austin’s main campus are located. Moderate evidence of inequity in access to bikes and scooters by race at the census tract level was found across the City of Austin. The findings show that census tracts with a higher proportion of Black residents are less likely to have access to both bikes and scooters. Moreover, the Lorenz curves showed that Asian residents, who tend to live in more affluent areas of the city, have a slightly higher level of access to bikes and scooters when compared to populations represented by other groups.
From the methodological perspective, this study showed that micromobility vehicles and social characteristics share significant spatial autocorrelation. Therefore, GWR models work better than OLS models in the prediction of bike/scooter accessibility. The GWR models revealed stronger relationships between social characteristics and accessibility in the central part of the city.
Despite its merits and contributions to micromobility accessibility research, this study includes limitations that must be considered. Assessment of bike/scooter accessibility is a very complex task, and various factors other than social equity characteristics influence the level of accessibility. Multi-source and more fine-grained datasets may improve the quality of the findings. Unfortunately, the City of Austin only provides census-tract-level bike and scooter trip information. Finally, the models used in this study were both linear regression models and only considered linear interpolation. Therefore, they reflect certain limitations. In future work, investigating the impact of other social factors, such as gender, education level, and built environment, on micromobility ridership might prove important. In addition, other aspects of equity in micromobility ridership, such as digital literacy and disability, might prove to be an important area for future research. Moreover, this study considered trip information prior to the COVID-19 pandemic; future research could examine the impact of the pandemic on micromobility ridership and, more specifically, the impacts on disadvantaged areas during the pandemic.

Author Contributions

Conceptualization, J.J.C.A. and J.S.-C.; methodology, J.J.C.A. and J.S.-C.; software, J.J.C.A. and M.Z.; validation, J.J.C.A. and J.S.-C.; analysis, J.J.C.A. and J.S.-C.; data curation, J.J.C.A. and M.Z.; writing—original draft preparation, J.J.C.A., M.Z. and J.S.-C.; writing—review and editing, J.J.C.A. and J.S.-C.; visualization, J.J.C.A. All authors have read and agreed to the published version of the manuscript.

Funding

This research received no external funding.

Data Availability Statement

The datasets used in this study are all publicly available.

Acknowledgments

The authors would like to thank Southern Methodist University for the financial support of this project.

Conflicts of Interest

The authors declare no conflict of interest.

References

  1. EPA. Sources of Greenhouse Gas Emissions; U.S. Environmental Protection Agency: Washington, DC, USA, 2021. [Google Scholar]
  2. Bennett, C.; Ackerman, E.; Fan, B.; Bigham, J.; Carrington, P.; Fox, S. Accessibility and the Crowded Sidewalk: Micromobility’s Impact on Public Space. In Proceedings of the Designing Interactive Systems Conference, 28 June–2 July 2021; pp. 365–380. Available online: https://www.cs.cmu.edu/~jbigham/pubs/pdfs/2021/crowded-sidewalk.pdf (accessed on 15 June 2021).
  3. Javadinasr, M.; Magassy, T.B.; Rahimi, E.; Davatgari, A.; Salon, D.; Bhagat-Conway, M.W.; Chauhan, R.S.; Pendyala, R.M.; Derrible, S.; Khoeini, S. The Enduring Effects of COVID-19 on Travel Behavior in the United States: A Panel Study on Observed and Expected Changes in Telecommuting, Mode Choice, Online Shopping and Air Travel. arXiv 2021, arXiv:2109.07988. [Google Scholar]
  4. Abduljabbar, R.L.; Liyanage, S.; Dia, H. The Role of Micro-Mobility in Shaping Sustainable Cities: A Systematic Literature Review. Transp. Res. Part D Transp. Environ. 2021, 92, 102734. [Google Scholar] [CrossRef]
  5. Dill, J.; McNeil, N. Are Shared Vehicles Shared by all? A Review of Equity and Vehicle Sharing. J. Plan. Lit. 2021, 36, 5–30. [Google Scholar] [CrossRef]
  6. Martin, A. Assessing the Benefits of Micromobility. Ph.D. Thesis, University of North Carolina, Chapel Hill, NC, USA, 2021. [Google Scholar]
  7. Nacto. Shared Micromobility in the U.S. 2018; National Association of City Transportation Officials: New York, NY, USA, 2019. [Google Scholar]
  8. Campisi, T.; Akgün, N.; Ticali, D.; Tesoriere, G. Exploring Public Opinion on Personal Mobility Vehicle use: A Case Study in Palermo, Italy. Sustainability 2020, 12, 5460. [Google Scholar] [CrossRef]
  9. Dong, X. Martens: Transport Justice: Designing Fair Transportation Systems. J. Am. Plan. Assoc. 2019, 85, 75–76. [Google Scholar] [CrossRef]
  10. Martens, K.; Golub, A. A Fair Distribution of Accessibility: Interpreting Civil Rights Regulations for Regional Transportation Plans. J. Plan. Educ. Res. 2018. [Google Scholar] [CrossRef] [Green Version]
  11. Beyazit, E. Evaluating Social Justice in Transport: Lessons to be Learned from the Capability Approach. Transp. Rev. 2011, 31, 117–134. [Google Scholar] [CrossRef]
  12. Hananel, R.; Berechman, J. Justice and Transportation Decision-Making: The Capabilities Approach. Transp. Policy 2016, 49, 78–85. [Google Scholar] [CrossRef]
  13. Pereira, R.H.M.; Schwanen, T.; Banister, D. Distributive Justice and Equity in Transportation. Transp. Rev. 2017, 37, 170–191. [Google Scholar] [CrossRef]
  14. Martens, K. A justice-theoretic exploration of accessibility measures. In Accessibility Analysis and Transport Planning; Edward Elgar Publishing: Cheltenham, UK, 2012; pp. 195–210. [Google Scholar]
  15. Yeh, A.G.O.; Kwok, R.C.W. The use of Modal Accessibility Gap as an Indicator for Sustainable Transport Development. Environ. Plan. A 2004, 36, 921–936. [Google Scholar] [CrossRef]
  16. Kawabata, M.; Shen, Q. Job Accessibility as an Indicator of Auto-Oriented Urban Structure: A Comparison of Boston and Los Angeles with Tokyo. Environ. Plan B Plan. Des. 2006, 33, 115–130. [Google Scholar] [CrossRef]
  17. Grengs, J.; Levine, J.; Shen, Q.; Shen, Q. Intermetropolitan Comparison of Transportation Accessibility: Sorting Out Mobility and Proximity in San Francisco and Washington, D.C. J. Plan. Educ. Res. 2010, 29, 427–443. [Google Scholar] [CrossRef]
  18. Jiao, J.; Bai, S. Understanding the Shared E-Scooter Travels in Austin, TX. ISPRS Int. J. Geo-Inf. 2020, 9, 135. [Google Scholar] [CrossRef] [Green Version]
  19. Delbosc, A.; Currie, G. Using Lorenz Curves to Assess Public Transport Equity. J. Transp. Geogr. 2011, 19, 1252–1259. [Google Scholar] [CrossRef]
  20. Tsou, K.; Hung, Y.; Chang, Y. An Accessibility-Based Integrated Measure of Relative Spatial Equity in Urban Public Facilities. Cities 2005, 22, 424–435. [Google Scholar] [CrossRef]
  21. Talen, E.; Anselin, L. Assessing Spatial Equity: An Evaluation of Measures of Accessibility to Public Playgrounds. Environ. Plan A 1998, 30, 595–613. [Google Scholar] [CrossRef] [Green Version]
  22. Duran-Rodas, D.; Villeneuve, D.; Pereira, F.C.; Wulfhorst, G. How Fair is the Allocation of Bike-Sharing Infrastructure? Framework for a Qualitative and Quantitative Spatial Fairness Assessment. Transp. Res. Part A Policy Pract. 2020, 140, 299–319. [Google Scholar] [CrossRef]
  23. Stöhr, W.; Tödtling, F. Spatial equity—Some Anti-Theses to Current Regional Development Doctrine. Pap. Reg. Sci. 1977, 38, 33–53. [Google Scholar] [CrossRef] [Green Version]
  24. Kelobonye, K.; McCarney, G.; Xia, J.; Swapan, M.S.H.; Mao, F.; Zhou, H. Relative Accessibility Analysis for Key Land Uses: A Spatial Equity Perspective. J. Transp. Geogr. 2019, 75, 82–93. [Google Scholar] [CrossRef]
  25. Caspi, O.; Smart, M.J.; Noland, R.B. Spatial Associations of Dockless Shared E-Scooter Usage. Transp. Res. Part D Transp. Environ. 2020, 86, 102396. [Google Scholar] [CrossRef]
  26. Bai, S.; Jiao, J. Dockless E-Scooter Usage Patterns and Urban Built Environments: A Comparison Study of Austin, TX, and Minneapolis, MN. Travel Behav. Soc. 2020, 20, 264–272. [Google Scholar] [CrossRef]
  27. McKenzie, G. Spatiotemporal Comparative Analysis of Scooter-Share and Bike-Share Usage Patterns in Washington, D.C. J. Transp. Geogr. 2019, 78, 19–28. [Google Scholar] [CrossRef]
  28. Tabesh, M.T. Parking Facility Location and User Pricing in the Era of Autonomous Vehicle Operations. Master’s Thesis, West Lafayette, IN, USA, 2020. [Google Scholar]
  29. Hollingsworth, J.; Copeland, B.; Johnson, J.X. Are E-Scooters Polluters? the Environmental Impacts of Shared Dockless Electric Scooters. Environ. Res. Lett. 2019, 14, 84031. [Google Scholar] [CrossRef]
  30. Allem, J.; Majmundar, A. Are Electric Scooters Promoted on Social Media with Safety in Mind? A Case Study on Bird’s Instagram. Prev. Med. Rep. 2019, 13, 62–63. [Google Scholar] [CrossRef]
  31. Pezeshknejad, P.; Monajem, S.; Mozafari, H. Evaluating Sustainability and Land use Integration of BRT Stations Via Extended Node Place Model, an Application on BRT Stations of Tehran. J. Transp. Geogr. 2020, 82, 102626. [Google Scholar] [CrossRef]
  32. Javadinasr, M.; Parsa, A.B.; Abolfazl; Mohammadian, A. A Deep-Learning Based Optimization Approach to Address Stop-Skipping Strategy in Urban Rail Transit Lines. arXiv 2021, arXiv:2109.08786. [Google Scholar]
  33. Emami, B.D.; Song, Y.; Khani, A. Prioritizing Bus Routes for Electrification: A GIS-Based Multi-Criteria Analysis Considering Operational, Environmental and Social Benefits and Costs. In Proceedings of the Transportation Research Board 100th Annual Meeting, Washington DC, USA, 1–29 January 2021. [Google Scholar]
  34. Boyles Petersen, A. Scoot Over Smart Devices: The Invisible Costs of Rental Scooters. Surveill. Soc. 2019, 17, 191–197. [Google Scholar] [CrossRef]
  35. Aman, J.J.C.; Smith-Colin, J. Leveraging Social Media to Understand Public Perceptions of Micromobility Policies: The Dallas Scooter Ban Case. Transp. Find. 2021. [Google Scholar] [CrossRef]
  36. Badeau, A.; Carman, C.; Newman, M.; Steenblik, J.; Carlson, M.; Madsen, T. Emergency Department Visits for Electric Scooter-Related Injuries After Introduction of an Urban Rental Program. Am. J. Emerg. Med. 2019, 37, 1531–1533. [Google Scholar] [CrossRef] [PubMed]
  37. Safaei, N.; Zhou, C.; Safaei, B.; Masoud, A. Gasoline Prices and their Relationship to the Number of Fatal Crashes on US Roads. Transp. Eng. 2021, 4, 100053. [Google Scholar] [CrossRef]
  38. Safaei, B.; Safaei, N.; Masoud, A.; Seyedekrami, S. Weighing Criteria and Prioritizing Strategies to Reduce Motorcycle-Related Injuries using Combination of Fuzzy TOPSIS and AHP Methods. Adv. Transp. Stud. 2021, 54, 217–234. [Google Scholar]
  39. Darzian Rostami, A.; Katthe, A.; Sohrabi, A.; Jahangiri, A. Predicting Critical Bicycle-Vehicle Conflicts at Signalized Intersections. J. Adv. Transp. 2020. [Google Scholar] [CrossRef]
  40. Khodadadi, A.; Tsapakis, I.; Das, S.; Lord, D.; Li, Y. Application of Different Negative Binomial Parameterizations 156, 106103, to Develop Safety Performance Functions for Non-Federal Aid System Roads. Accid. Anal. Prev. 2021. [Google Scholar] [CrossRef] [PubMed]
  41. Das, S.; Tsapakis, I.; Khodadadi, A. Safety Performance Functions for Low-Volume Rural Minor Collector Two-Lane Roadways. IATSS Res. 2021. [Google Scholar] [CrossRef]
  42. Zakhem, M.; Smith-Colin, J. Micromobility Implementation Challenges and Opportunities: Analysis of E-Scooter Parking and High-use Corridors. Transp. Res. Part D 2021. [Google Scholar] [CrossRef]
  43. Mathew, J.K.; Liu, M.; Seeder, S.; Li, H.; Bullock, D.M. Analysis of E-Scooter Trips and their Temporal Usage Patterns. Institute of Transportation Engineers. ITE J. 2019, 89, 44–49. [Google Scholar]
  44. Noland, R.B. Trip Patterns and Revenue of Shared E-Scooters in Louisville, Kentucky. Transp. Find. 2019. [Google Scholar] [CrossRef]
  45. González-Sánchez, G.; Olmo-Sánchez, M.I.; Maeso-González, E. Challenges and Strategies for Post-COVID-19 Gender Equity and Sustainable Mobility. Sustainability 2021, 13, 2510. [Google Scholar] [CrossRef]
  46. Campisi, T.; Nahiduzzaman, K.M.; Akgün, N.; Ticali, D.; Tesoriere, G. Gender Equality on Developing Transport System in Sicily: A Consideration on Regional Scale. AIP Conf. Proc. 2021, 2343, 090003. [Google Scholar] [CrossRef]
  47. Aman, J.J.C.; Smith-Colin, J.; Zhang, W. Listen to E-Scooter Riders: Mining Rider Satisfaction Factors from App Store Reviews. Transp. Res. Part D Transp. Environ. 2021, 95, 102856. [Google Scholar] [CrossRef]
  48. Aman, J.J.C.; Smith-Colin, J. Application of Crowdsourced Data to Infer User Satisfaction with Mobility as a Service (MaaS). Transp. Res. Interdiscip. Perspect. 2021. [Google Scholar]
  49. Nikiforiadis, A.; Paschalidis, E.; Stamatiadis, N.; Raptopoulou, A.; Kostareli, A.; Basbas, S. Analysis of Attitudes and Engagement of Shared E-Scooter Users. Transp. Res. Part D Transp. Environ. 2021, 94, 102790. [Google Scholar] [CrossRef]
  50. Glavić, D.; Trpković, A.; Milenković, M.; Jevremović, S. The E-Scooter Potential to Change Urban Mobility—Belgrade Case Study. Sustainability 2021, 13, 5948. [Google Scholar] [CrossRef]
  51. Qian, X.; Niemeier, D. High Impact Prioritization of Bikeshare Program Investment to Improve Disadvantaged Communities’ Access to Jobs and Essential Services. J. Transp. Geogr. 2019, 76, 52–70. [Google Scholar] [CrossRef]
  52. Qian, X.; Jaller, M. Bikesharing, Equity, and Disadvantaged Communities: A Case Study in Chicago. Transp. Res. Part A Policy Pract. 2020, 140, 354–371. [Google Scholar] [CrossRef]
  53. Mooney, S.J.; Hosford, K.; Howe, B.; Yan, A.; Winters, M.; Bassok, A.; Hirsch, J.A. Freedom from the Station: Spatial Equity in Access to Dockless Bike Share. J. Transp. Geogr. 2019, 74, 91–96. [Google Scholar] [CrossRef] [PubMed]
  54. Ferenchak, N.N.; Marshall, W.E. Bicycling Facility Inequalities and the Causality Dilemma with Socioeconomic/Sociodemographic Change. Transp. Res. Part D Transp. Environ. 2021, 97, 102920. [Google Scholar] [CrossRef]
  55. City of Austin. Austin’s Open Data Portal. 2020. Available online: https://data.austintexas.gov/ (accessed on 15 June 2021).
  56. Lorenz, M.O. Methods of Measuring the Concentration of Wealth. Publ. Am. Stat. Assoc. 1905, 9, 209–219. [Google Scholar] [CrossRef]
  57. Carleton, P.R.; Porter, J.D. A Comparative Analysis of the Challenges in Measuring Transit Equity: Definitions, Interpretations, and Limitations. J. Transp. Geogr. 2018, 72, 64–75. [Google Scholar] [CrossRef]
  58. Nahmias-Biran, B.; Sharaby, N.; Shiftan, Y. Equity Aspects in Transportation Projects: Case Study of Transit Fare Change in Haifa. Int. J. Sustain. Transp. 2014, 8, 69–83. [Google Scholar] [CrossRef]
  59. Kerkman, K.; Martens, K.; Meurs, H. A Multilevel Spatial Interaction Model of Transit Flows Incorporating Spatial and Network Autocorrelation. J. Transp. Geogr. 2017, 60, 155–166. [Google Scholar] [CrossRef]
  60. Moniruzzaman, M.; Páez, A. Accessibility to Transit, by Transit, and Mode Share: Application of a Logistic Model with Spatial Filters. J. Transp. Geogr. 2012, 24, 198–205. [Google Scholar] [CrossRef]
  61. Diao, M. Selectivity, Spatial Autocorrelation and the Valuation of Transit Accessibility. Urban Stud. 2015, 52, 159–177. [Google Scholar] [CrossRef] [Green Version]
  62. Zhu, B.; Hsieh, C.; Zhang, Y. Incorporating Spatial Statistics into Examining Equity in Health Workforce Distribution: An Empirical Analysis in the Chinese Context. Int. J. Environ. Res. Public Health 2018, 15, 1309. [Google Scholar] [CrossRef] [PubMed] [Green Version]
  63. Ma, X.; Zhang, J.; Ding, C.; Wang, Y. A Geographically and Temporally Weighted Regression Model to Explore the Spatiotemporal Influence of Built Environment on Transit Ridership. Comput. Environ. Urban Syst. 2018, 70, 113–124. [Google Scholar] [CrossRef]
  64. Cardozo, O.D.; García-Palomares, J.C.; Gutiérrez, J. Application of Geographically Weighted Regression to the Direct Forecasting of Transit Ridership at Station-Level. Appl. Geogr. 2012, 34, 548–558. [Google Scholar] [CrossRef]
  65. Clark, W.A.; Hosking, P.L. Statistical Methods for Geographers; SAGE Publications: Thousand Oaks, CA, USA, 1986. [Google Scholar]
  66. Howland, S.; McNeil, N.; Broach, J.; Rankins, K.; MacArthur, J.; Dill, J. Breaking Barriers to Bike Share: Insights on Equity from a Survey of Bike Share System Owners and Operators; Transportation Research and Education Center: Portland, OR, USA, 2017. [Google Scholar]
  67. Braun, L.M.; Rodriguez, D.A.; Gordon-Larsen, P. Social (in)Equity in Access to Cycling Infrastructure: Cross-Sectional Associations between Bike Lanes and Area-Level Sociodemographic Characteristics in 22 Large U.S. Cities. J. Transp. Geogr. 2019, 80, 102544. [Google Scholar] [CrossRef]
  68. Golub, A.; Hoffmann, M.L.; Lugo, A.E.; Sandoval, G.F. Introduction: Creating an inclusionary bicycle justice movement. In Bicycle Justice and Urban Transformation; Routledge: Hoboken, NJ, USA, 2016; pp. 1–19. [Google Scholar]
  69. Aman, J.J.C.; Smith-Colin, J. Transit Deserts: Equity Analysis of Public Transit Accessibility. J. Transp. Geogr. 2020, 89, 102869. [Google Scholar] [CrossRef]
  70. Bieliński, T.; Kwapisz, A.; Ważna, A. Electric Bike-Sharing Services Mode Substitution for Driving, Public Transit, and Cycling. Transp. Res. Part D Transp. Environ. 2021, 96, 102883. [Google Scholar] [CrossRef]
  71. Bigazzi, A.; Wong, K. Electric Bicycle Mode Substitution for Driving, Public Transit, Conventional Cycling, and Walking. Transp. Res. Part D Transp. Environ. 2020, 85, 102412. [Google Scholar] [CrossRef]
  72. Campbell, A.A.; Cherry, C.R.; Ryerson, M.S.; Yang, X. Factors Influencing the Choice of Shared Bicycles and Shared Electric Bikes in Beijing. Transp. Res. Part C Emerg. Technol. 2016, 67, 399–414. [Google Scholar] [CrossRef] [Green Version]
  73. Gu, T.; Kim, I.; Currie, G. Measuring Immediate Impacts of a New Mass Transit System on an Existing Bike-Share System in China. Transp. Res. Part A Policy Pract. 2019, 124, 20–39. [Google Scholar] [CrossRef]
Figure 1. Demographic distribution.
Sustainability 13 11856 g001
Figure 2. Distribution of the accessibility of micromobility services.
Sustainability 13 11856 g002
Figure 3. Lorenz curve for the distribution of scooters.
Sustainability 13 11856 g003
Figure 4. Lorenz curve for the distribution of bikes.
Sustainability 13 11856 g004
Table 1. Sociodemographic and economic indicators used and findings.
StudySocial CharacteristicRelated Finding
RaceIncomeTransit-DependentEducationEmployment Rate
(Qian, Niemeier) [51]+++--
-
A well-planned bike-sharing system can enhance accessibility for disadvantaged neighborhoods more than a similarly designed system would for other populations.
-
The placement of stations in disadvantaged communities has the potential to boost household access to jobs and key services.
(Mooney et al.) [53] ++-+-
-
More bikes were found in communities with relatively higher incomes and a higher proportion of college-educated residents, while no inequalities by racial composition were discovered.
(Qian, Jaller) [52]++--+
-
Bikeshare stations in disadvantaged neighborhoods produce about two-thirds of the average yearly trips among all stations.
-
The employment rate is critical in promoting bike-sharing ridership, particularly in disadvantaged regions.
(Caspi, Smart Noland) [25]-+-++
-
The use of e-scooters is connected with high employment rates.
-
People utilize e-scooter sharing regardless of the neighborhood’s affluence, while less affluent regions with high usage rates have significant student concentrations.
(Ferenchak, Marshall) [54]++---
-
Inequalities in biking infrastructure installation are observed in regions with a high proportion of people of color, who have the lowest rates of total facility installation.
-
Bike lanes were mostly installed in low-income neighborhoods.
‘+’ = used in the study; ‘-’ = not used in the study.
Table 2. Descriptive statistics for the duration and distance of e-scooter and bike trips.
ModeMin.1st Qu.MedianMean3rd Qu.Max.
Trip Duration (min.)Bike2.006.1810.2214.4617.3290.00
E-scooter2.004.607.3711.0213.0390.00
Trip Distance (min.)Bike0.020.691.191.602.0910.00
E-scooter 0.020.420.741.021.2810.00
(Min. = minimum; Max. = maximum; Qu. = quartile).
Table 3. Moran’s Index test for spatial autocorrelation.
VariableMoran IndexExpected IPatternz-Scorep-Value
Scooter Accessibility0.169−0.0048Clustered14.13920.00
Bike Accessibility0.262725−0.004608Clustered15.0074890.00
Population0.079803−0.005025Clustered3.8728710.00
Black0.369221−0.005051Clustered16.9849590.00
Asian0.281576−0.005051Clustered12.9188700.00
Hispanic0.496380−0.005051Clustered22.4593470.00
Transit dependent0.258411−0.00505Clustered12.0253980.00
Low income0.322373−0.005051Clustered15.1918880.00
Table 4. Correlation analysis related to social characteristics and accessibility.
HispanicBlackAsianTransit DependentLow IncomeAverage Trips Per DayTotal Population
Hispanic1
Black0.31 ***1
Asian−0.46 ***−0.17 **1
Transit Dependent0.110.14 **−0.031
Low Income0.110.17 **0.070.43 ***1
Scooter Accessibility−0.09−0.040.0530.050.27 ***1
Bike Accessibility−0.9−0.040.14 *0.030.22 **0.84 ***
Total population0.06−0.030.26 ***−0.16 **−0.152**−0.021
*, ** and ***: The levels of significance are 10% (0.1) *, 5% (0.05) **, and 1% (0.01) ***.
Table 5. Summary and diagnosis of the OLS model coefficients for scooters.
VariableCoefficientStdErrort-StatisticPrRobust SEtPRVIF
Intercept38.7764.030.610.5458.050.670.5..
Hispanic−1.731.22−1.420.161.67−1.030.301.38
Black−1.82.34−0.760.450.76−2.320.02 *1.13
Asian−1.94.4−0.040.675.1−0.380.711.30
Transit−8.278.80−0.940.354.32−1.910.061.24
Low income28.336.744.200.00 *12.302.300.021.27
Number of Observations196
R-Squared0.08
Adjusted R-Squared0.07
Akaike’s Information Criterion (AICc)2833
Joint F-Statistic4.04Prob(>F), (5190) degrees of freedom: 0.000 *
Joint Wald Statistic21.69Prob(>chi-squared), (2) degrees of freedom: 0.000 *
Koenker (BP) Statistic5.49Prob(>chi-squared), (2) degrees of freedom: 0.189262
Jarque–Bera Statistic157,810Prob(>chi-squared), (2) degrees of freedom: 0.000 *
*: p < 0.01
Table 6. Summary and diagnosis of the OLS model coefficients for bikes.
VariableCoefficientStdErrort-StatisticPrRobust SEtPRVIF
Intercept0.527.640.070.947.060.70.94
Hispanic−0.100.15−0.670.480.16−0.610.541.39
Black−0.210.28−0.750.450.10−2.050.04*1.14
Asian0.580.521.100.271.080.530.591.29
Transit−0.871.06−0.80.40.57−1.530.121.24
Low income2.730.813.350.001.262.150.032 *1.27
Number of Observations199
R-Squared0.08
Adjusted R-Squared0.06
Akaike’s Information Criterion (AICc)2035
Joint F-Statistic3.22Prob(>F), (5190) degrees of freedom: 0.000 *
Joint Wald Statistic14.37Prob(>chi-squared), (2) degrees of freedom: 0.000 *
Koenker (BP) Statistic4.5Prob(>chi-squared), (2) degrees of freedom: 0.189
Jarque–Bera Statistic42,037Prob(>chi-squared), (2) degrees of freedom: 0.000 *
*: p < 0.01
Table 7. Summary and diagnosis of the GWR model coefficients for scooters and bikes.
ScooterBike
CoefficientCoefficient
MinMaxMeanStandard DeviationMinMaxMeanStandard Deviation
Intercept4.5823.712.145.4738.72740.91139.8181.031
Black0.380.60−0.060.15−1.7320.730−1.2200.525
Hispanic−0.36−0.01−0.090.06−1.7700.955−0.6690.632
Asian0.033.951.641.23−1.89822.8954−1.29691.033
Transit Dependent−2.900.37−1.390.84−8.28149−6.271−7.27621.202
Low Income1.103.312.090.5328.32231.335829.3283.003
Bandwidth0.0923.67
Residual Squares 260,17720,227,034
Effective Number23.56.01
Sigma38.50326.28
AIC20322833
R20.200.10
R2 Adjusted0.100.07
Publisher’s Note: MDPI stays neutral with regard to jurisdictional claims in published maps and institutional affiliations.

