Article

Effective Energy Management via False Data Detection Scheme for the Interconnected Smart Energy Hub–Microgrid System under Stochastic Framework

1
Statistics and Operations Research Department, College of Science, King Saud University, Riyadh 11451, Saudi Arabia
2
Chair of Energy Application Engineering, Institute of Technology, Estonian University of Life Sciences, 51006 Tartu, Estonia
3
Faculty of Engineering, Kotelawala Defence University, Kandawala Estate, Ratmalana 10390, Sri Lanka
4
Electrical Engineering Department, Faculty of Engineering, Minia University, Minia 61519, Egypt
*
Author to whom correspondence should be addressed.
Sustainability 2021, 13(21), 11836; https://doi.org/10.3390/su132111836
Submission received: 23 August 2021 / Revised: 12 October 2021 / Accepted: 20 October 2021 / Published: 26 October 2021

Abstract

:
During the last few years, attention has overwhelmingly focused on the integrated management of urban services and the demand of customers for locally-based supply. The rapid growth in developing smart measuring devices has made the underlying systems more observable and controllable. This exclusive feature has led the system designers to pursue the implementation of complex protocols to provide faster services based on data exchanges. On the other hand, the demands of consumers for locally-based supply could cause a disjunction and islanding behavior that demands to be dealt with by precise action. At first, keeping a centralization scheme was the main priority. However, the advent of distributed systems opened up new solutions. The operation of distributed systems requires the implementation of strong communication links to boost the existing infrastructure via smart control and supervision, which requires a foundation and effective investigations. Hence, necessary actions need to be taken to frustrate any disruptive penetrations into the system while simultaneously benefiting from the advantages of the proposed smart platform. This research addresses the detection of false data injection attacks (FDIA) in energy hub systems. Initially, a multi-hub system both in the presence of a microgrid (the interconnected smart energy hub-based microgrid system) and without it has been modeled for energy management in a way that allows them to cooperate toward providing energy with each other. Afterward, an FDIA is separately exerted to all three parts of the energy carrier including the thermal, water, and electric systems. In the absence of FDIA detection, the impact of FDIA is thoroughly illustrated on energy management, which considerably contributes to non-optimal operation. In the same vein, the intelligent priority selection based reinforcement learning (IPS-RL) method is proposed for FDIA detection. In order to model the uncertainty effects, the unscented transformation (UT) is applied in a stochastic framework. The results on the IEEE standard test system validate the system’s performance.

1. Introduction

The ongoing scientific progress in communications has led to an intellectual revolution in the principles of management. On the basis of the resulting technology, the connections among different parties were achieved gradually and, in turn, the management principles became multilateral. In accordance with this technological development, recently, distributed systems have been highlighted that fit their demand and the desired management schemes. In such systems, all agents are involved in an intense competition to gain benefits while they work together to realize a shared consensus [1]. The recent developments in information technology and communications, as well as the devising of a new generation of smart metering systems, have enabled the possibility of creating a multi-carrier energy system that is capable of establishing secure bilateral links between producers and consumers. In this regard, control of energy carriers’ consumption, boosting all of the parties, and distributing the benefits among them could be achieved through convertible platforms in multi-carrier energy systems. On the other side, gas and water carriers profoundly affect the management of electrical energy and vice versa [2]. Therefore, three-level descriptions of the literature are investigated: (A) energy management in distribution systems, (B) energy hub systems, and (C) false data injection (FDI) attacks.

1.1. Energy Management in Distribution Systems

The main source for generating electric energy is fossil fuels, which are a finite resource and have detrimental environmental impacts (such as increased greenhouse gases) [3]. Thus, there is a universal intention to reduce the harmful environmental impacts of electricity production [4]. Recent investigations have demonstrated that if energy consumption stays at the same rate, fossil fuel reserves will be depleted in the next 50–60 years [5]. For this reason, the necessity for a more efficient method of connection between electricity generation and the consumers is highly apparent. Energy management represents the schedule of local energy flows through the operation of local renewable energy resources [6]. In the energy management process, various resources in the power distribution network are taken into account. Photovoltaic (PV), wind turbine (WT), and tidal systems have been modelled in each part of the distribution network. The technical characteristics and parameters of microgrid and energy hub systems are available in [7]. Energy management can be executed in a microgrid (MG) or a widespread grid with multi-MGs for the achievement of goals such as minimizing the operational costs or system losses and so forth [8,9,10]. The authors in [11] implemented an energy management program among multi-microgrids in which they applied the game theory method for a demand response program in the presence of renewable energy resources and energy storage. Reference [12] introduces multi-agent energy management that specifically controls the supply side (producers) in the presence of high penetration of renewable energy sources (RES) and electric vehicles (EV). References [13,14,15,16,17,18] have also surveyed various control strategies of distributed generation to energy management. Researchers in [13] discussed a review of energy management methods. The authors in research [14] centralized the control of the microgrids’ energy management purpose. Reference [15] speaks about some scheduling strategies for multi-microgrid energy management in which the authors also consider architecture and communication issues. The authors in [16] introduced a scheduling algorithm for energy management based on artificial intelligence. However, the authors in [17,18] addressed the issue from a data security point of view. This research also moves towards dealing with the role of data security in energy management as in reference [18]. On the other hand, the interconnected smart energy hub-based MG system has been employed in energy management as a distinct type.

1.2. Energy Hub Systems

The recent developments in information technology and communications as well as devising a new generation of smart metering systems have enabled the possibility of creating a multi-carrier energy system that is capable of establishing secure bilateral links between producers and consumers. This multi-carrier energy hub is called the smart energy hub system [19]. In this regard, the control of energy carriers’ consumption, boosting all of the parties and distributing the benefits among them, could be achieved through convertible platforms in multi-carrier energy systems. On the flip side, gas and water carriers profoundly affect the management of electrical energy and vice versa.
Energy hubs with multi-carrier energy networks (such as thermal, water and electrical systems) can utilize renewable energy resources and distributed generations (DGs) reliably and securely. A hub system can operate in various situations in either an island or grid-connected mode [20]. Therefore, combined heat and power (CHP) systems can provide a substantial contribution in such systems owing to the fact that they satisfy both thermal and electrical energy demands [21]. Using smart monitoring and data communications in smart grids, transactive energy has developed a new outlook for hub operations. Supply and demand are balanced in an energy hub system by exchanging energy in various energy demands [22,23]. Evidence suggests that the use of energy hub systems has many advantages including reducing voltage oscillations by high penetration of RESs [24], decreasing the consumption of fossil fuel [25], reducing motor start-up current stresses owing to islanded operation [26], etc. Research on the subject considers several matters. Numerous studies have surveyed how cooperating among multiple energy hubs systems can reduce operation costs by using DER. Many research debates have been conducted concerning optimal energy management in decentralized and centralized control multi-hub. The literature [27] presents a multi-agent method for energy trading in grid-connected hubs.

1.3. False Data Injection Attack (FDIA)

The smart grid is increasingly associated with intelligent monitoring devices for reliability, efficiency, and control. The high integration of inter-connectivity infrastructure and pervasive use of communications has led to new types of vulnerableness, which have not been exactly covered by the civil defense entities. One of the many occurrences was a cyber-attack against distribution companies in Ukraine [28]. FDI attacks, first described in [29], import false data into the measurements system to take down the network operation [30]. In [31] a comprehensive review of FDI attacks has been carried out. An FDI attack will be effective when the system operator does not detect it. The researchers in [32] illustrated that networks could be attacked with only partial information of monitoring devices. Reference [33] introduces a type of attack called the blind FDI in which the attacker does not require any system information. In this study, an FDIA is separately exerted to all three parts of the energy carrier included the thermal, water, and electric parts. In the absence of FDIA detection, the impact of FDIA has been thoroughly illustrated in energy management, which considerably contributes to non-optimal operation. In the same vein, the intelligent priority selection based reinforcement learning (IPS-RL) method has been proposed for FDIA detection. To make out analysis more realistic, electric demand and generation uncertainties are considered using the unscented transformation (UT) method. Some researches on UT have been reported in several publications [34].
To realize the challenges expressed in this paper, Table 1 shows the main differences between the previous investigations and the proposed frameworks.
As it can be seen, the authors in [35] have tried to provide a security platform based on machine learning for detecting cyber-attacks without considering energy carriers. However, the modified reinforcement learning method pointed out in this paper seems to be more intelligent and faster for finding false data in a system. In addition, checking the uncertainty effects on the performance of the multi-energy system equipped by the cyber-security approach against attackers can be one of the significant concerns in this paper.
Therefore, the main contributions and characteristics of this paper over prior publications are stated as follows:
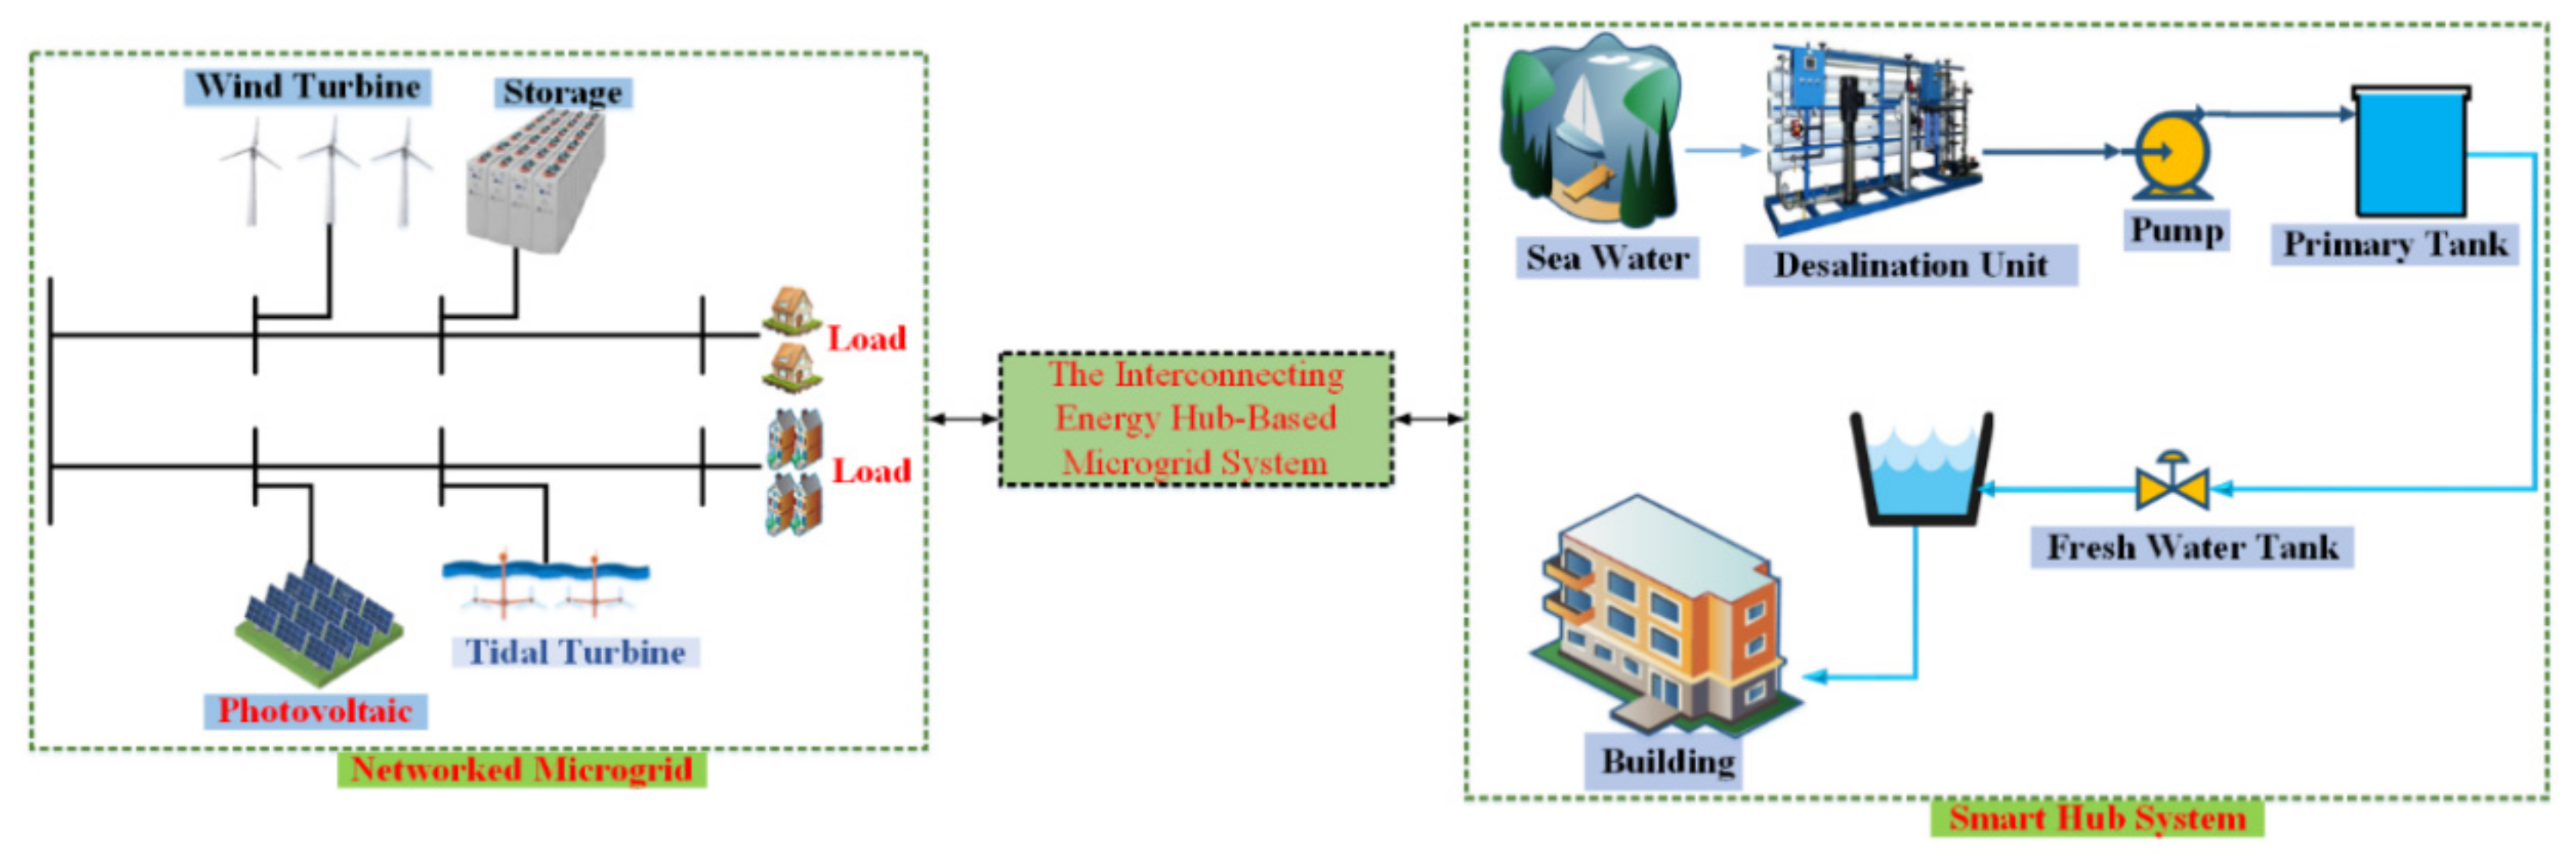
  • Providing an efficient and comprehensive framework based on the interconnected energy hub-based microgrid system to improve the simultaneous management of energy different carriers.
  • Developing an appropriate and strong IPS-RL scheme aimed at detecting all types of attacks and guarantee the minimum detection delay.
  • Validating and assessing the proposed detection method by implementing and modeling the FDI attack.
  • The uncertainties of the studied system, including the electrical, thermal, and water loads, the tidal current, wind speed. and sunlight, are formulated by the UT method, which can model the correlation among uncertain parameters.
The rest of the paper is provided such that the mathematical formulations of the studied model are described in Section 2. Section 3 is aimed at expressing the proposed detection method. The solution process is represented in Section 4. Section 5 explains the UT-based uncertainty method. The effectiveness of the studied model proposed in this paper is evaluated and validated in Section 4. Our conclusions are presented in Section 7.

2. Formulation Definition of the Proposed Framework

Smart hub systems can satisfy three energy carriers (i.e., electrical, thermal, and water demands) with the use of an appropriate structure which coordinates the energy management among three load demand types. In this regard, such a structure can be incorporated in a networked microgrid by using the transaction link to supply electricity, water, and thermal loads located in the far area. To this end, this section is aimed at presenting a mathematical modeling of both the smart hub and networked microgrid systems by considering transactions between them modeled in this paper. To elaborate on such a framework, Figure 1 illustrates the studied network. The proposed microgrid comprises renewable energy units (i.e., PV, WT, and the tidal system expanded across the island). On the other side of the problem, the smart hub system requires thermal units such as a CHP and boiler, desalination unit, energy storage, and a transformer to satisfy thermal, water, and electrical demands, respectively.
It is important to first present the total cost function of the proposed networked microgrid as the objective function as follows:
C M C = m i n i t R t P V P i , t P V + R t W T P i , t W T + R t t i d a l P i , t t i d a l + R H U B M C P i , t H U B M C
P i , t P V + P i , t W T + P i , t t i d a l + j Ω j P i j , t + P i , t H U B M C = P i , t l o a d   ?   t Ω T , i Ω i
Equation (1) indicates the objective function of the microgrid, which is made up of different parts including the operation cost of renewable energy units and the power transaction cost. Note that the benefit/cost arising from power transaction is dependent on the positive/negative value of exchanging power between the microgrid and hub system, as shown in the last term of the Equation (1). Such a cost function can be considered to provide an effective energy management structure within the proposed microgrid in which minimizing the operation cost of all units is necessary. An appropriate balance model between demand and generation guarantees the supplement of demands in the microgrid as can be seen by Equation (2). The left-handed parts related to Equation (2) comprise the power transaction between microgrid and hub system, the output powers of PV, WT and tidal system and power flow through lines in the networked microgrid. It is significant to say that the power transaction ( P i , t H U B M C ) is bilateral which means the positive value of P i , t H U B M C indicates the power transaction from the hub system to the microgrid and vice versa. Besides, the right-handed part of the power balance equation is defined by load demands located at buses of the networked microgrid system. The power generation related to each unit is expressed in detail by Equations (3)–(5). The output power of PV units can be calculated by Equation (3) which complies with relevant PV capacity, the sun irradiation and the power loss consumed by cells. Looking over Equation (4), the WT unit can be able to generate its power regarding the wind speed limits in which P W r a t e d imply to the rated power of WT for wind speeds S r a t e d W 1 < S W 1   . In addition, Equation (5) represents the power generation pertaining to the tidal system, which explains the output power according to the tidal current speed ( V i , t ) . It should be mentioned that the tidal power would be zero, if the current speed is less than the rated speed. Starting power generation is when the current speed is high/below the cut-in/rated speeds, respectively. If so, the output power is generated according to the rated speed.
P i , t P V = D × E i , t P V G × ( 1 P l o s s ) , t Ω T , i Ω i
P i , t W T = 0 0 S W 1 S r a t e d W 1 φ ( S i , t W 1 ) S c u t i n W 1 S W 1 S r a t e d W 1 P r a t e d W T S r a t e d W 1 S W 1         t Ω T i Ω i b 2 4 a c
P i , t t i d a l = 0 0 V i , t V r a t e d 0.5 H p c ρ s A t i d a l V i , t 3 V c u t i n V i , t V r a t e d , P r a d e d t i d a l V r a t e d V i , t   t Ω T , i Ω i
As mentioned before, modeling the smart hub system is one of the significant goals in this section. Let us assume we have two hub systems with the same structure as a multi-hub system interconnected through the graph of the proposed networked microgrid. It is clear that the smart hub system can manage the energy carriers, i.e., the electrical, water, and thermal demands and provide a coordinated framework among energy carriers to get into effective energy management. To clarify such a structure, the formulations pertaining to each smart hub system are developed in the following manner. Similar to the microgrid, the energy management of the hub system comprises the objective function and constraints. Firstly, it is worth mentioning that the objective function related to the hub system includes the following terms:
c o s t H U B = m i n t Ω t P t C R C H P + P t b o i C b o i P t b a t R b a t + W t G R w a t e r R H U B M C P i , t H U B M C
Let us consider the total cost related to the smart hub system as the objective function, which includes the operation cost of different units (i.e., CHP, boiler, energy storage and cost of grid water), all of which aim to manage three energy carriers. The last term of the objective function implies the power cost/benefit transferred between the hub system and the network microgrid. Considering the supplement of different energy carriers, the constraints related to energy management can be partitioned with regard to the different layers of the smart hub system. For more clarification, Equations (7)–(21) show the constraints pertaining to three energy carriers. Given that the electrical part is constrained by Equations (7)–(12), constraints pertaining to the thermal part are provided by (13)–(16) and finally the water part is defined based on constraints (17)–(20). By focusing on the electrical layer, the equation of the power balance between the generation units and load associated with the electrical part can be defined by (7). The electrical load, the power consumption of the desalination unit, and the power transaction need to be satisfied by the electrical generation units and thus are inserted in the left-sided part of the Equation (7). On the other hand, the right-sided part of the power balance is included the electrical power generation of CHP and charging/discharging power of the energy storage unit to get into convenient welfare from a technical point of view. Equation (8) shows that the power exchange needs to be limited within an acceptable range. Constraint (9) expresses that the power exchange is not allowed to exceed its transformer’s capacity. The energy balance for the storage unit is carried out each time by (9). Equations (10) and (11) are associated with the energy/power constraints of the storage unit.

2.1. Electrical Part

P   t   E l o a d   + P t D e + η e T P i , t H U B M C = η c h p G t o E P     t C + P t b a t   t Ω T  
P _   t H U B M C   P i , t H U B M C P ¯   t   H U B M C     t Ω T
η e T ( P i , t H U B M C ) C T r , t Ω T
E t   b a t =   1 E l o s s E t 1   b a t + P   t b a t   t Ω T
E ¯   b a t E   t   b a t E ¯   b a t , t Ω T
1 η e   P _         b a t P   t b a t   1 η e P ¯       b a t t Ω T
As mentioned before, the second layer of the hub system is related to the thermal part whose constraints are represented by (13)–(16). The thermal generations pertaining to both the CHP and boiler units are obligated to supply the thermal load demands ( P h e a t l o a d ), which is modeled by the thermal balance Equation (13). The gas grid with regards to the gas balance equation as shown by (14) serves the needed input gas of the CHP/boiler units to generate heat. Furthermore, constraints (15)–(16) show that the power output of boiler and CHP units are not permitted to exceed their transformers capacities.

2.2. Heat Part

P   t h e a t l o a d = η c h p G H P   t C + η b o i G H P     t b o i t Ω T
P   t G a s = P   t C + P     t b o i t Ω T
η c h p G H P   t C C C H P t Ω T
η b o i G H P     t b o i C B o i t Ω T
As the last part, the water load demand can be served in two ways: (1) refining the water sea by the desalination unit and (2) by usingg the water grid. Some explanations are needed to describe the water supplement process here. Firstly, a desalination tank is better considered to store the refined water, preceded by pouring into the main water tank in other to optimally manage the power consumption of the desalination unit. Then, the water output of the grid and the refined water coming out from the desalination tank are poured into the main water tank to support the water load demands. The water balance equation related to both of these tanks is modeled by constraints (17)–(18). In addition, the volume of the refined seawater can be restricted by Equation (19). The required power consumption to refine the water is determined and formulated with regards to the desalination unit coefficient and the volume of the sea water as indicated by (20). All in all, given the modeling of the smart hub system and networked microgrid explained above, the total objective function, which is a summation of the total costs of the microgrid and hub system, needs to be minimized as shown by (21). It is important to say that both of these systems are operated and controlled by a central system operator.

2.3. Water Part

V t T = V t 1 T + W t D + W t G R I D W t l o a d , t Ω T
V t T = V t 1 T + W t D W t D , t Ω T
W _ D . I t D W t D W ¯ D . I t D ,     t Ω T
P t D e = W t D . C F D e s , t Ω T
C T = C M C + c o s t H U B

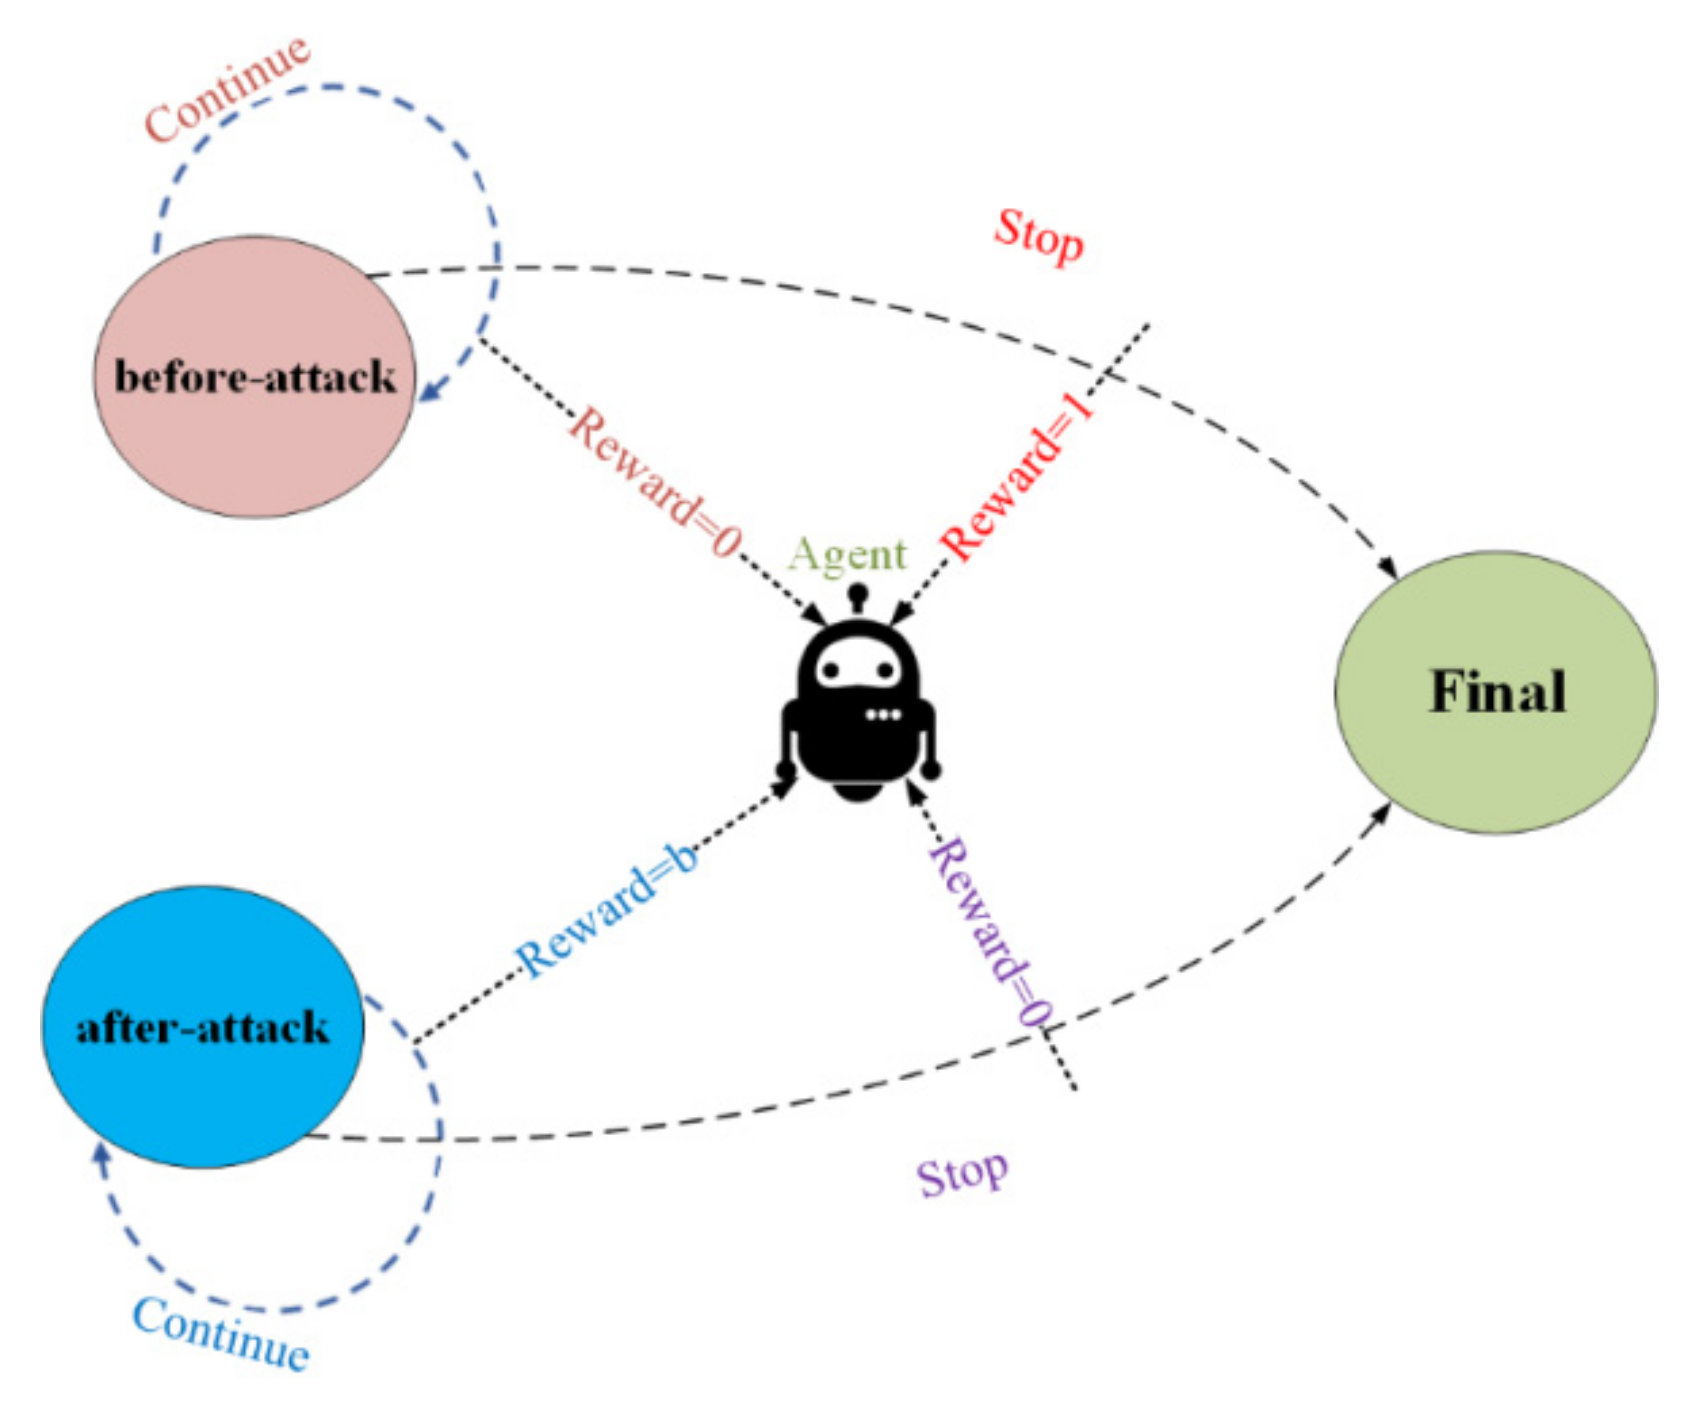
3. Proposed Cyber Attack Detection Approach

As mentioned before, the studied model as a multi-energy system is able to operate three energy carriers (i.e., the water, thermal and electrical load demands in a correlation environment). Therefore, having a disturbance in information related to each energy carrier can make injurious effects on operating the other energy carriers. In other words, manipulating the monitoring data named the FDIA can lead to inflict social/economic injuries on the proposed multi-energy carriers system. In this regard, the structure of such systems causes to augment the risk of cyber malicious attacks. For this reason, the proposed energy hub-based microgrid model needs to be developed by using an attack detection scheme not to launch any anomaly. As a result, this section is aimed to first present the FDIA modeling and introduce an effective approach in order to meet attack alarms.

3.1. FDIA Model

To make clear the different fields of system security, the attack type needs to be formulated and modeled completely. First, it better is to mention that the cyber-attack modeling is generally sorted based on different methods including the attack trees, attack graphs, and attack networks [35]. The attack model based on the graph is able to clarify somewhat all of the goals followed by hackers. Considering the network nodes, the other method is proposed to model attacks based on the acyclic directed graph. As with the last method, the attack network is introduced as a trusty model for the sake of simulating the stealthy intrusion with regards to hacker goals in the system. The above explanations indicate that the attack of FDI types can be inserted in the class of the attack networks that impose the most destructive effects on the system operation, including economic, load redistribution, and the energy deluding attacks. To focus on modeling FDI attacks, we assume that the hacker can have access to the information related to the studies system. By doing so, the problem function (Z) can be defined by (22) with the aim of changing data D within the system. Injecting the noise into the measurement process leads to be monitored the wrong data by the system, which can be modeled in Equation (23) as FDIA function (Zγ). It should be mentioned that a successful FDI attack is launched when the residue norm of the false function compared to function one is clear to zero as that is followed by (24).
Z = h ( D t )
Z λ = h ( D b a d , t )
Z λ h ( D b a d , t ) = Z h ( D t )
In addition, the FDI attack performance needs to be assessed by an important criterion, which is defined in Equation (25).
λ = h ( D t + c t = κ ) h ( D t )
Here we assume that an FDI attack is launched by injecting noise (C) at time κ and λ is considered as the structured anomaly vector. All in all, to provide a targeting attack of FDI type, the bad data is generated and modeled as follows:
D b a d , t = D t + c t i f t κ D t o t h e r w i s e

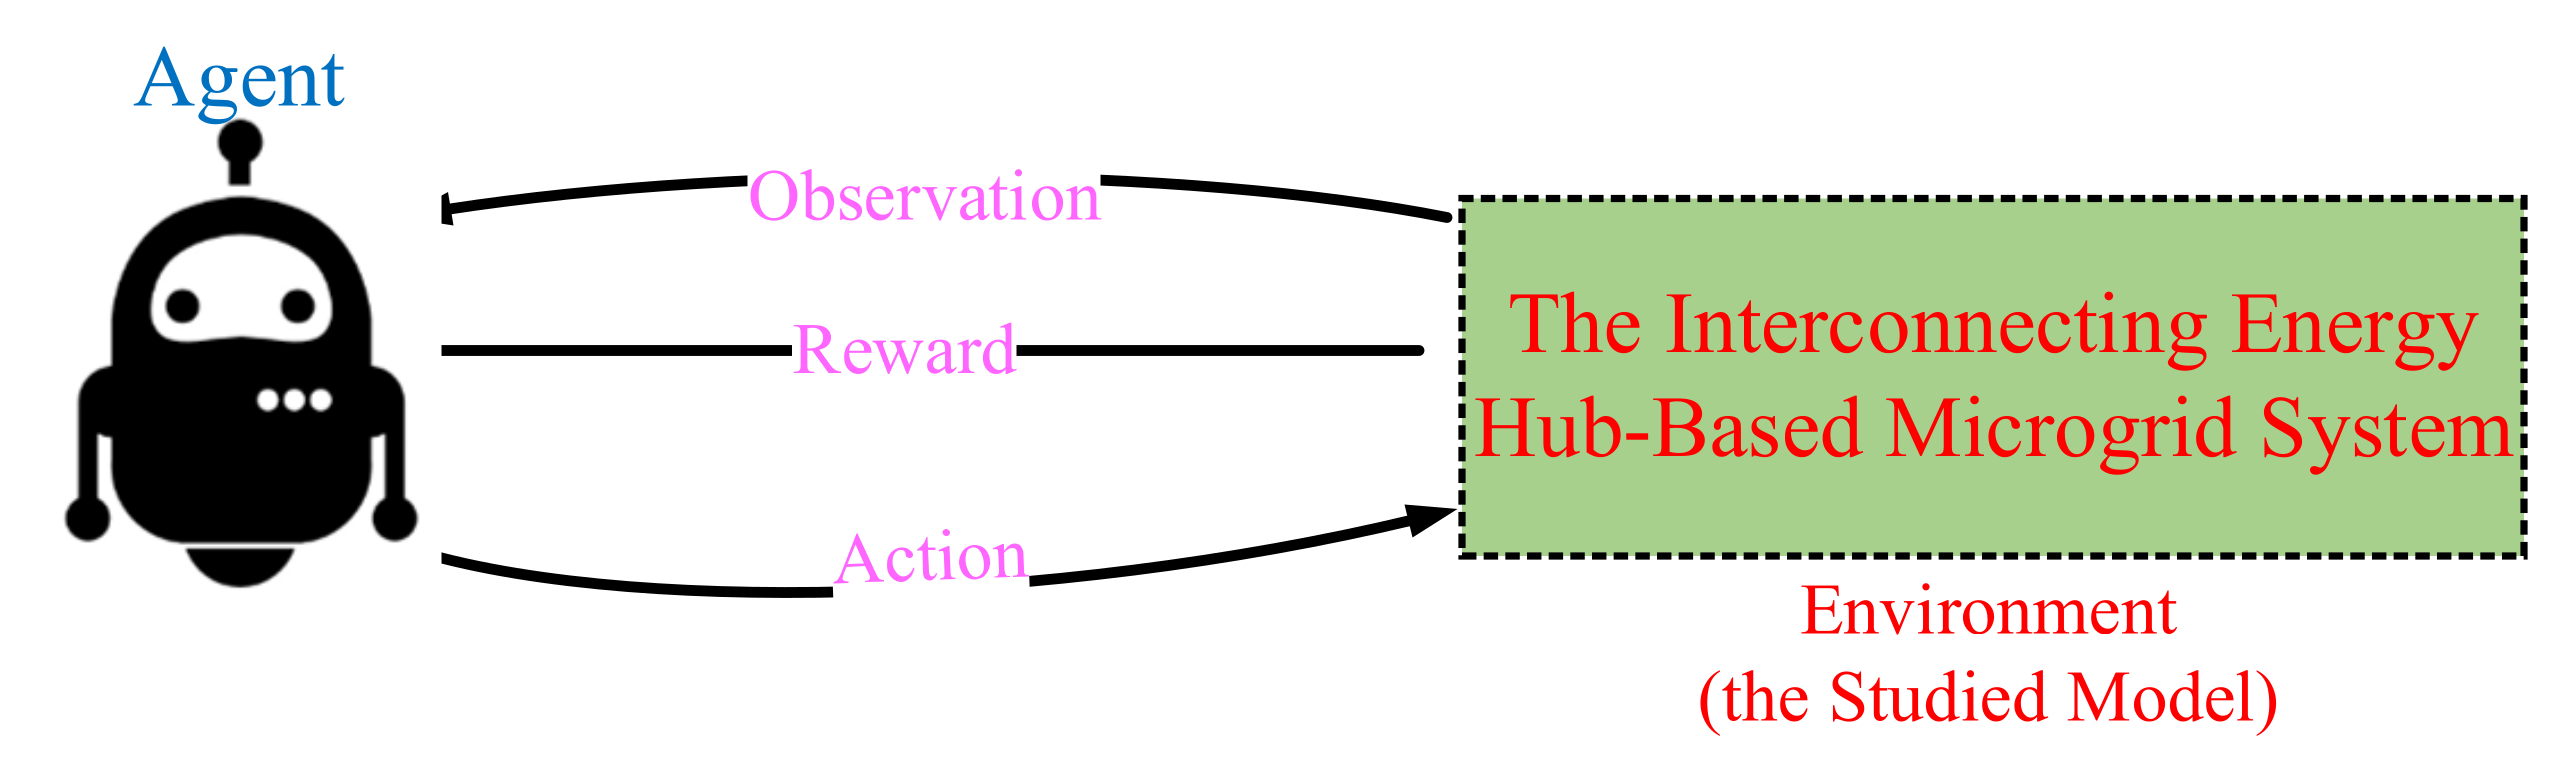
3.2. The Structure Definition of the Proposed IPS-RL Approach

For the last few years, machine learning methods have mainly been developed to detect anomalies in different ways such as reinforcement learning (RL), supervised learning and unsupervised learning. Some researchers have proved that the detection methods based on RL are more effective and reliable for the sake of interacting with the environment using a learnable agent than the other methods [36]. The basic structure of the RL method is indicated in Figure 2. According to these results, the RL approach includes two Sections: 2.1. environment 2.2. agent. It is axiomatic that such a method to declare attacks needs to first execute the learning phase proceeding by the detection stage. In the learning phase, the agent is learned to choose an action considering the observation of environmental conditions. In the following, the agent receives a reward arising from the environment to improve the selection of appropriate action. This learning procedure is continued when the agent gets the maximum reward. It should be mentioned that the learning phase needs to be extended in such a way that the agent would be able to settle down the best action in the unknown environment under stochastic and uncertain conditions. Technically, by focusing on the above discussion, each the RL element in the learning step t serves as follows:
The agent: (1) ibtains the observation of environment, (2) selects the action, and (3) receives the relevant scalar reward.
The environment: (1) releases the observation, (2) receives the action, and (3) emits the reward based on the action.
Proceeding with the explanations related to the proposed detection technique, it is necessary to first describe the observable Markov decision process (POMDP) idea. A POMDP problem can be defined by considering different elements such as the set of hidden states (s), set of observations of the environment (o), the transition probabilities related to each state (T), rewards (r), and set of actions selected by the agent (a). Note that the environment is hidden from point of view of the agent in a POMDP problem. In this regard, the agent observes the environment condition and chooses an actual action with regards to the current state. By doing so, the environment emits the relevant reward arising from the selected action and the present state at time t. In this situation, the next state (st + 1) of the environment is assessed and determined based on the probability related to st + 1 and the reward received by the agent. Such a process of interacting between the agent and environment will be stopped if the final state is brought into the environment. It is important to say that the agent tries to make an optimal policy for mapping observation to action as follows:
R E = E t = 0 u t r e t
where R shows the expected value of summation of the rewards and ut    [0, 1] is defined to determine rewards, which are preferred over future rewards received by the agent. For more clarification about the proposed detection approach, it is important to say that the detection method function needs to be defined based on a POMDP problem and proposed as an effective approach in order to get into the main goals counting the attack alarm and the minimum detection delay. To this end, the proposed function for attack detection regarding the POMDP concept is defined based on Figure 3. Let us suppose that a hacker starts to launch an attack on the system with the use of the unknown strategy at time κ. Since the attack plan may be unknown, the environment states are partitioned based on the “before-attack”, “after-attack” and “final” states. In each t, the agent allows to pick up two actions of “continue” and “stop” with regards to the environment observation. Hence, when the attack is launched to the system, the agent should learn to select the “stop” action to move from the current state (before-attack or after-attack) to the “final” state and alarms the attack. If so, the agent should select the “continue” action in order to stay in the pre-state. By referring to Figure 3, the agent receives the different rewards for the sake of opting for the action in each state. In this regard, the detection problem is aimed in such a way that the agent will receive the rewards one and zero as penalty coefficients because of opting the action of “stop” and “continue” in the “before-attack” state under normal conditions, respectively.
On the other hand, the agent would take reward b due to the selection of “continue” action in the “after-attack” state. Keeping the above explanation in mind, the objective function of the agent is defined to reduce the summation of the penalty coefficients emanating from action choice for all states. To this end, the objective function can be developed as below:
m i n R p e n = E κ ( r e t | t s < κ t ) + t = κ b | t s > κ t
Wherein ts indicates the stopping time and Rpen reveals the expected value of the penalty coefficient, which is received by the agent. It is also seen that the objective function comprises two key terms related to the received rewards for times ts < κ and ts > κ. In the first term, the agent would get the penalty coefficient because of opting for the “stop” action at time ts < κ. Conversely, the second term shows the summation of the penalty coefficients because of the “continue” action choice in the “after-attack” state at time ts > κ.
Following the proposed problem definition, an appropriate solution method is needed to provide with regards to the main goals (i.e., the attack alarm and the detection delay minimizing). Accordingly, this paper aims to propose an effective IPS-RL-based attack detection approach. To clarify this method, assume that the observed signal of the environment is brought by considering Dt and h (Dt). In addition, the estimate of likelihood related to each Dt, which is indicated by φt, is calculated as follows:
φ t = ( h ( D t ) h ( D b a d , t ) ) T ( h ( D t ) h ( D b a d , t ) )
The value of φt may be zero or close to zero under normal conditions. On the contrary, the high value of φt shows the anomaly condition in the system. We assume that an action value is defined for each action-observation pair made by the agent and environment.
This method includes two fundamental steps, namely (1) the learning phase and (2) the detection phase. The first step is provided based on the proposed problem definition to absorb an action value, indicated by P (o,a), for each action-observation pair by considering many knowledge episodes. All of the learning values are stored in Y table in order to use in the second phase. Firstly, the arbitrary action and observation need to be defined based on the “before-attack” state (U) at time 1. Following collection Xt, the observation signal (ot + 1) is calculated by considering the estimate of likelihood φt at time t + 1. With regards to ot + 1, the optimal action (at + 1) is determined according to ɛ-greedy policy, which is aimed to opt for the best action based on the minimum action value (P) and probability 1 − ɛ. It is significant to say that the current action value is updated by using SARSA, which is able to carry out well over PODMP [18].
The Y table needs to be revised by using the new action value P and the action-observation pair is updated to make the new reward value and state at times t<κ and t > κ. This training process related to the first phase is stopped when the “stop” action is opted by the agent for all episodes. The second phase is aimed to detect the unknown anomaly with the use of the Y table trained by the learning phase. In fact, this phase should determine the stopping time ts and alarms the online attack by using a “stop” action choice. Overall, according to the suggested detection method, the agent is trained to optimal action with the use of minimizing penalty coefficient. This training agent is capable of detecting the online attack as fast as possible stopping time. As it can be seen, the action value updated based on the SARSA algorithm is calculated according to the coefficient α, which is an effective coefficient to get into an optimal learning phase. In other words, the first phase can be optimized with the use of an optimal selection of the coefficient α. To this end, we would propose a proper method based on intelligent priority selection (IPS), aiming to optimize the α value.

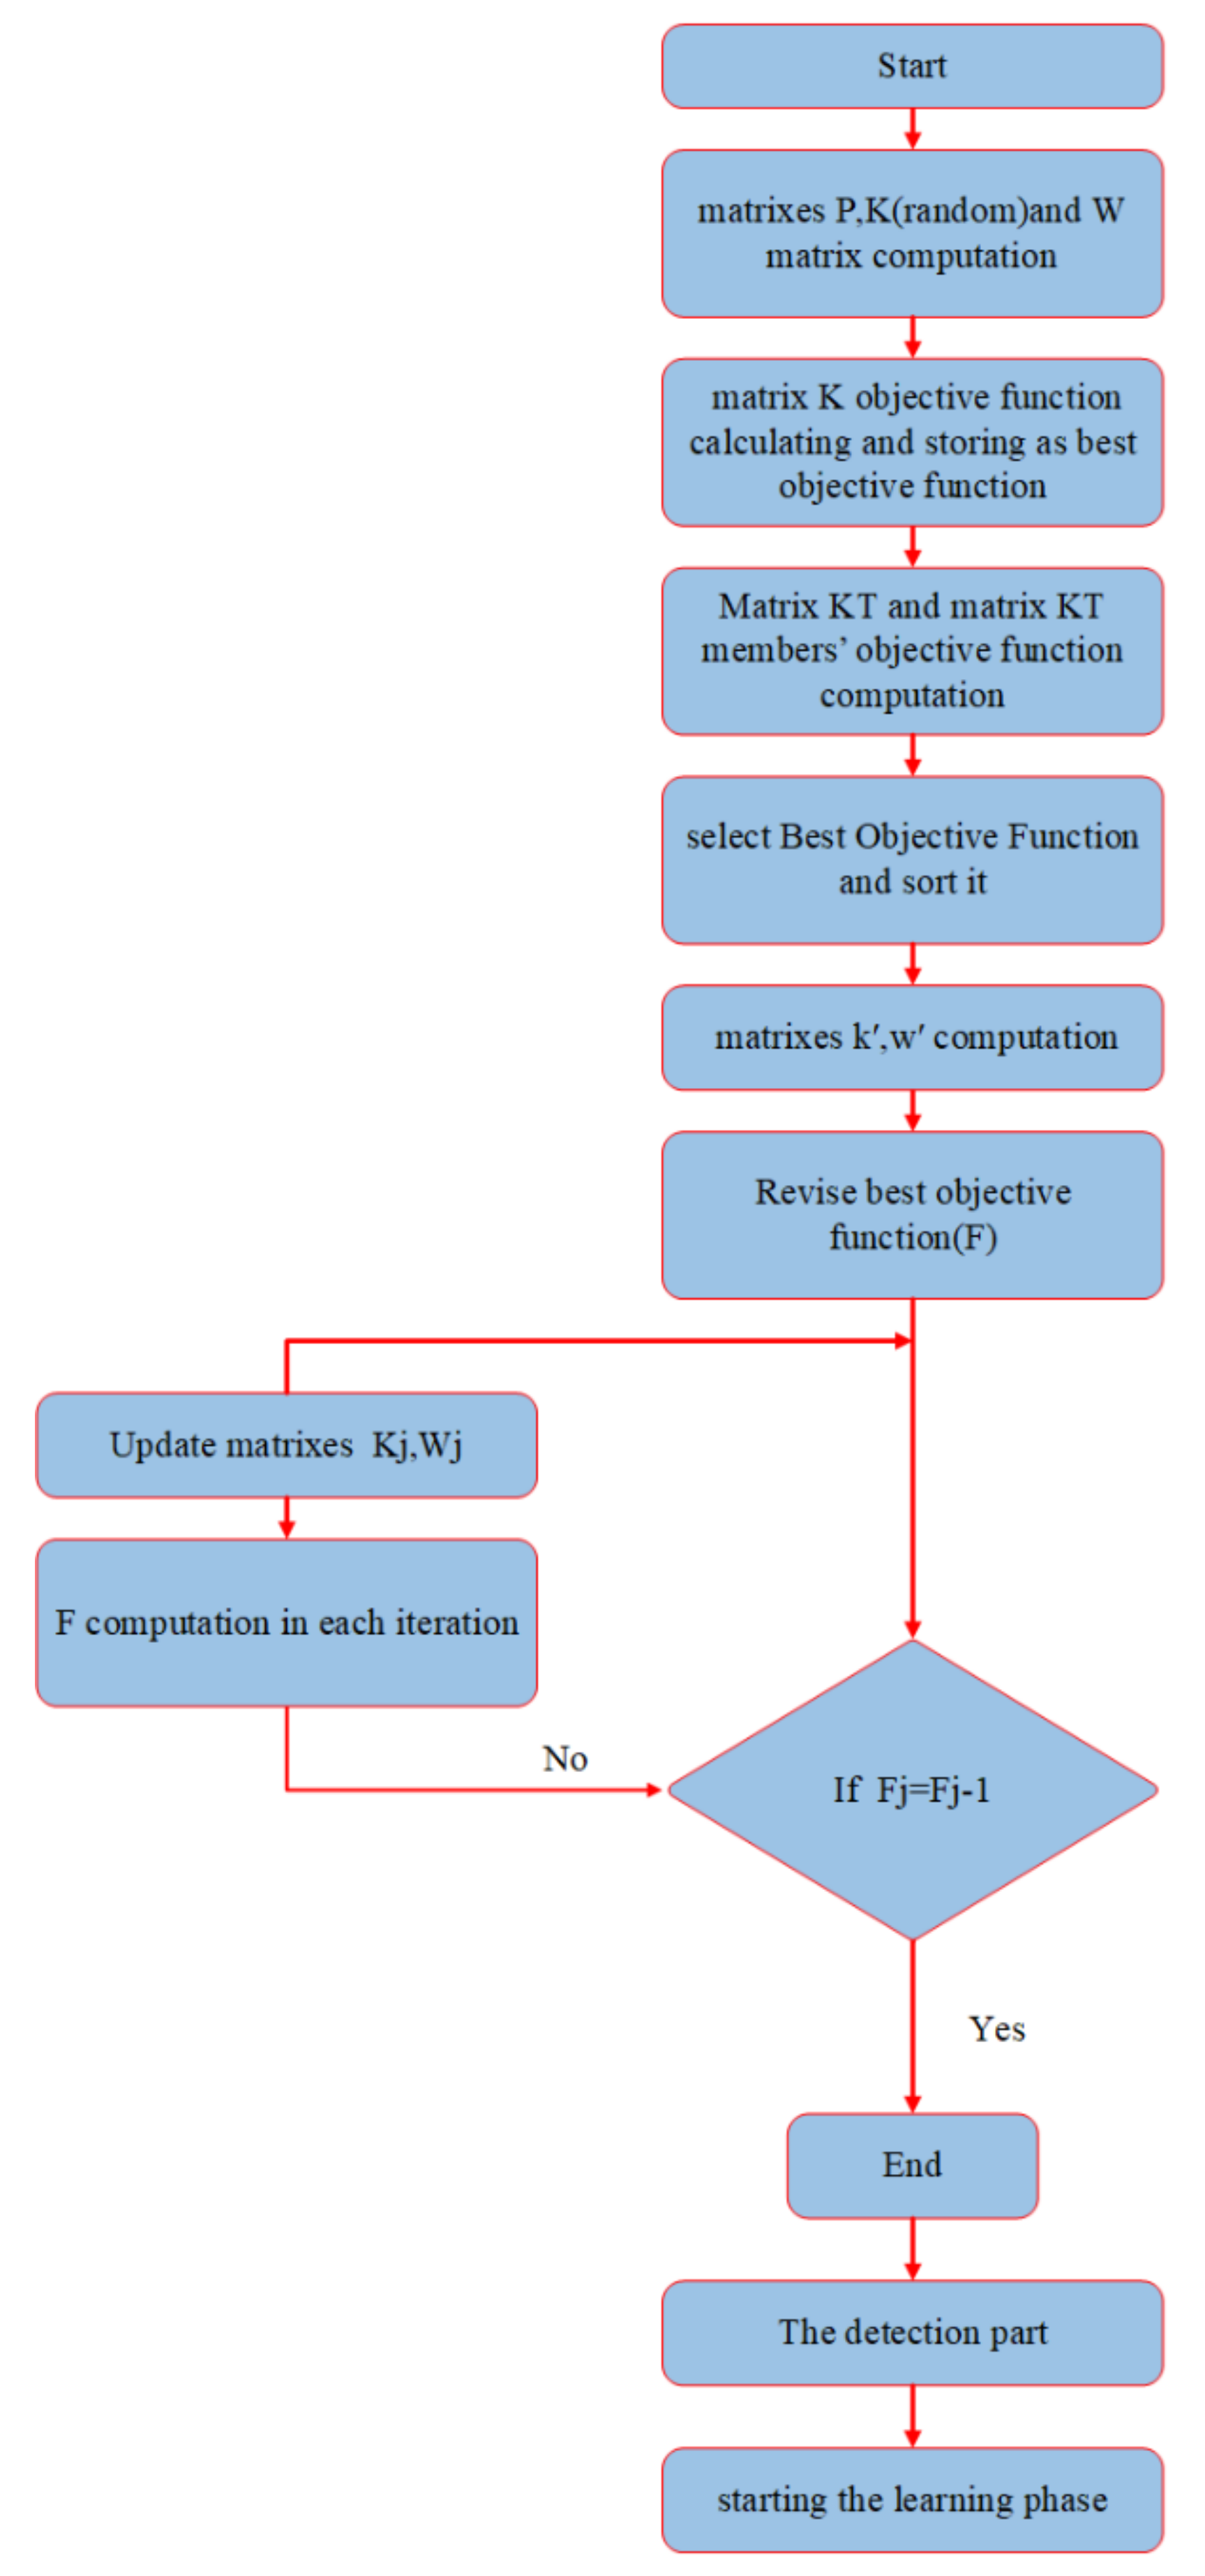
3.3. Intelligent Priority Selection Algorithm

This section proposes a method to adjust α for optimizing the learning phase. Different methods are provided and commonly utilized by researchers to solve optimization problems according to math simplifications or artificial intelligence. Nevertheless, time-consuming and low accuracy are involved in them. This section introduces an effective method based on stochastic solutions to enhance accuracy and mitigate the CPU time. In the statistics, the number of combinations of N out of n is computed as follows:
N n = N ! n ! . ( N n ) !
This shows that the problem space can have many results. A quite reliable approach is to make use of the brute force solution to find the most fitting one. However, it takes a long time due to the very wide search space. To handle this problem, the proposed model mitigates the search space to save time as much as possible. In this regard, the subsequent process indicates the proposed method:
Step1: It is supposed that P is a set of possible solutions to the problem. The matrix K is randomly considered for the control variables initially. The remaining solutions (P-K) are stored in W. All probable sets are substituted by using the sets of K members for any point in W, which is called KT. As modeled in (34), each individual in H is calculated by the embedment of the i-th member of the W into the set K followed by computing the optimal value of the fitting function in i-th H W i , indicated as F W 1 , K n b e s t . It should be mentioned that K n in (34) demonstrates the n-th element of the K substituted by the elements of the W .
P = [ p 1 , ..... , p N ]
K = [ k 1 , ..... , k n ]
W = [ w 1 , ..... , w m ]
K T = w 1 k 1 = k 1 k 2 ..... k n k 1 w 1 k 2 = k 2 ..... k n k 1           k 2 ..... w 1 k n = k n H w 1 ... w m k 1 = k 1 k 2 ..... k n . . . k 1               k 2 ..... w m k n = k n H w m F H w 1 = F w 1 , k 1 b e s t F H w m = F w m , k m b e s t , H w i = H w 1 , H w 2 , ... , H w m                                                         i Ω i k M = k 1 , k 2 , ... , k n                                                                                     M Ω M
The element of i-th H W i , as illustrated in Equations (35) and (36), are sorted with regards to the objective function value. Components of W are arranged by considering the fitting function. The W j matrix is indicated as an array of the W matrix components (37) defined in this thread. This process is also precise for set K j (38). In this stage, the value of the objective function for W 1 is opted, eventually, as the optimal answer (39).
F m b e s t = F w 1 , k 1 b e s t . . F w m , k m b e s t m Ω m
F b e s t _ s o r t = F w 1 k 1 b e s t . . F w m k m b e s t
w j = [ w 1 , ... , w m ] m Ω m
k j = [ k 1 , ... , k m ] m Ω m
F = F w 1 k 1 b e s t
Step2: this stage is aimed to obtain the new K T ( K T r n e w ) matrix. First, the W j the matrix needs to be updated by (40) using the w j matrix components. By considering the w 1 as the best option in the earlier iteration, W 2 initializes this step as stated in (19). K 1 j n e w is defined by removing the k j and w j from the K j matrix described in (41). The new K T r n e w component (such as Equation (33)), is created from all of these sets substituting each W j with a component of   K 1 j n e w . Based on K T r n e w and w j , the combination of sets is shown ψ r   in where r is defined between 1 and m j , which j is the number of iteration and m is a constant value, implying the matrix length of W in the first step as shown in (42). The objective value is calculated for each member of ψ r and the best the objective function ( F 1 B e s t ) and the relevant component is stored by (43) and (44) in matrix ψ r ( ψ B e s t ), respectively. for each iteration the matrix K needs to be modified by
ψ B e s t (45) as indicated in (46).
W j = w j + 1 j Ω j
K 1 j n e w = x x K j , x k j , x w j j Ω j
ψ r = K T r n e w w j j Ω j , r Ω r = [ 1 , 2 , ... , m j ]
F 1 r = f ( ψ r )
F j = F 1 B e s t j Ω j
K j = ψ B e s t j Ω j
Step3: In each iteration, the last component has opted as the optimal one among the other components.
F b e s t _ t o t a l = F B e s t
The flowchart of the suggested optimization algorithm is indicated in Figure 4.

4. Salp Swarm Optimization Algorithm

This section is aimed to describe an effective optimization method to solve the studied model. To this end, this paper proposes the optimization algorithm based on the salp swarm method to handle the energy management for the microgrid system interconnected to the smart hub system [38,39]. Firstly, to elaborate the algorithm procedure, some explanations need to be depicted here. For the last few years, some researchers have longingly tried to deal with the swarm nature related to the barrel-shaped bodies of salps in order to solve the optimization problems in the power system. To clarify the proposed algorithm, the mathematical formulation of the salp swarm algorithm is described and modeled by (47)–(50). According to the salp chains, the problem population needs to be partitioned into two segments: (1) followers and (2) leaders. In this regard, considering each salp as a particle of population, the first salp of the chain is assigned as the leader and the other salps make the role of followers in the salp swarm algorithm process. Let us assume a matrix U with R dimension in other to save the position of all salps, which are updated in such a way that the swarm goal (F) is satisfied. Updating process of the leader salp is considered as follows:
U r = F r + c 1 ( ( b r l b r ) c 2 + l b r ) c 3 0 F r c 1 ( ( b r l b r ) c 2 + l b r ) c 3 < 0
where in F R and
U R imply to the food source and the position of the leader salp, respectively. As it can be seen, the position of leader salp is limited by B R , L B R in which parameters c 1 , c 2 , c 3 are randomly obtained during the updating procedure. It is worth mentioning that the updating process’s effectiveness depends on the suitable choice of parameter c 1 , which is calculated as follows:
c 1 = 2 e ( 4 a A )
In the above equation, c1is determined based on the iteration number in each iteration   a . Also, c2 and c3 are selected in the range of [0, 1]. In addition, the position of followers is iteratively updated as follows:
U r i = 1 2 w a 2 + v 1 a
In process of updating the follower Ith ( U r i ), v 1 is defined as the initial speed of the salp chain and w   is obtained based on the chain speed as below:
  w = v v 1  
In case of having v 1 = 0 , the Equation (49) is turned into the Equation (50) as follows:
U r i = 1 2 ( U r i + U r i 1 )
To sum, formulation related to the salp swarm algorithm can be modeled by using Equations (47)–(50).

5. Stochastic Modeling Based on Ut Method

For the last few years, researchers have tried to model the stochastic inherent of some parameters in the power system structure. In this regard, it is important to describe a close look at their effects on energy management. By doing so, this section is dedicated to explain the stochastic effects modeled by the UT method. It is worth mentioning that the UT method is capable of modeling the correlation environment among the stochastic parameters such as the electrical, thermal and water loads, the wind speed, solar radiation, tidal current. The proposed method can be defined by using S = f ^ X with regards to 2p + 1 different points. The UT method is designed in such a way that the uncertainty parameters are brought by using the normal distribution function considering the mean and standard deviation values related to the parameter which is shown by   m   and   σ . In the following The UT method process is formulated by steps (1) to (3):
Step 1: 2p + 1 points is obtained by using (52)–(54) as follows:
X 0 = m
X k = m + p 1 W 0 A a a k k = 1 , 2 , ... , p
X k + p = m p 1 W 0 A a a k k = 1 , 2 , ... , p
where A a a imply to the covariance matrix and X ¯ = m .
Step 2: Weight of points is computed by (55):
W k = 1 W 0 2 c k = 1 , 2 , ... , 2 c
Note that the summation of the weights related to each point should be equal to 1.
Step 3: by having the points calculated by step 1, the output values are defined by:
S ¯ = k = 0 2 p W k S k
P F F = k = 1 2 p W k S k S ¯ S k S ¯ T

6. Simulation Results

This section is first dedicated to the optimal performance of the proposed energy hub-based microgrid system optimized by the salp swarm algorithm. Then, validating and assessing the proposed attack detection scheme based on the IPS-RL method in order to secure the studied model against malicious anomalies is provided as another goal of this section. To do so, firstly, it is worth saying that the proposed microgrid networked on an IEEE 24-bus test system includes renewable energy sources, such as PV, WT, and tidal units. Figure 5 shows the single line schematic of IEEE 24-bus grid. The technical characteristics of smart grid and microgrid are available in [40,41,42]. Also, Table 2 expresses some parameters related to each bus that is a criterion for assessing the accuracy of results. The tidal and WT units are located at buses 1,13,21,12 and 2,15,22,10, respectively. In addition, the PV unit is suggested to locate at buses 7, 16, 17 and 23. As mentioned before, this paper aims to propose an efficient structure of hub system interconnected to the proposed networked microgrid to supply electricity, water and thermal loads located in the far area.
Let us assume that the proposed hub system comprises two sub-hub systems, each of which is located at buses 5 and 11. Furthermore, the simulation is executed utilizing a computer with a 4 GHz processor, core i7 and 16 GB of RAM in GAMS software environment using CPLEX solver for MILP problems, which is linked with MATLAB software. To elaborate and evaluate the work, the analysis and assessment of the proposed model are provided based on different aspects as follows:
Case I: Energy management of the energy hub-based networked microgrid system
Case II: Assessing and validating the IPS-RL method based detection scheme against malicious attacks
Case III: Effects of uncertainties on the performance of the studied system
In the following, each one of the cases will be discussed in detail:

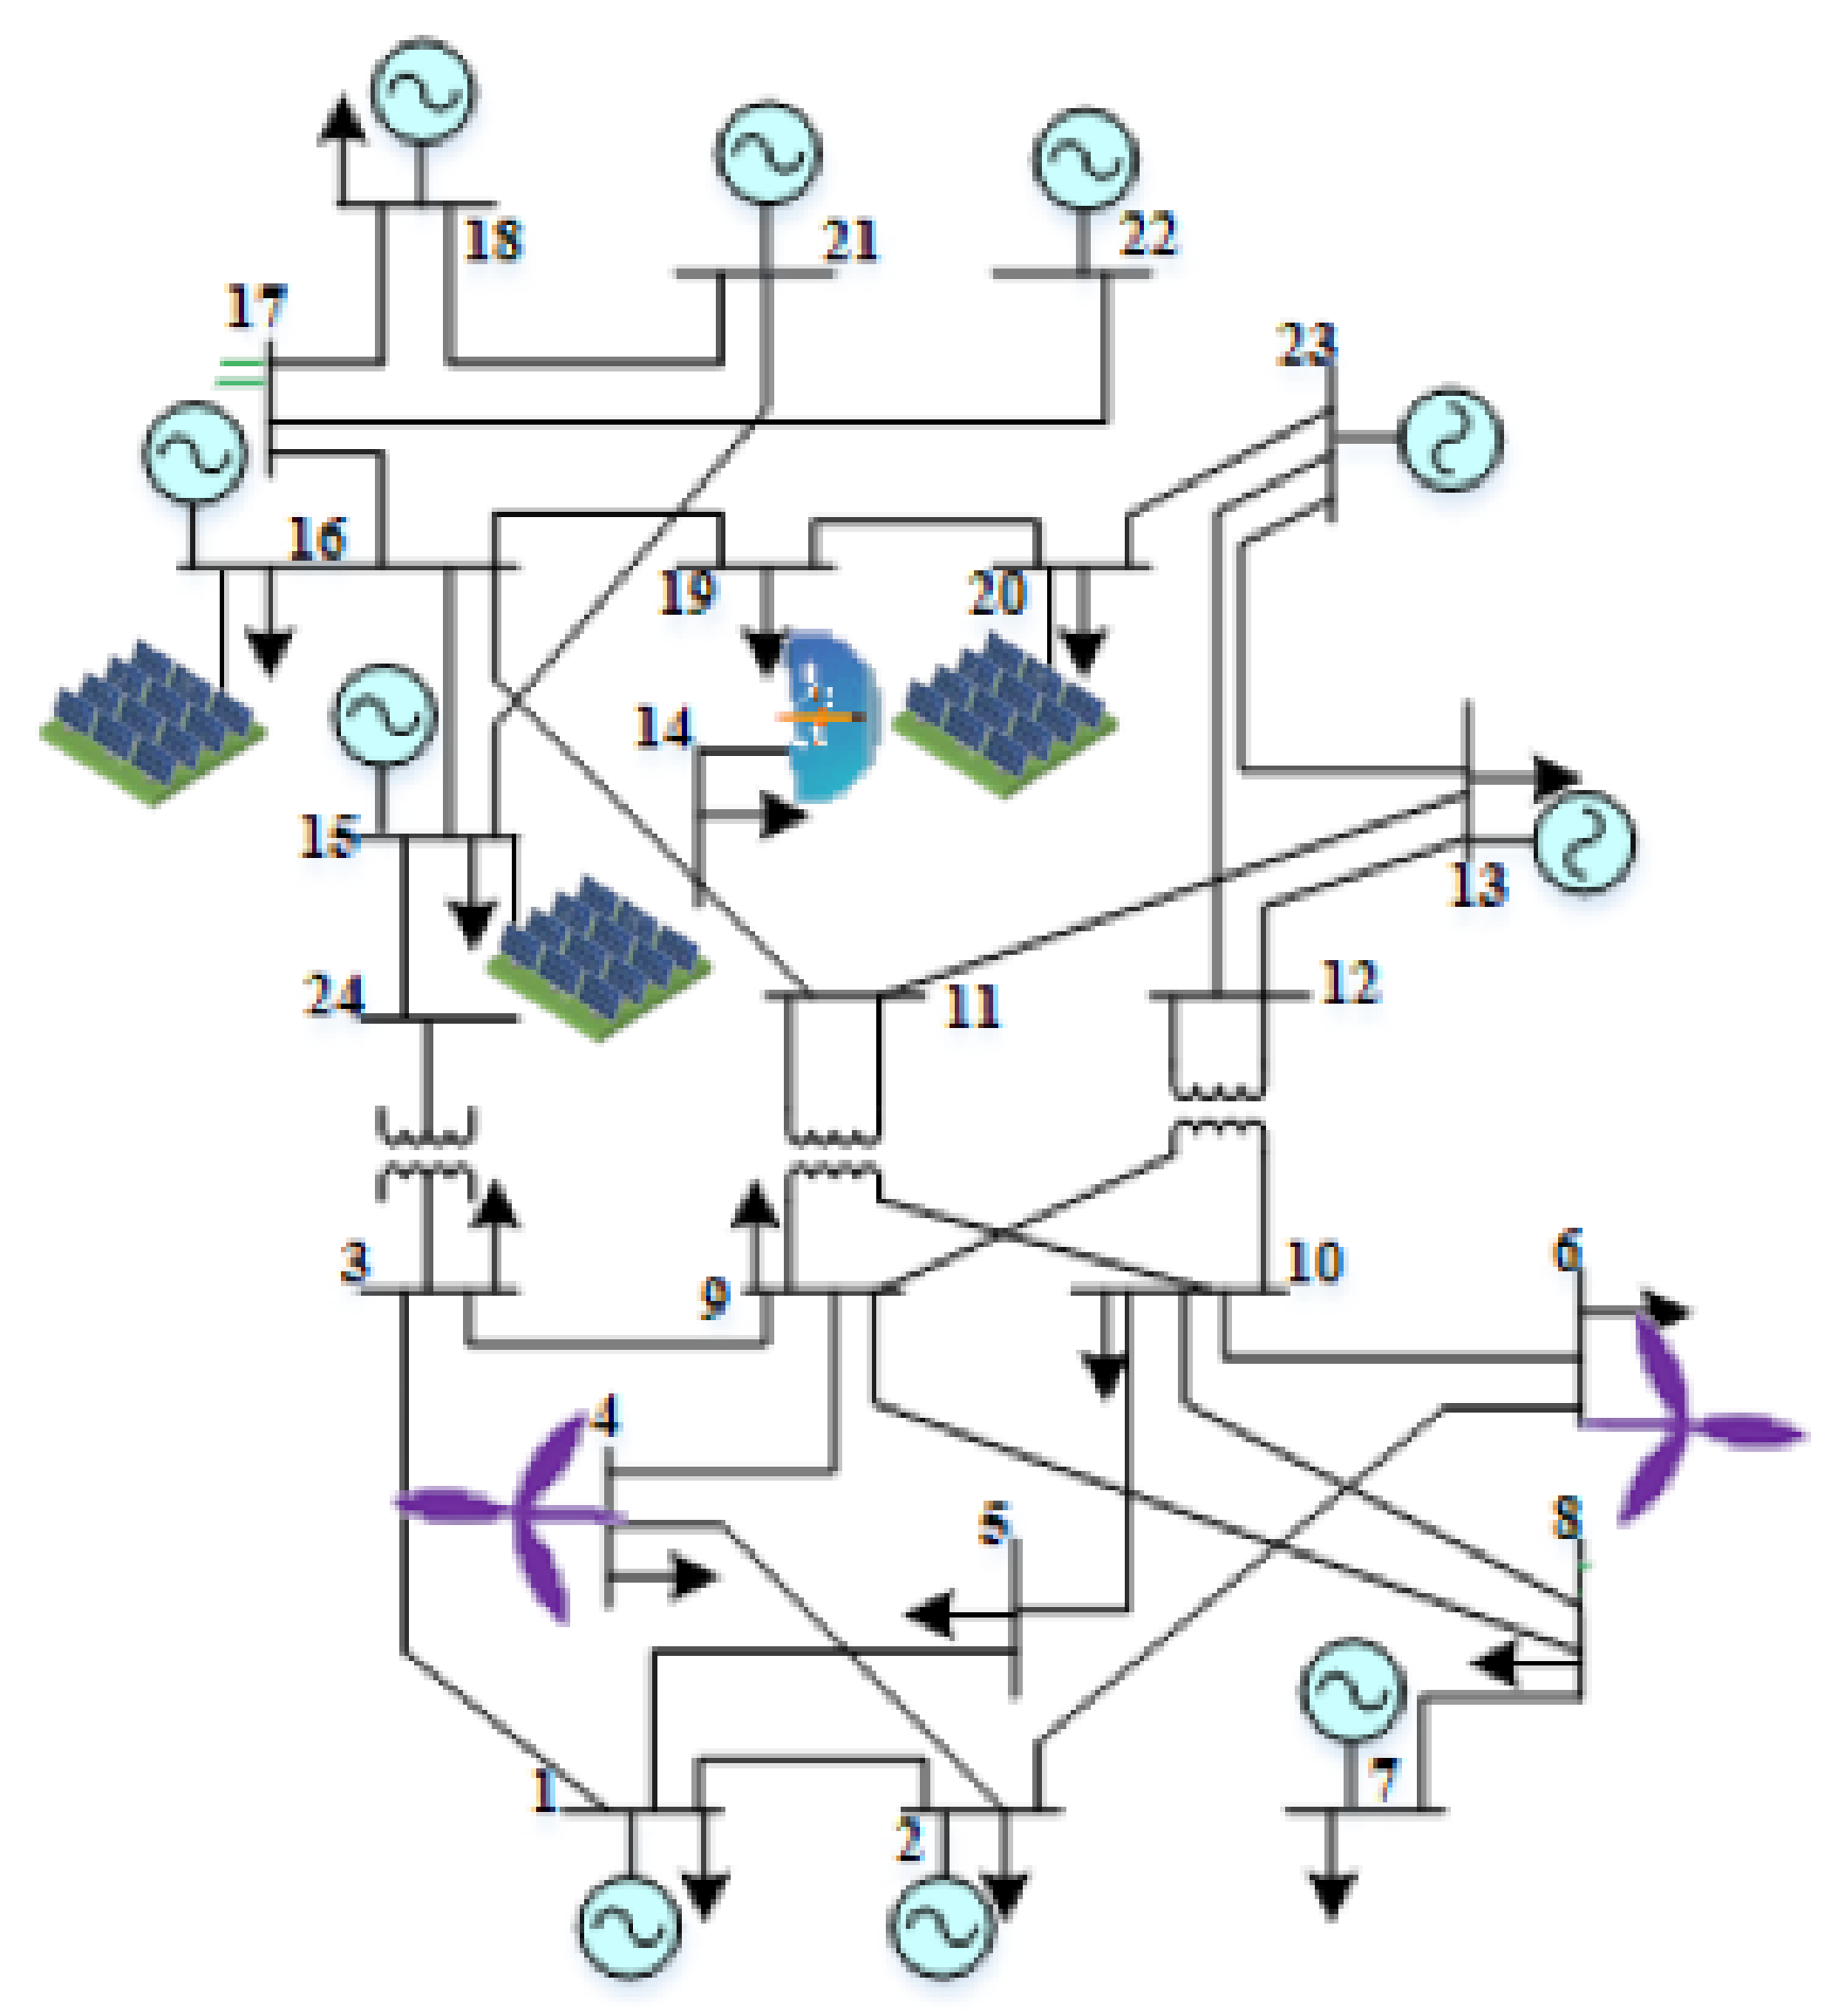
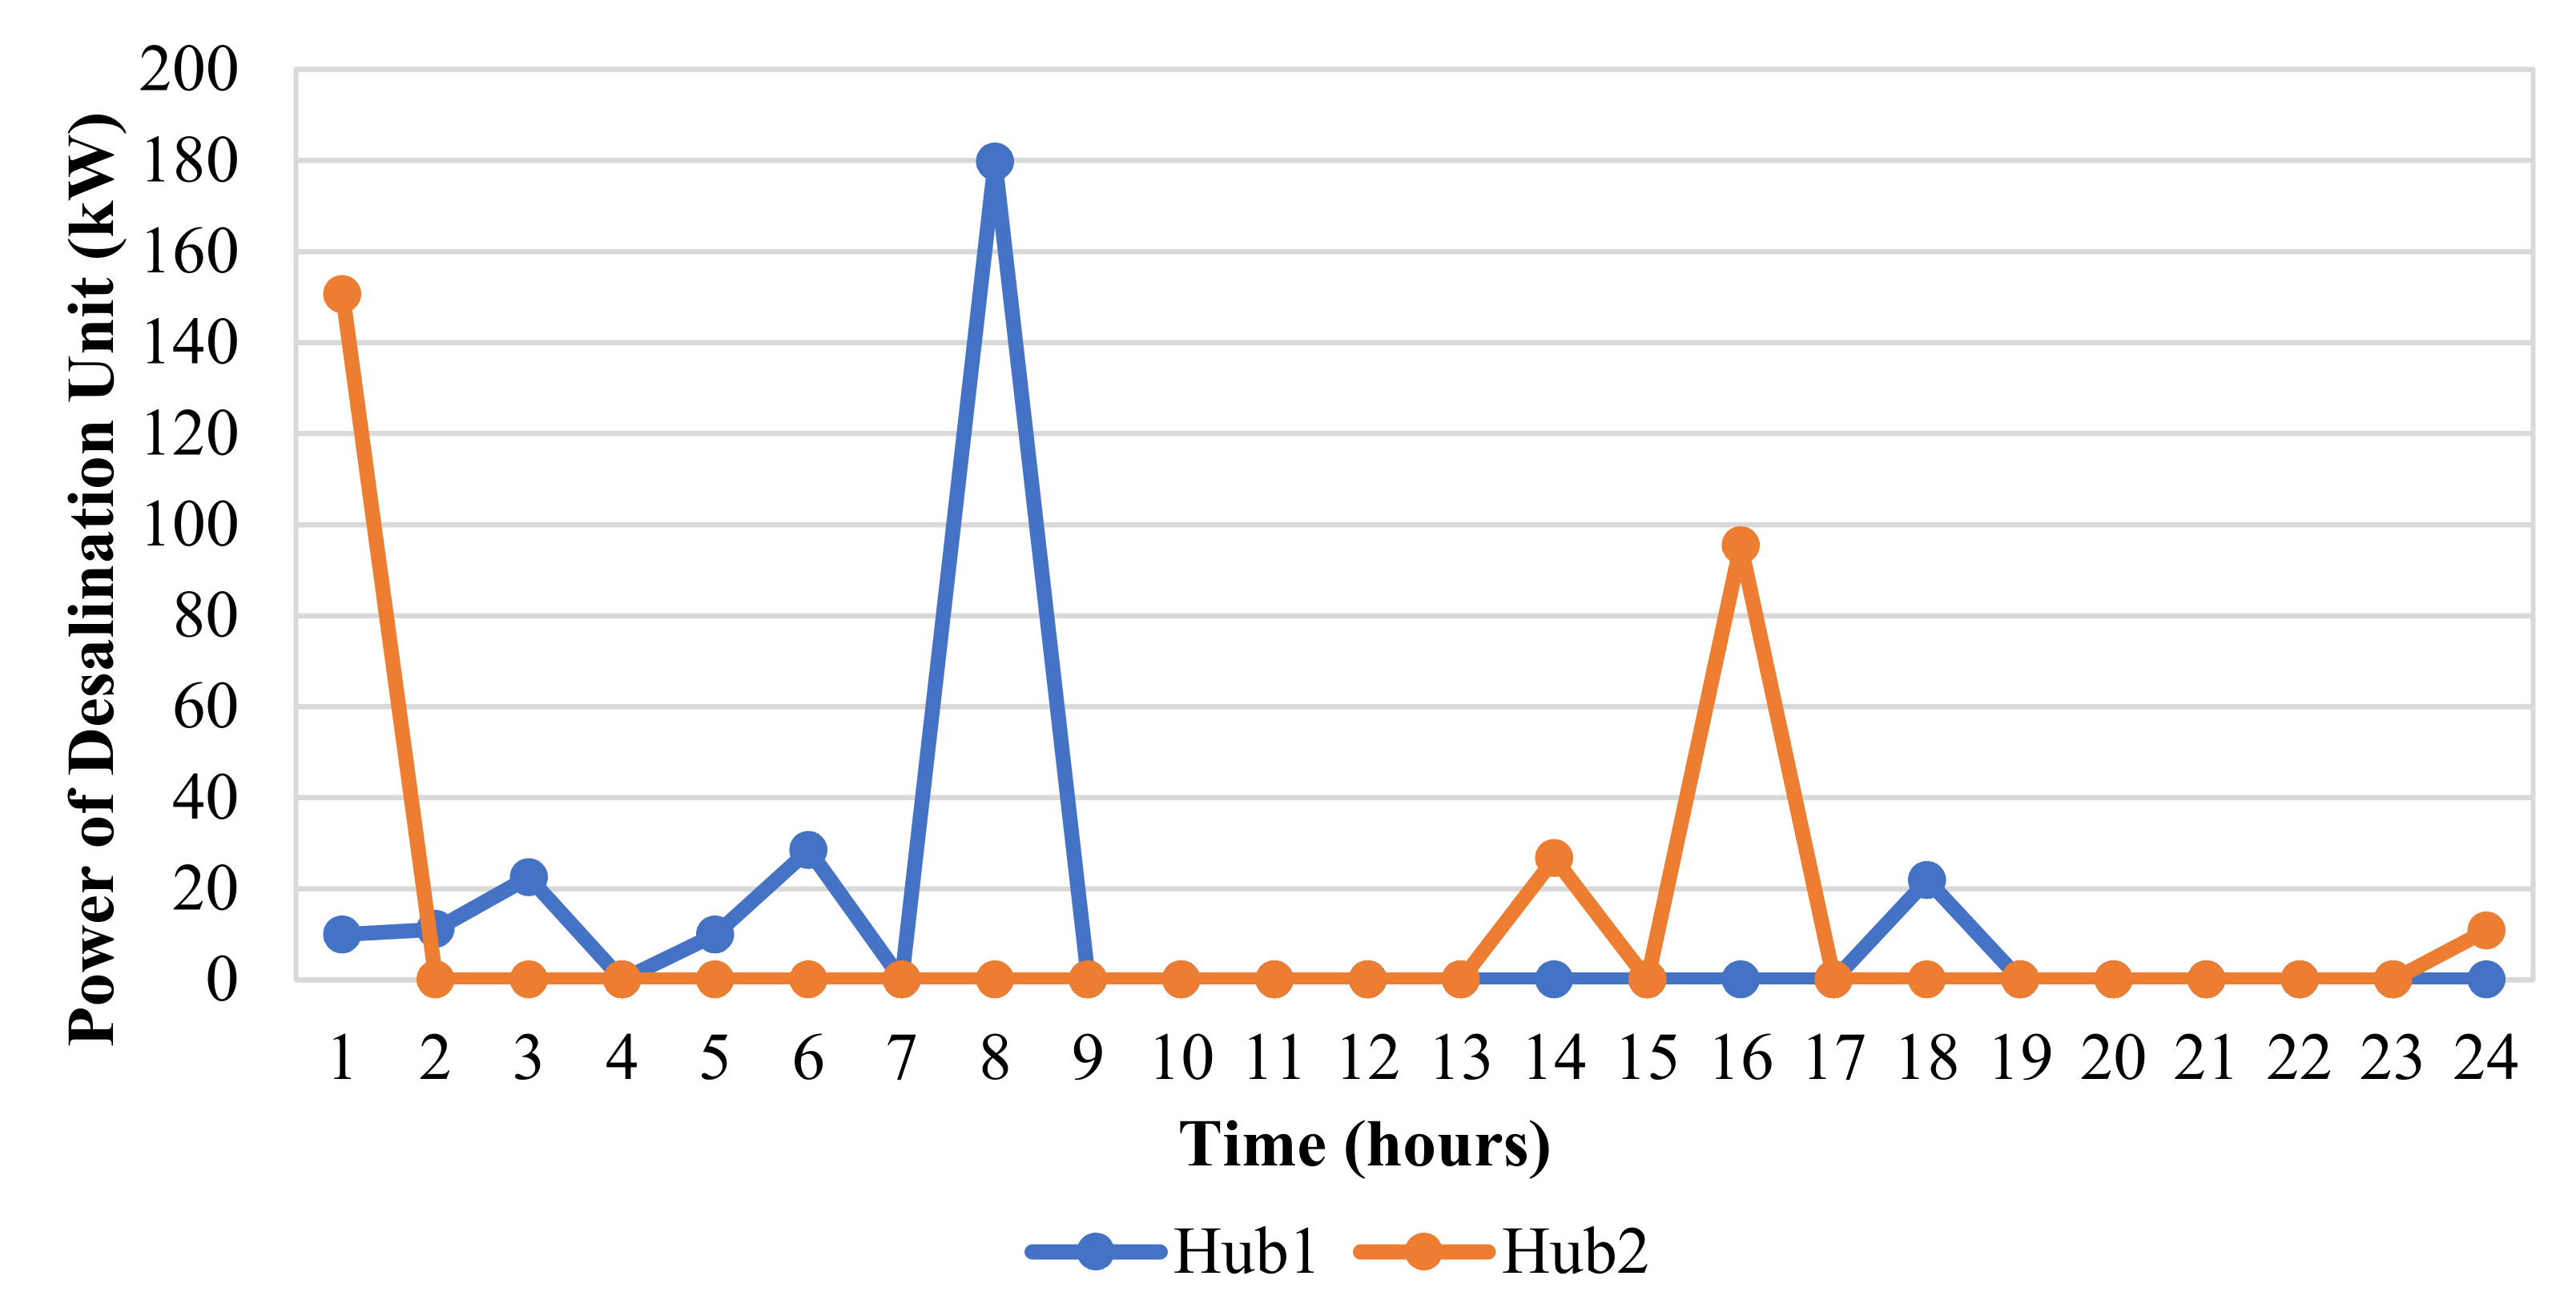
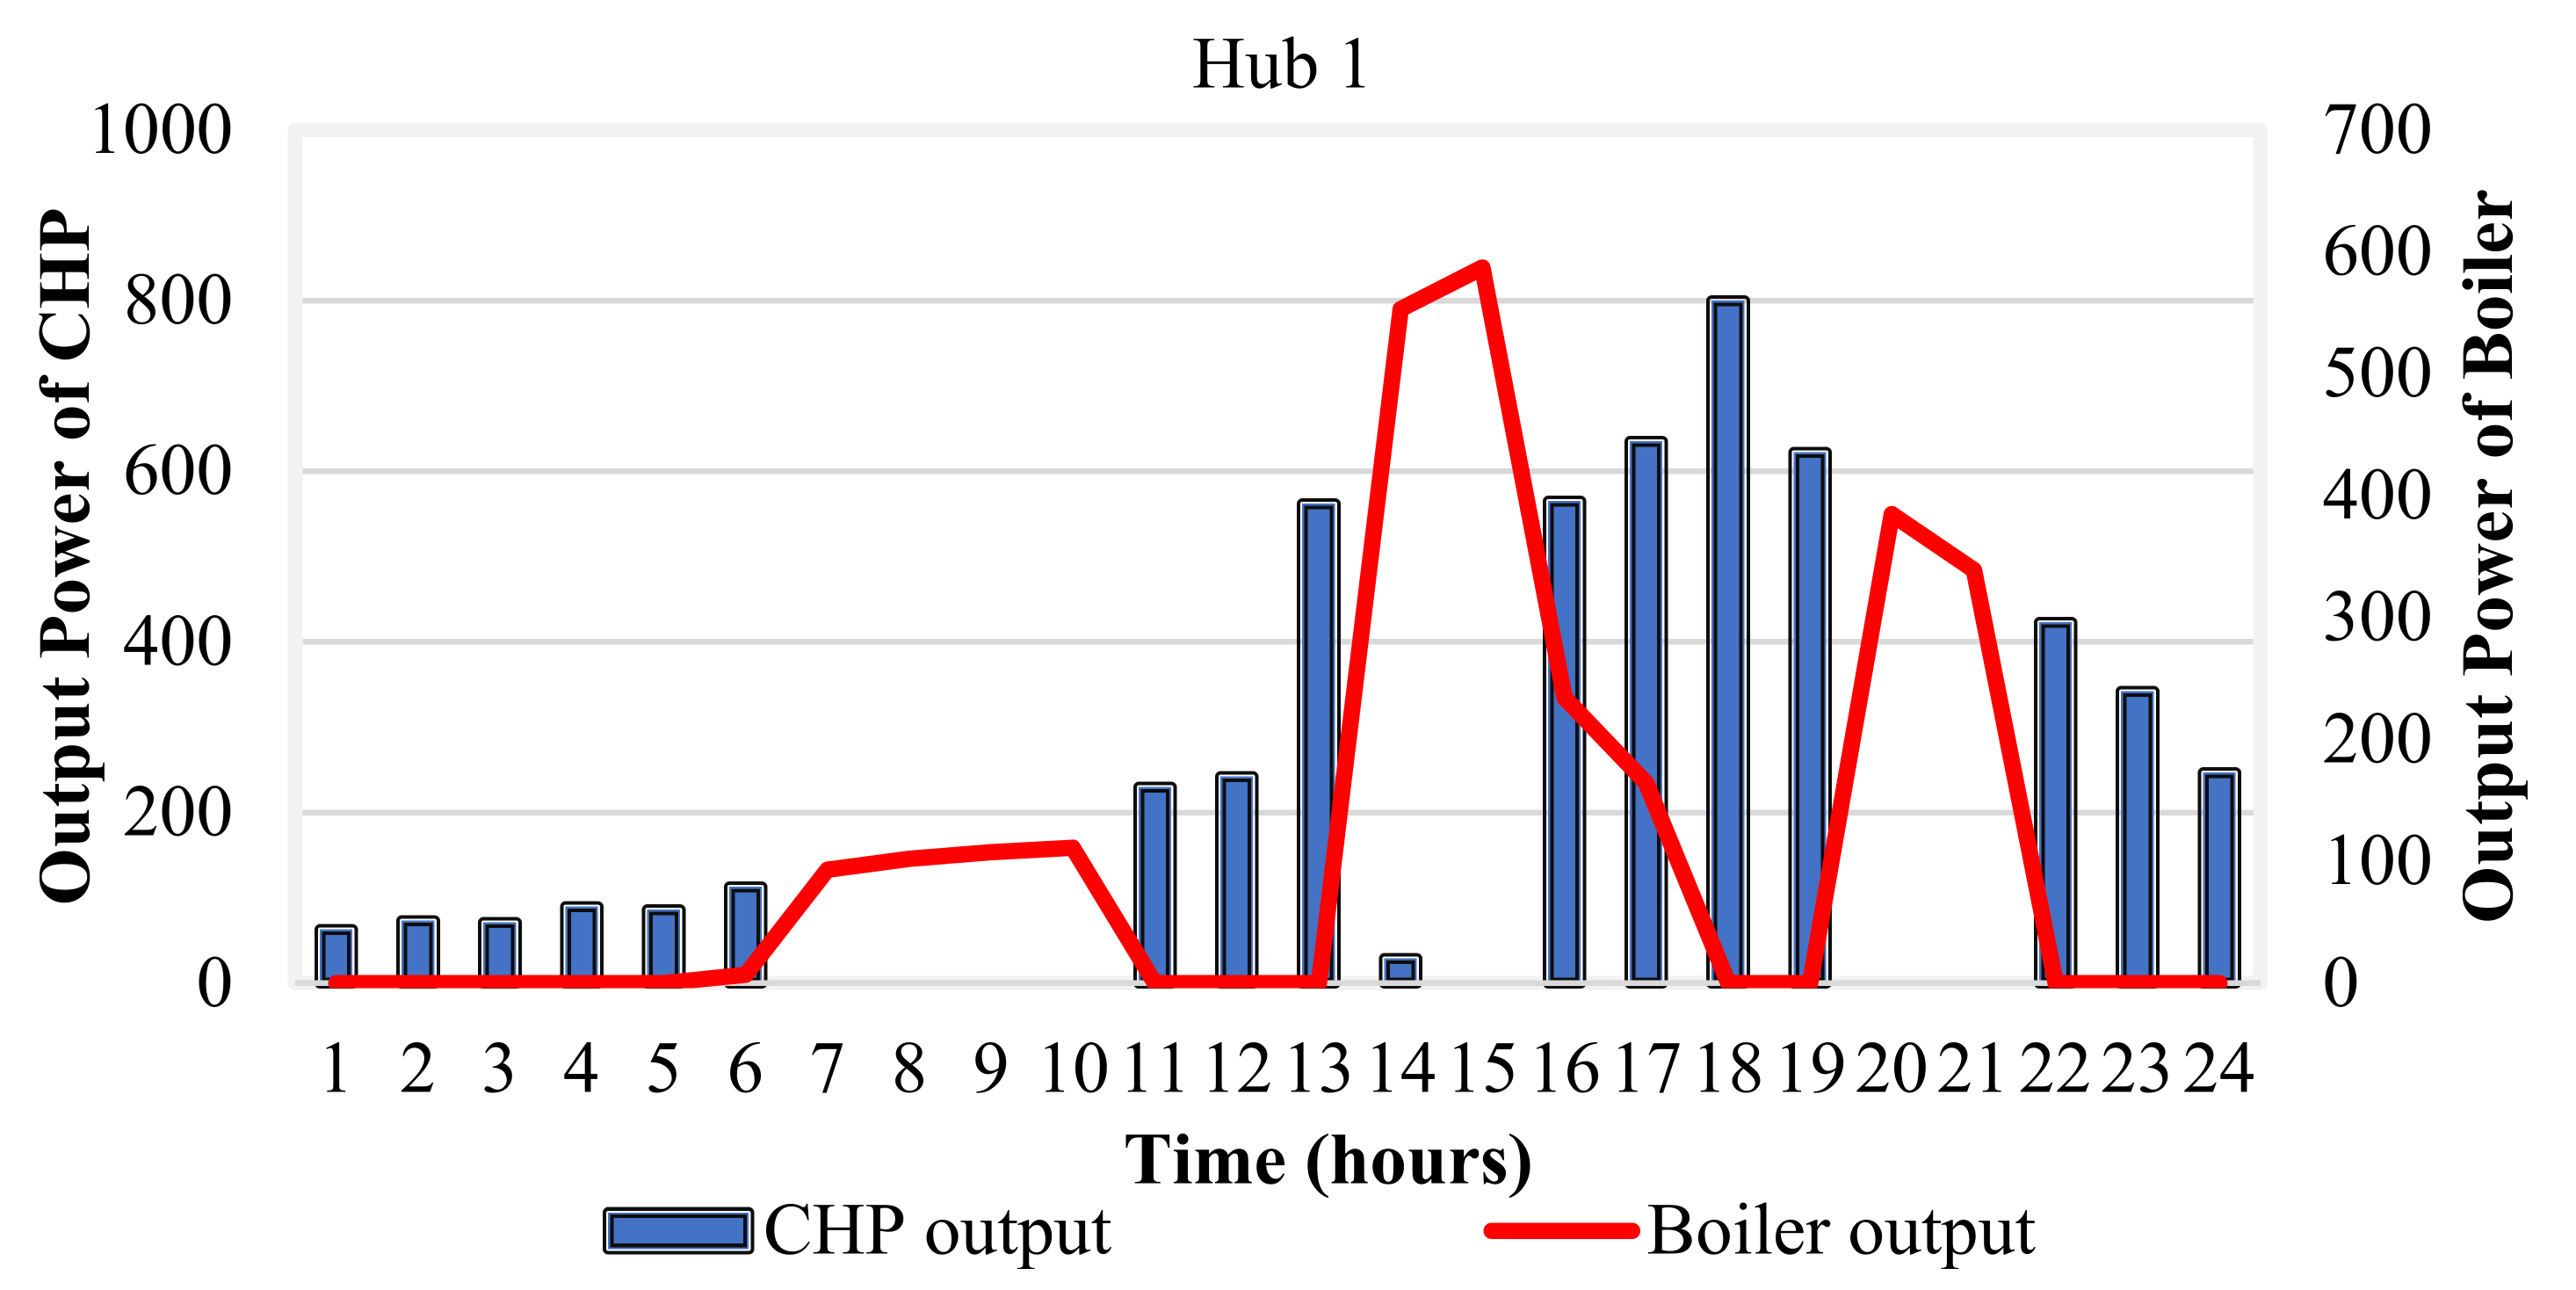
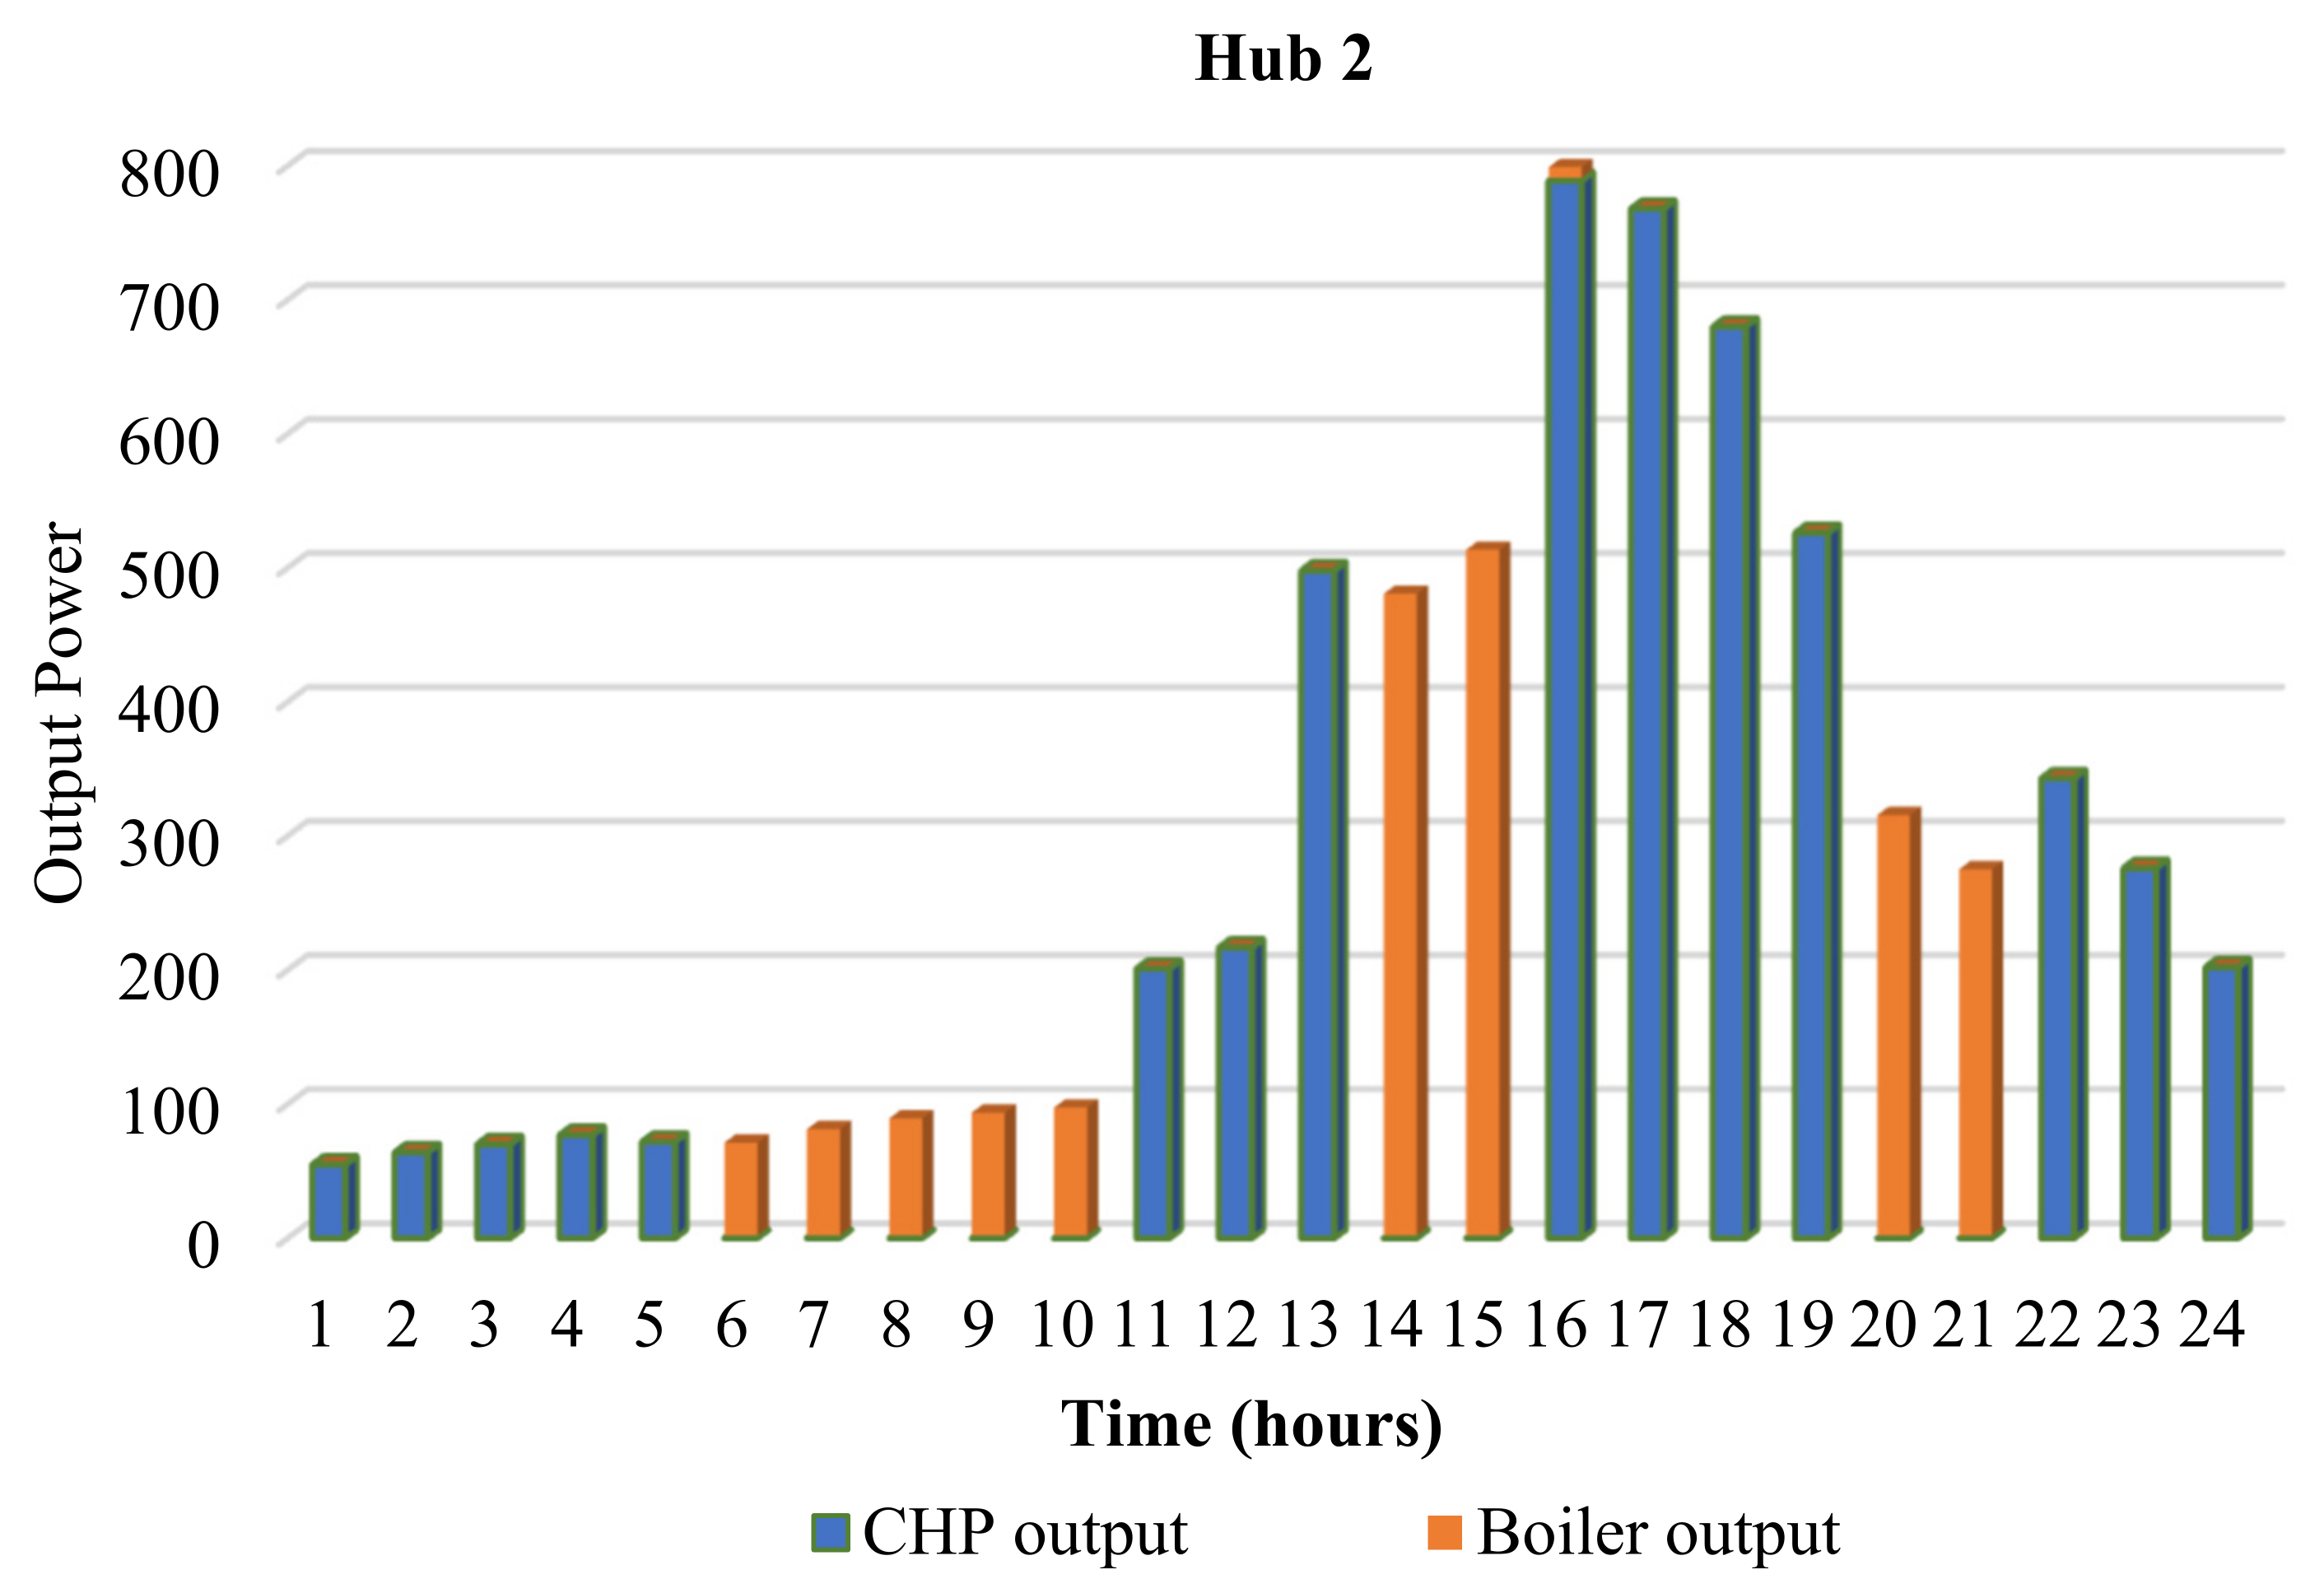
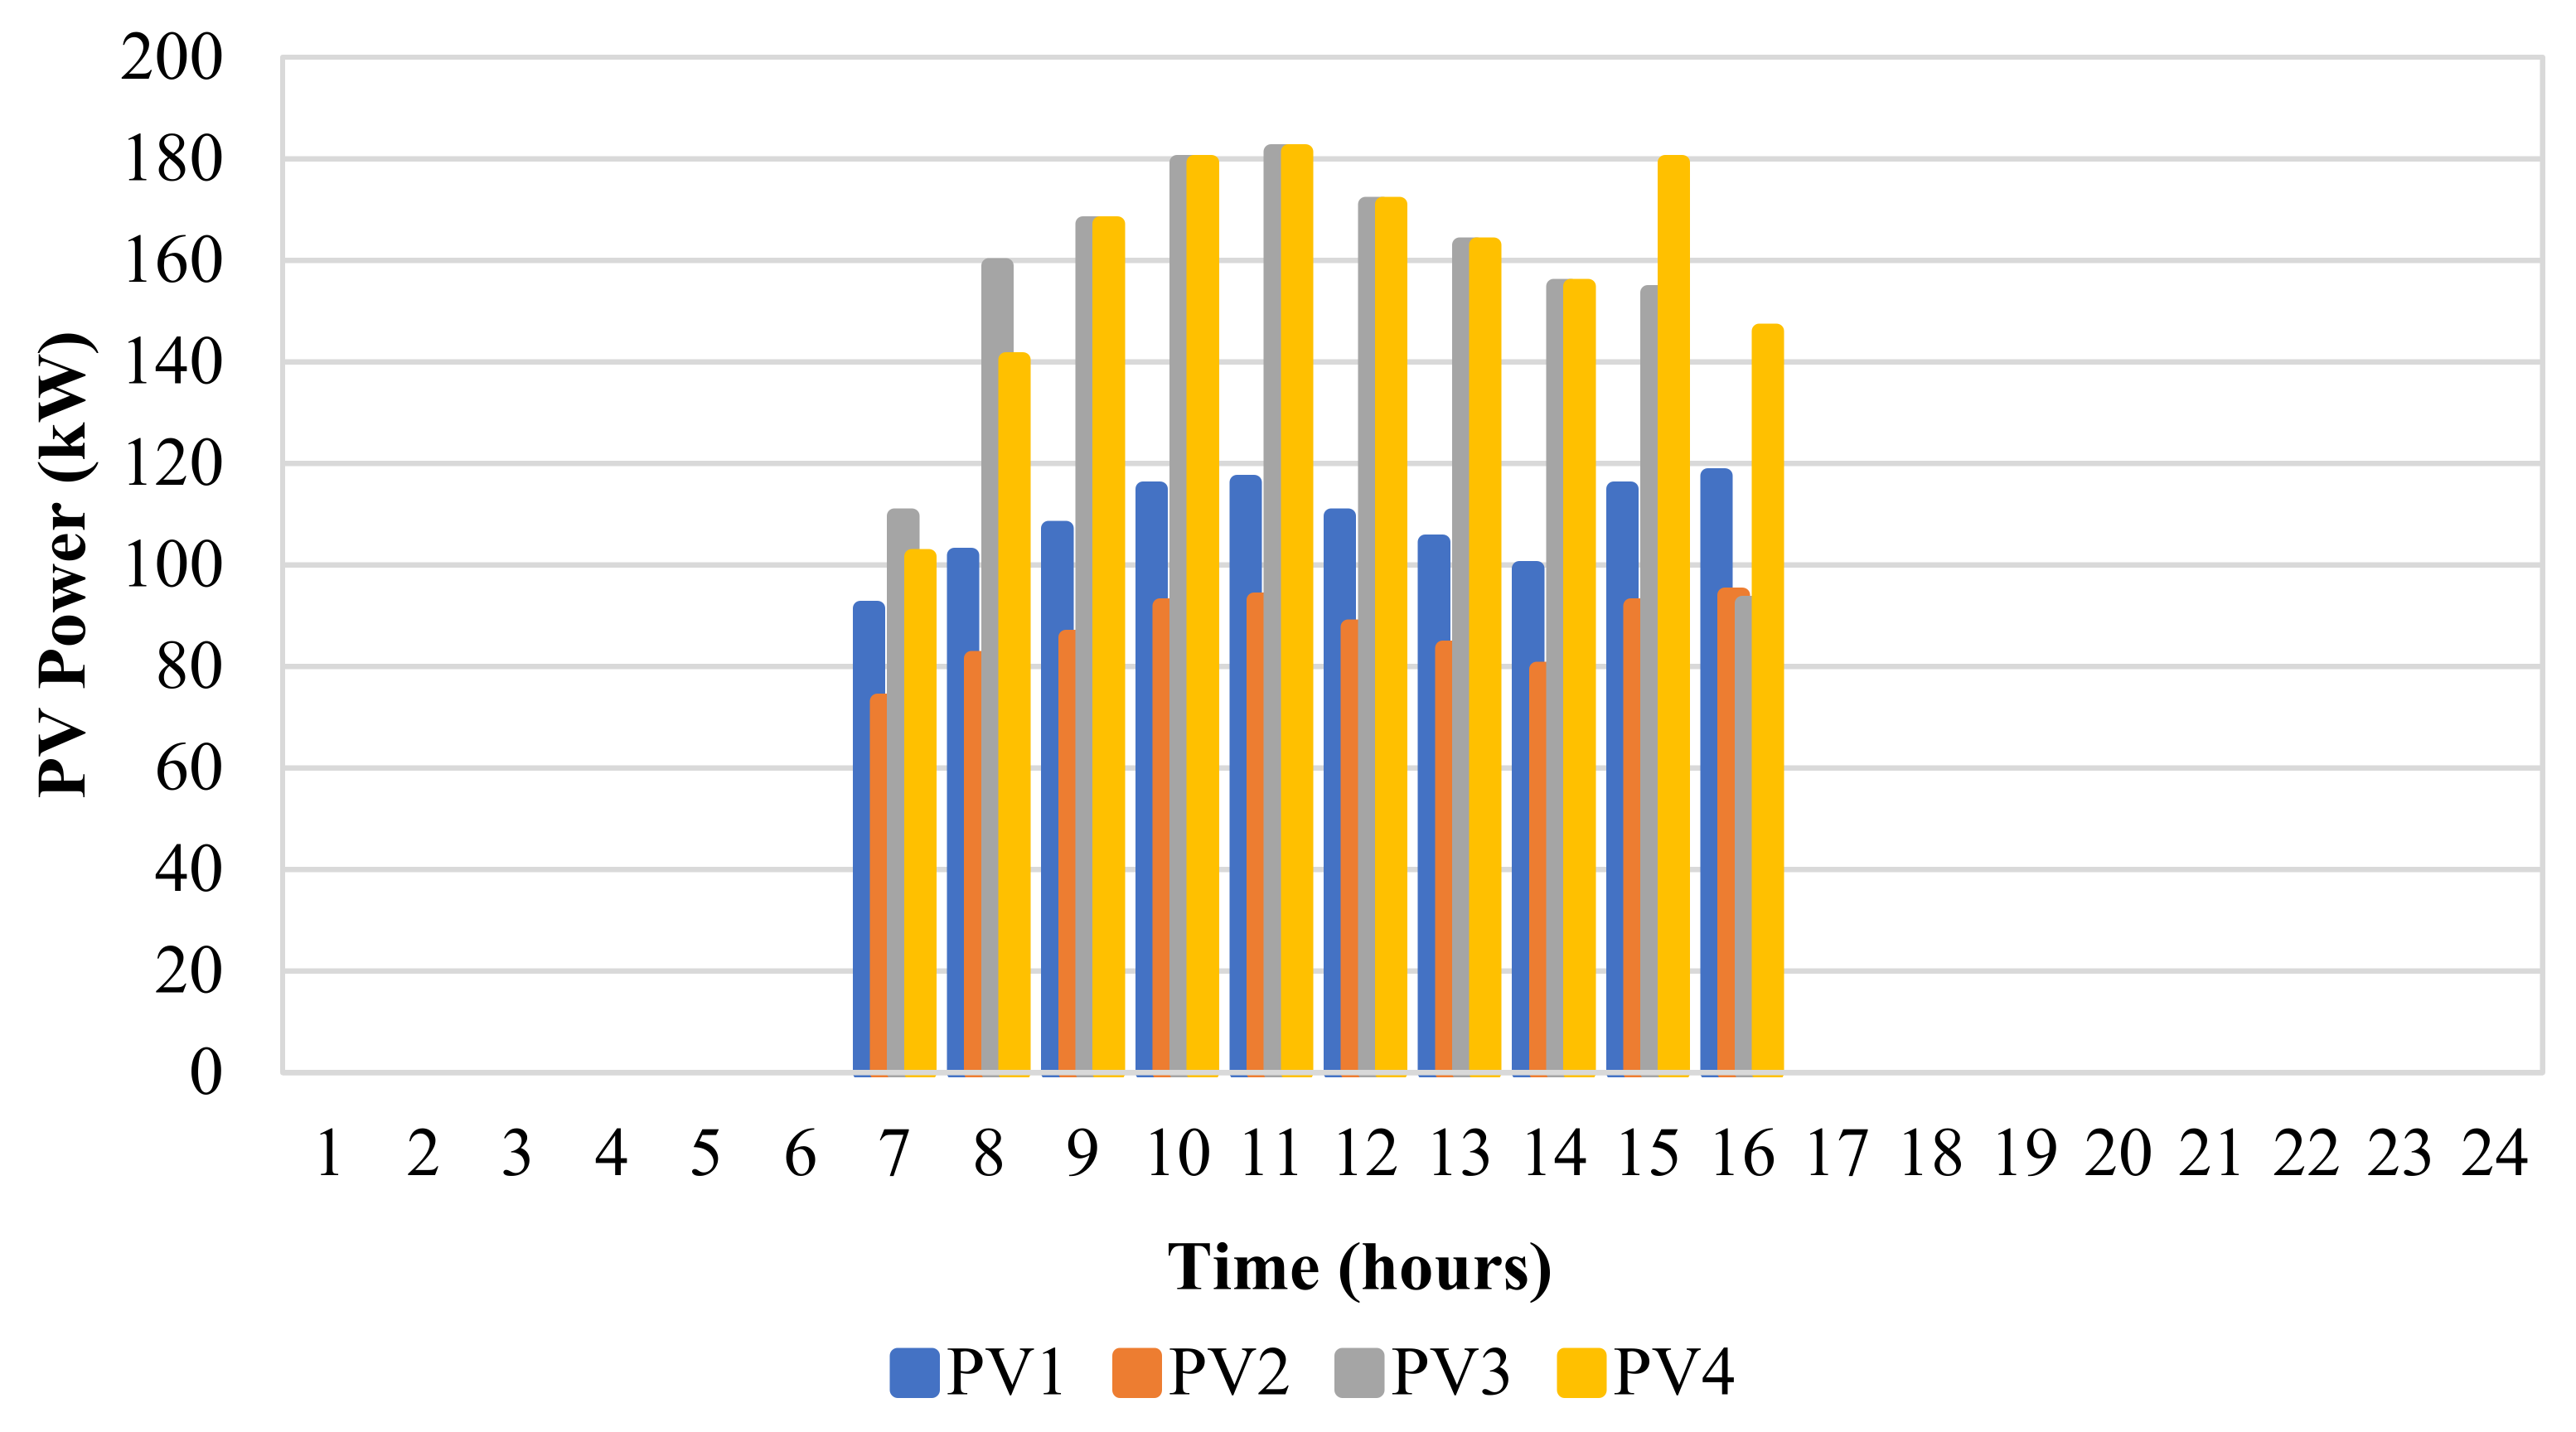
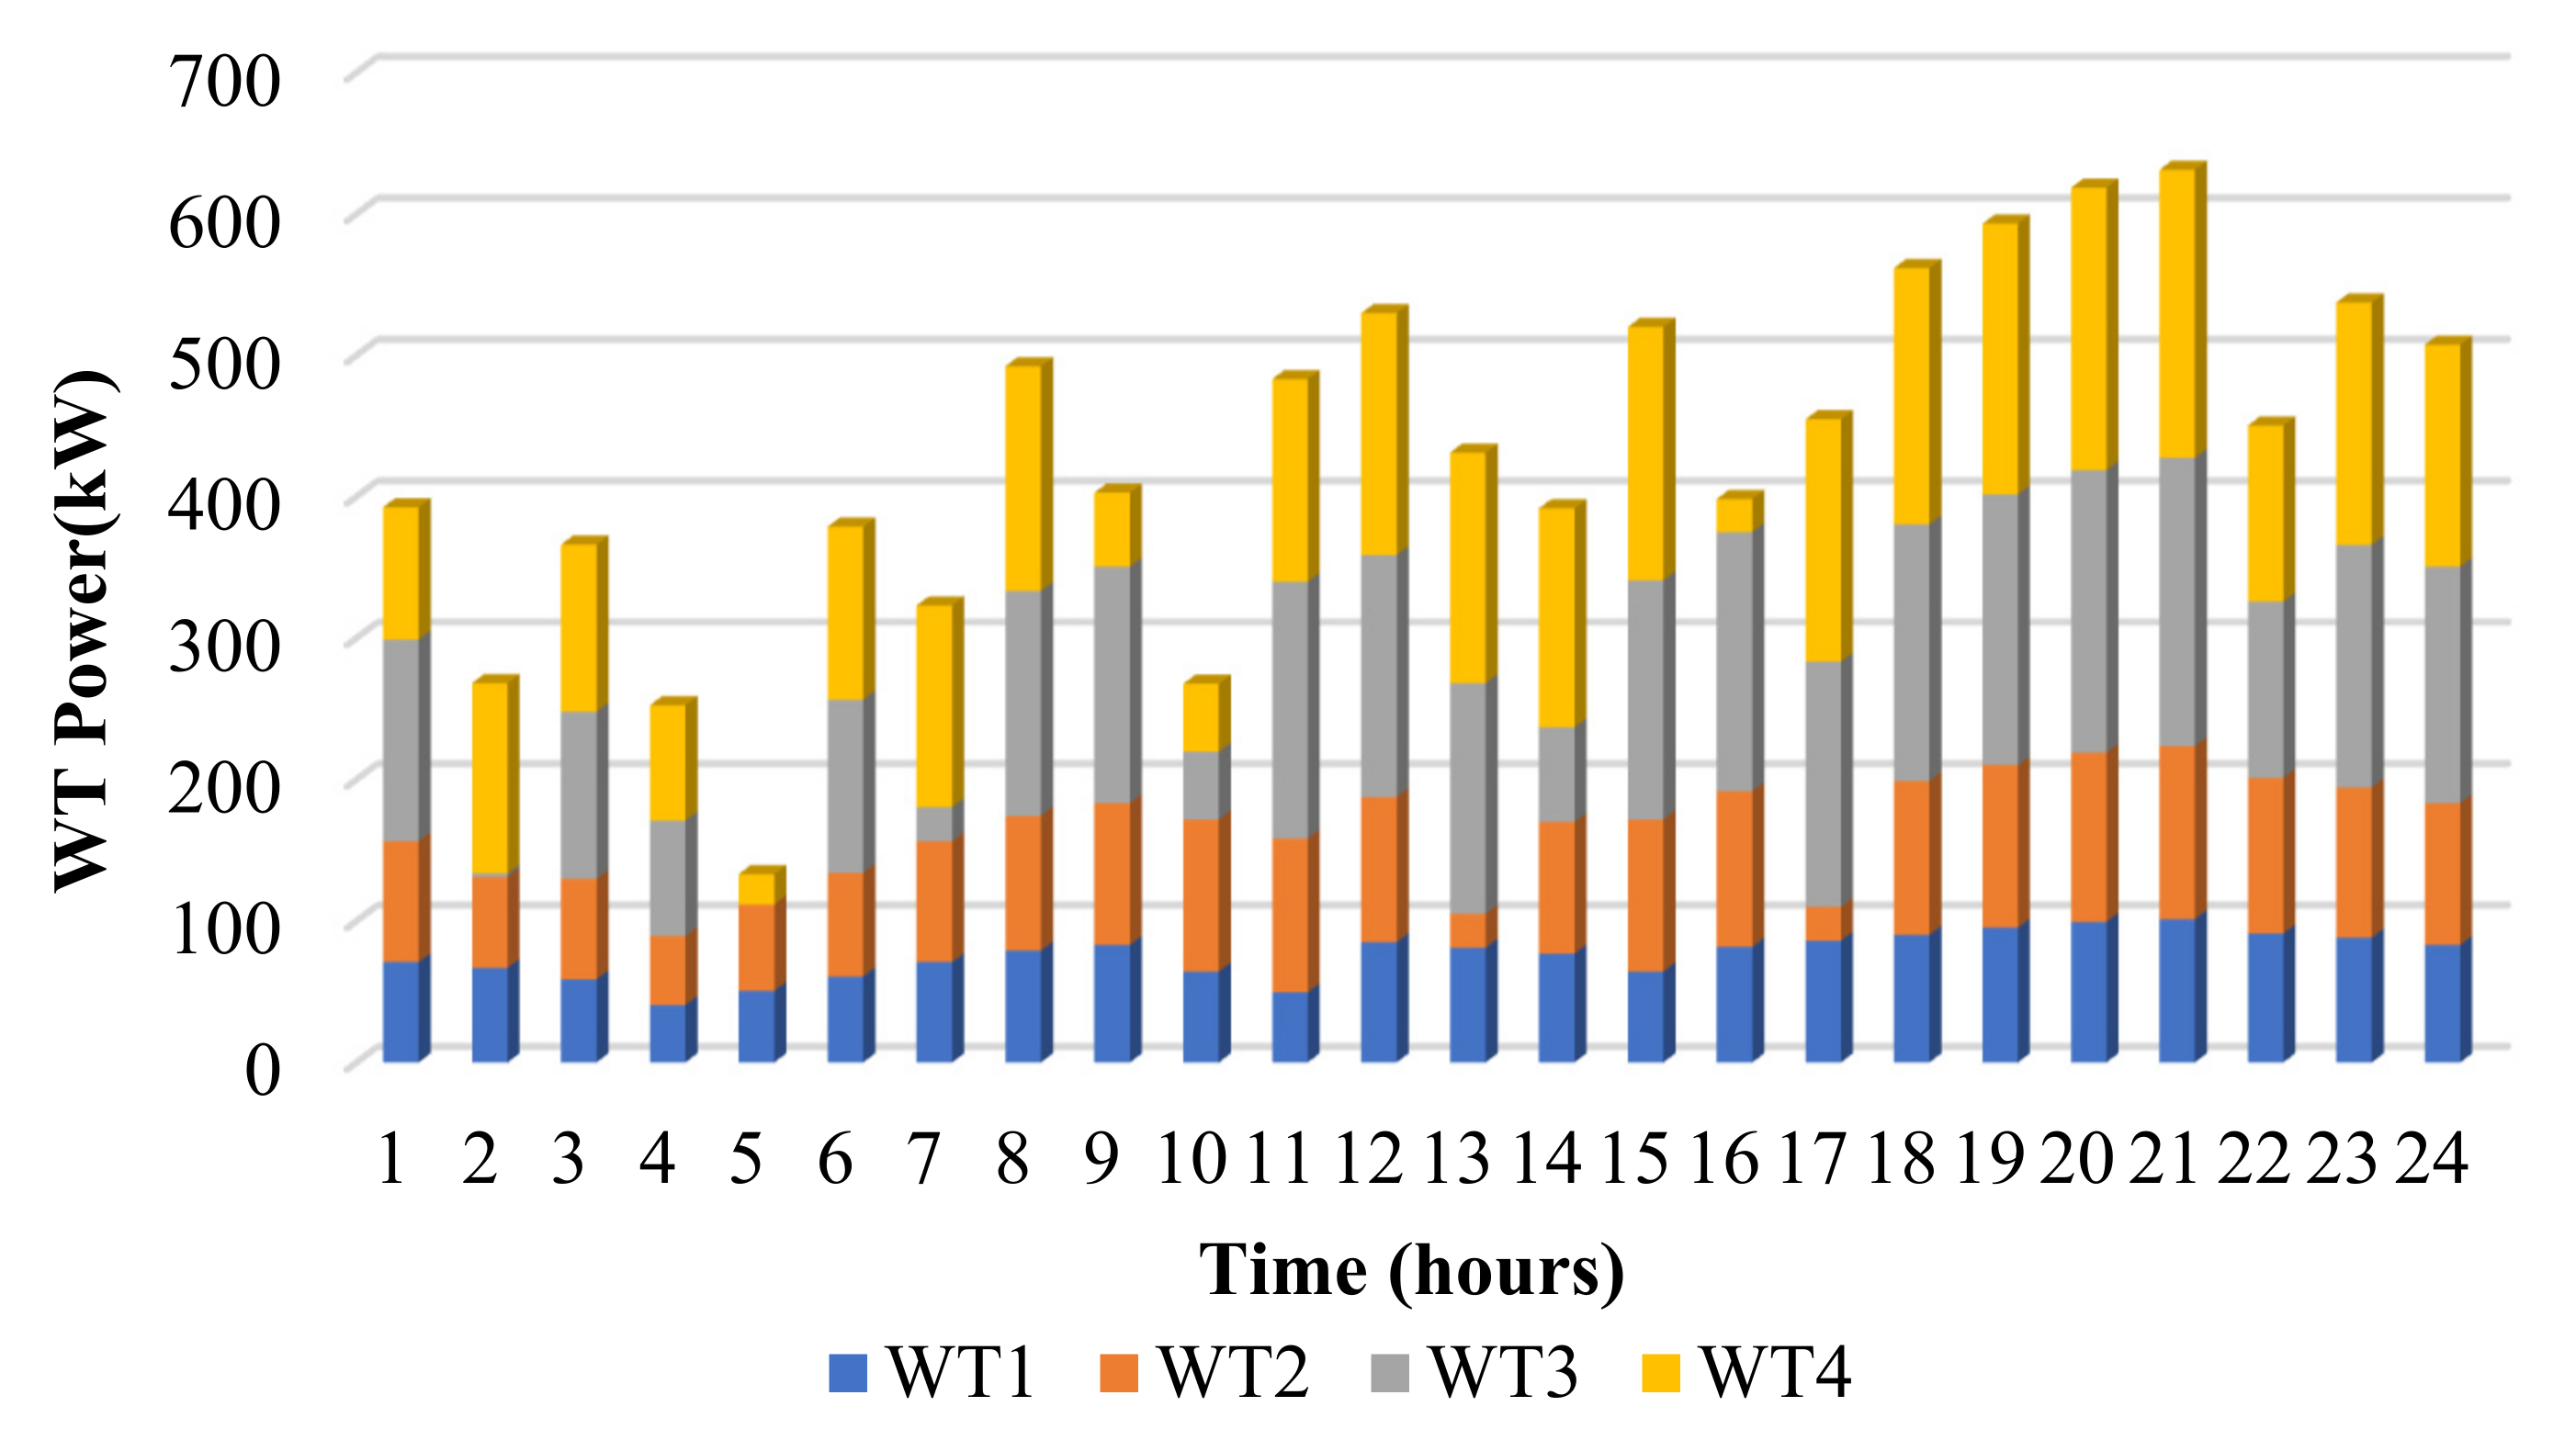
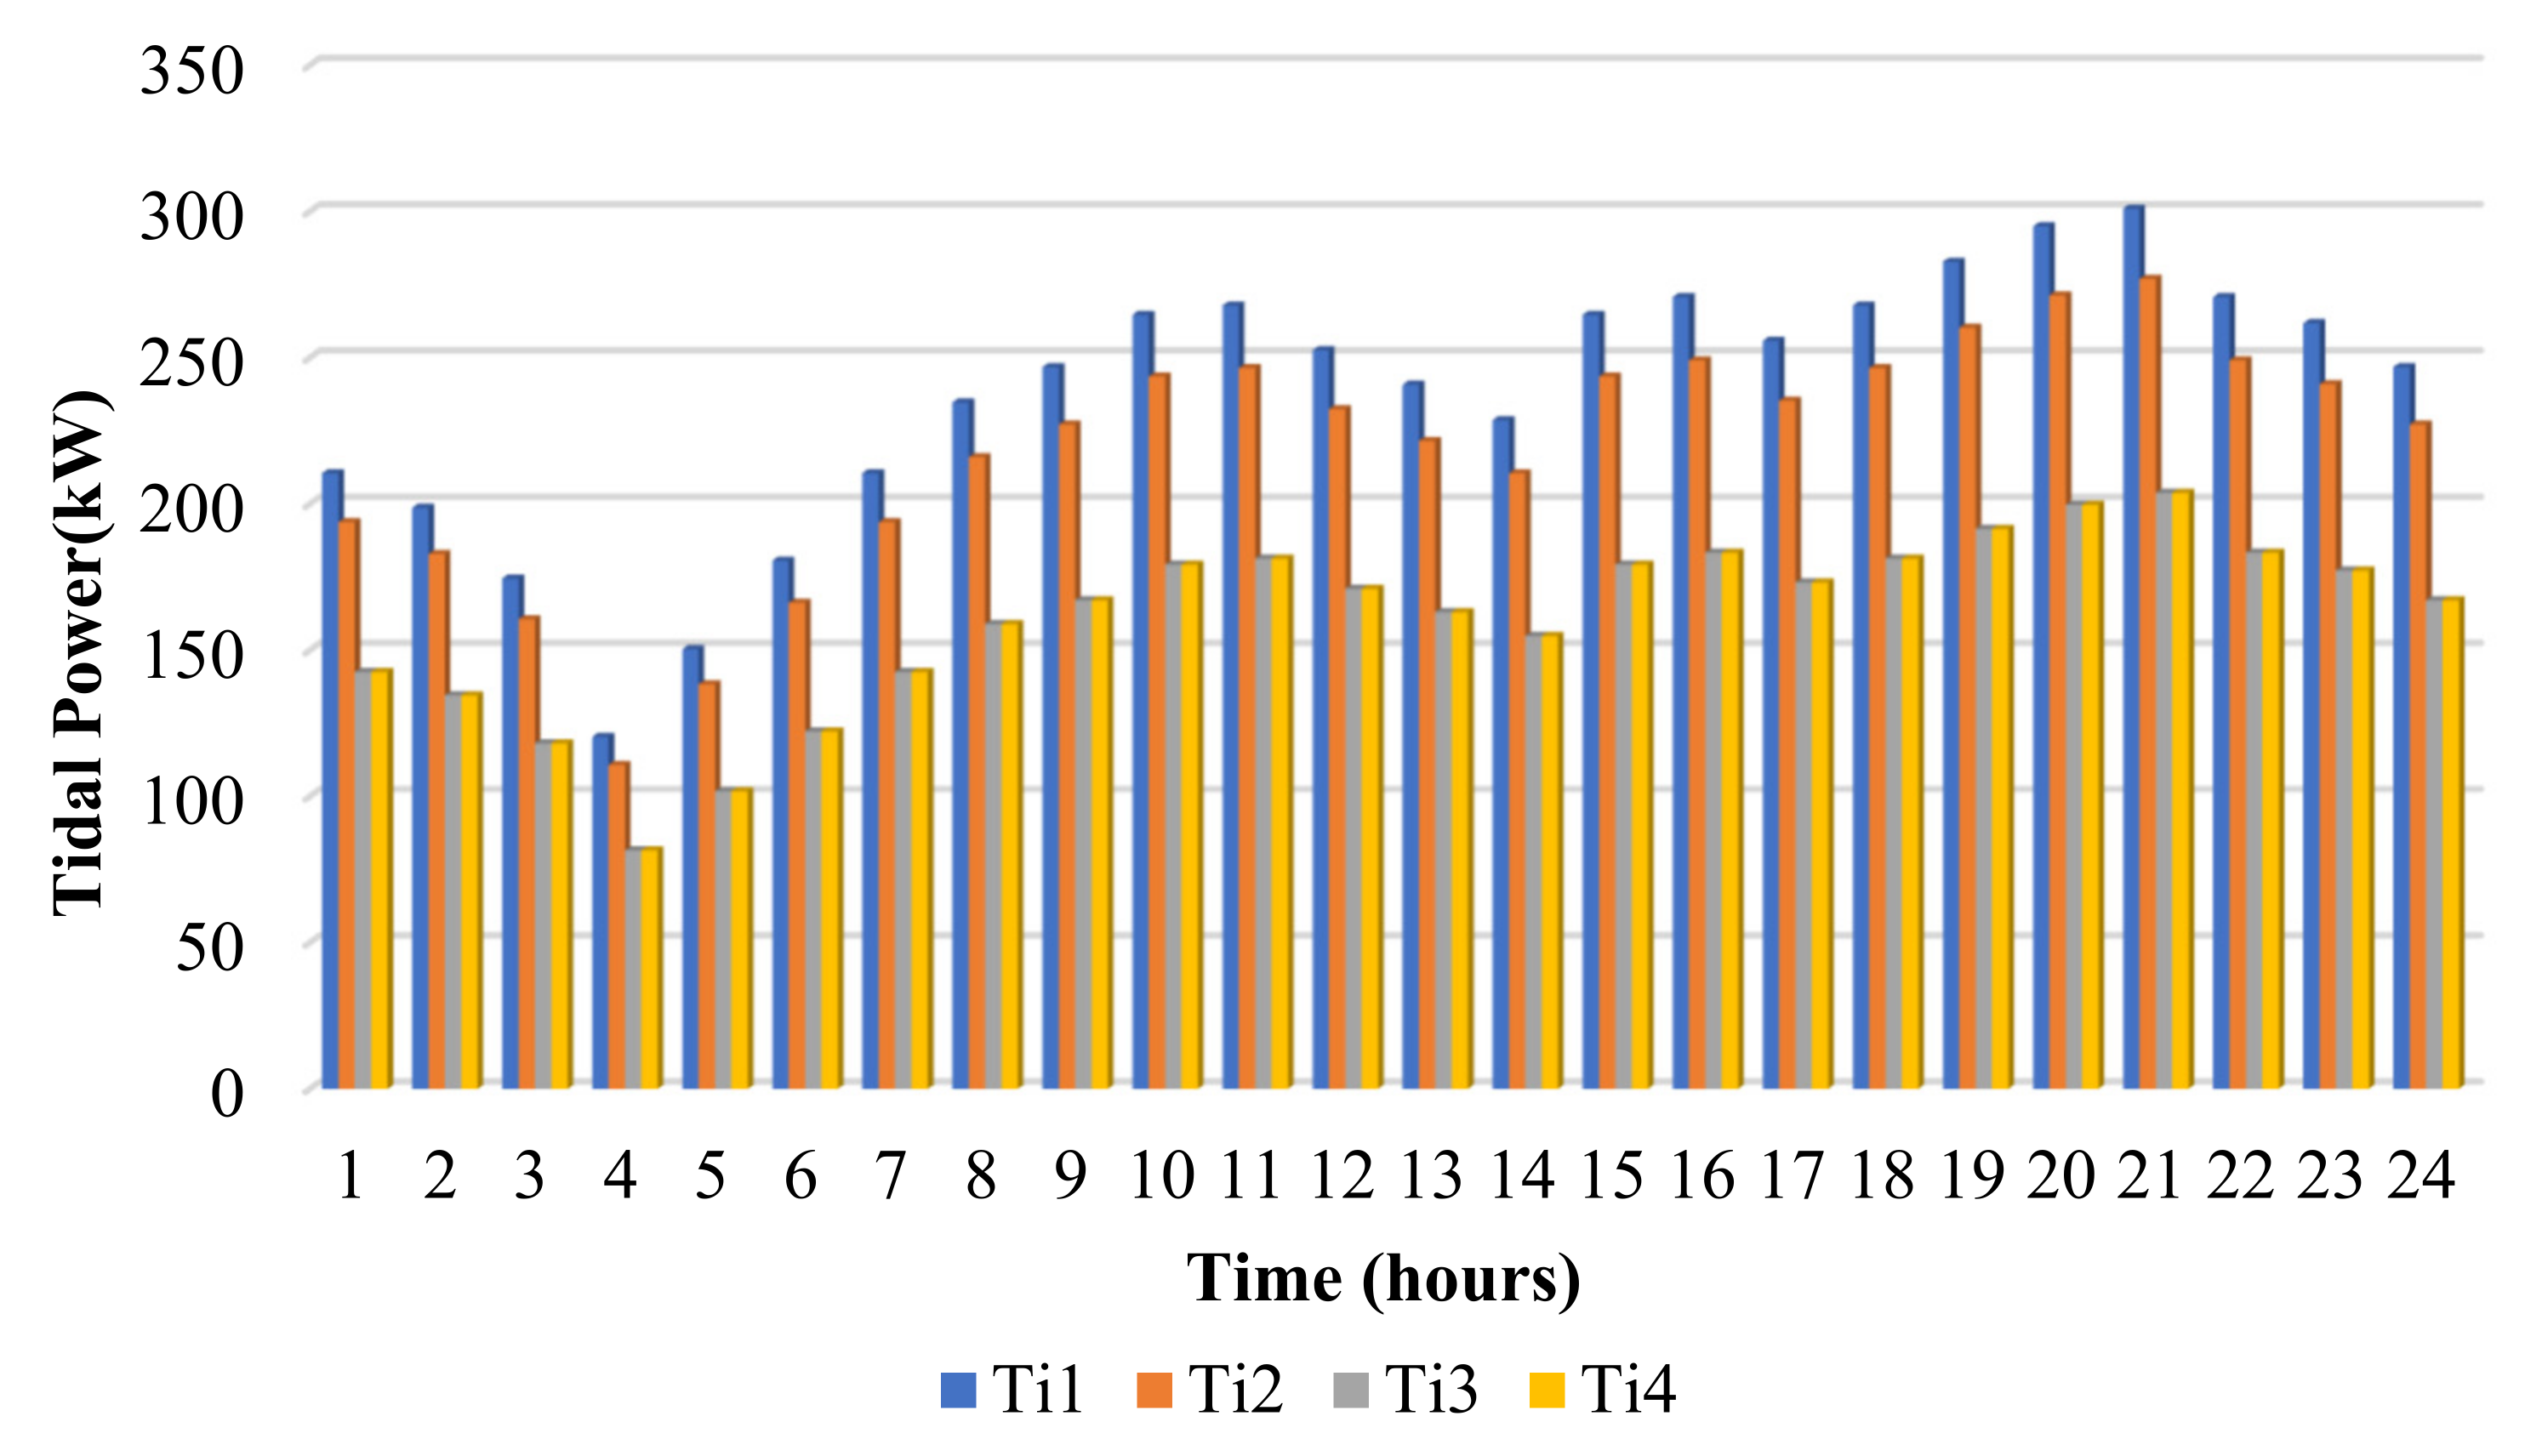
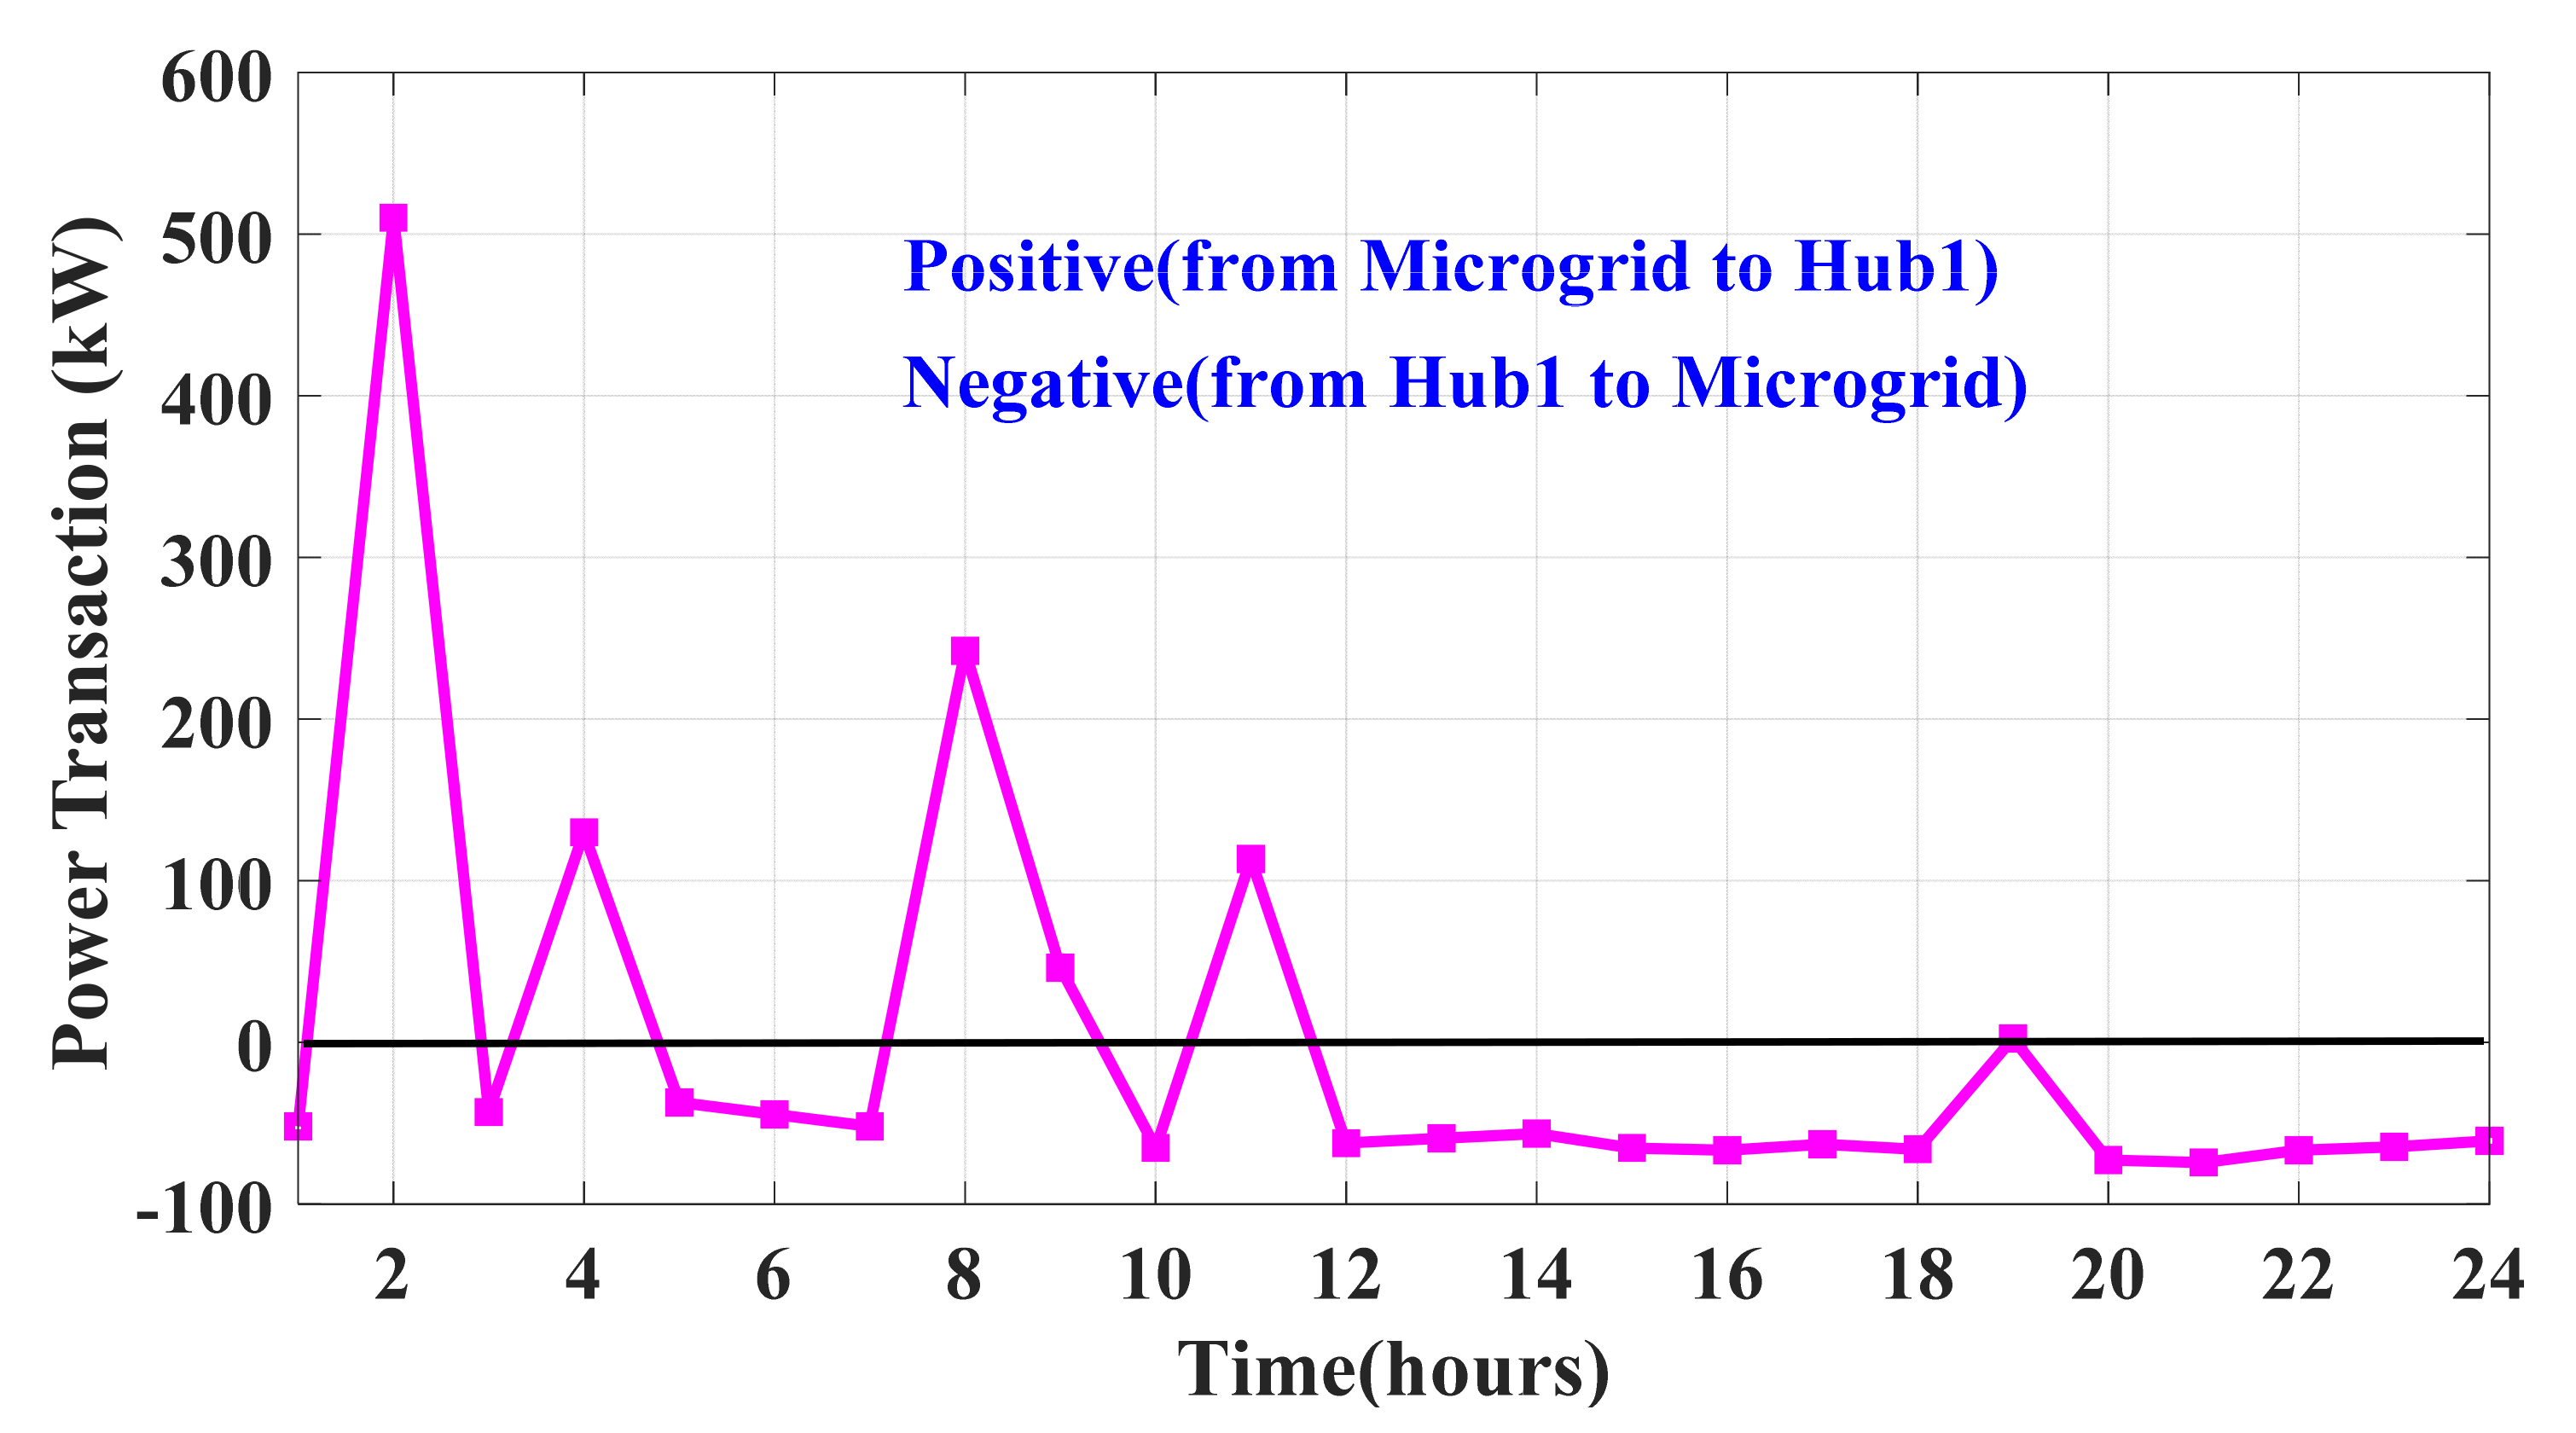
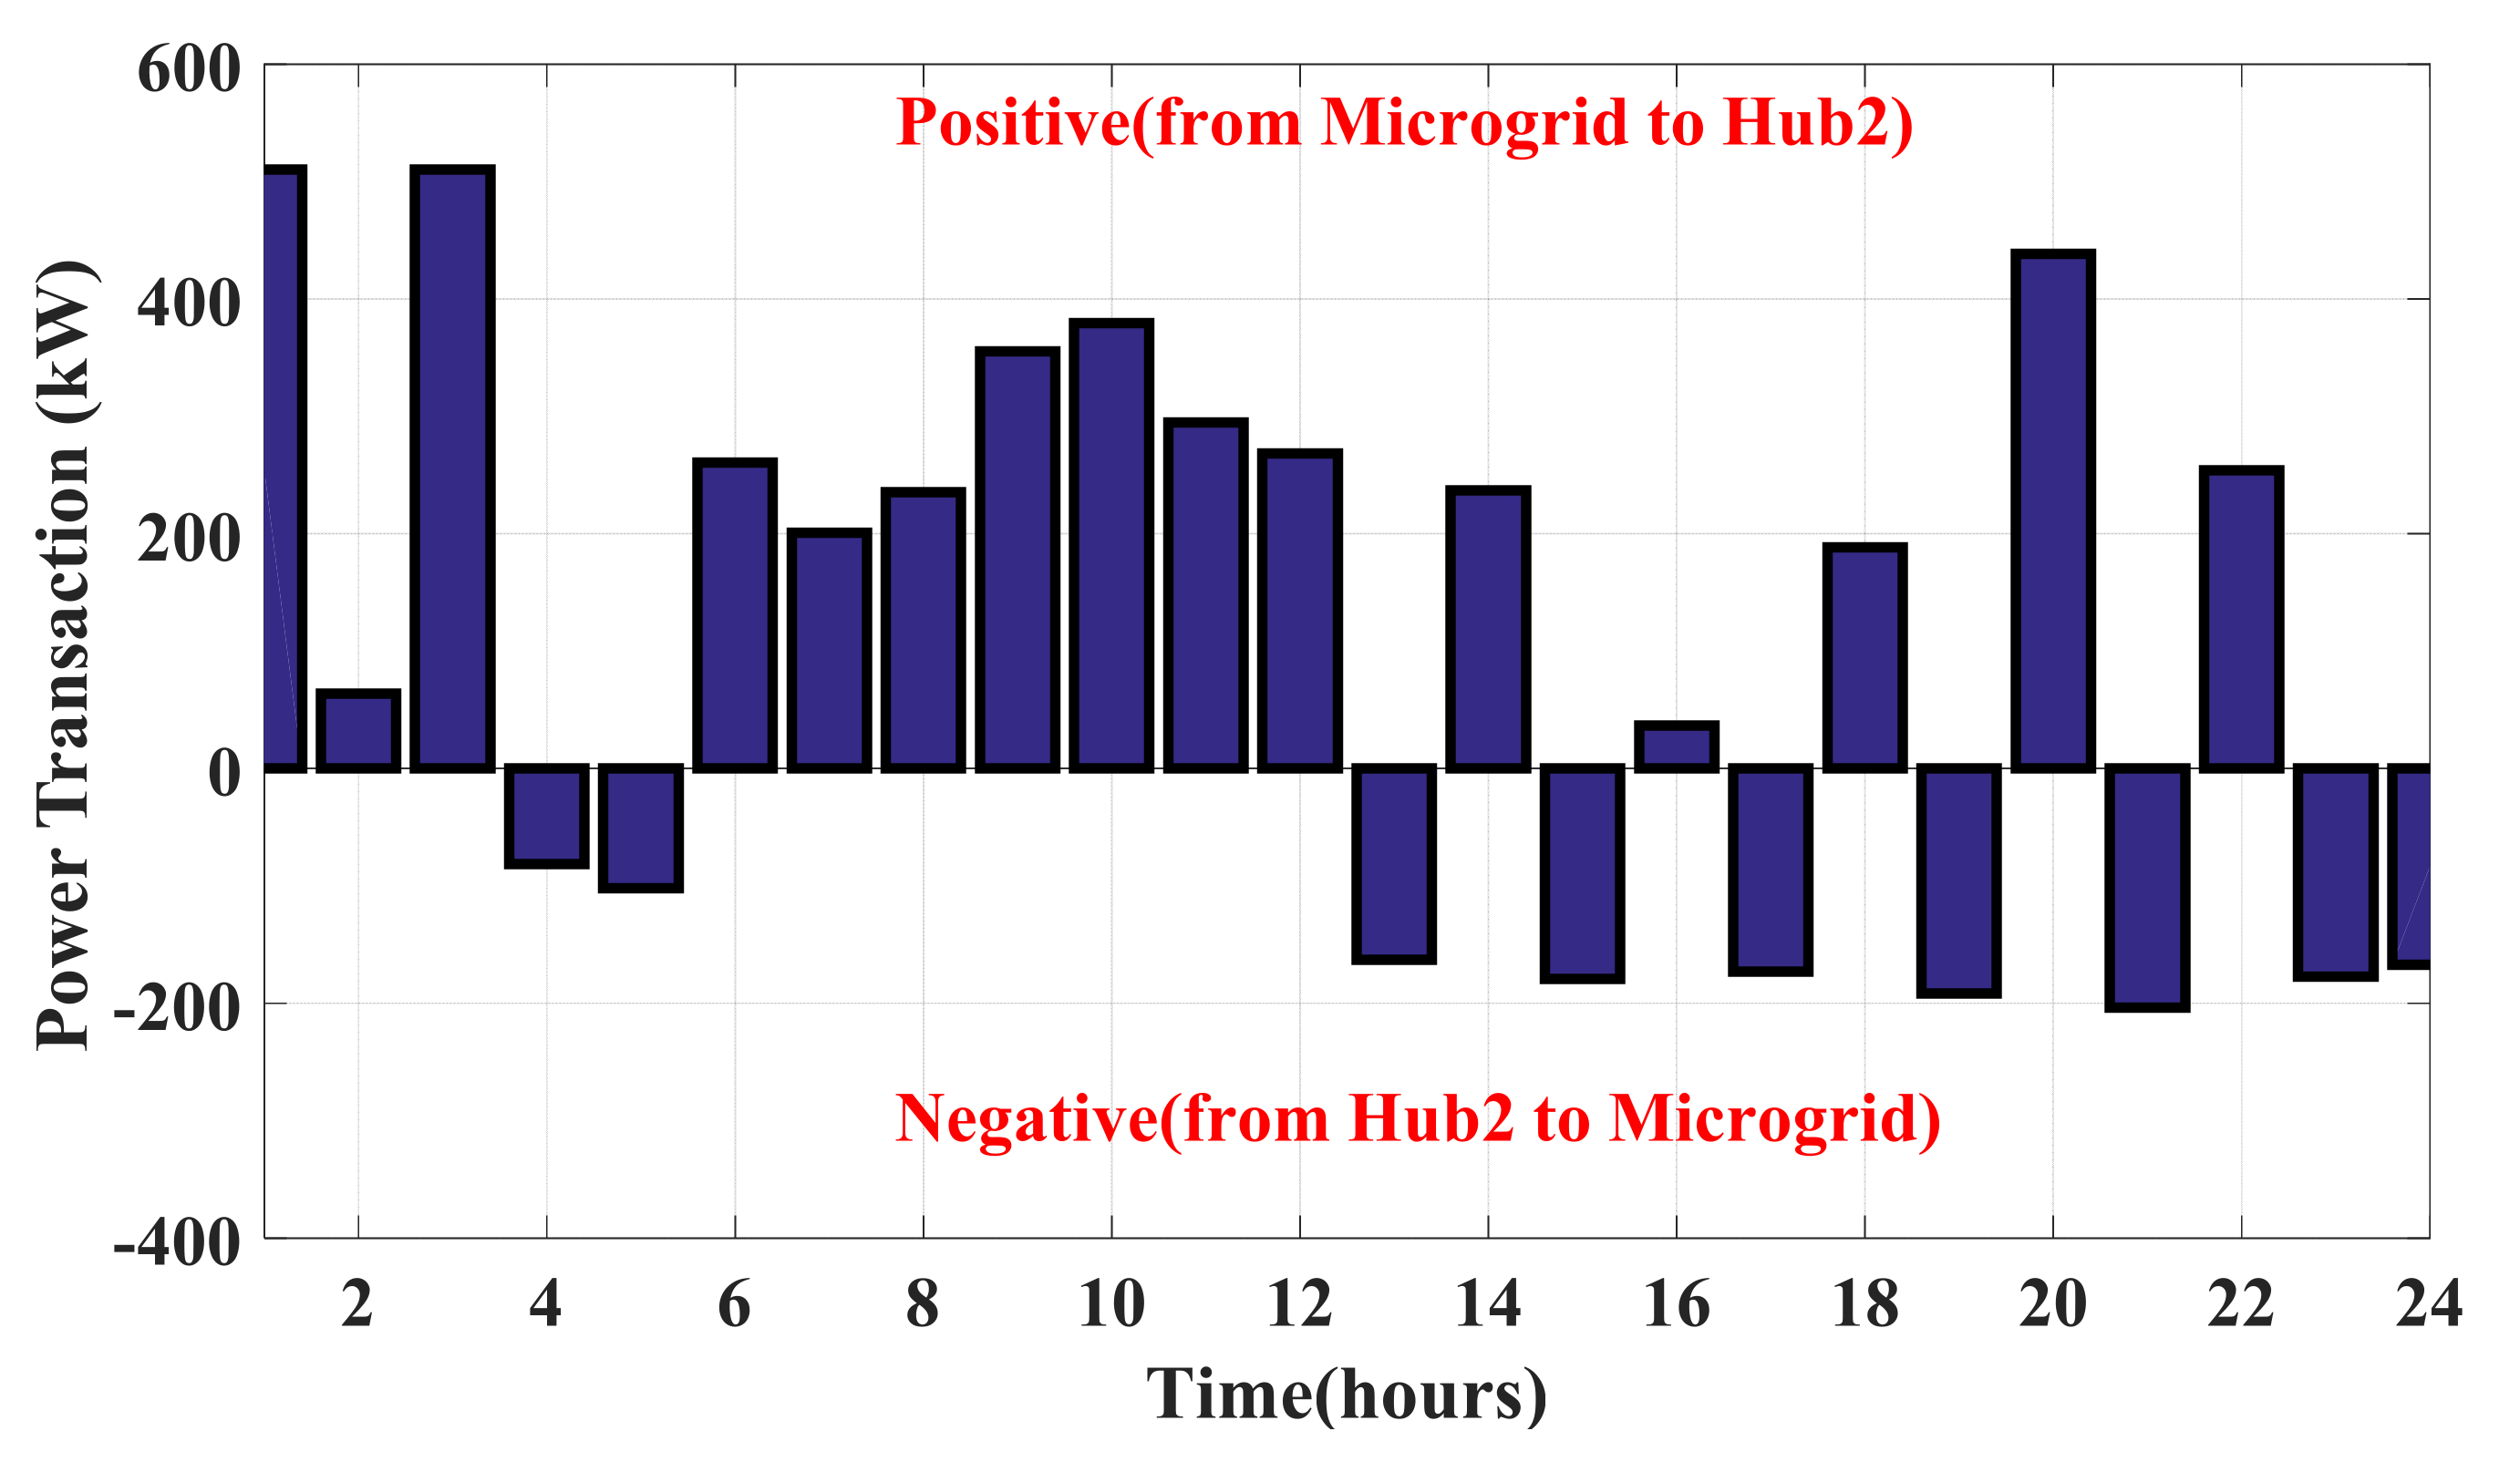
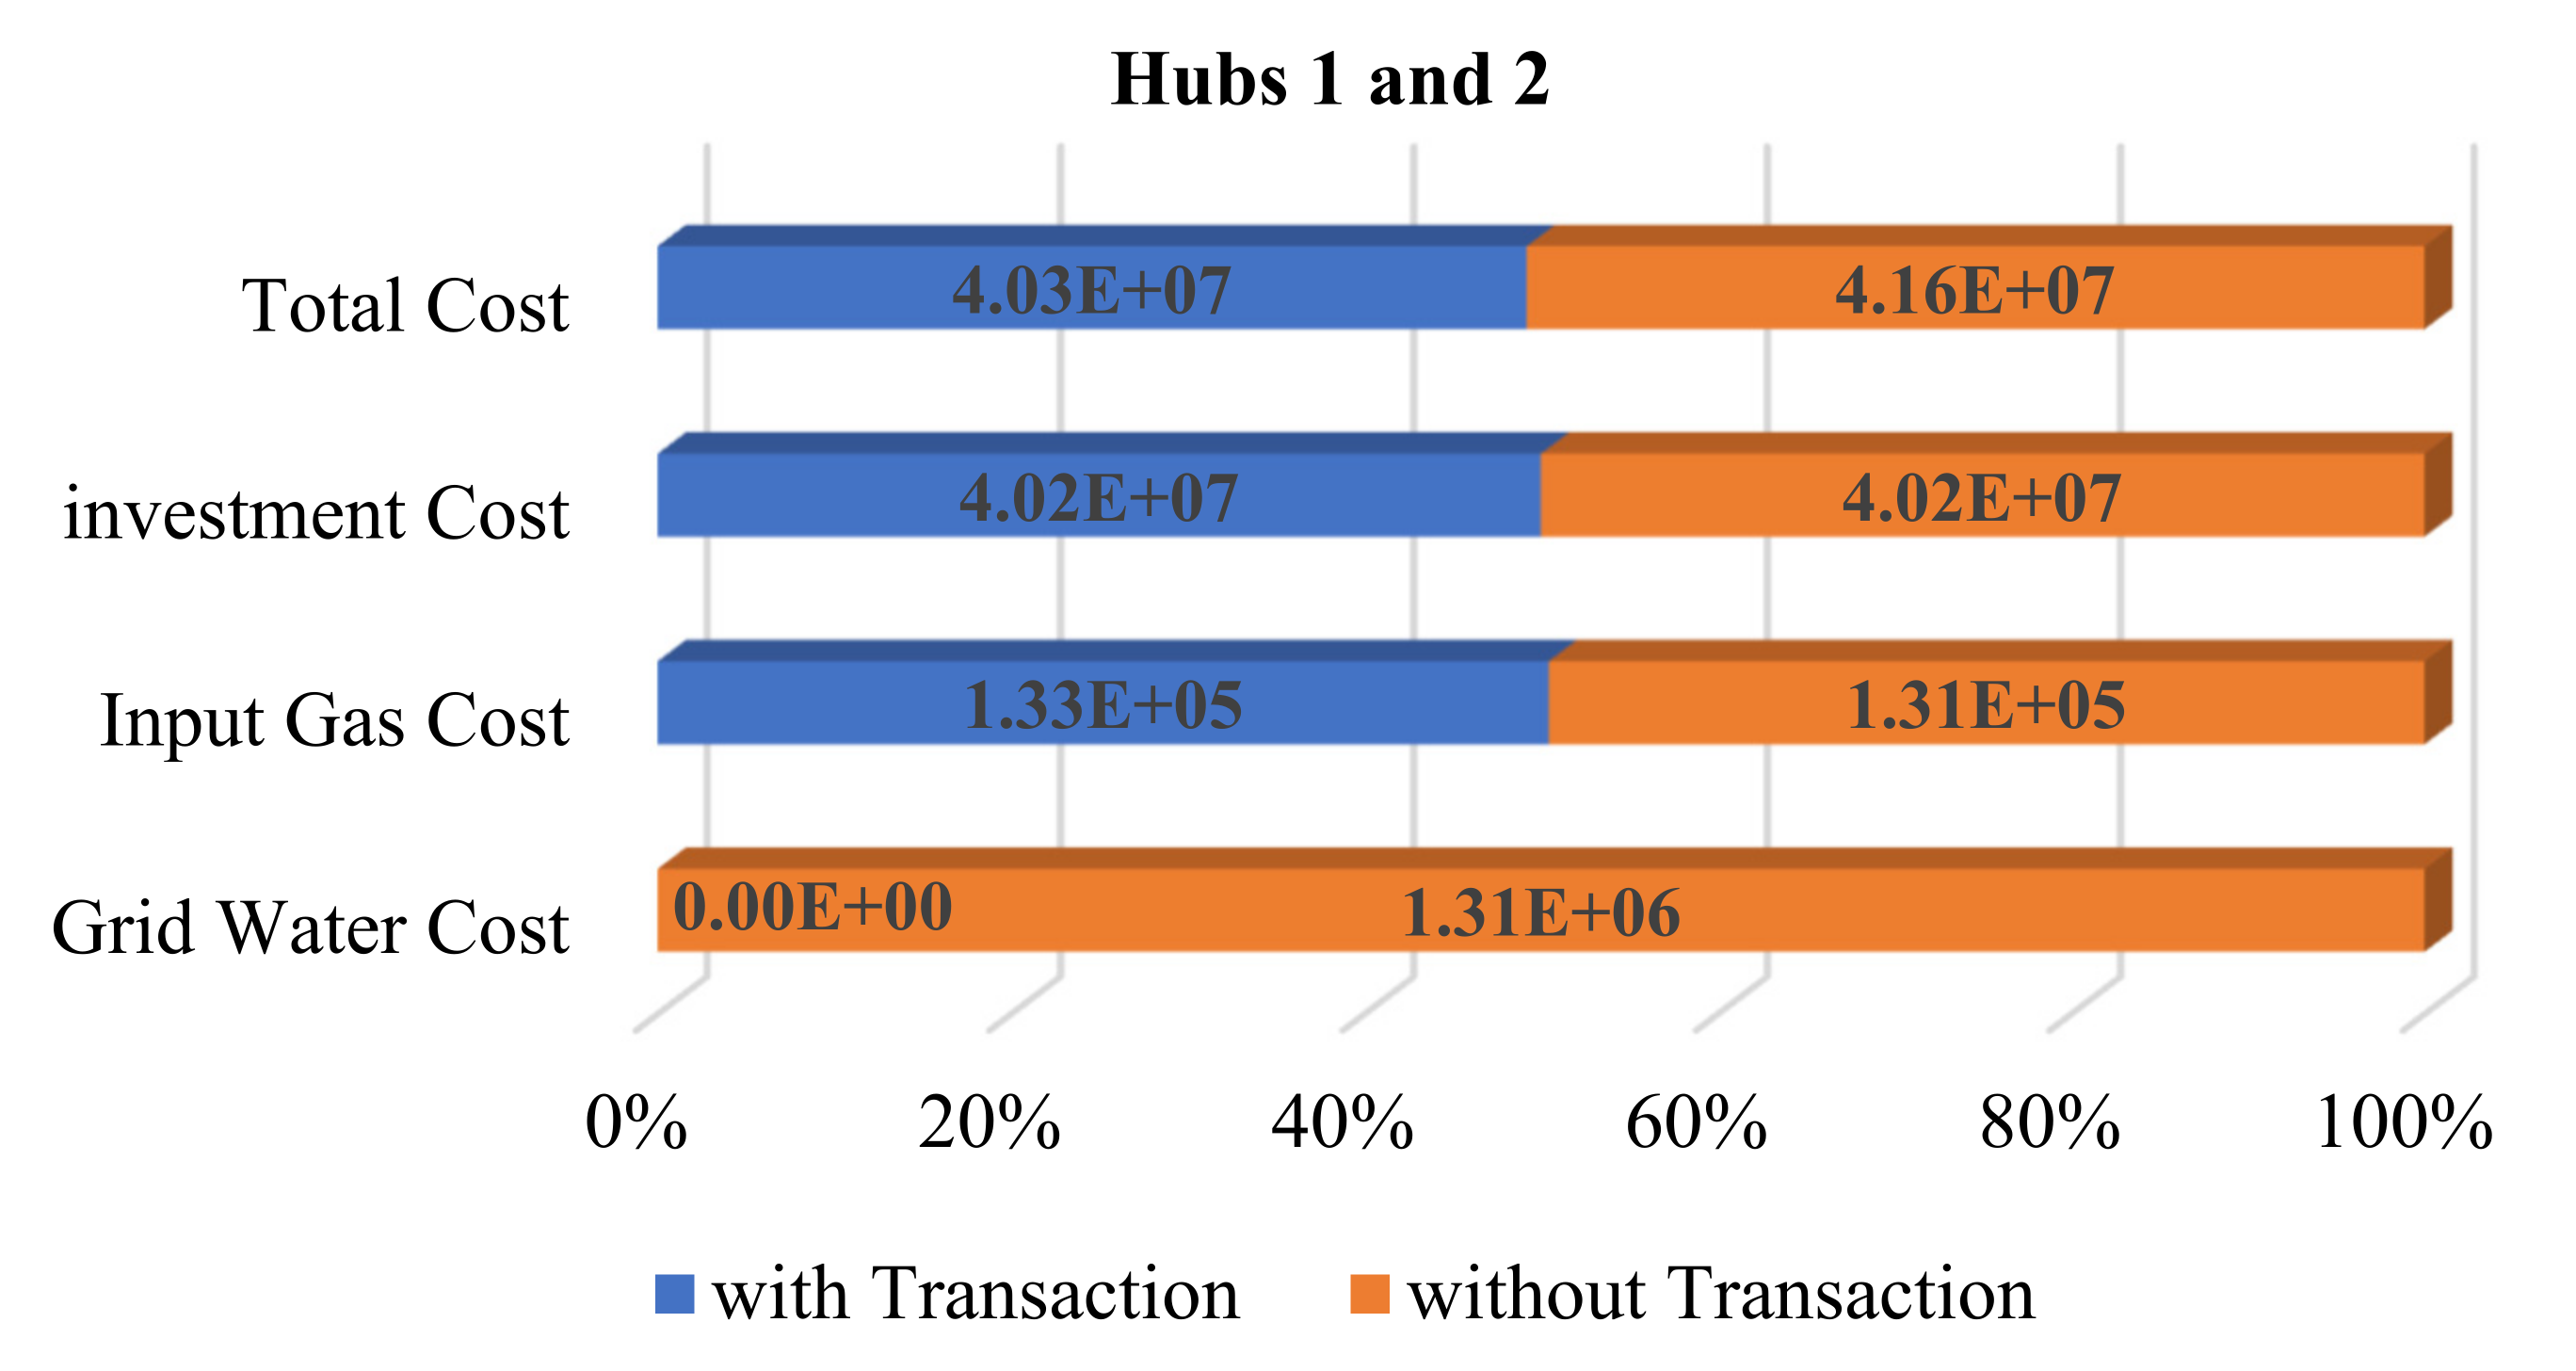
6.1. Energy Management of The Energy Hub-Based Networked Microgrid System

This document tries to discuss how the power exchange between the energy hub system and the networked microgrid can help to satisfy the three energy carriers (i.e., water, thermal, and electrical demands). To this end, firstly, we implement and execute the proposed model based on the explained structure in previous sections. By doing so, results related to the energy management of each system (energy hub and microgrid) for all energy carriers and the power transaction between two systems are obtained and represented in Figure 6, Figure 7, Figure 8, Figure 9, Figure 10, Figure 11, Figure 12, Figure 13 and Figure 14. As mentioned before, the supplement of water demands can be made in two ways including the grid water and the seawater, which needs to be refined with the use of the desalination unit. In this regard, the required power of these units related to the energy hub systems (hub1 and hub2) to supply the water demands is provided in Figure 6. As it can be seen, the consumed power of the desalination unit of the hub2 system is almost as much as that required for the desalination unit to supply water demands in the next hours (i.e., 150 kW at hour 1, which indicates high water volume). Similar to the hub2 system, the desalination unit of the hub1 system consumes more electrical power in hour 8 than the other hours due to the high water consumption at the same time. Note that the CHP unit is aimed to satisfy both electrical and thermal energies while the boiler unit copes to supply the thermal demands. In this regard, the output powers of CHP and boiler units for both hub1 and hub2 systems are indicated in Figure 7 and Figure 8. Based on the results elicited from energy management related to the hub1 and hub2 systems, the output power of the CHP unit overtakes that of the boiler unit most of the time for the sake of satisfying both electrical and thermal demands. On the contrary, due to the cost of power generation by the CHP and decrease of thermal demand, hub1 has decided to use the boiler unit at t = 14 − 17 and 20 − 21 to serve its thermal demand and consume power from the other agents to supply its electrical demand. The behavior of the boiler unit pertaining to Hub2 at t = 15 − 16 and t = 20 − 21 can be described for the same reason as indicated in Figure 7.
As mentioned before, the networked microgrid copes to supply the electrical loads with the use of incorporating the energy hub systems and the renewable resources including the PV, WT and tidal units. In this regard, the relevant results are indicated in Figure 9, Figure 10, Figure 11, Figure 12 and Figure 13. As it can be seen, each generation unit has differently contributed in generated power depending on the area which is assigned them in network. Looking over Figure 9, Figure 10 and Figure 11, the results are proved that the PV4, WT4, and tidal 1 units have more generated power compared to the other units. In the view of the opposite, the least contribution of the generated power is related to the PV2, WT1, and tidal 4 units due to the load demands located near the relevant area. The previous sections mentioned that the energy hub systems are able to exchange power with the networked microgrid. Hence, the results pertaining to power transactions are shown in Figure 12 and Figure 13. The positive value of power is referred to as an exchange of the power from the microgrid to the energy hub system and vice versa. It is clear that the power injection procedure is from the microgrid to the energy hub1 system at early times while this process is altered in the hours 12 to 24 for the sake of efficiently satisfying the energy carriers during peak-load hours. Similar justification can be provided for power exchanging of energy hub2 system with the microgrid as shown in Figure 13. Besides, this paper aims to represent the effectiveness of the proposed framework, which is the interconnected smart energy hub-microgrid system, in minimizing the cost of the energy carriers. Hence, Figure 14 indicates the water, gas, investment, and total costs under conditions with/without the power transaction link. The relevant results show that such a framework leads to notably reduces the grid water cost as well as the gas cost related to the input gas of CHP and boiler units. For this reason, the total cost has approximately resulted in 4.03 × 10⁷ under the condition with the transaction link taken a marked decline in comparison with condition one.

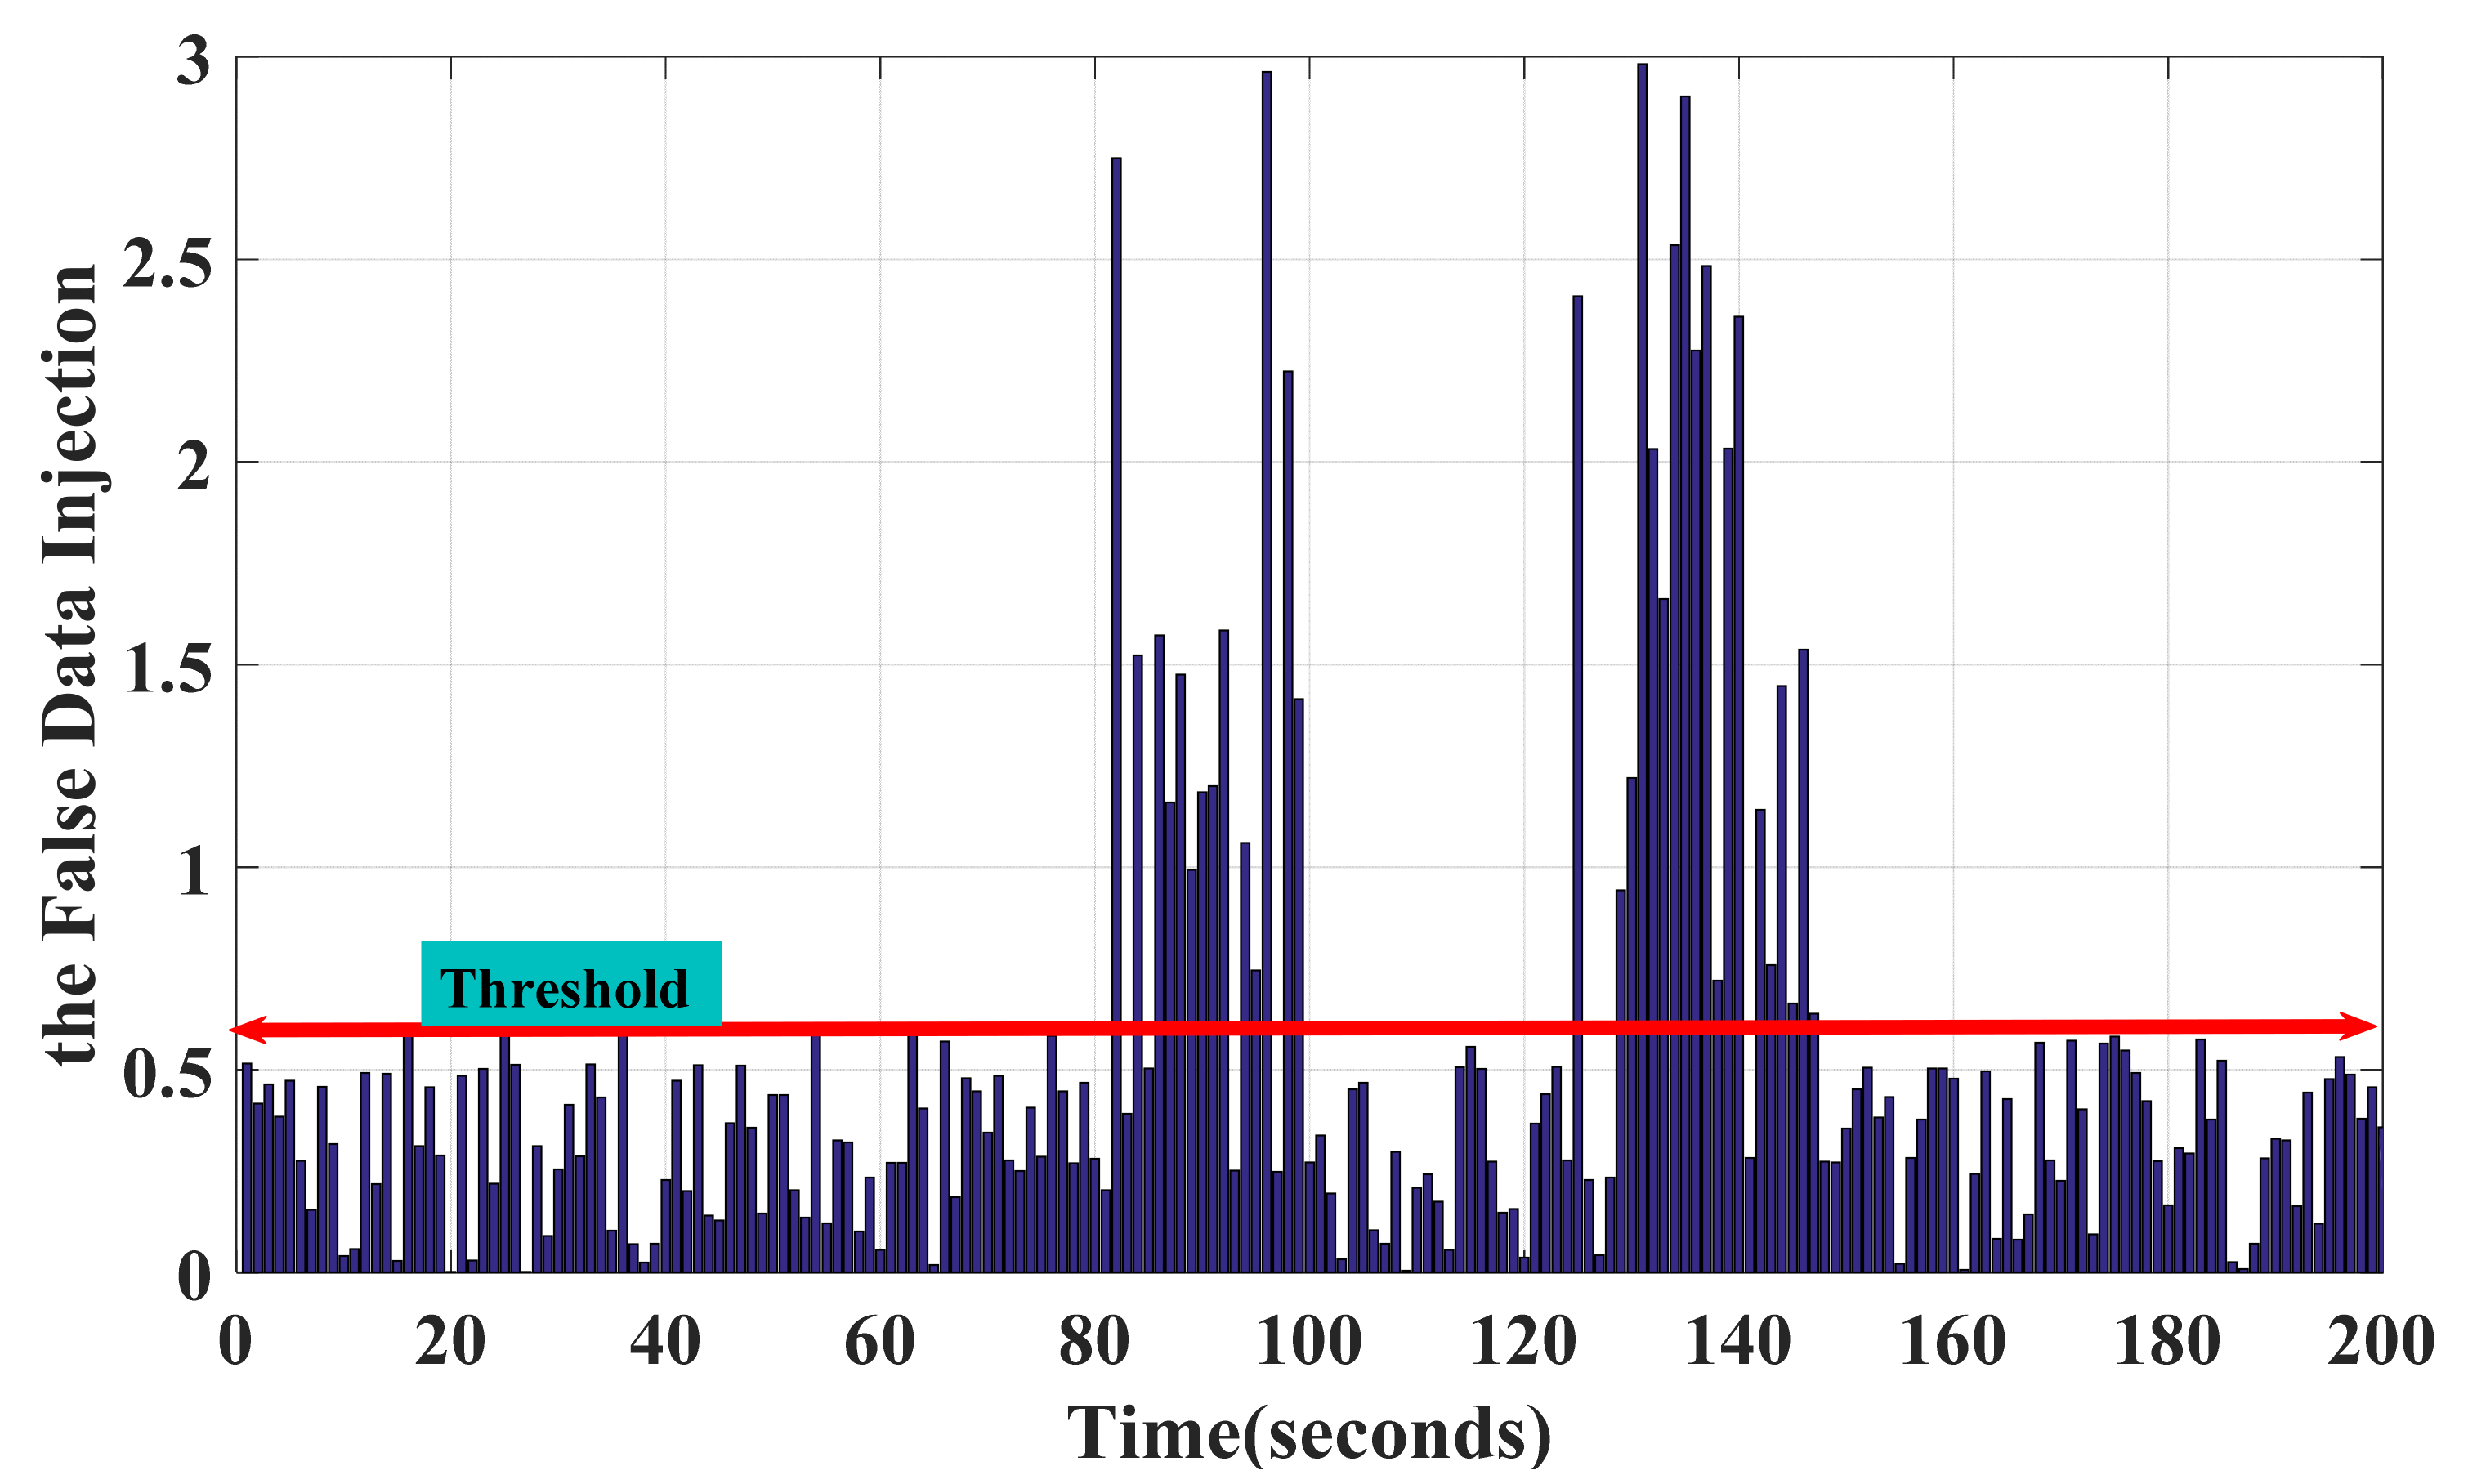
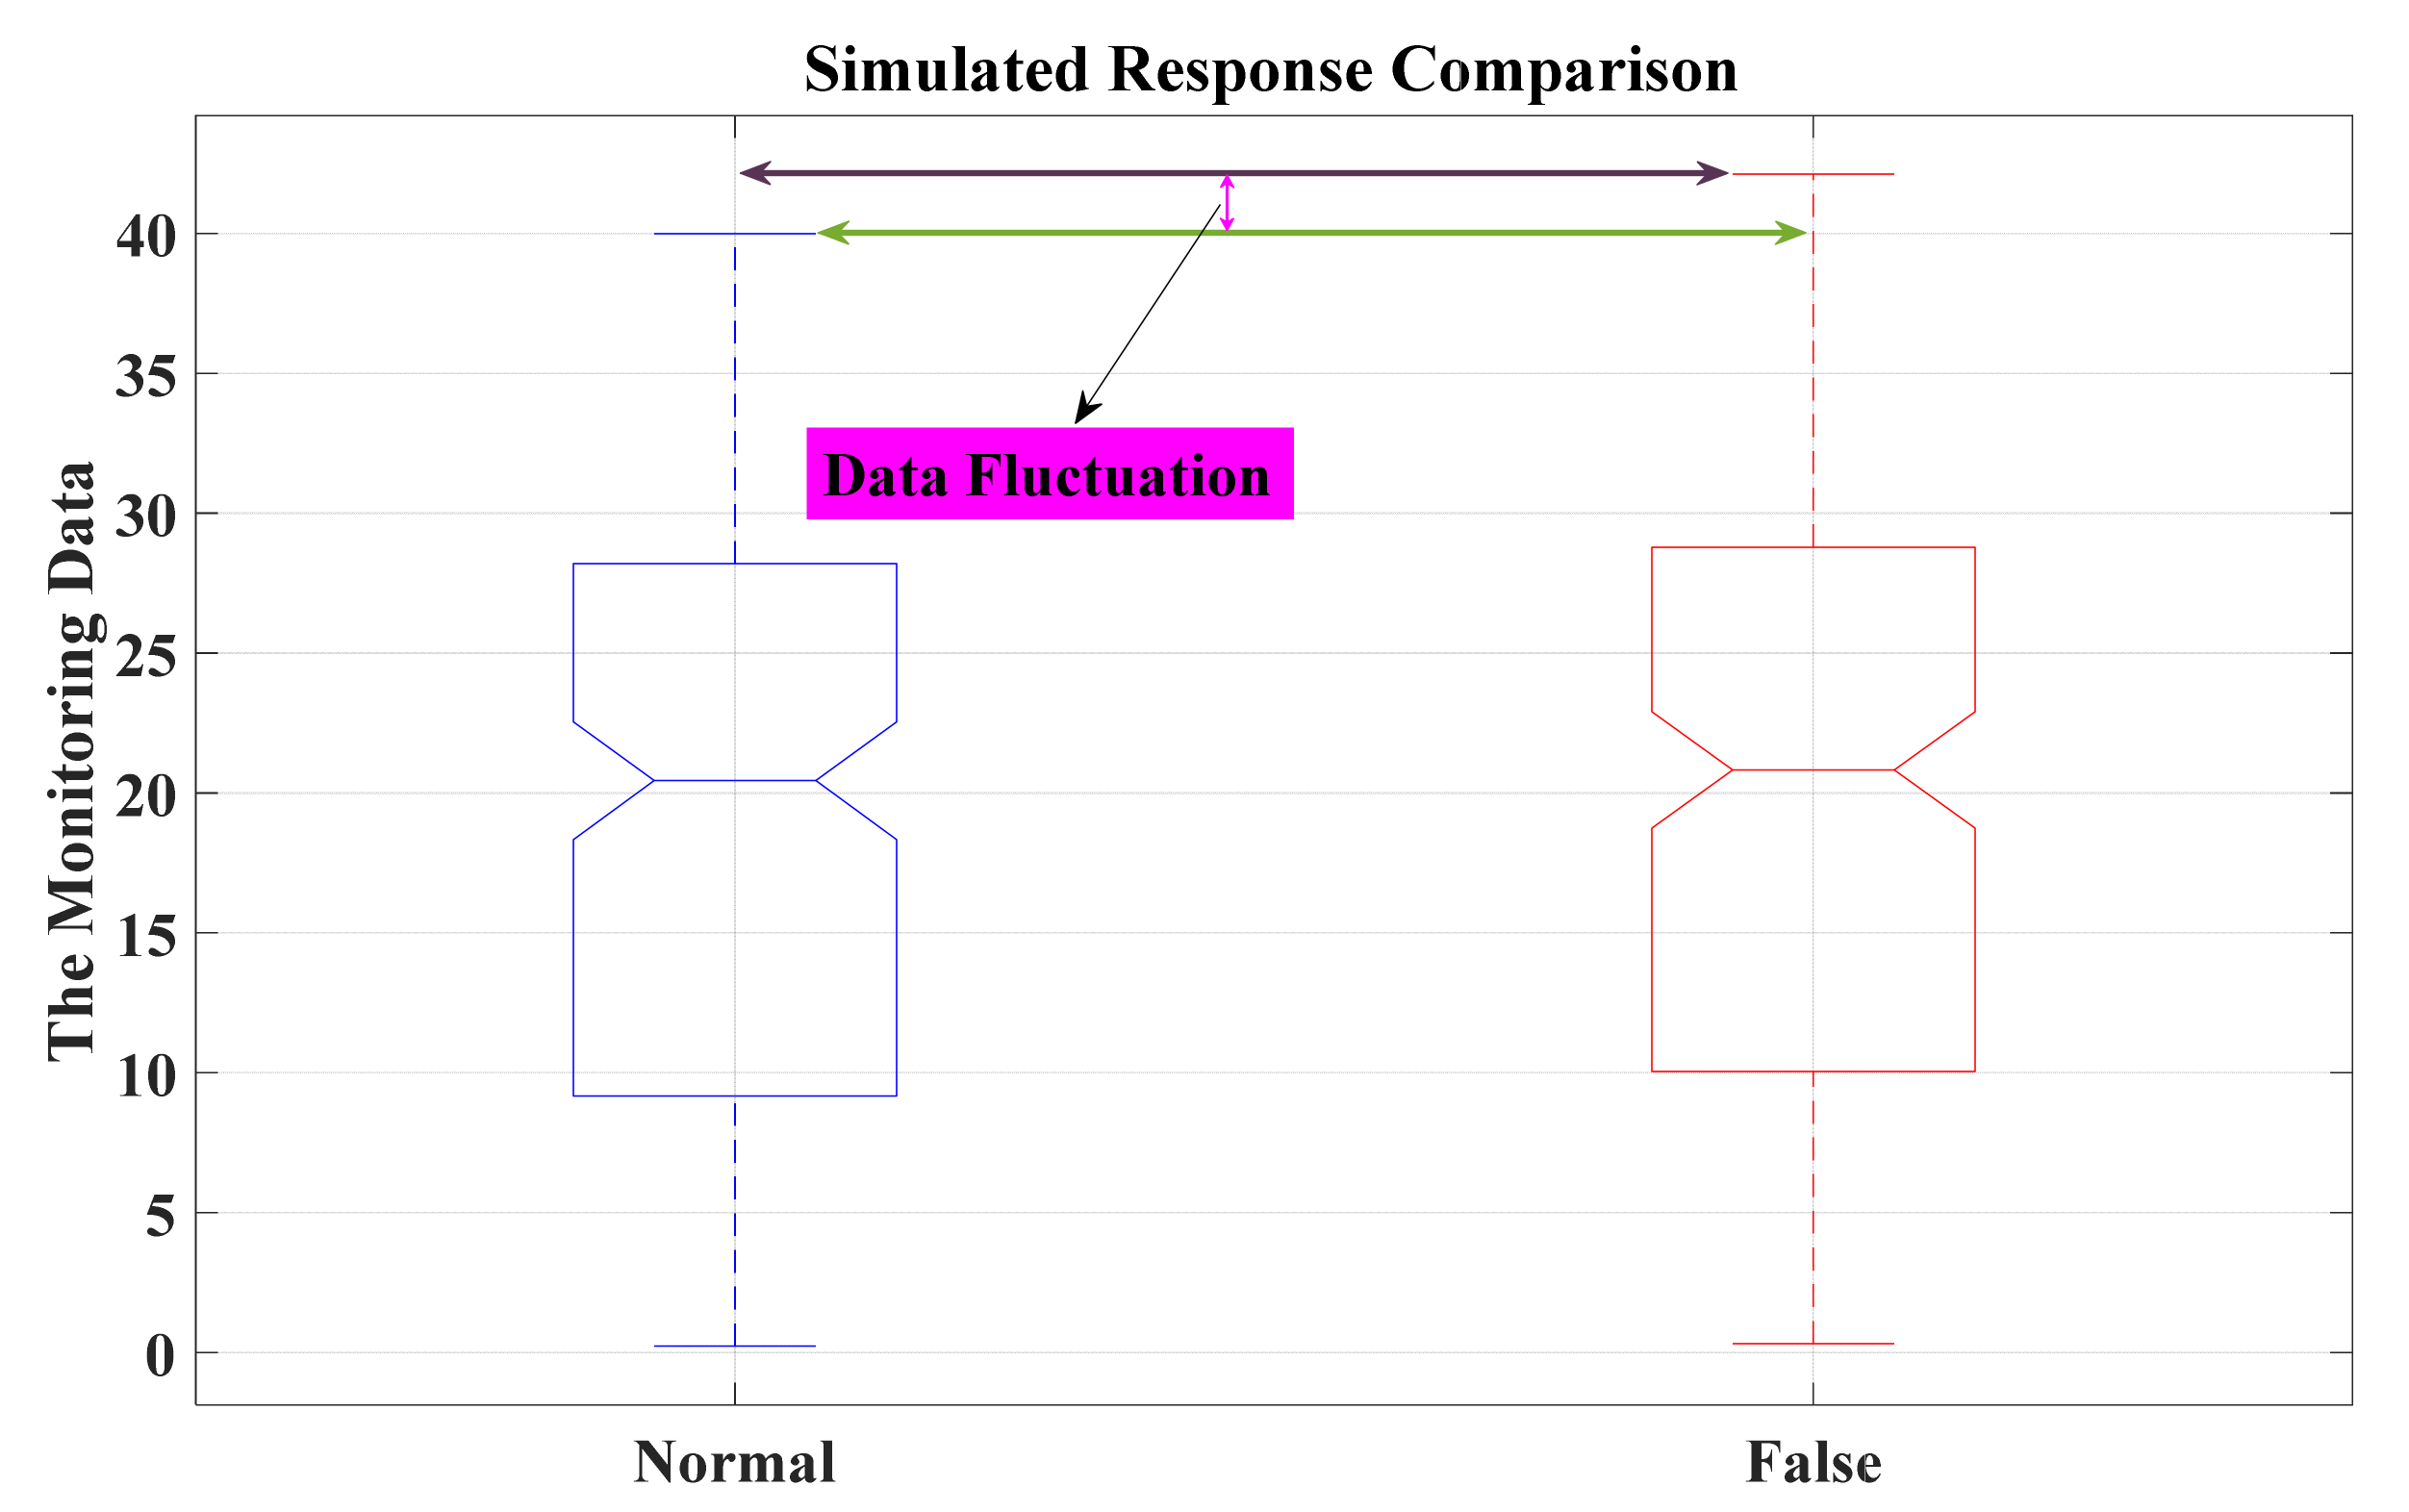
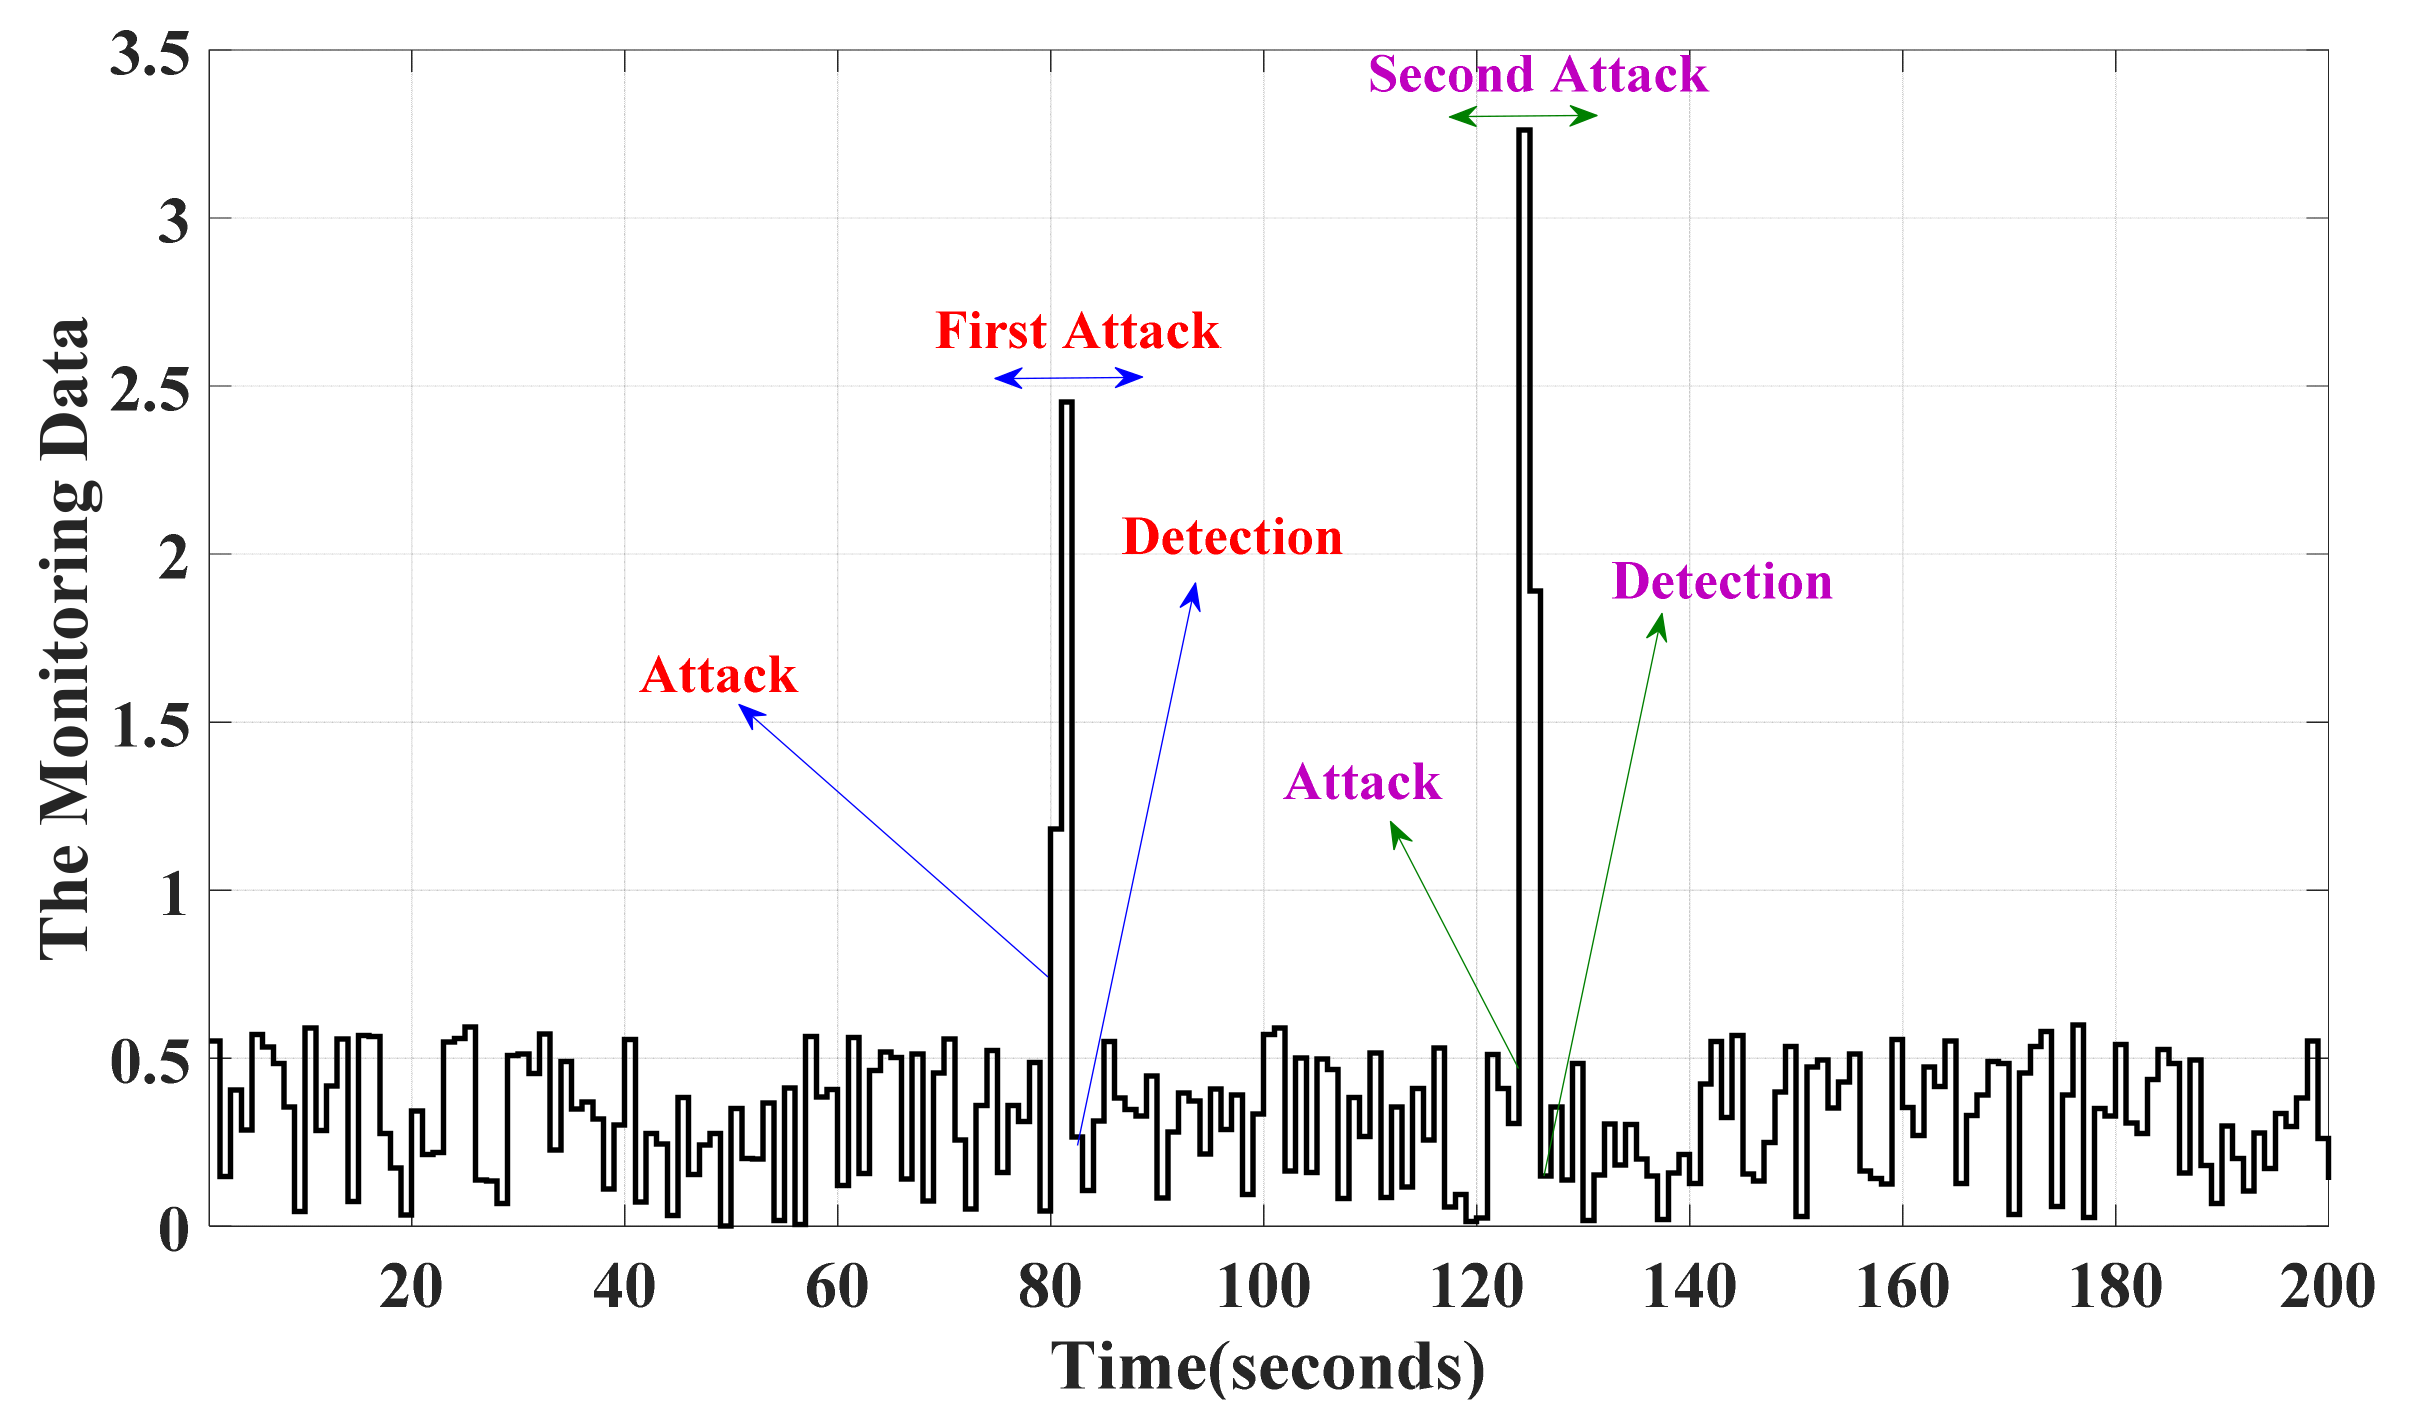
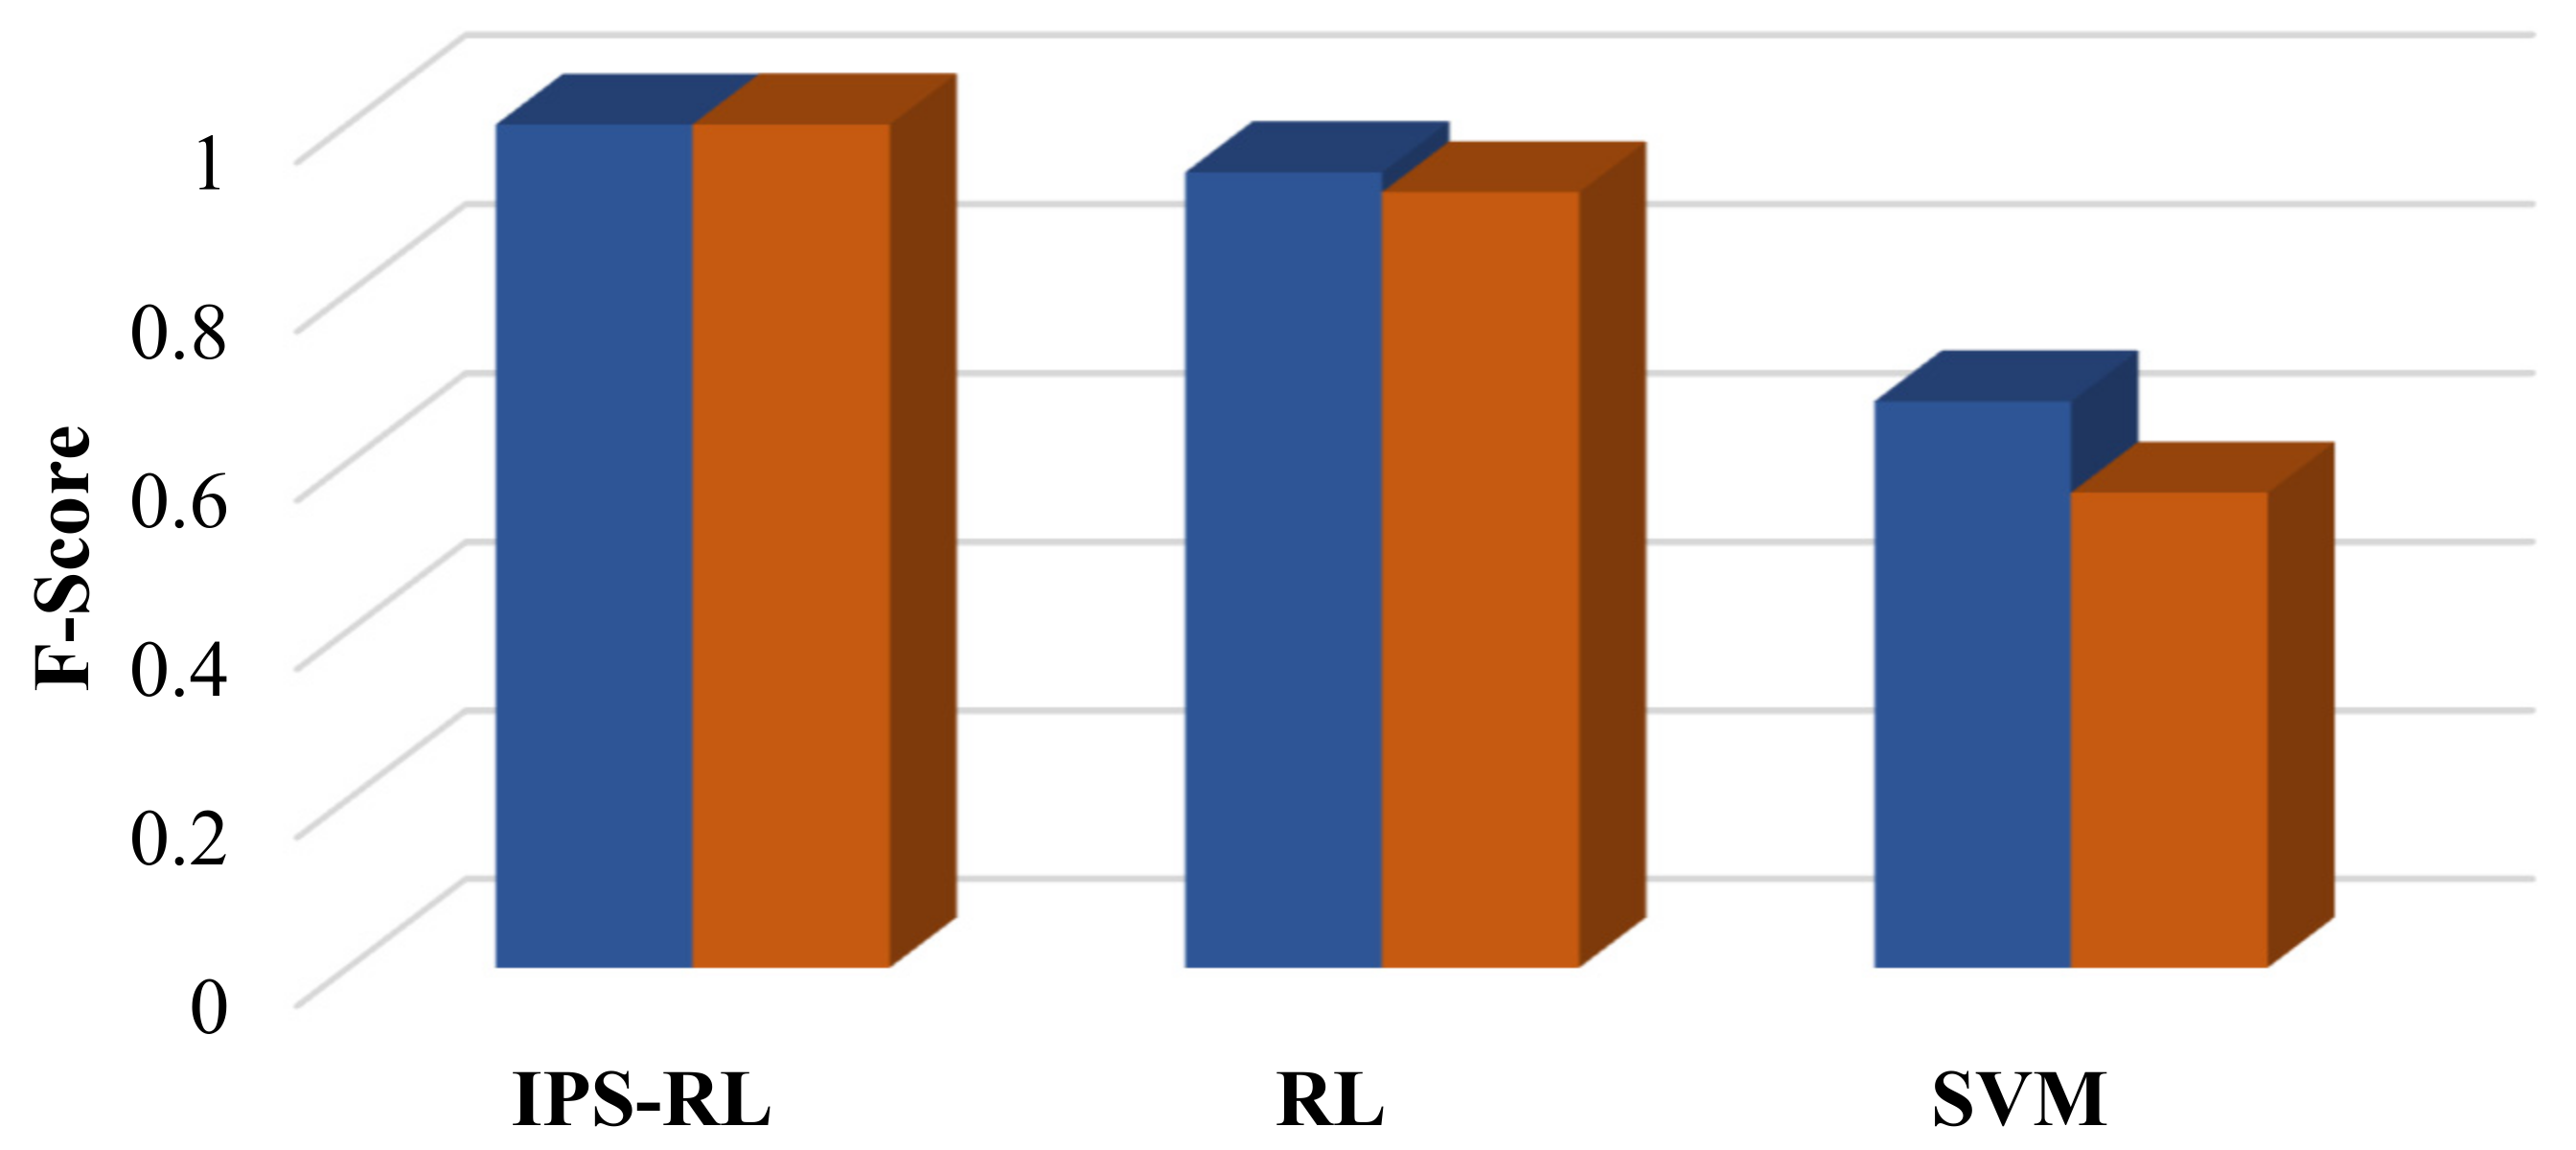
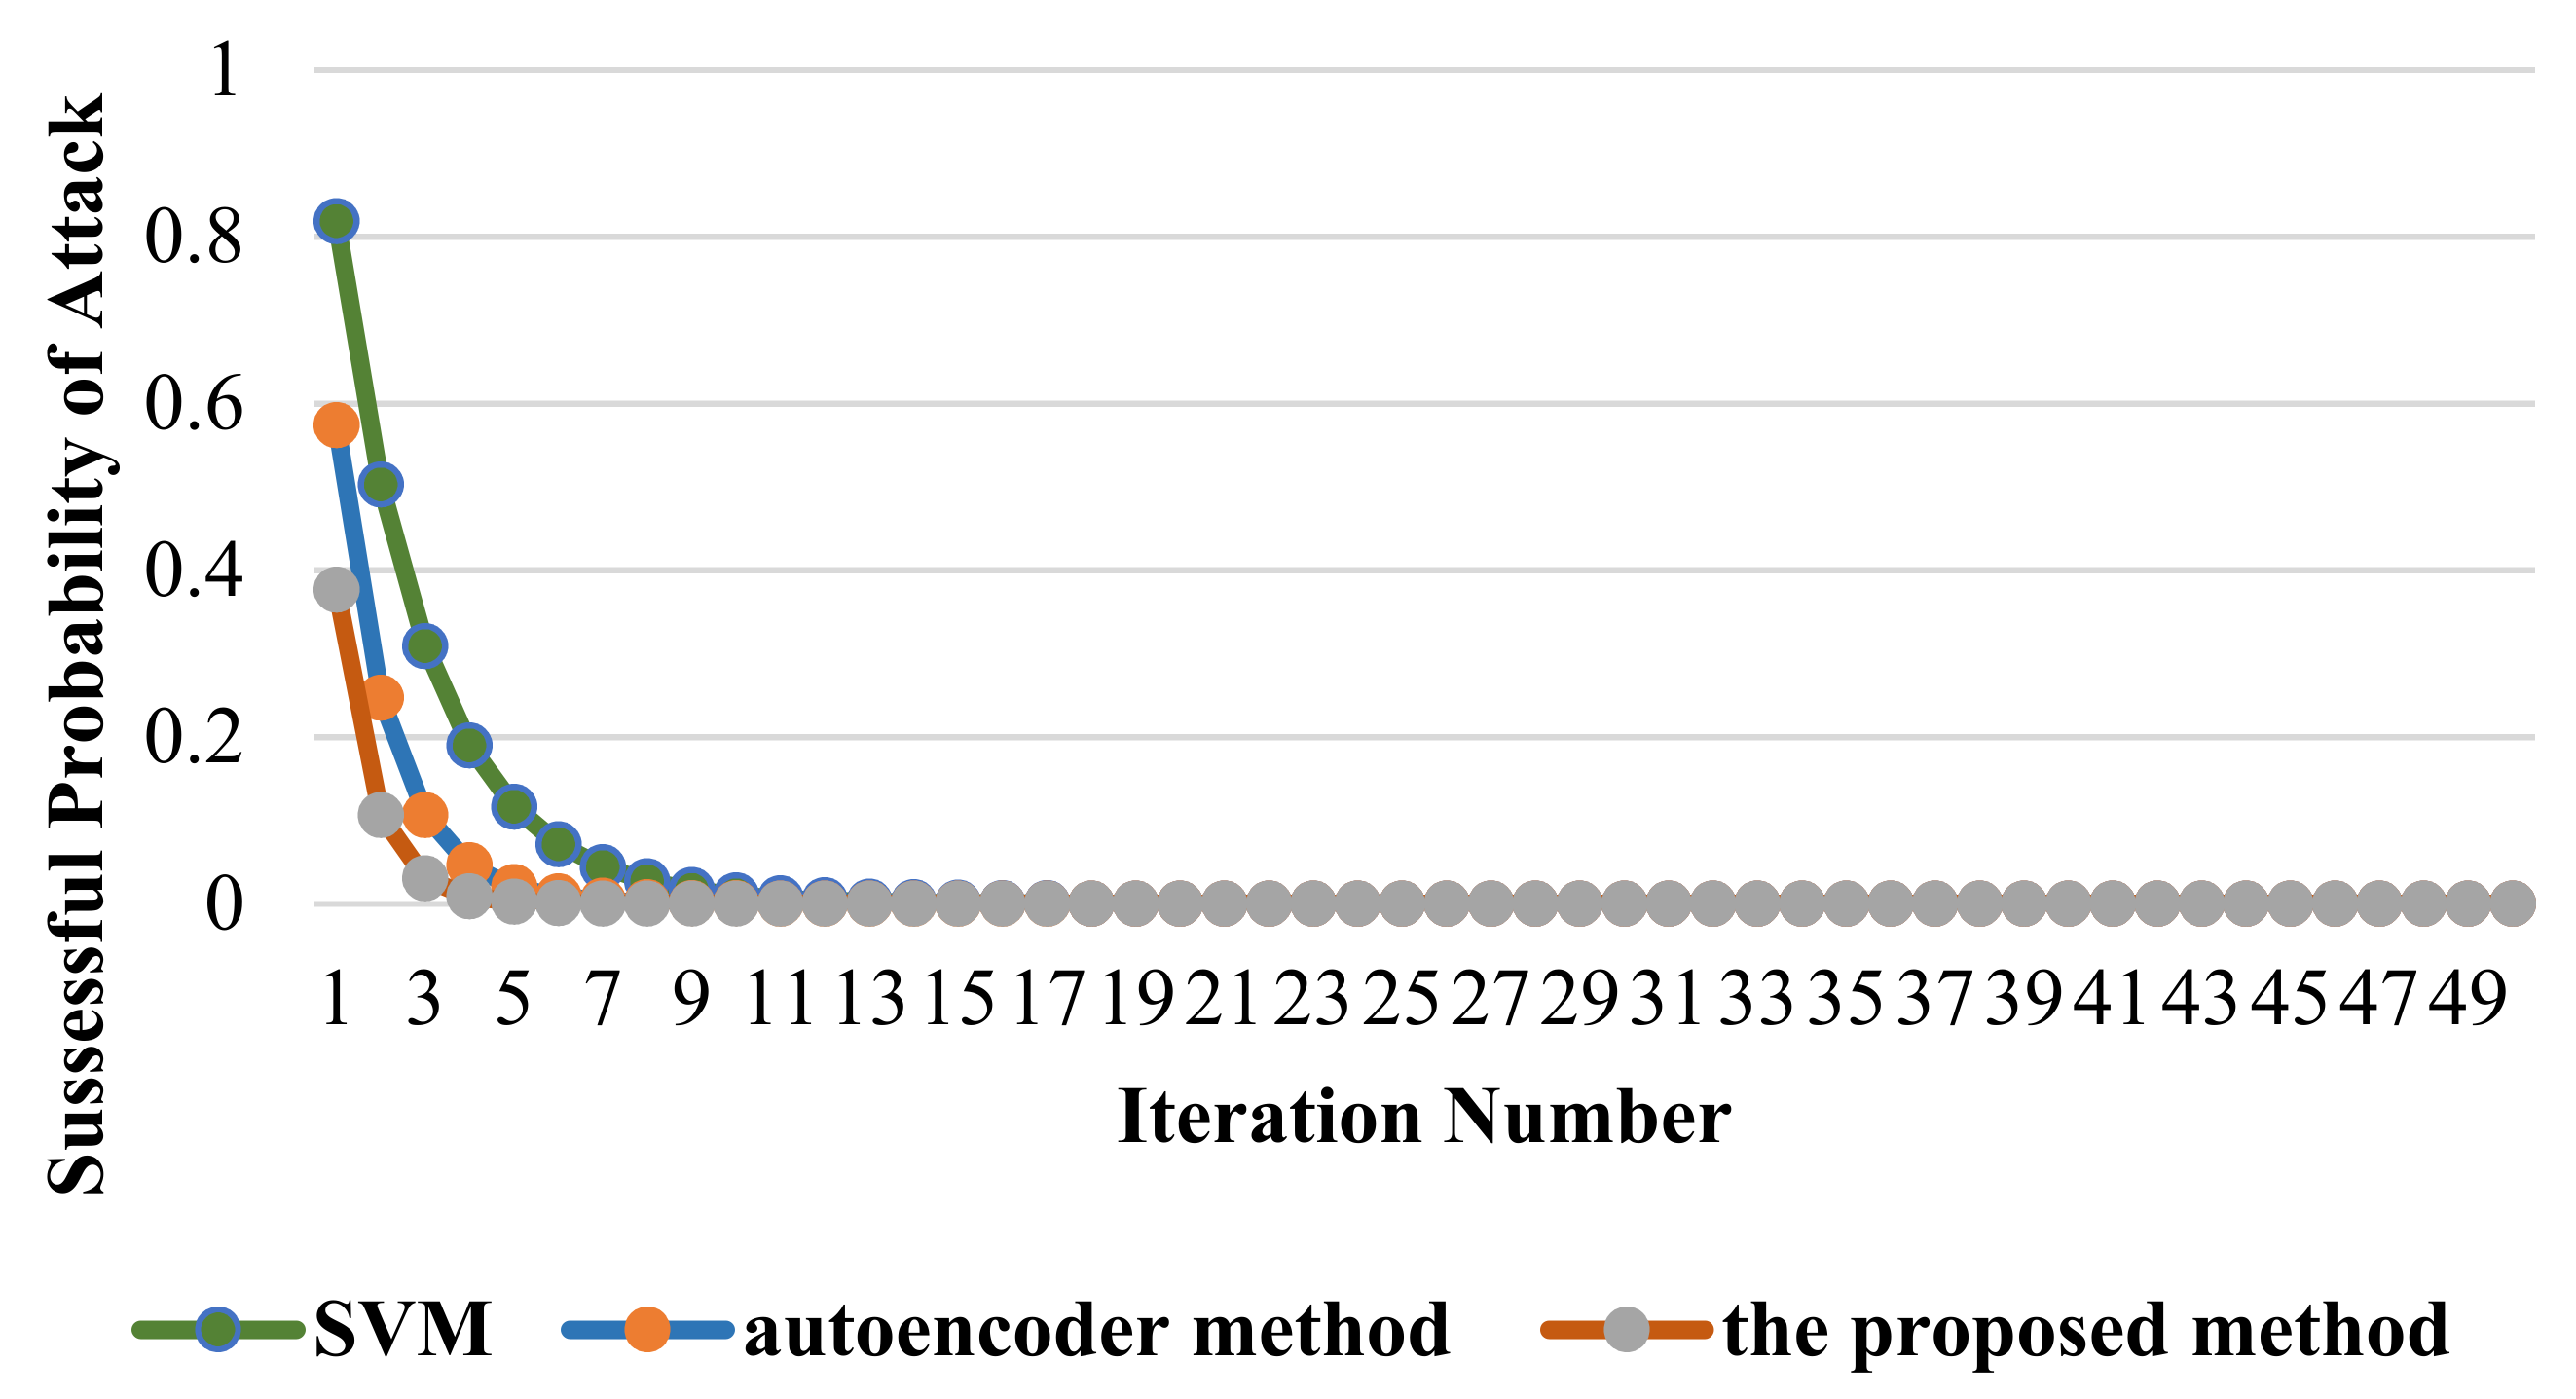
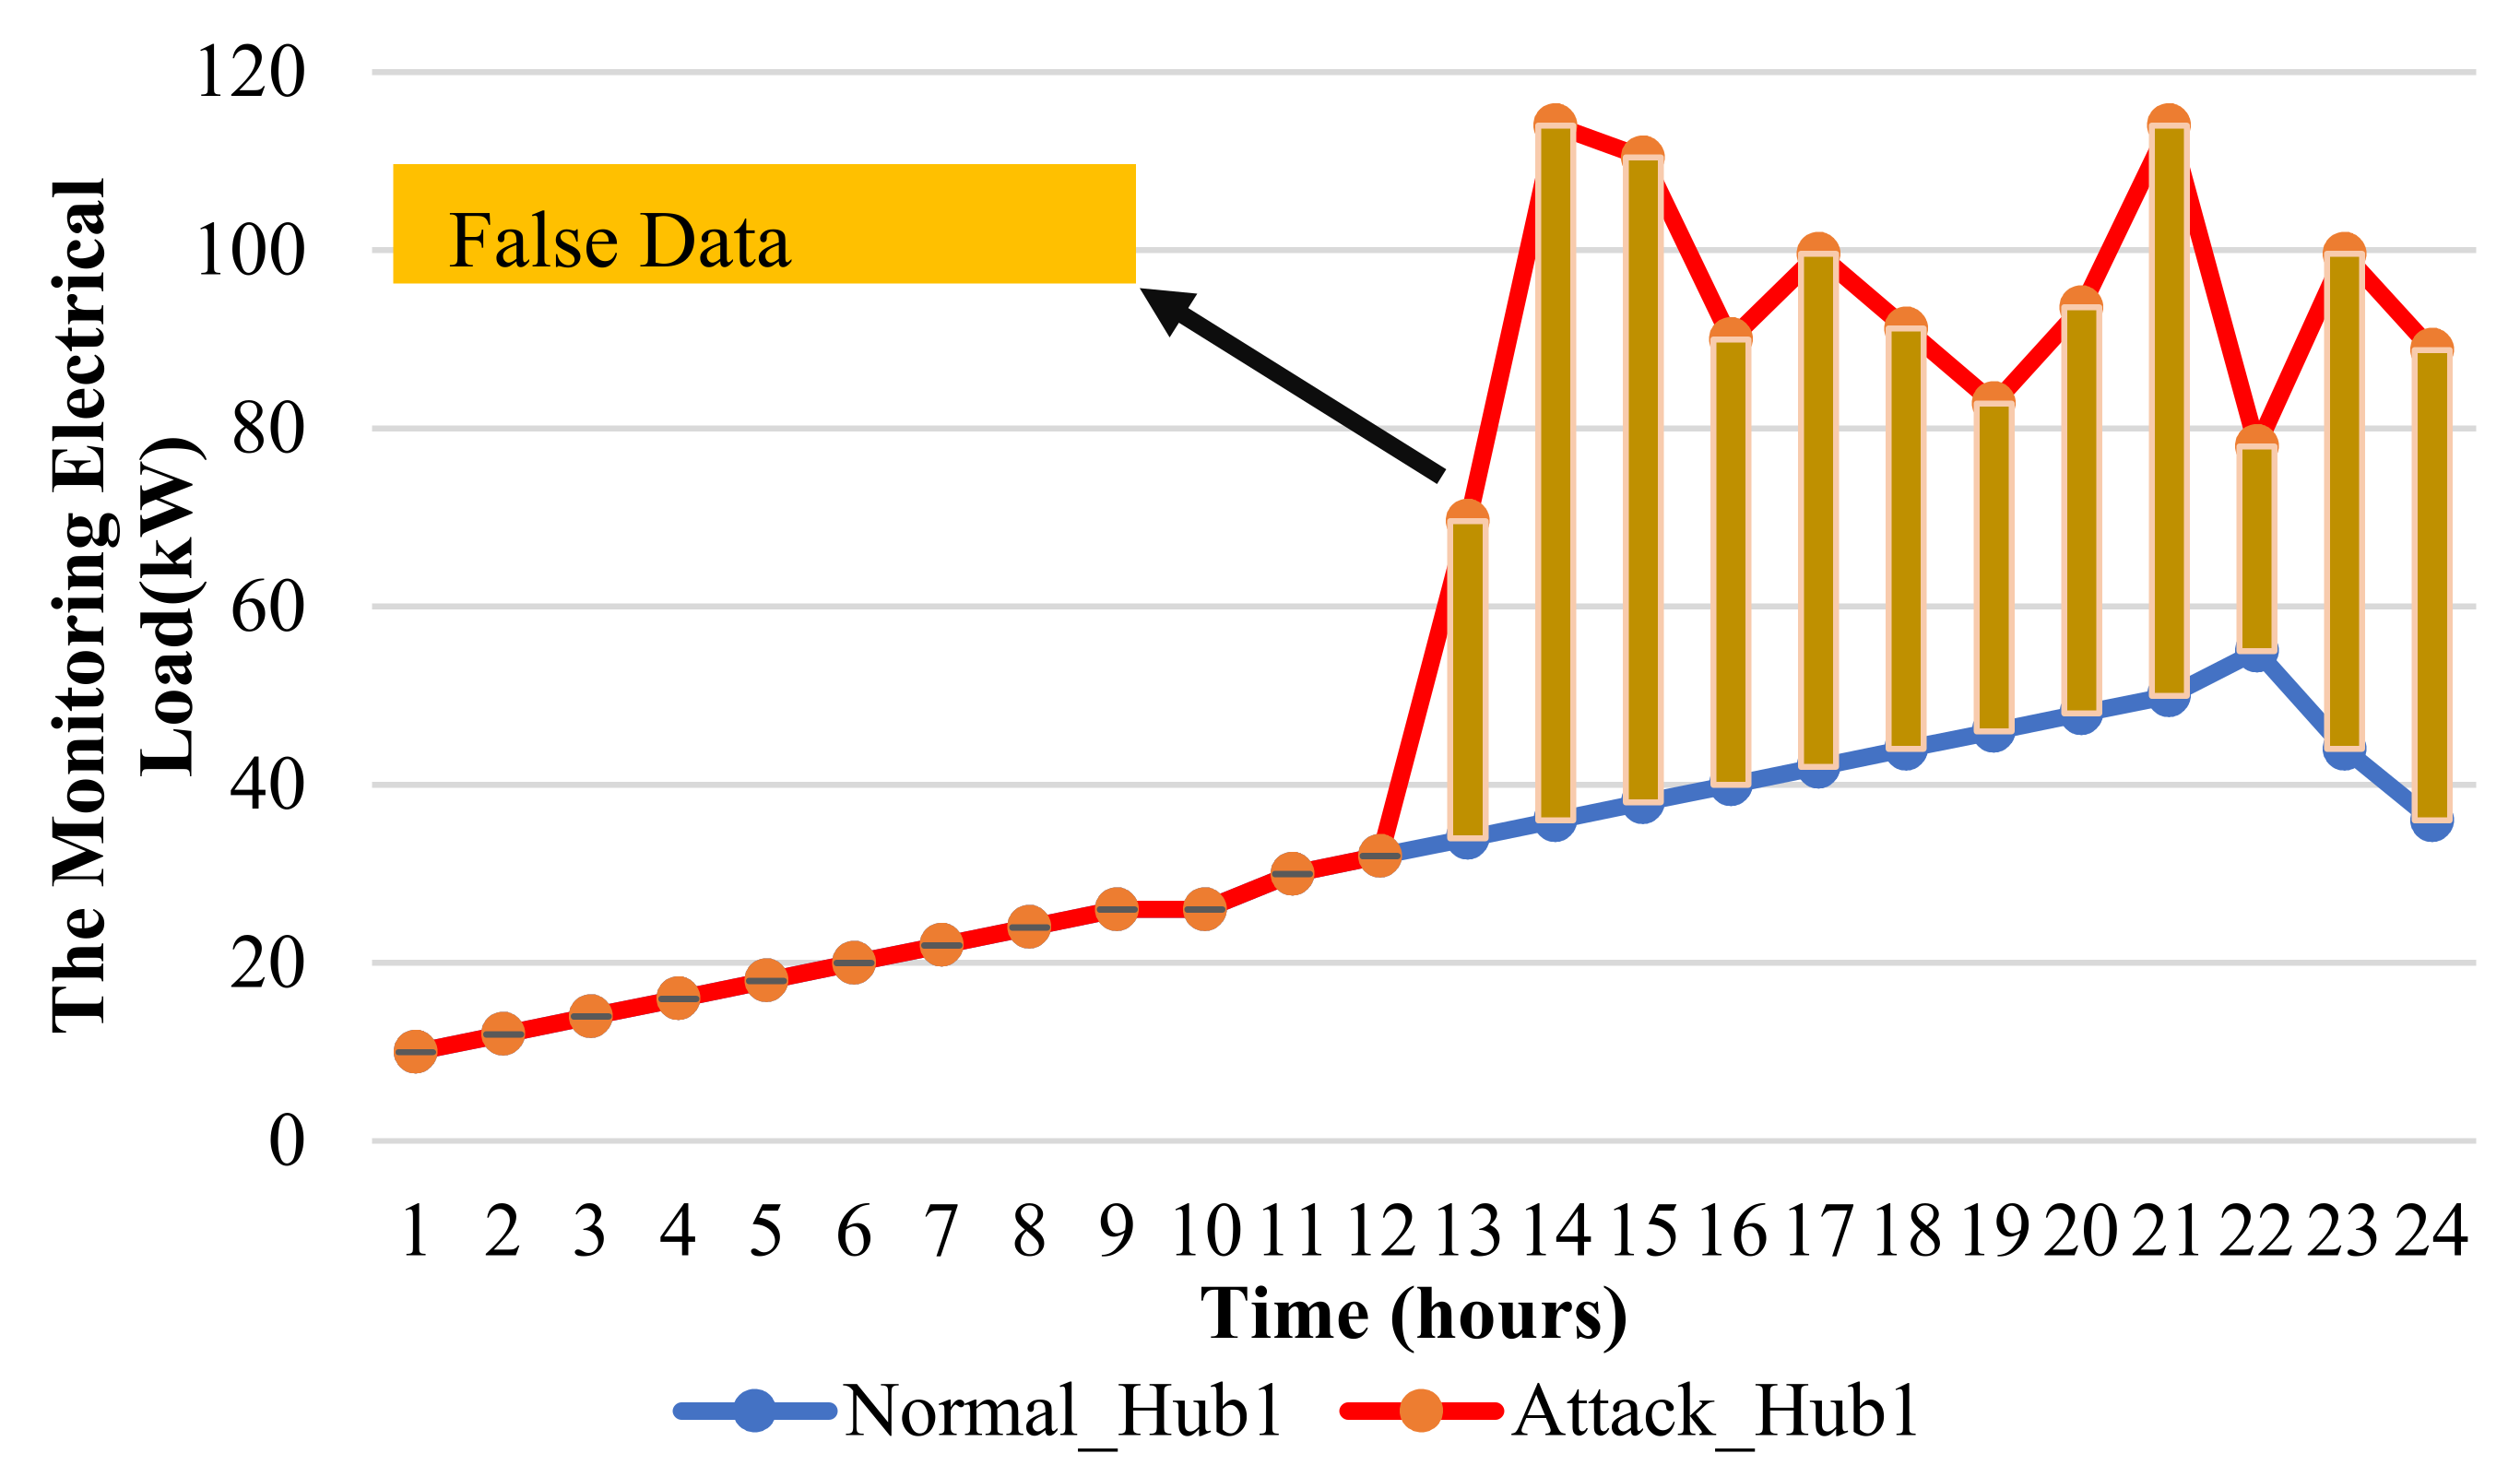
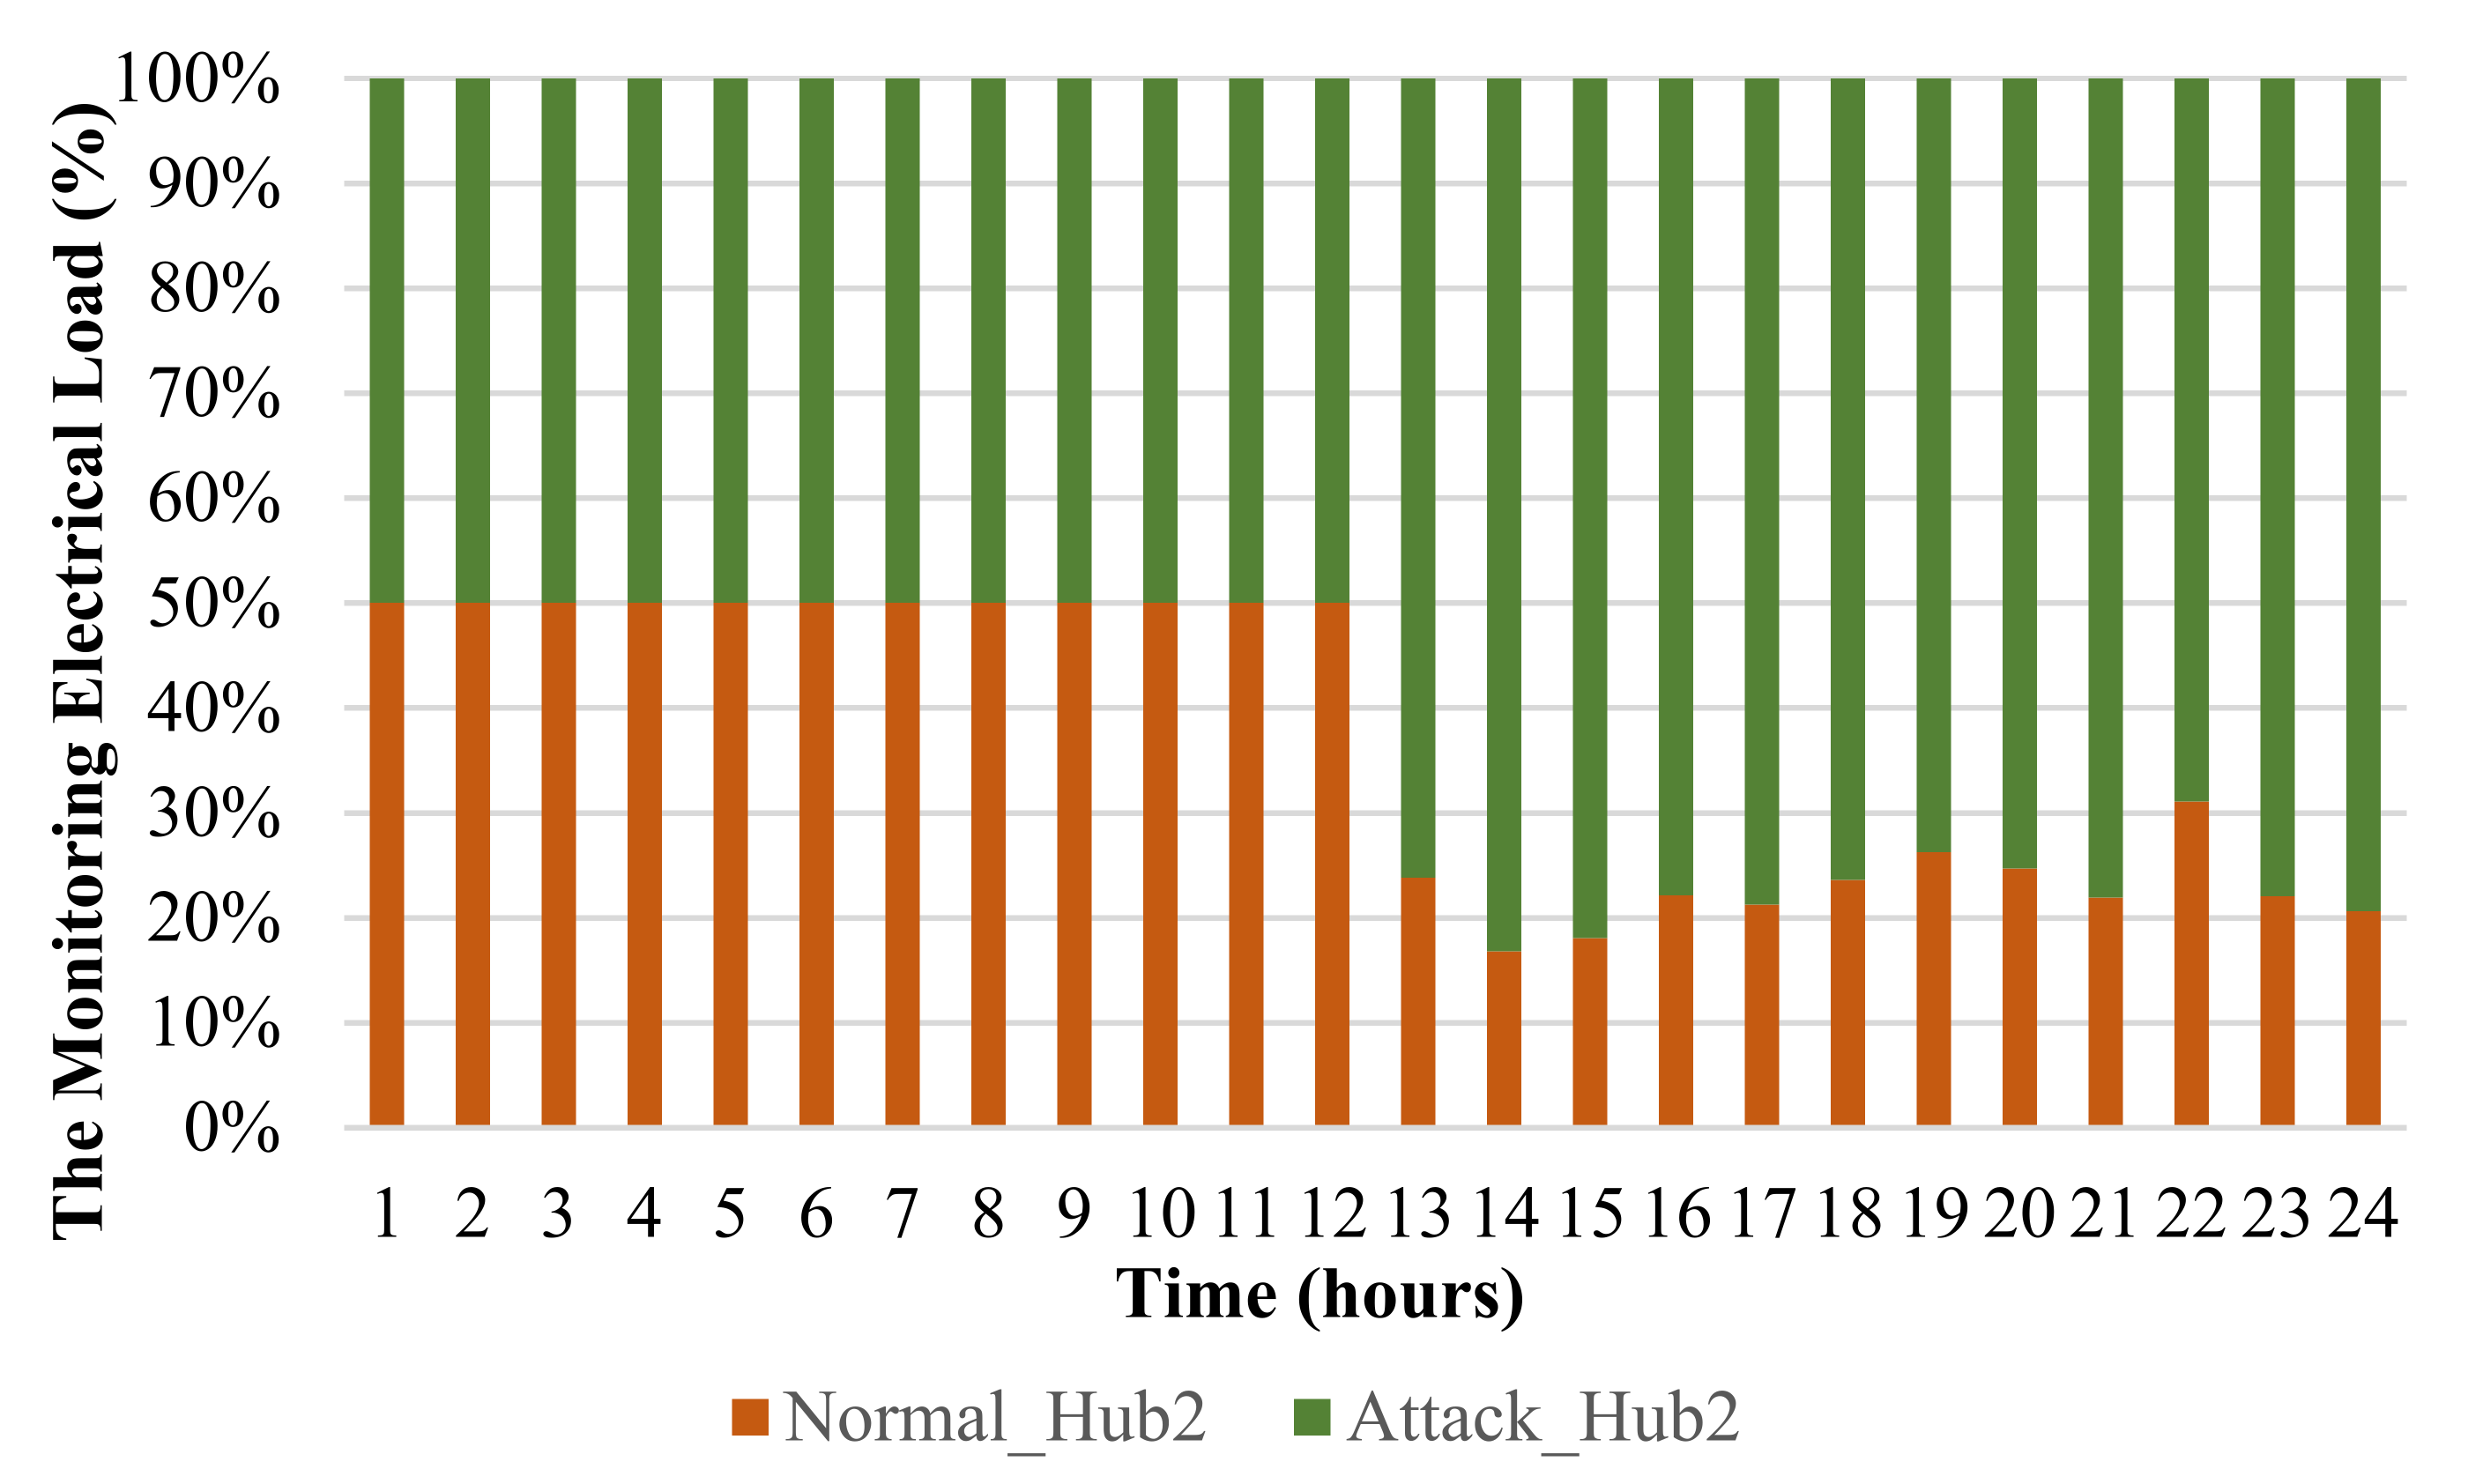
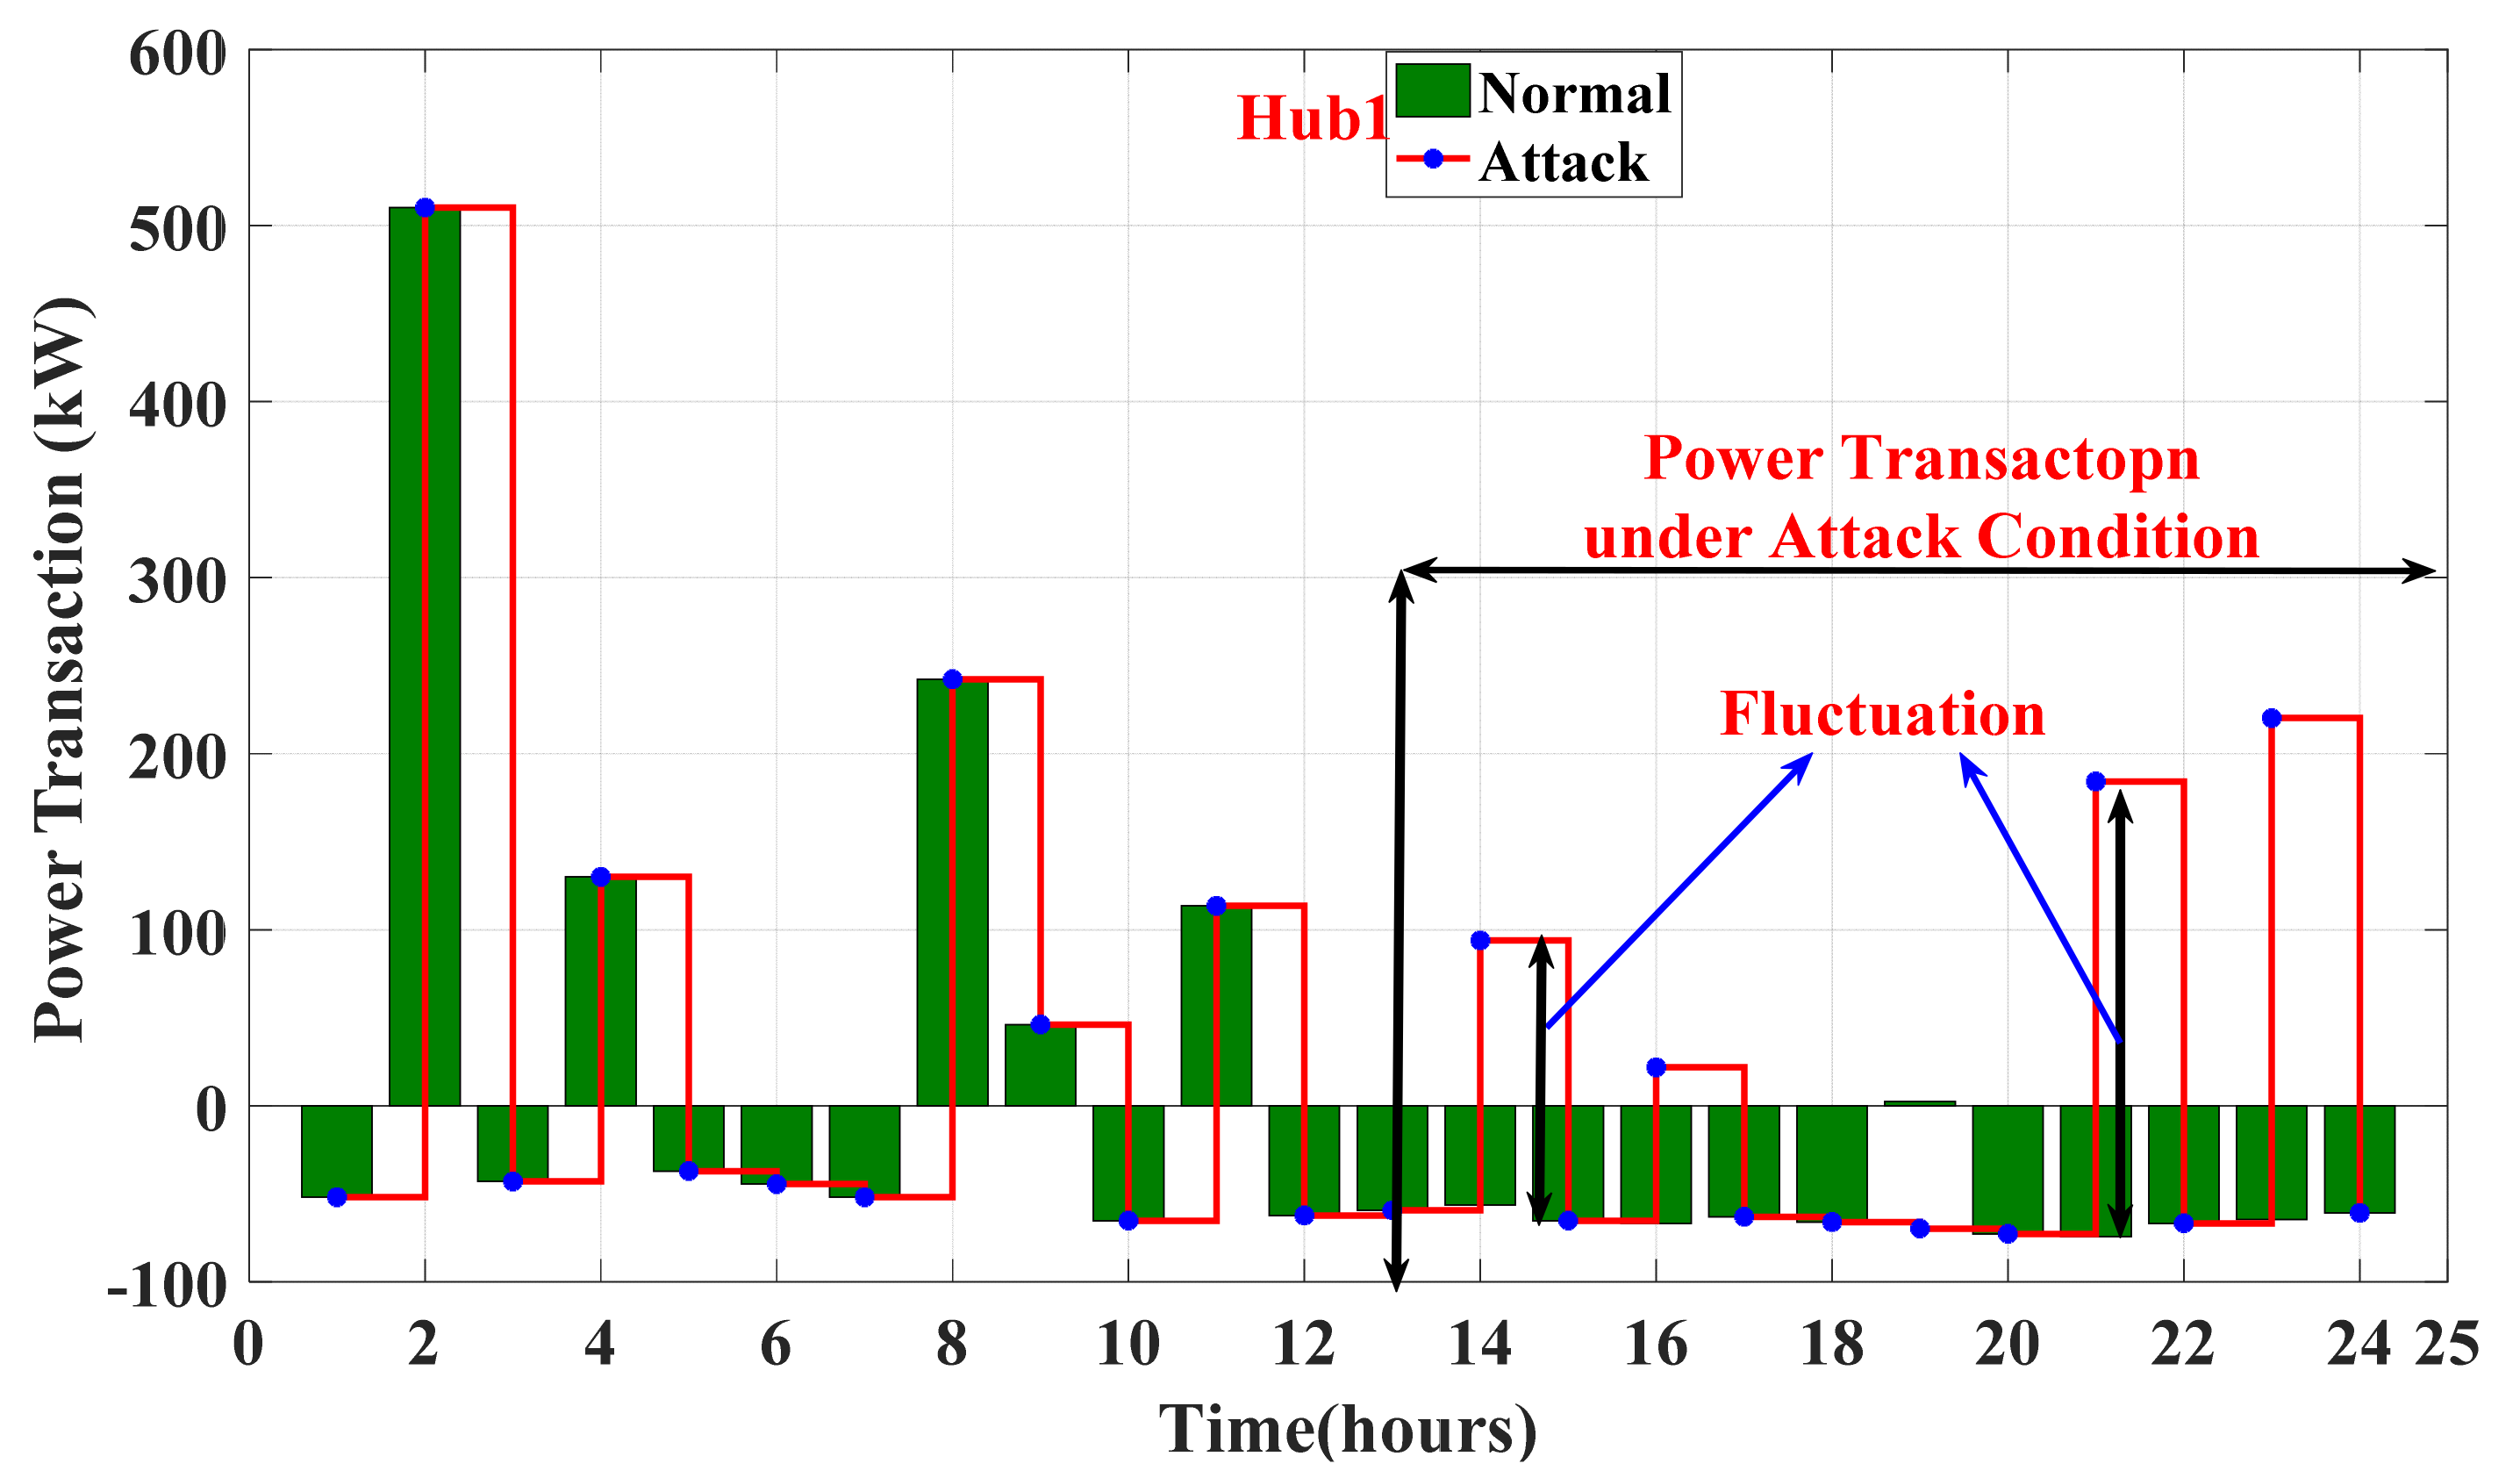
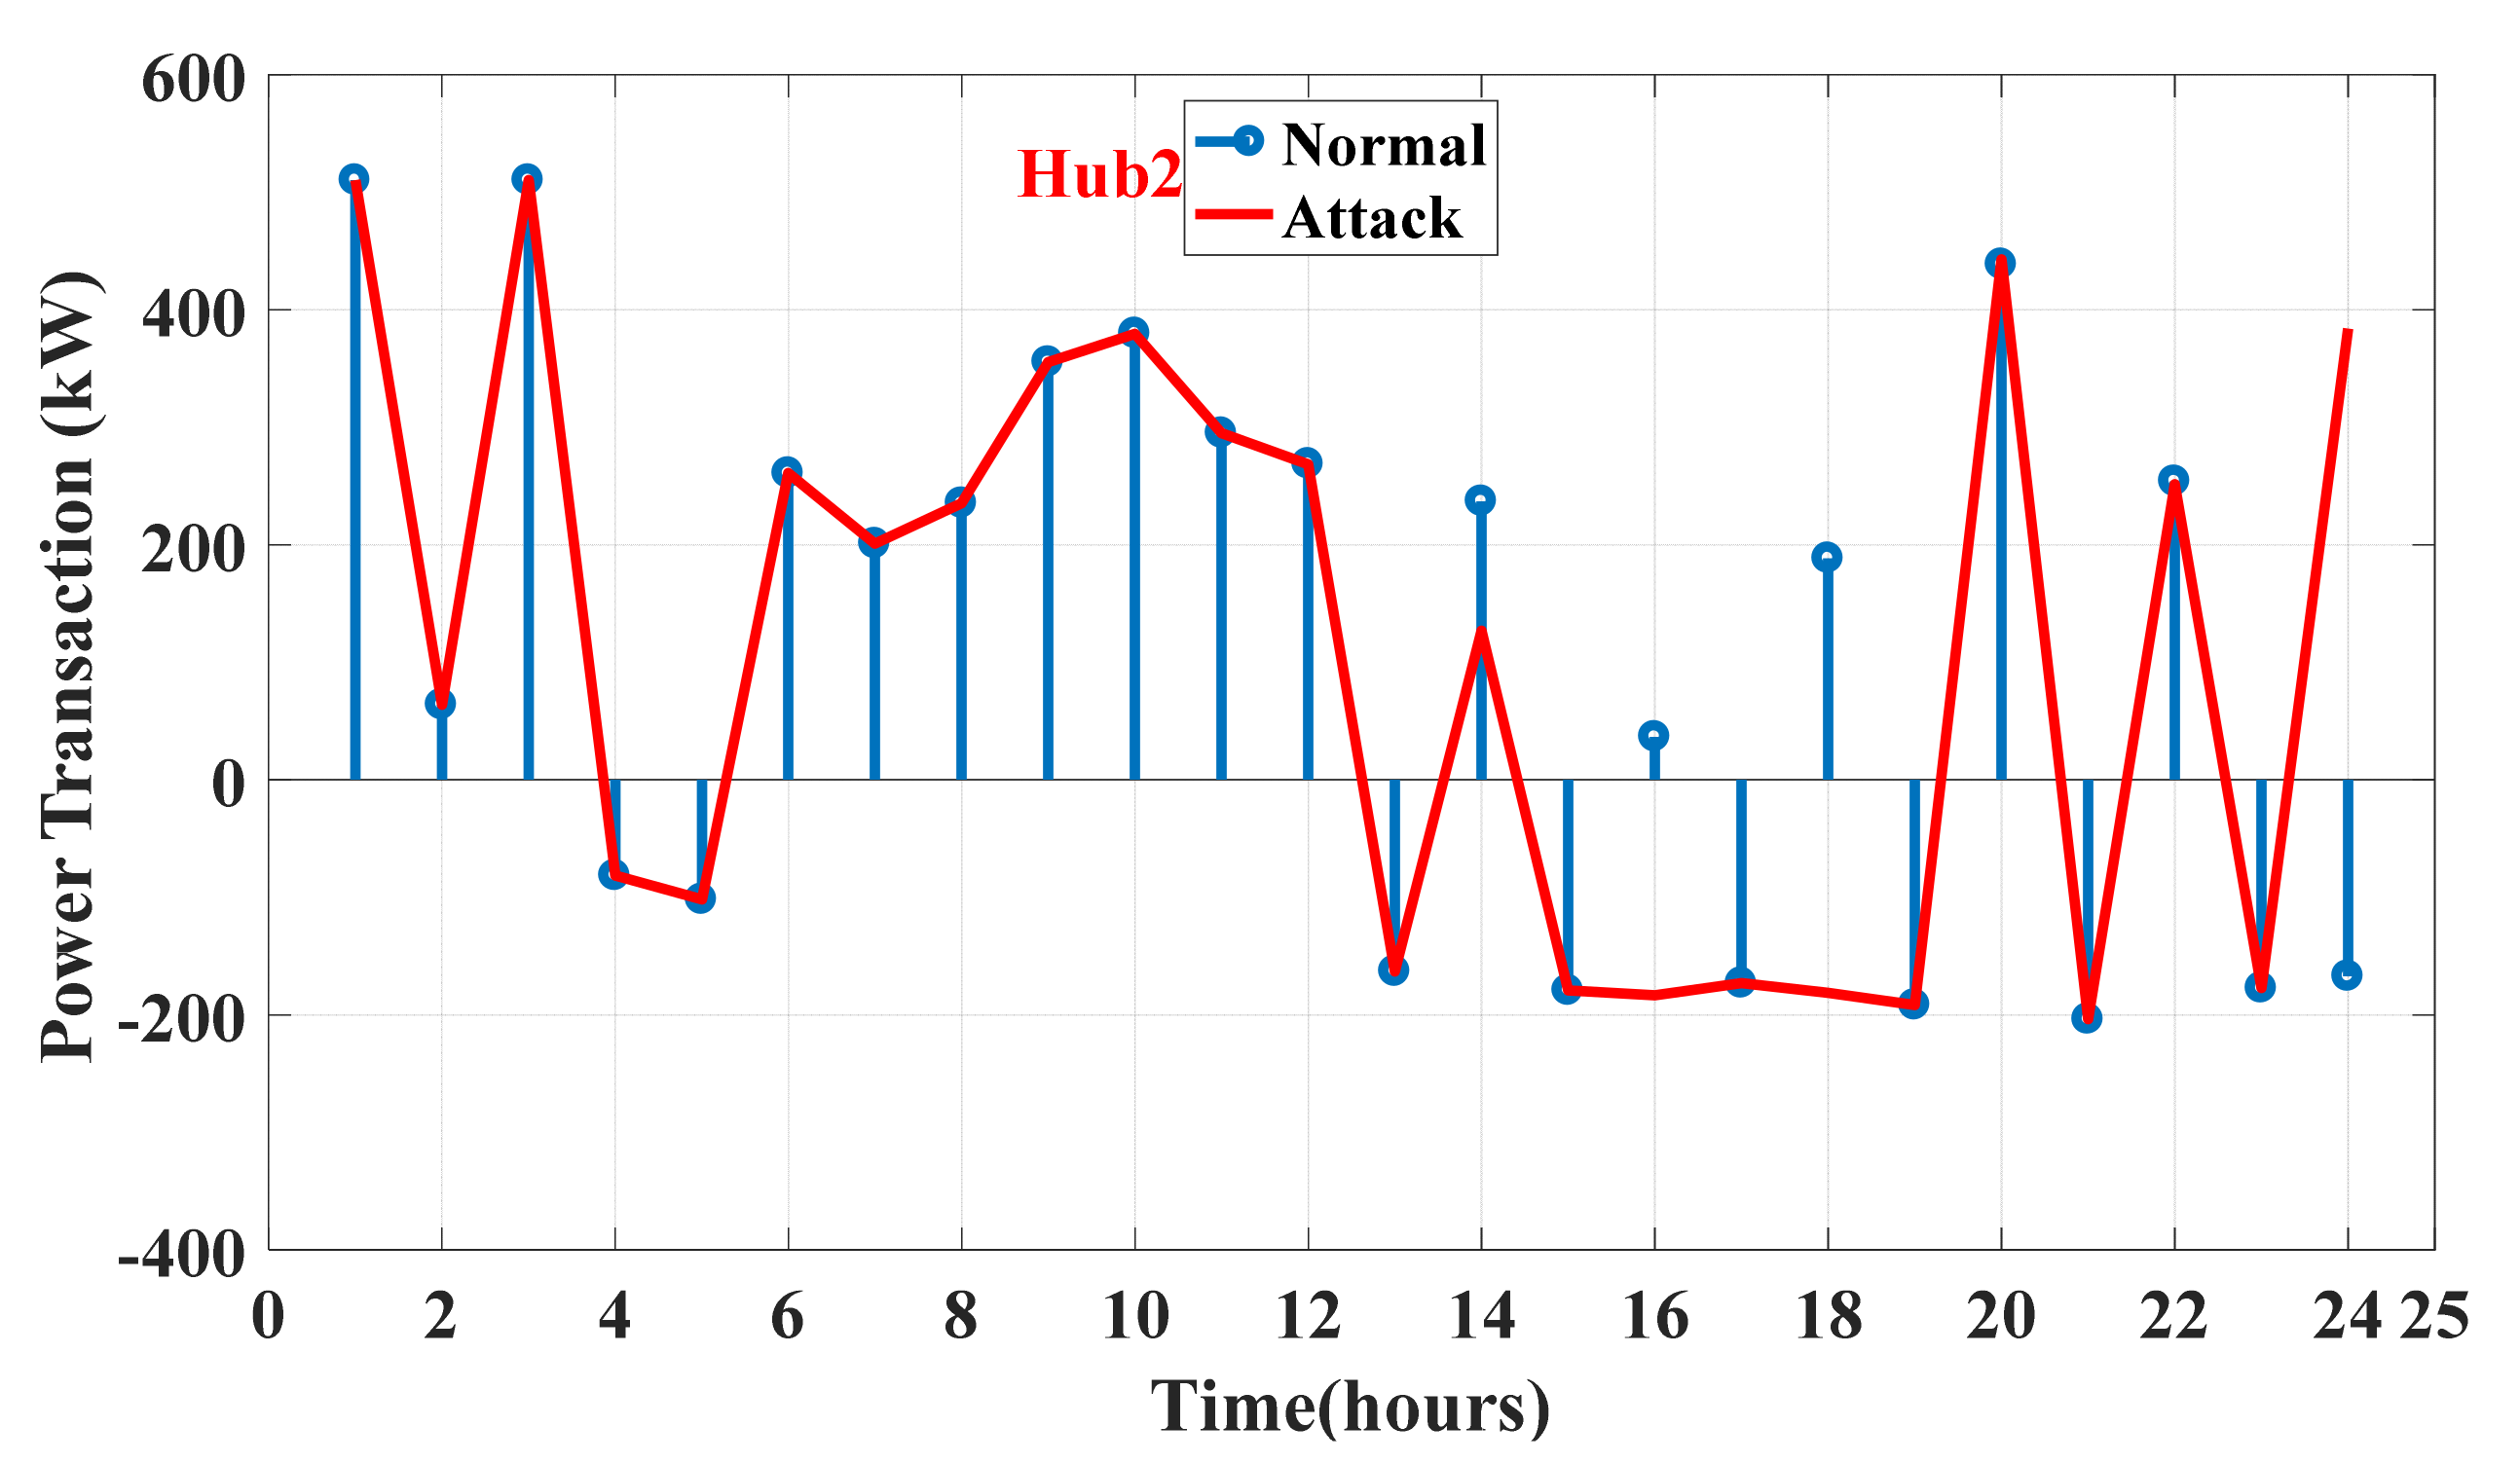
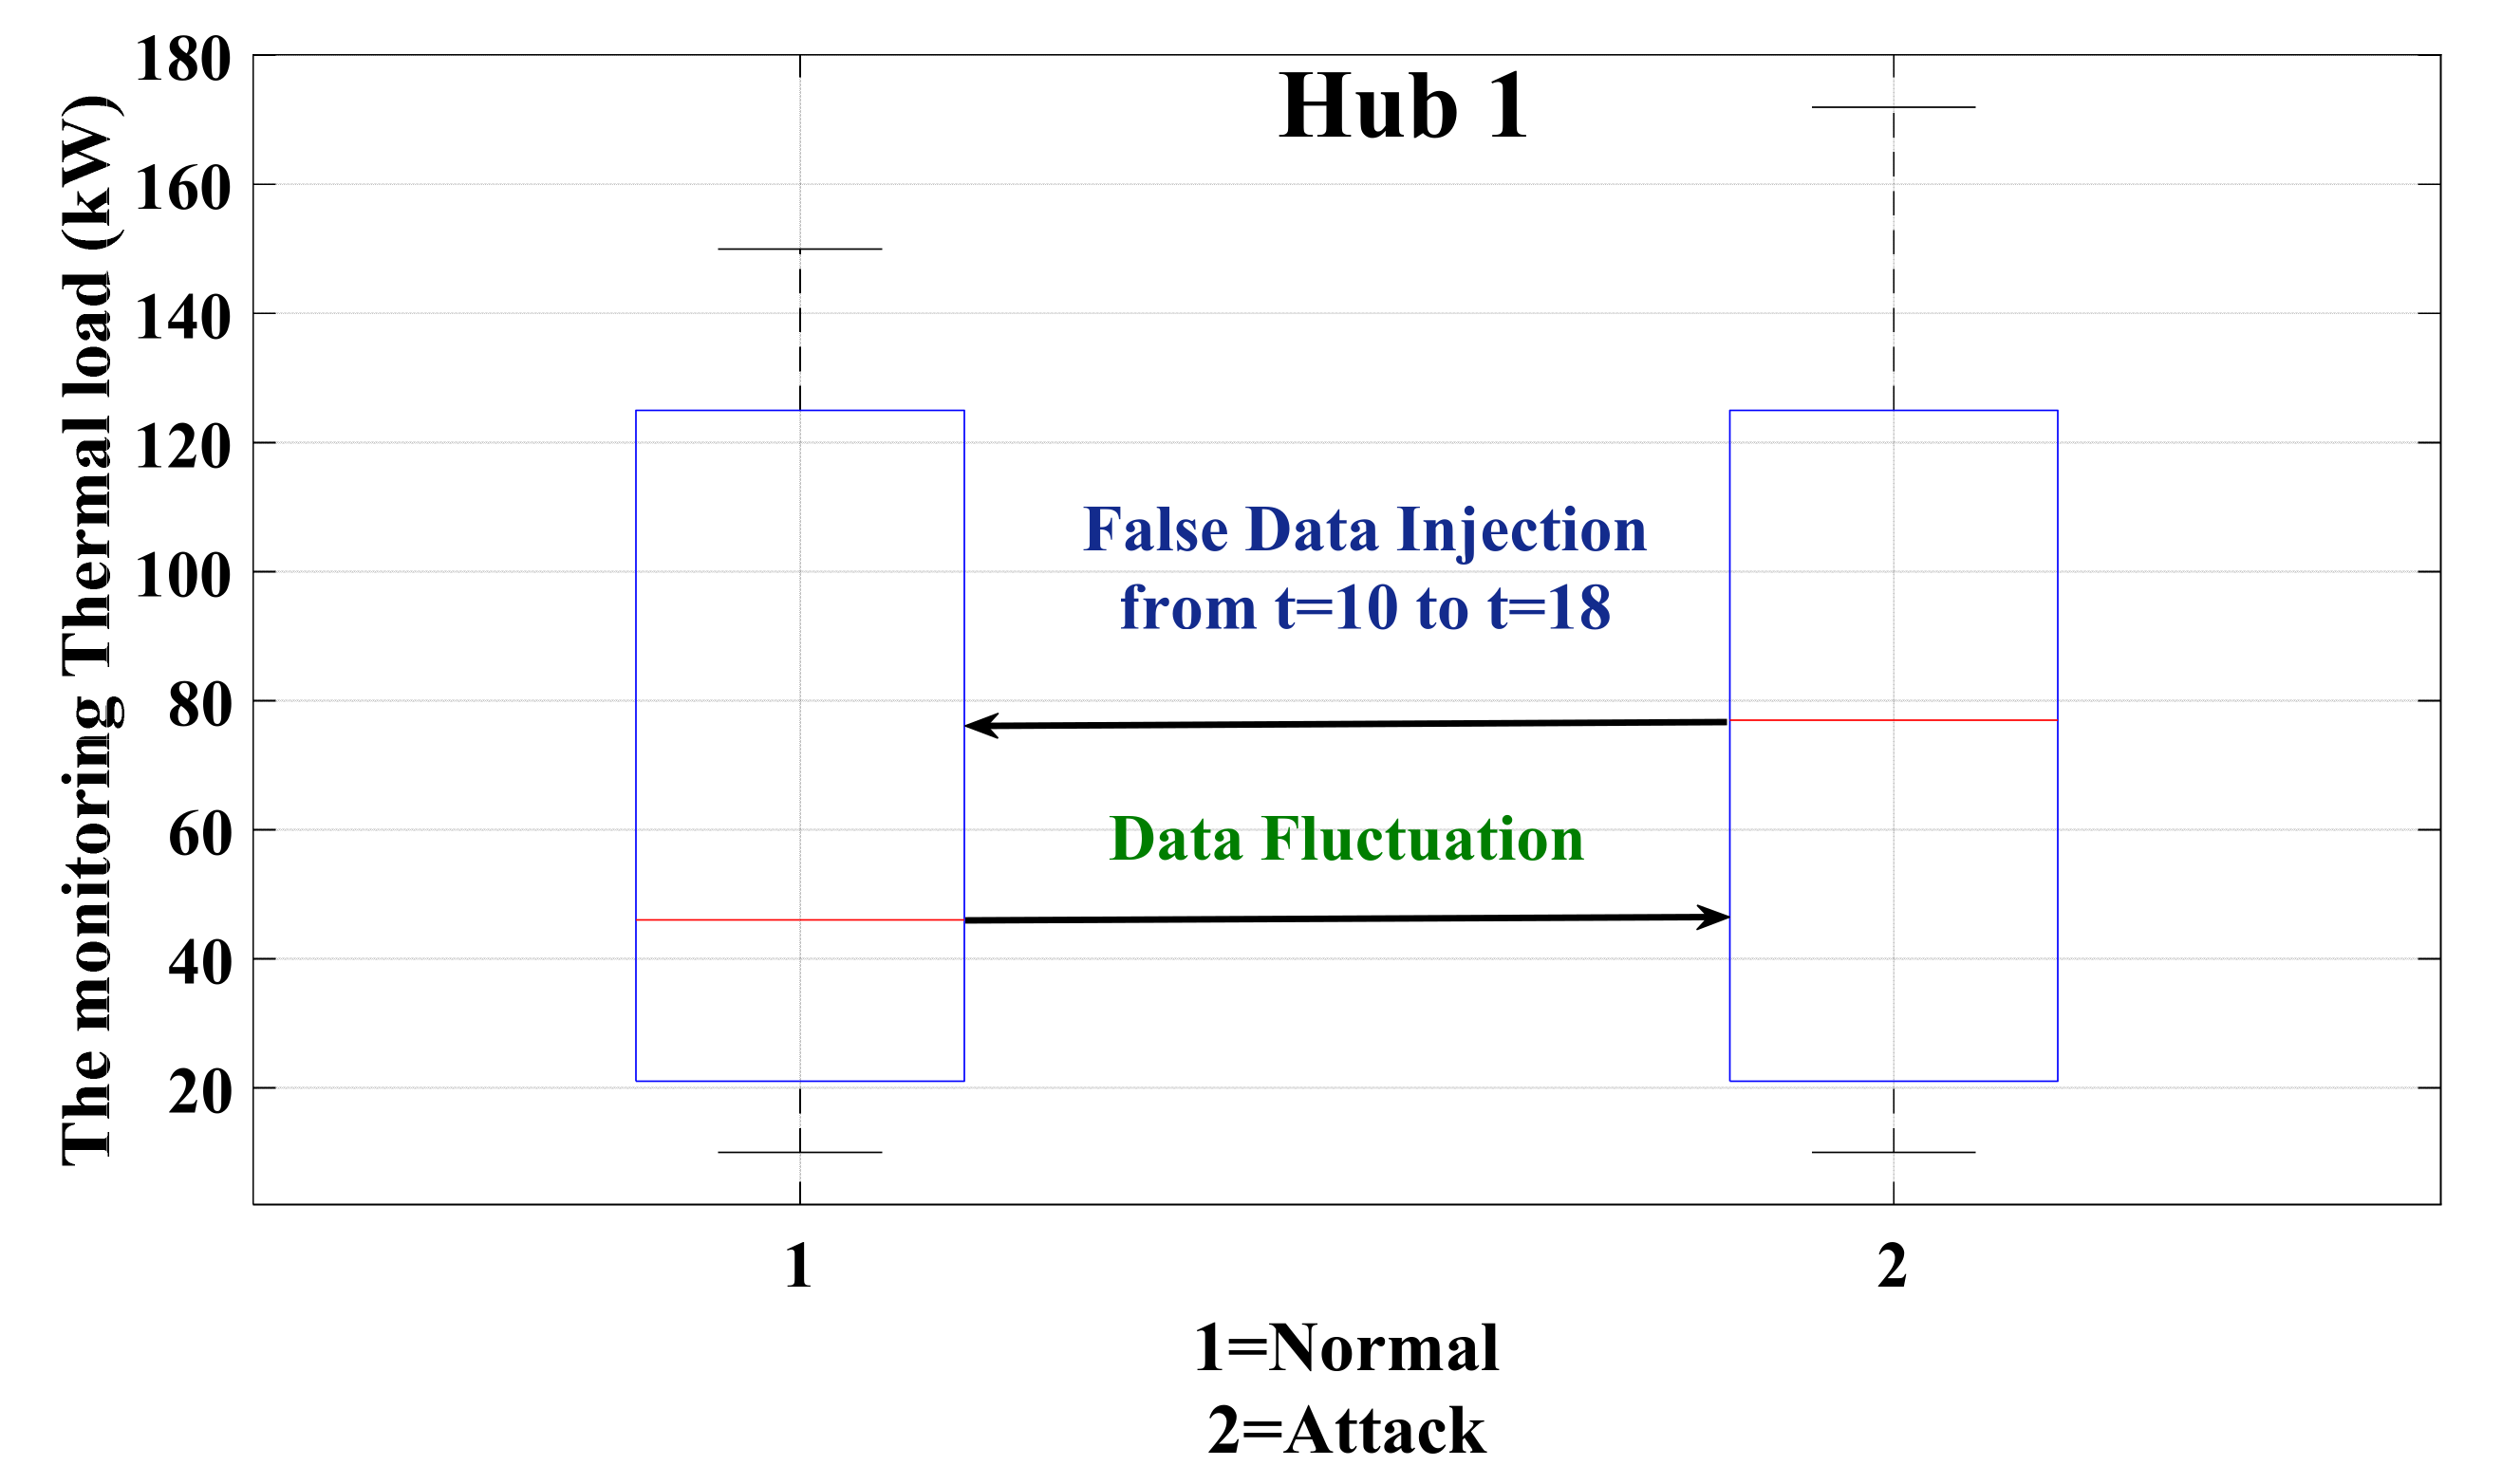
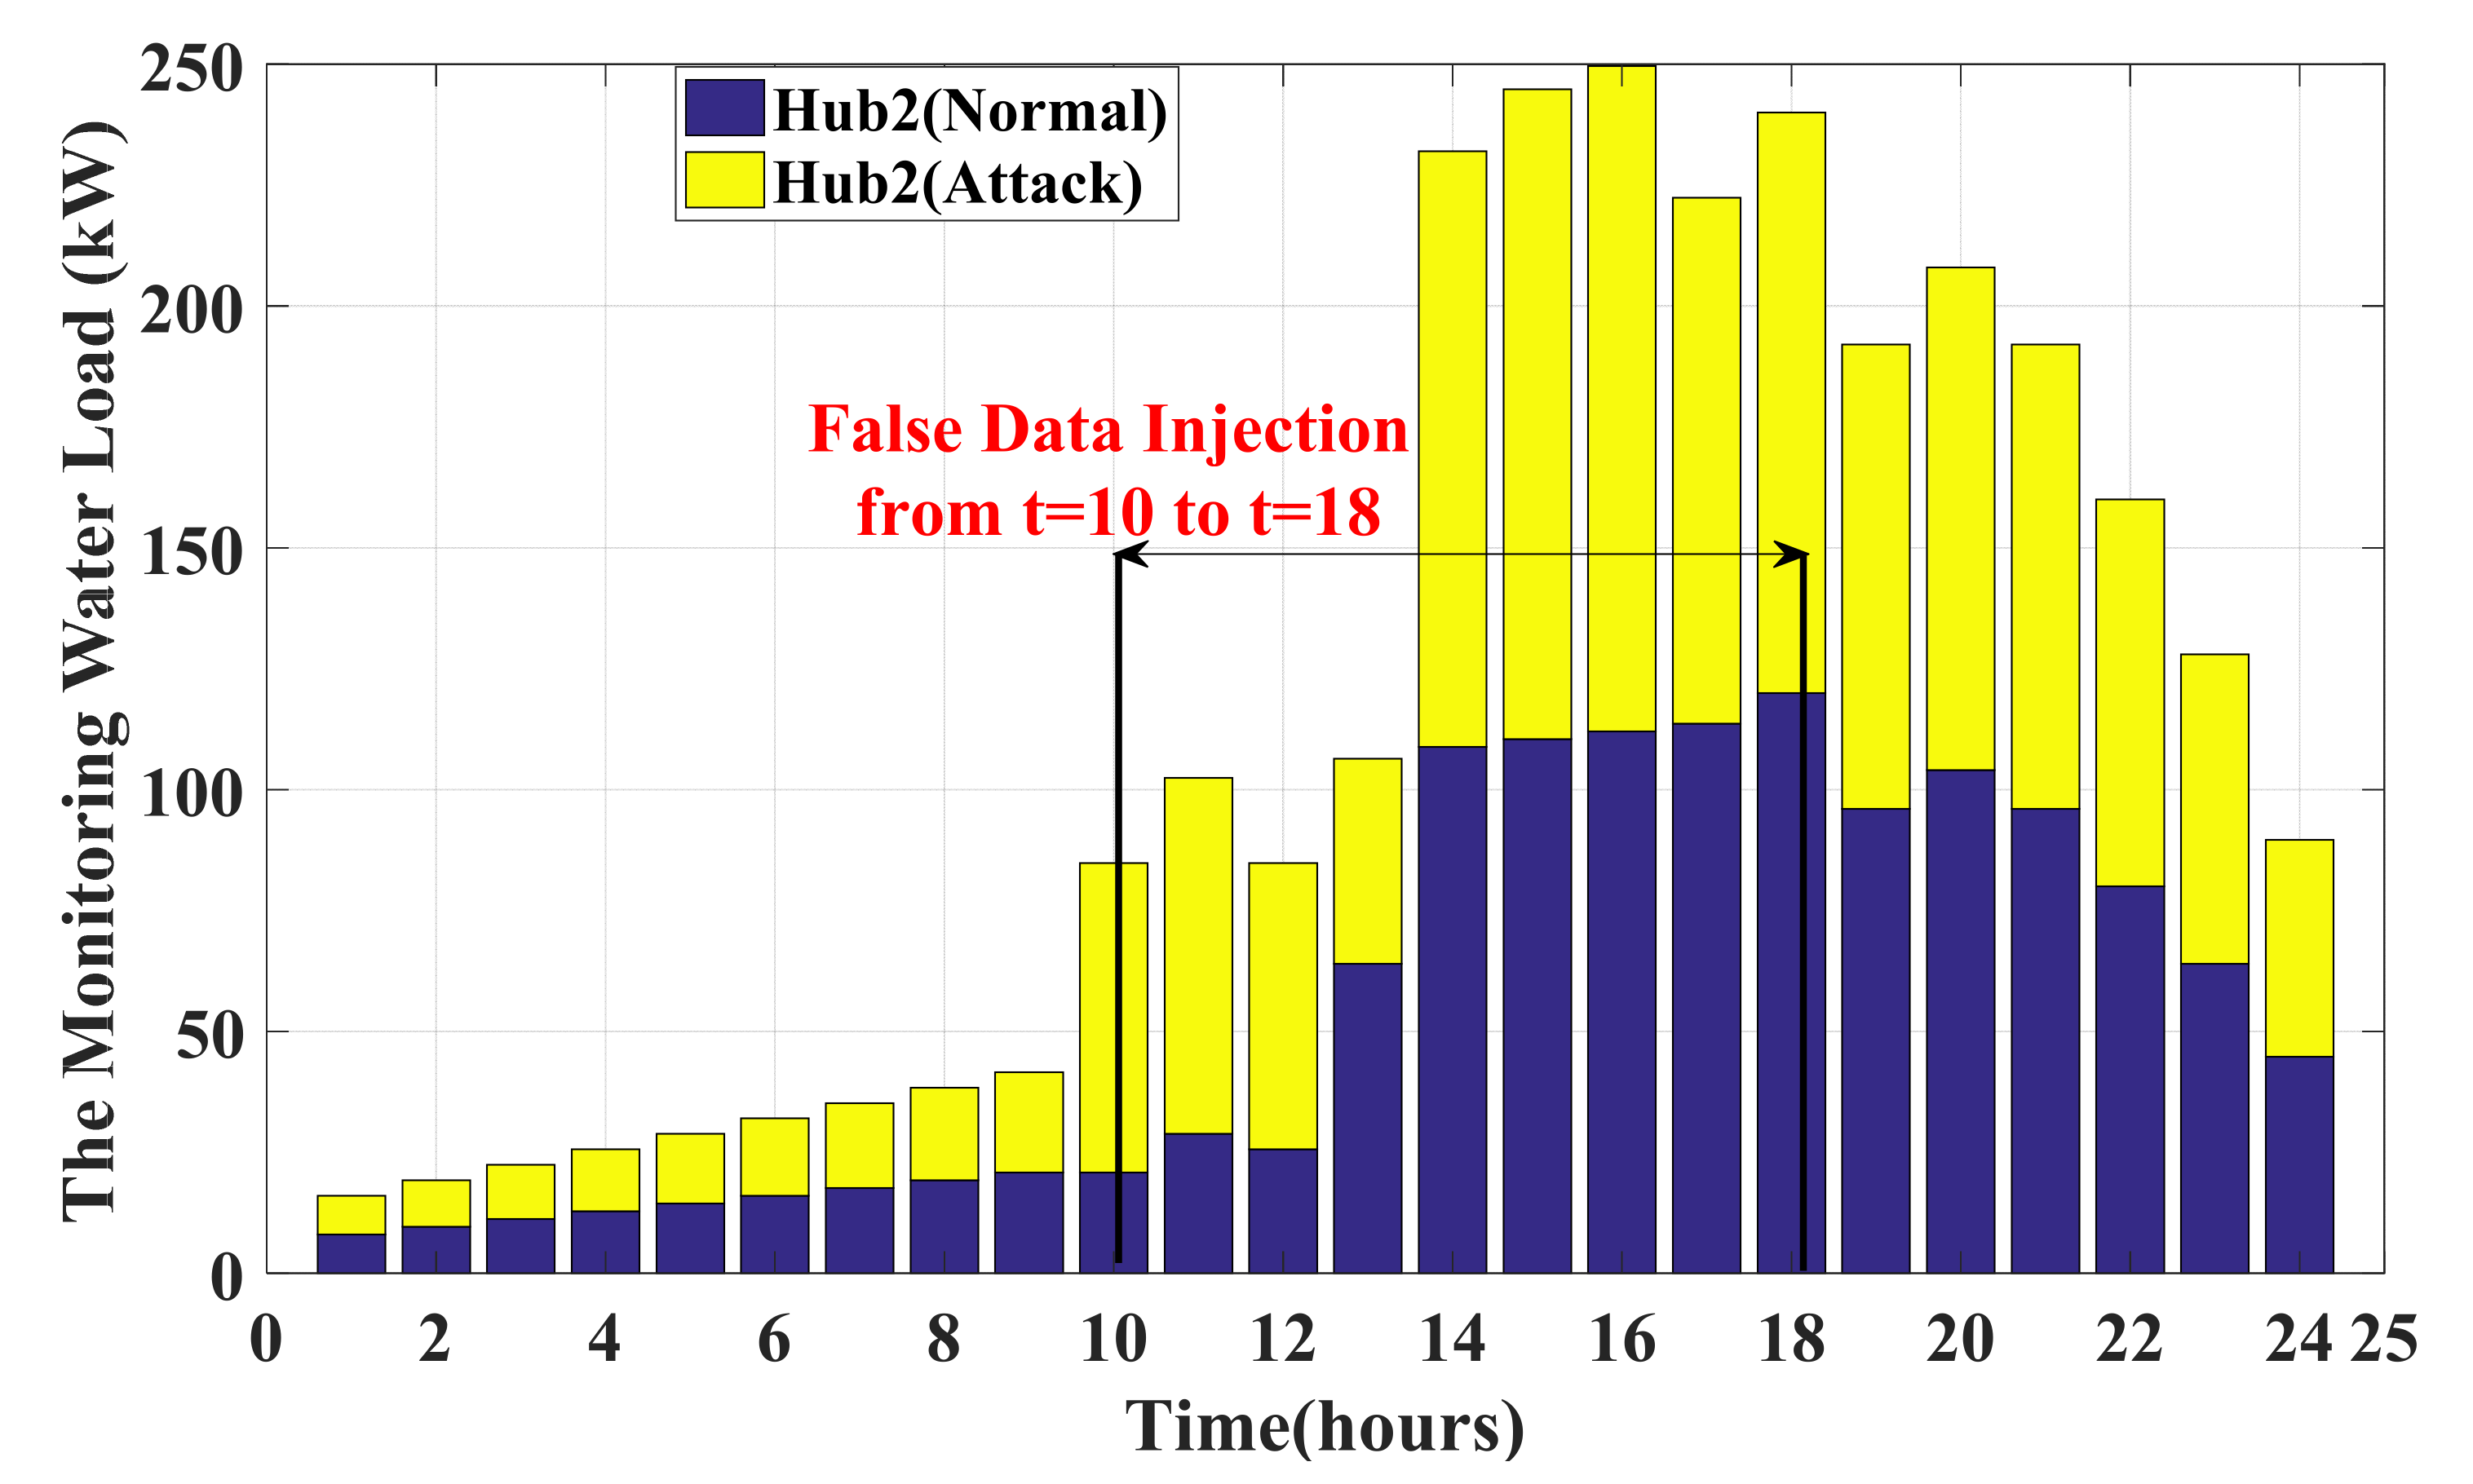
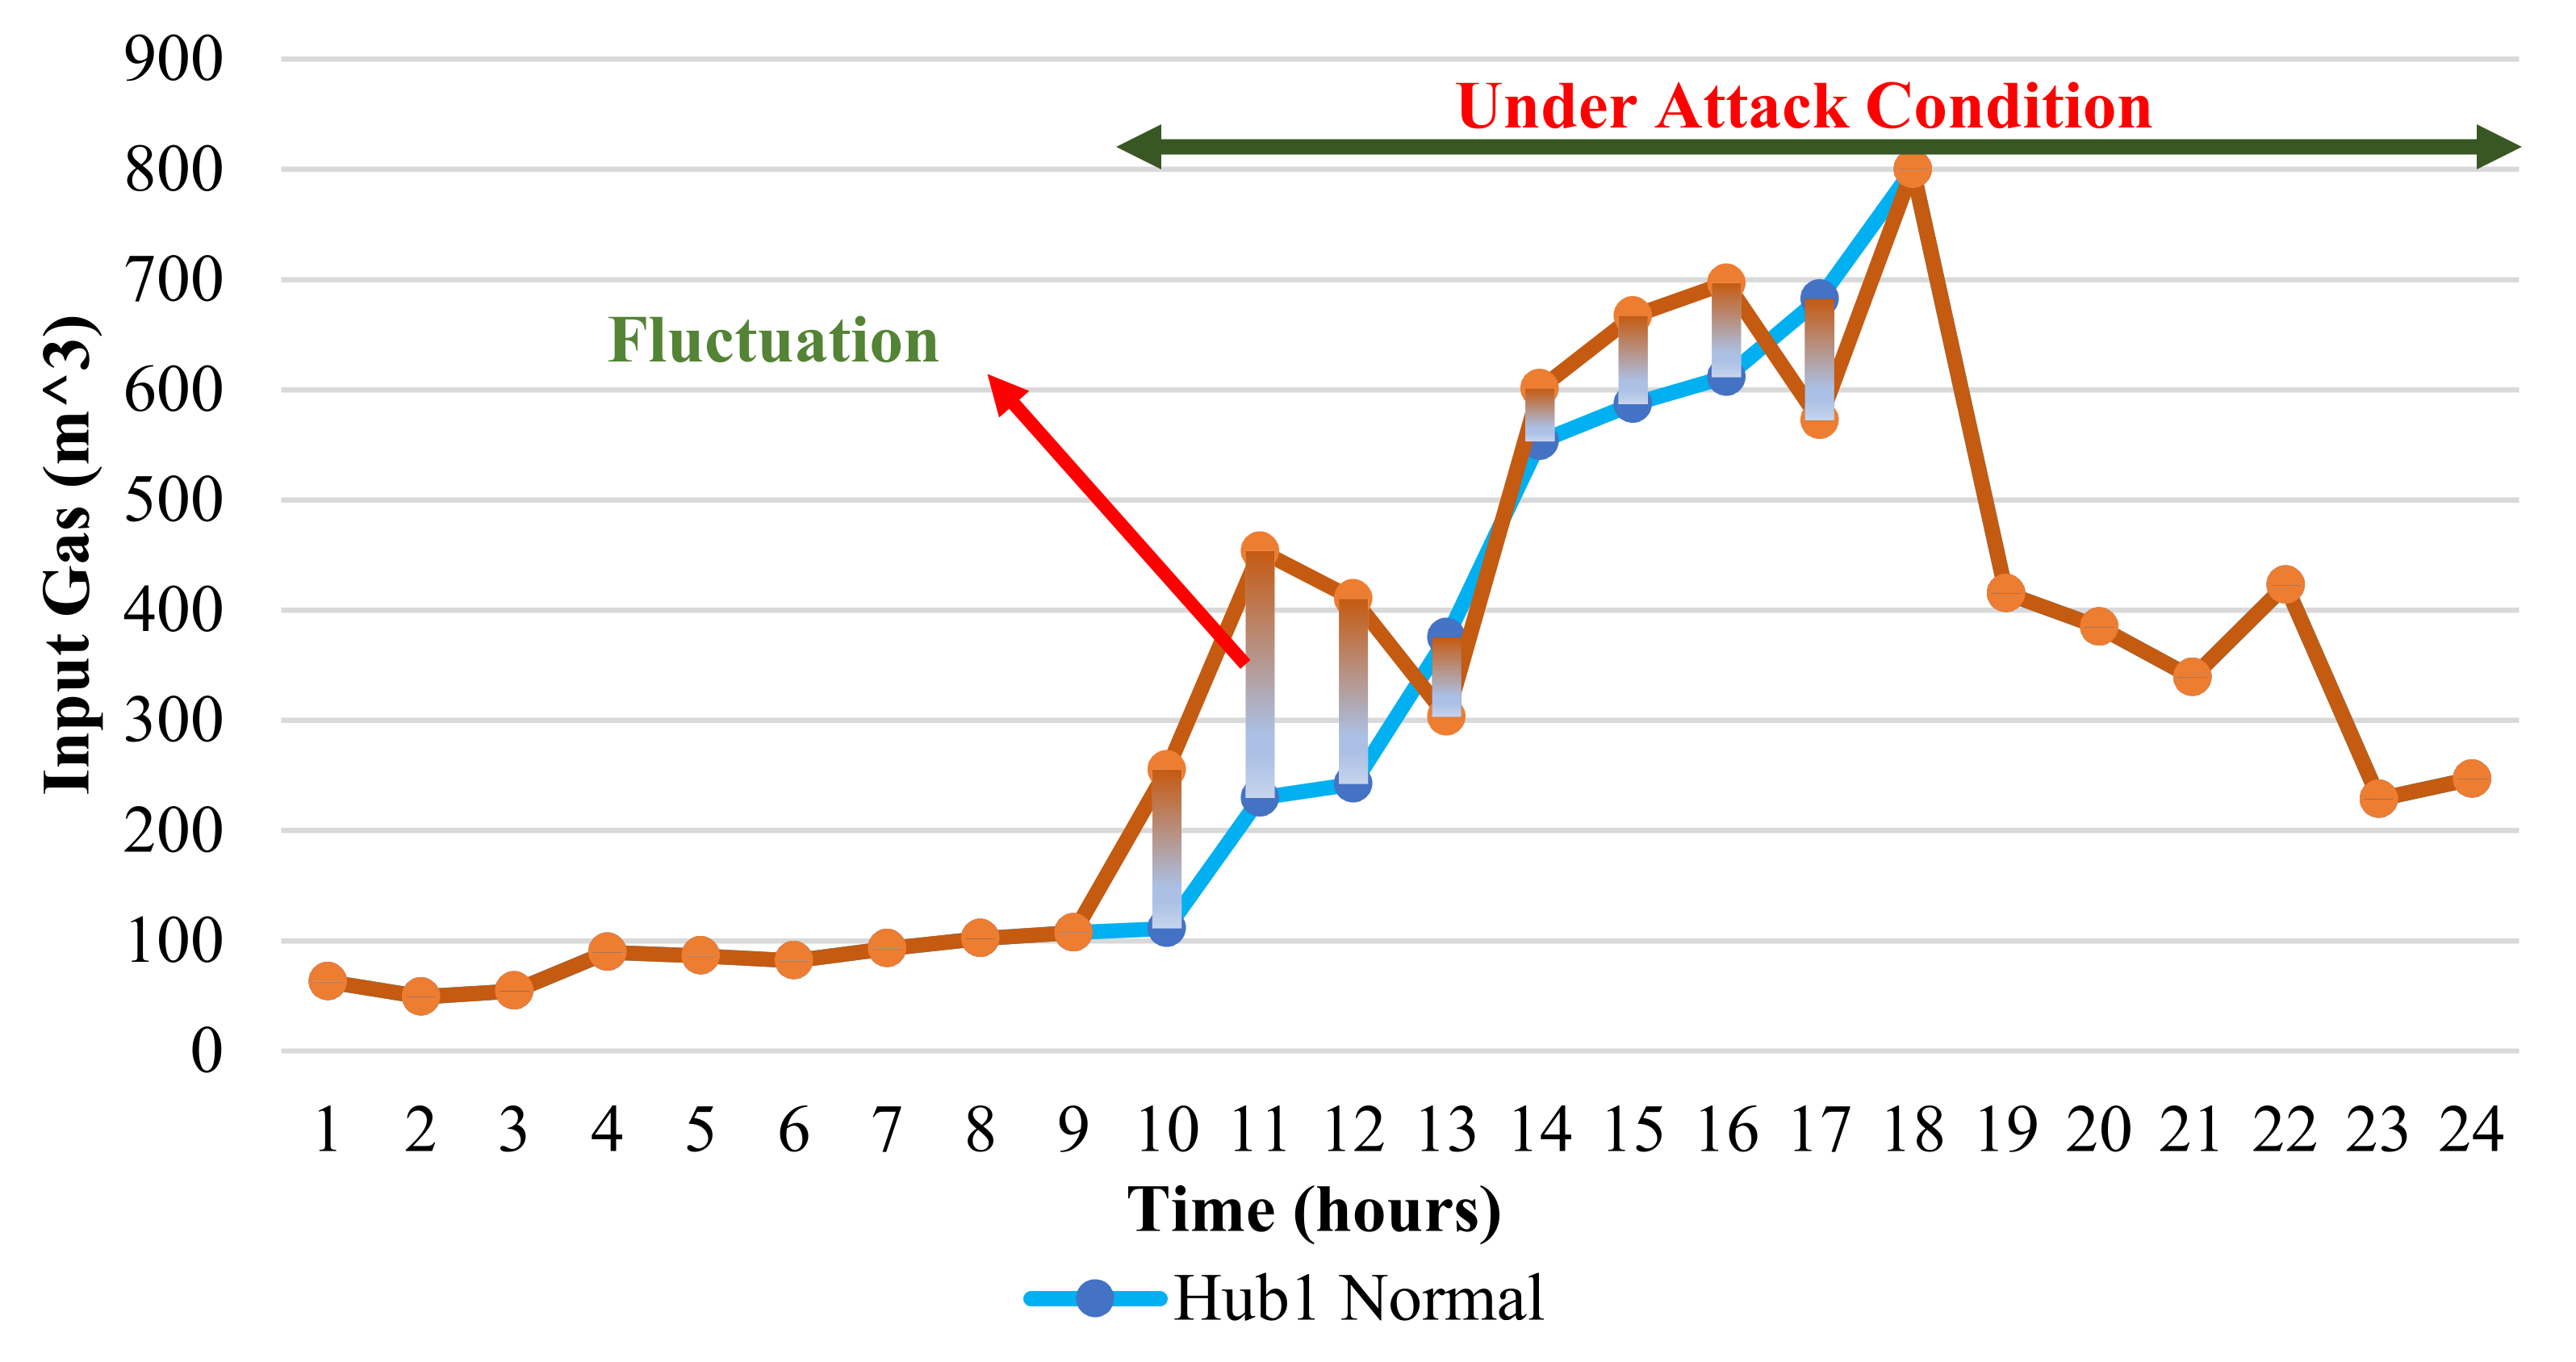
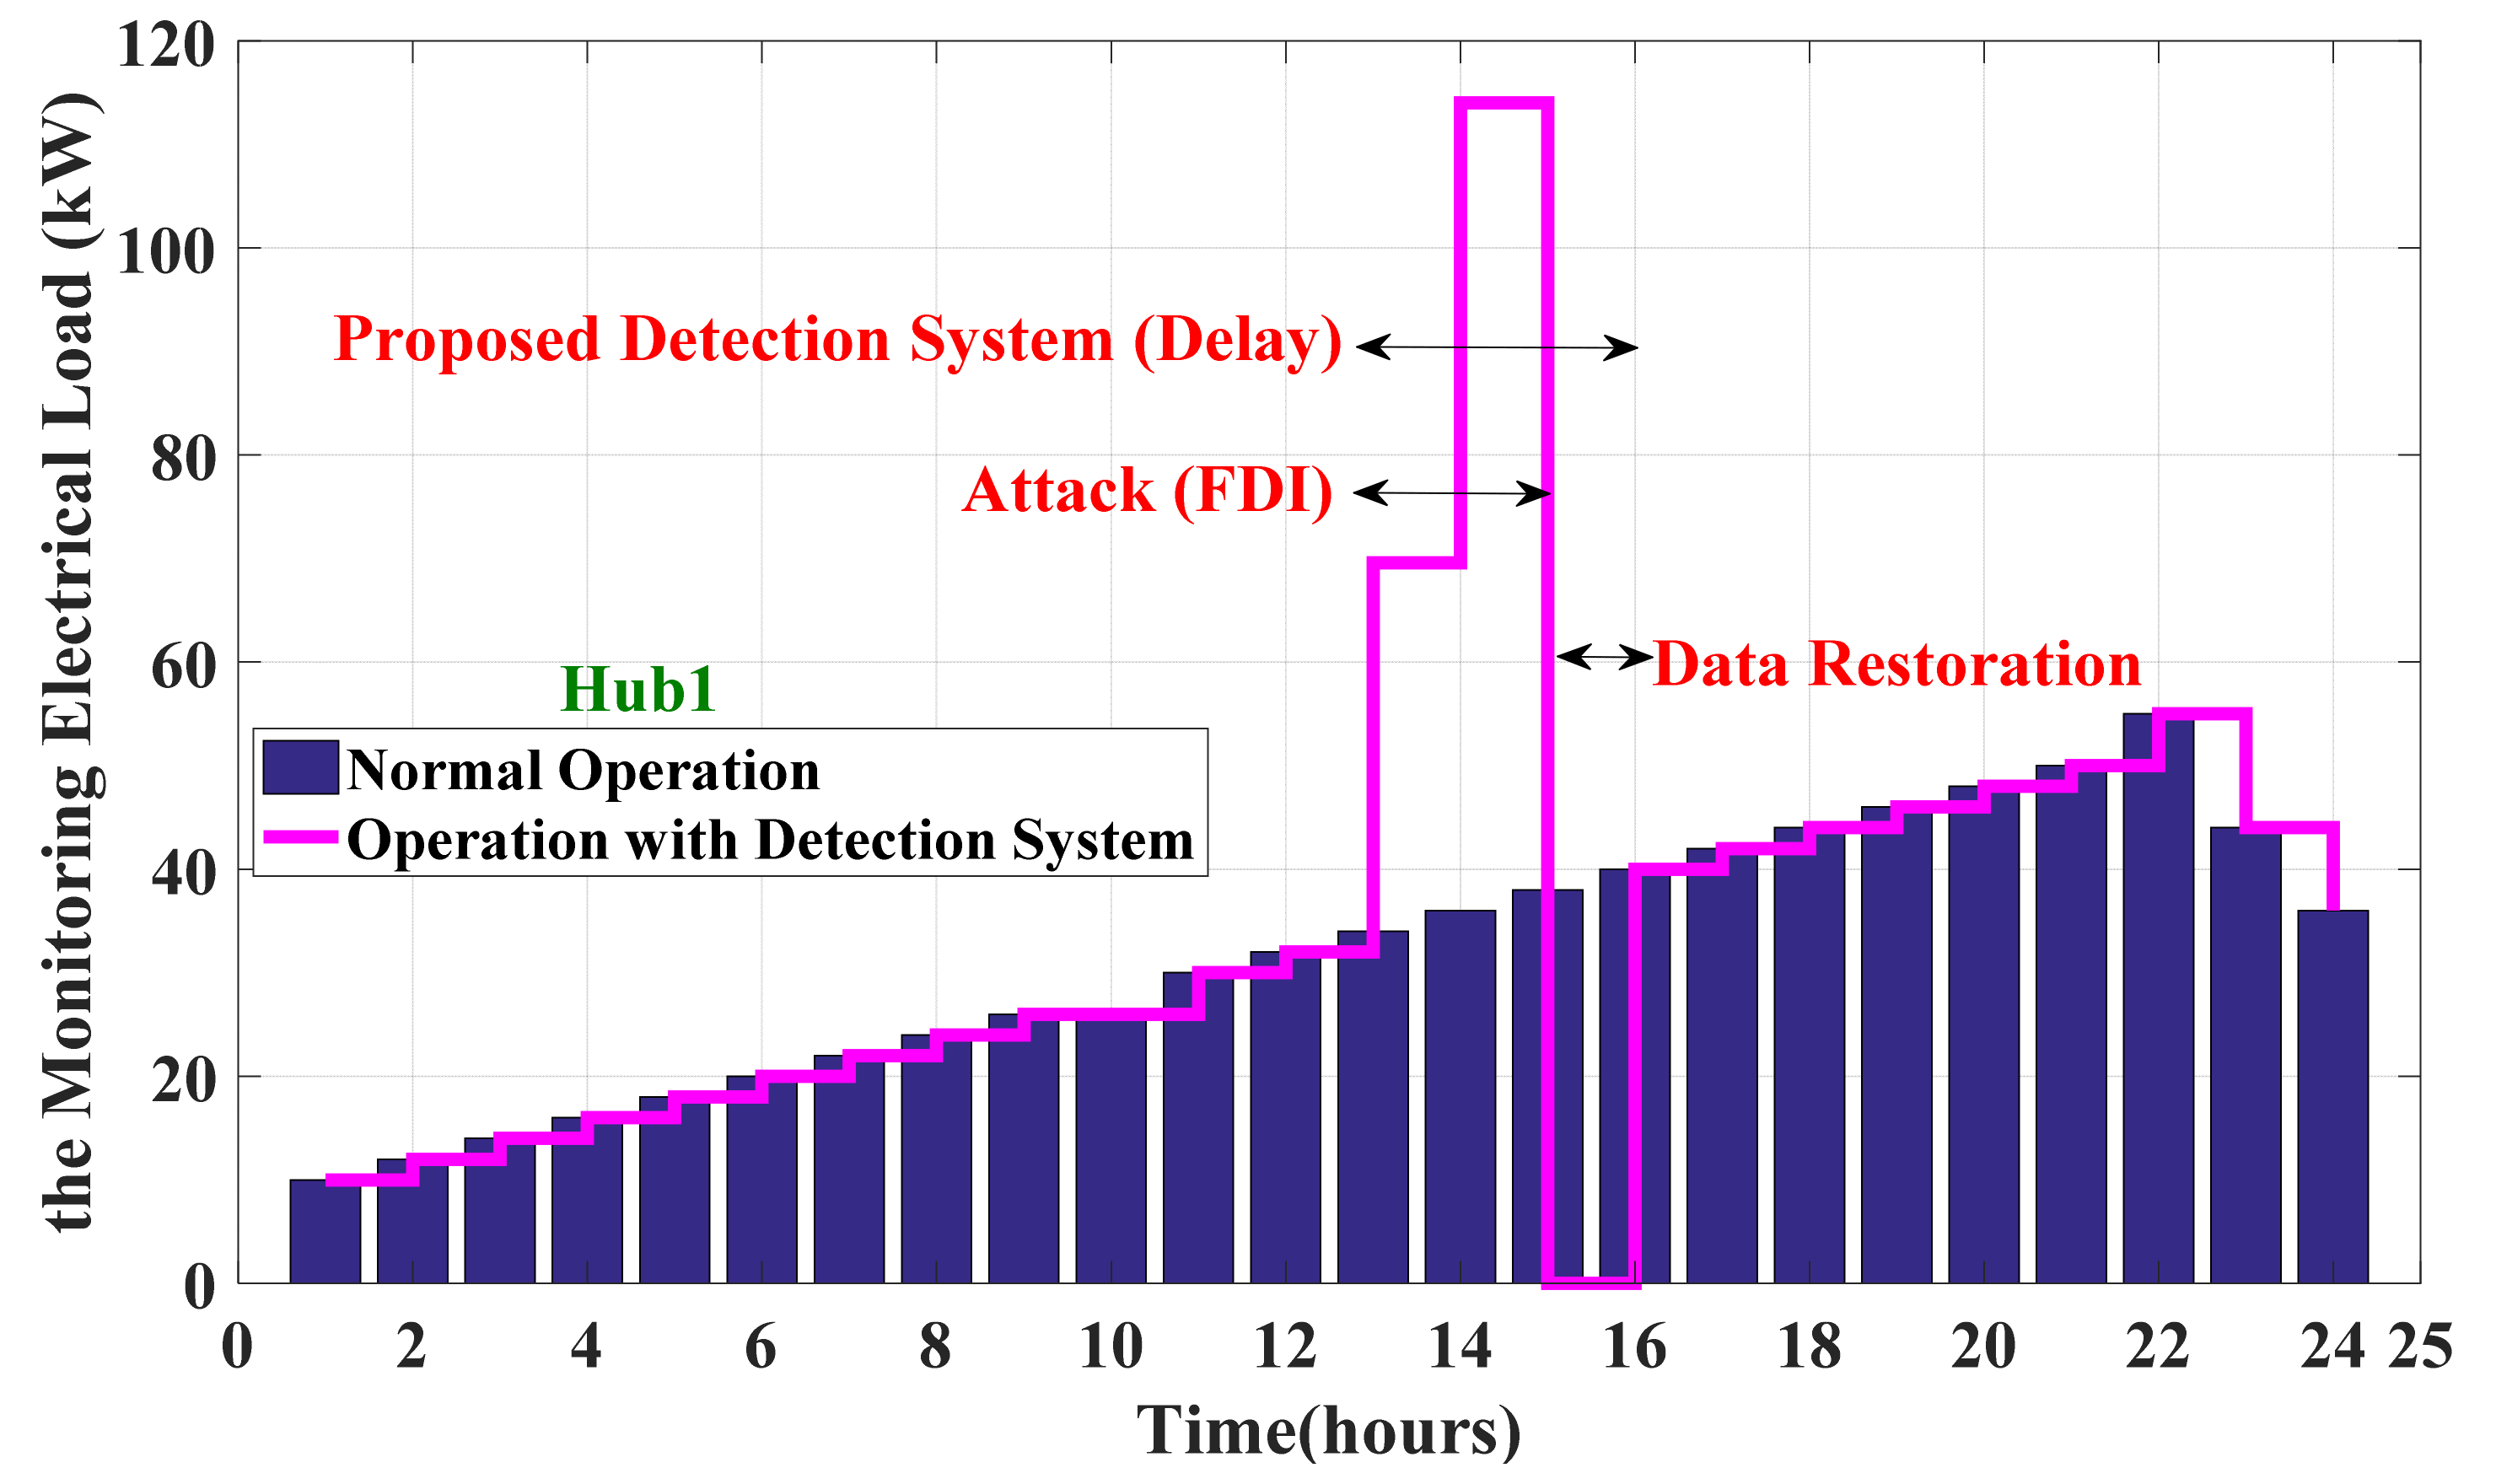
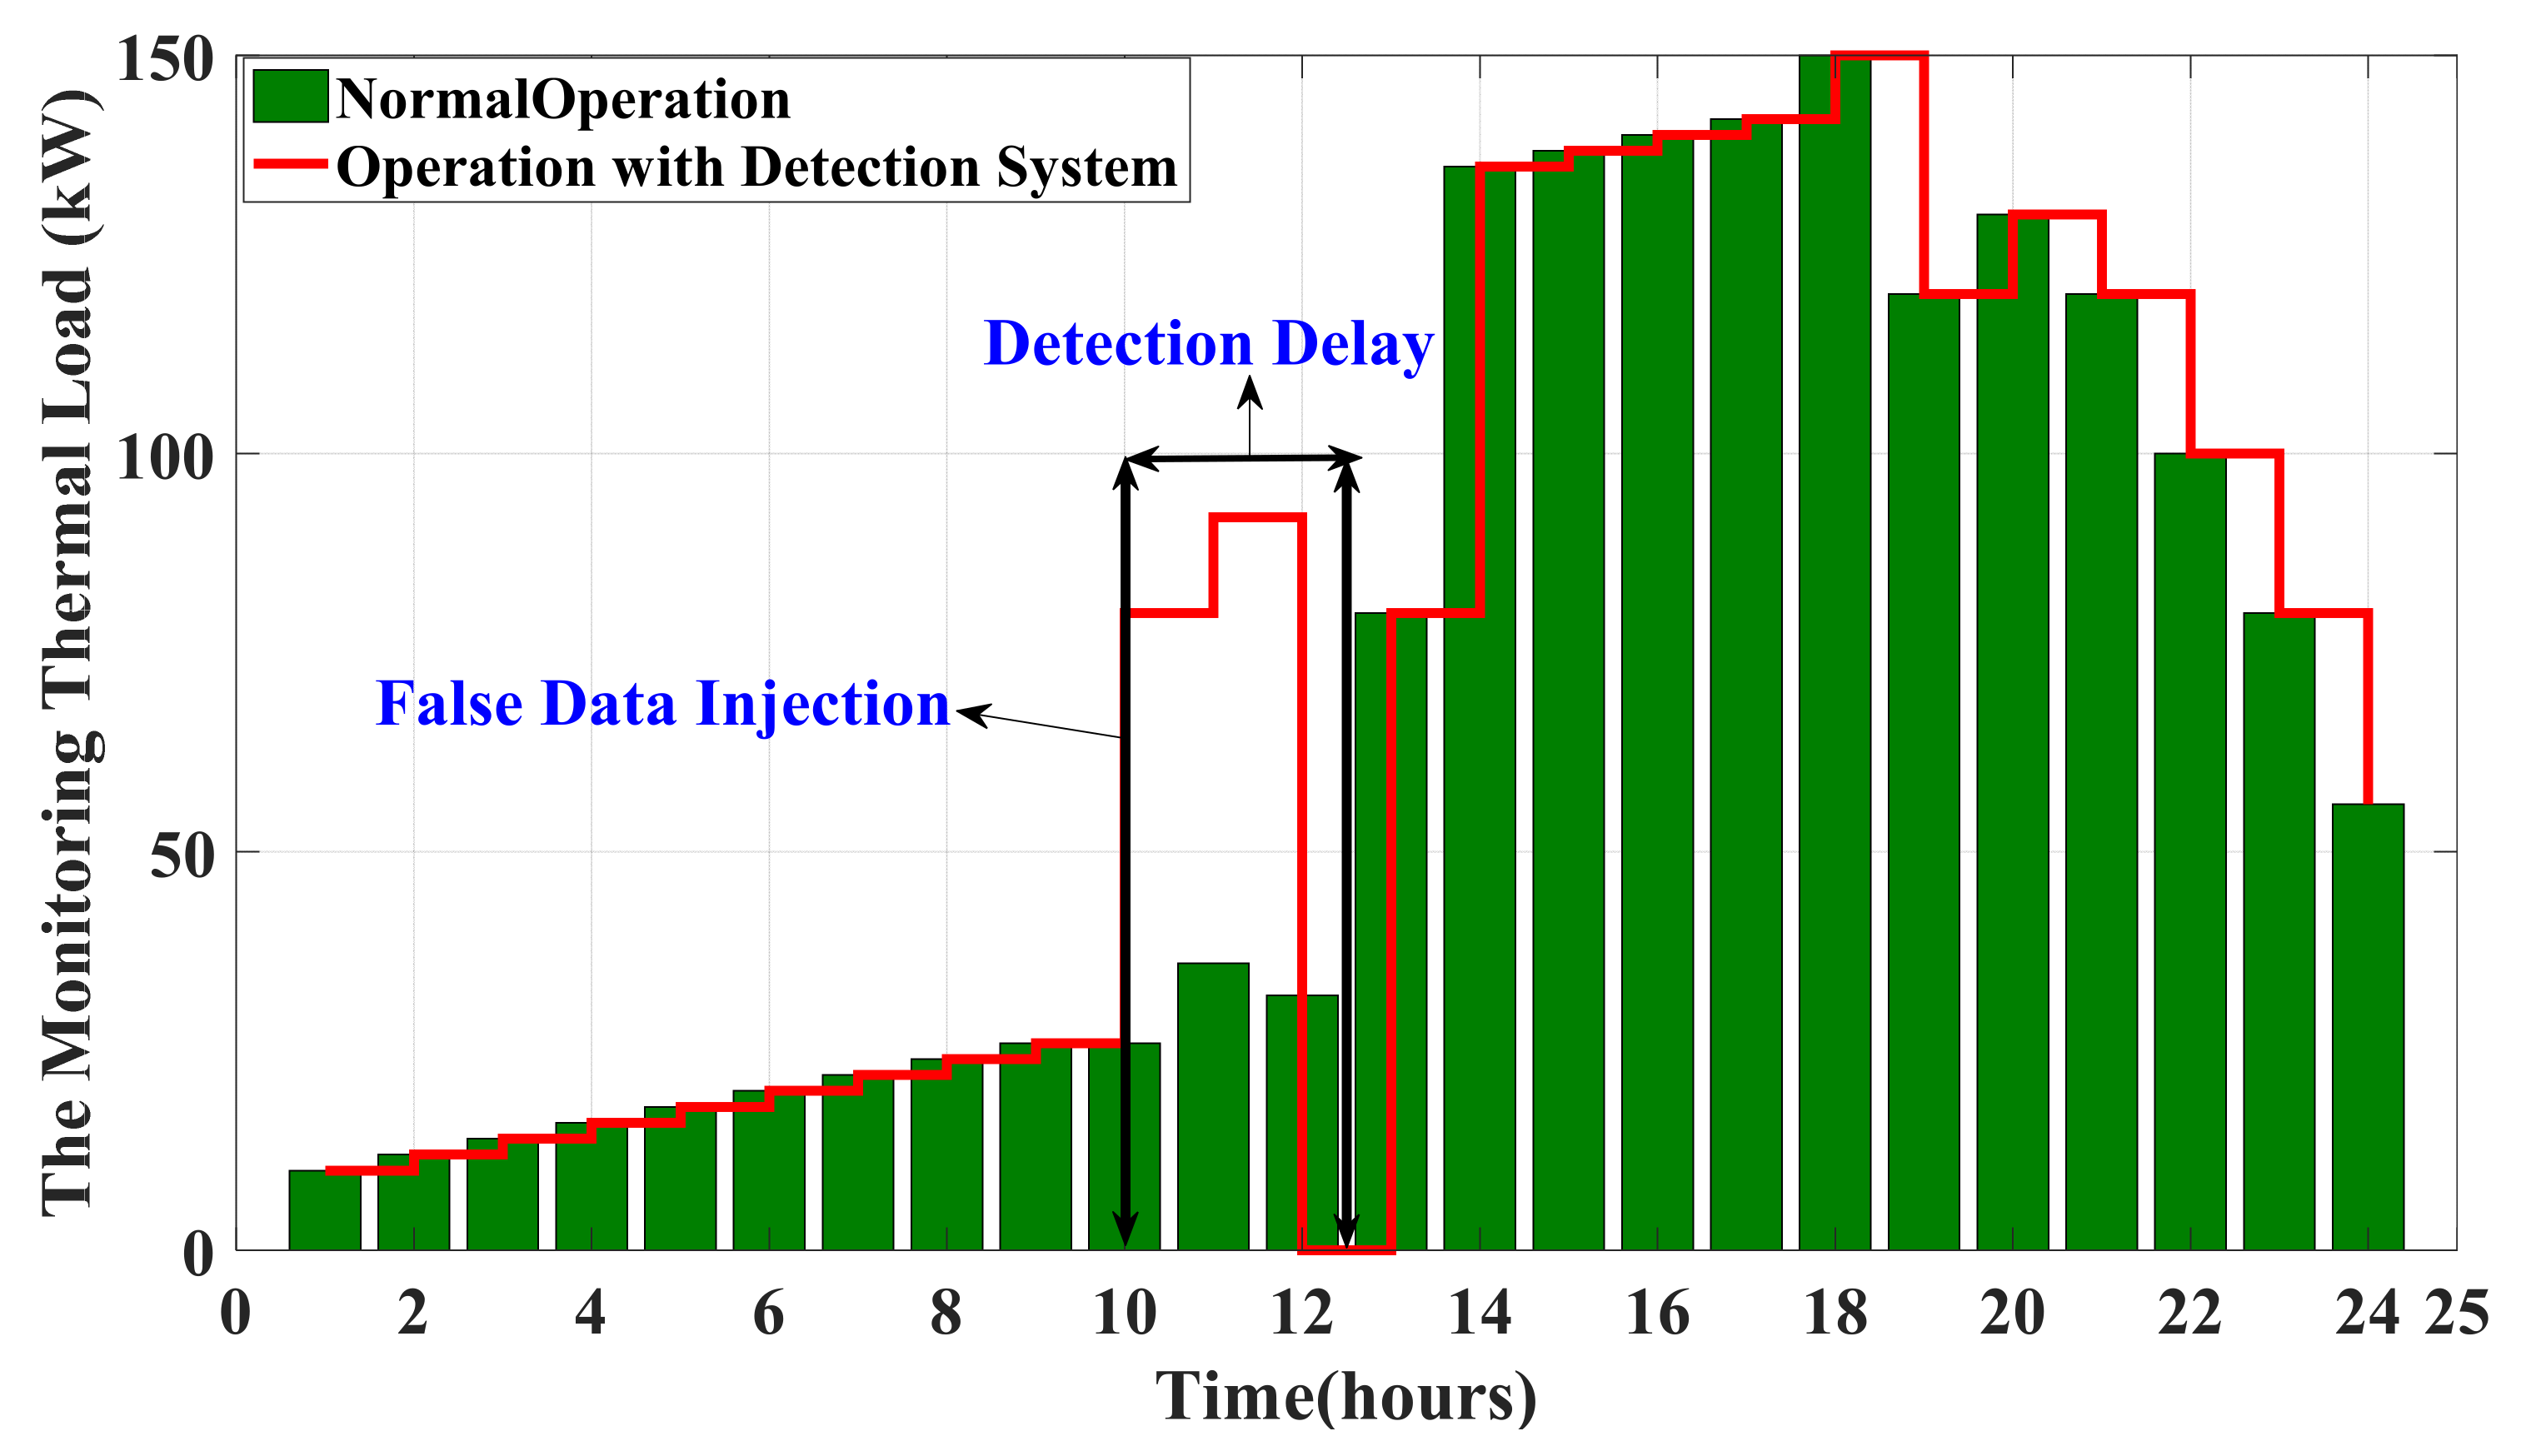
6.2. Assessing and Validating the IPS-RL Method Based Detection Scheme against Malicious Attacks

It is important to validate the new and effective attack detection method proposed in this paper against stealthy intrusion such as attacks of the FDI type. To do so, we first implemented the FDIA with the use of injecting the false data to the measurement device during t = 80 s to 100 s and t = 125 s to 147 s as shown in Figure 15. By doing so, the monitoring system depicts the false information, which leads to disrupting the system performance and analysis under attack situation compared to the normal operation of the system. To clarify the destructive effects related to FDIA, Figure 16 compares the monitoring data fluctuation related to the attack/normal conditions. Looking over previous sections, this paper proposes an appropriate IPS-RL-based detection method to counteract the stealthy intrusions in smart systems. To ensure this, we tried to first model and assess the proposed detection scheme against FDI attack and compared it to the other detection methods. Hence, the relevant results can be seen in Figure 17 and Figure 18. Looking over the results, by launching FDIA at times 80 s and 125 s, the IPS-RL method based on the learning phase (refer to previous sections) is able to discover the false data as fast as possible time with a detection delay of 2s. Then, the monitoring system is refreshed to depict the actual data followed by the attack alarm. To validate the IPS-RL method, this paper compared this scheme to the other detection approaches (i.e., reinforcement learning (RL) and the support vector machine (VSM)). To this end, it is required that the F-score is calculated for trail numbers through the assessment of the precision versus and recall curves obtained in Equations (58)–(60).
R e c a l l = T r u e   P o s i t i v e T r u e   P o s i t i v e + F a l s e   n e g a t i v e
P r e c i s i o n = T r u e   P o s i t i v e T r u e   P o s i t i v e + F a l s e   p a s i t i v e
F s c o r e = 2 P r e c i s i o n R e c a l l P r e c i s i o n + R e c a l l
Hence, we obtained the F-score value regarding 10,000 and 5000 trials for three methods as shown in Figure 17. Looking over the result, the IPS-RL model is more sensitive in distinguishing the attack than the other models.
In addition, there is another consequence to further realize and validate the security scheme’s effectiveness compared to the other methods against the falsified data concerning the attack probability. To this end, we try to use the probability computing approach to reveal the probability of successful attacks. As expressed already, in this paper, we focus on an attack of FDI type in order to calculate probability and assess the functionality of the proposed method. It is significant to say that such attacks do not interrupt the network but that they will lead to some misunderstanding. Hence, the attacker tries to make a penetration in the network for creating an FDI attack. This work can be carried out everywhere in the network. When making a cyber-penetration within the network, it is necessary to compute the probability of an attack launched by hackers. Hence, the successful probability of attacks for carrying out destruction can be achieved in the following:
λ = h ( X d + c ) h ( X d )
P a = 1 3 k = 1 n k
where, 0 ≤ _k ≤ 1, k = 1, 2, , n,…, N.
In the above equation, λ is the attack vector, c is a factor that defines the alternation of data due to the attack, and Xd defines the data of the system. As h shows the function of the measurement device based on the relevant data can be different for each device. The success probability of attack ( P a ) can be computed by Equation (62) in which n is the number of attacks and indicates the occurring probability of attack in iteration k for the system. In addition, the attack needs to update its data to delude the system’s devices.
According to the argument aforementioned, the sabotage probability in the network is dependent on the type of cyber-security scheme considered for preventing attacks. Firstly, we implement three cases including case1 (the IPS-RL-based security scheme), case 2 (support vector machine method), and case 3 (the autoencoder method) [43]. In the first step, we as an FDI attack to apply the incorrect data to the measurement devices based on (61) in order to monitor these data for the network operator [44]. This process continues for iteration number 50 under launching three cases based on the security scheme (second step). As the last step, we compute the successful probability of attack for three schemes considering Equation (45). In this regard, by launching an FDI attack in the network, the successful probabilities of this attack for three cases are calculated and represented in Figure 19. It can be seen in this figure, by increasing the percentage of iteration, that the successful probability of attack in the proposed method takes more of a downtrend than case 2 and case 3 for the various iterations. This means that the proposed security framework can be a hard barrier for hackers to have access to network data.
As mentioned before, the interconnected energy hub-based microgrid system can increase the risk of attack launching for the sake of having the correlation structure among the management of the energy carriers [45]. In this regard, this document is aimed to check and describe the energy management of the studied model based on different scenarios including the effects of the FDI to (1) water layer, (2) thermal layer, and (3) electrical layer within the interconnected energy hub-based microgrid system [46,47]. As mentioned before, trading the power between the energy hub systems and microgrid leads to optimally satisfying the electrical load demands. Hence, cyber hackers try to avoid getting into the optimal power transaction by injecting false data to the monitoring electrical load. As the electrical layer, we implemented the FDI attack on the electrical loads of the hub1 and hub 2 systems in hour 13 as indicated in Figure 19 and Figure 20. By doing so, the results related to the power transaction of energy hub systems (see Figure 21 and Figure 22) indicate that the FDIA leads to make a marked fluctuation in the exchanging procedure of power, which results in an upward trend in the transaction costs in the hours 13 to 24.
The second and third scenarios are defined to describe the effects of FDI attacks on the thermal/water layers of the studied system. In this regard, for instance, we carry out the FDI to the thermal load of the energy hub1 system and the water load of the energy hub2 system in the hours 10 to 18 with aim of monitoring the incorrect information as it can be seen in Figure 23 and Figure 24. It is axiomatic that the input gas consumed by the CHP and boiler units depends directly on the thermal demands of the system. Looking over Figure 25, it is clear that the input gas curve related to FDIA takes an upward trend compared to the normal operation condition for most of the attack launching times. For more clarification about the destructive effects of FDIA on the energy management of thermal and water carriers, Table 3 shows the comparison of costs of energy carriers and operation cost related to the microgrid. The results indicate that the FDI causes to add 0.3488 × 10⁵ to the input gas cost and makes a remarkable rise in the grid water cost. In addition, the operation cost of the microgrid pertaining to FDIA is increased nearly 6% in comparison to the normal operation condition due to the technical relationship between the electrical, water, and thermal layers of the energy hub system and the microgrid (refer to Equations (7)–(21)).
All in all, the above explanations demonstrate that launching cyber-attacks in such systems make destructive consequences from point of view of energy management. Therefore, it seems that considering the appropriate IPS-RL-based detection method in the interconnected energy hub-based microgrid system is necessary. Hence, we try to implement the proposed detection scheme on the studied model and provide the relevant results, which are depicted in Figure 26 and Figure 27. Based on the results, the IPS-RL method is capable of detecting and restoring the monitoring data related to the electrical and thermal loads, which were exposed to FDIA, as fast as possible time with a delay of 2 s. In addition, Table 4 shows that the grid water cost takes a significant decline from 2.7479 × 10⁷ to 436 owing to declaring and removing the false data by the detection system. In summary, such multi-energy carriers systems equipped with the effective/strong IPS-RL-based detection scheme can reduce the risk of attack launching for a significant range. Concerning the results related to Section 1 and Section 2, it can be deduced that some load demands in sundry forms of electrical, thermal, and water are located far from the main grid that needs to be satisfied effectively and optimally. Therefore, the proposed interconnected energy hub-based microgrid system seems to be capable of well supporting all energy carriers (such as water, electrical, and thermal carriers). This means that such framework can remarkably decline the need for the main grid in the far area. On the other hand, considering the simple security structure related to the machining learning based software compared to the detection methods such as blockchain, this model can be suitable for the wide use in detecting the false data in the far area.

6.3. Effects of Uncertainties on the Performance of the Studied System

One of the significant goals of this paper is to check the uncertain effects arising from renewable energy resources on the energy management of the proposed framework. Hence, this document investigates the performance of the interconnected smart energy hub-microgrid system under uncertainty condition and highlights the effects of that on energy management compared to the normal condition. To this end, we implement the UT model on the studied system and see the consequence related to the operating costs and the total operation cost for both the normal and uncertainty conditions as shown in Figure 28. It is clear that the stochastic effect leads to increasing the operating costs compared to condition one. Looking over Figure 29, the operation cost of microgrid has a marked increase because of the uncertainty related to the power output of the renewable energy resources and load demands. Similar to the microgrid, this trend is expanded for the operation cost of the energy hub system. It is significant to say that the uncertain condition leads to change the total cost approximately increased from 4.12 × 10⁸ to 4.56 × 10⁸ in comparison with the deterministic operation.

7. Conclusions

In the present study, the interconnected smart energy hub–based microgrid system was modeled. Initially, the formulation of each unit was extracted. Afterward, the proposed method for cyber-attack detection based on the IPS-RL approach was introduced. According to this network, the optimal algorithm was executed for energy management in which multi-energy hub systems and microgrids cooperate for supplying loads. As well as, to close the reality, the uncertainty based on the UT method was explained for simulation. The most important results have been obtained as follows: the most important result of the first scenario is the fact that the total cost when the power exchange among all units has been taken into account. It is worth mentioning that the total cost of the water network is equal to zero when the power exchange is carried out, owing to its power electric is not supplied by the electrical grid. The second scenario was addressed the impact of attack detection. From the results obtained, it can be seen that a timely detection attack is too important for system stability. The most striking result to emerge from the second scenario is that in the best situation, the operation cost severely goes up in the absence of a detection attack. The second issue that must be considered in the future is the uncertainty regarding energy transactions that might temp the authorized members to fool the system, do more transactions or inject false data through data loggers that may lead the system to mix these data up with the actual uncertainty associated with the renewable energy sources of the system and causes serious problems specifically during critical situations. Hence, recognition of the proposed abuse must also investigate in the future to be added to the security platform to make this technology more implementable and compatible with the features of energy management. Finally, in the third scenario, the performance accuracy of the proposed method was evaluated in presence of uncertainty.

Author Contributions

Conceptualization, K.A., A.A., U.D. and M.A.M.; methodology, M.A.M.; software, M.A.M.; validation, K.A. and M.A.M.; formal analysis, M.A.M.; investigation, K.A., A.A., U.D., M.A.M.; resources, M.A.M.; writing—original draft preparation, M.A.M.; writing—review and editing, K.A., A.A., U.D., M.A.M.; visualization, A.A., U.D., M.A.M.; supervision, M.A.M.; project administration, M.A.M.; funding acquisition, K.A. and A.A. All authors have read and agreed to the published version of the manuscript.

Funding

The authors extend their appreciation to King Saud University for funding this work through Researchers Supporting Project number (RSP-2021/305), King Saud University, Riyadh, Saudi Arabia.

Institutional Review Board Statement

Not applicable.

Informed Consent Statement

Not applicable.

Data Availability Statement

The data supporting reported results are available in the manuscript.

Acknowledgments

The authors extend their appreciation to King Saud University for funding this work through Researchers Supporting Project number (RSP-2021/305), King Saud University, Riyadh, Saudi Arabia. Furthermore, the authors would like to thank the Estonian Centre of Excellence in Zero Energy and Resource Efficient Smart Buildings and Districts, ZEBE, grant TK146, funded by the European Regional Development Fund to support this research.

Conflicts of Interest

The authors declare no conflict of interest.

Nomenclature

Ω r / r Set/Indices of bats, Ω r = {1,…, r}.
Ω t / t Set/Indices of time, Ω t = {1,…, 24}.
Ω i / i Set/Indices of units, Ω i = {1,…, i}.
η e T , η c h p G E , η b o i G E , η c h p G H , η b o i G H , η e Efficiencies of electrical transformer, gas-electricity conversion of CHP, gas-electricity conversion of the boiler, gas to heat conversion of CHP, gas-heat conversion of boiler, battery energy exchange, respectively.
P ¯   t   H U B M C     , P _   t H U B M C   The max/min of multi-EH power transaction, respectively.
E ¯   b a t , E ¯   b a t The max/min of energy level of the battery, respectively.
P ¯       b a t , P _         b a t The max/min of power exchange of the battery, respectively.
P   t   E l o a d   , P   t h e a t l o a d Electrical demand of the multi-EH system, thermal demand of the multi-EH, respectively.
W ¯ D , W _ D The max/min of input water of the desalination unit, respectively.
C T r , C C H P , C B o i Nominal capacities of the transformer, CHP, and boiler units, respectively.
D , G , P l o s s Direct normal irradiation, solar radiation, and power loss of PV, respectively.
ρ , A , S W i , t Wind density, area of rotor blades, and wind speed, respectively.
H p c , ρ s , A t i d a l The power capture coefficient, seawater density and swept area of the turbine blades, respectively.
E l o s s The loss efficiency of energy storage system.
C F D e s The energy coefficient of desalination system (KW/Lit).
α Random value between [0, 1].
κ t The attack time
D b a d , t False data
C M C , R H U B M C , R t P V , R t W T , R t t i d a l Operation costs of the networked microgrid system, PVs, WTs, tidal units, and cost of power transaction from multi-EH system to the networked microgrid, respectively.
c o s t H U B , R C H P , R b o i , R b a t , R w a t e r , R H Multi-EH system, CHP, boiler, energy storage system, water supply system, power transaction from networked microgrid to the multi-EH system, respectively.
P i , t P V , P i , t W T , P i , t t i d a l , P t H U B M C , P i j , t , P i , t l Power generation of PVs, WTs, tidal units, power transaction to/from multi-EH system to/from networked microgrid, power injection through the lines, and electrical demands of the networked microgrid, respectively.
P t C , P t b o i , P t b a t , P t D e , P   t G a s CHP input gas power, boiler input gas power, power exchange of the energy storage system, the power consumption of desalination unit and gas demand of the multi-EH, respectively.
V t T , W t D , W t G , W t l o a d , V t T , W t D , I t D Secondary tank water volume, desalination unit output water, consumed water from the grid, secondary tank output water, desalination unit water volume, desalination unit input water, binary variable, respectively.
E   t   b a t The Energy level of the battery.
u t Reward binary variable.
r t Receiving reward at t
φ t Estimation of likelihood
E i , t P V Energy of PV
V i , t Tidal current speed

References

  1. Mohamed, M.A.; Jin, T.; Su, W. Multi-agent energy management of smart islands using primal-dual method of multipliers. Energy 2020, 208, 118306. [Google Scholar] [CrossRef]
  2. Lan, T.; Liu, X.; Wang, S.; Jermsittiparsert, K.; Alrashood, S.T.; Rezaei, M.; Al-Ghussain, L.; Mohamed, M.A. An advanced machine learning based energy management of renewable microgrids considering hybrid electric vehicles’ charging demand. Energies 2021, 14, 569. [Google Scholar] [CrossRef]
  3. Al-Ghussain, L.; Ahmad, A.D.; Abubaker, A.M.; Mohamed, M.A. An integrated photovoltaic/wind/biomass and hybrid energy storage systems towards 100% renewable energy microgrids in university campuses. Sustain. Energy Technol. Assess. 2021, 46, 101273. [Google Scholar]
  4. Xia, T.; Rezaei, M.; Dampage, U.; Alharbi, S.A.; Nasif, O.; Borowski, P.F.; Mohamed, M.A. Techno-Economic Assessment of a Grid-Independent Hybrid Power Plant for Co-Supplying a Remote Micro-Community with Electricity and Hydrogen. Processes 2021, 9, 1375. [Google Scholar] [CrossRef]
  5. Al-Ghussain, L.; Ahmad, A.D.; Abubaker, A.M.; Abujubbeh, M.; Almalaq, A.; Mohamed, M.A. A Demand-Supply Matching-Based Approach for Mapping Renewable Resources Towards 100% Renewable Grids in 2050. IEEE Access 2021, 9, 58634–58651. [Google Scholar] [CrossRef]
  6. Mohamed, M.A.; Almalaq, A.; Abdullah, H.M.; Alnowibet, K.A.; Alrasheedi, A.F.; Zaindin, M.S.A. A Distributed Stochastic Energy Management Framework Based-Fuzzy-PDMM for Smart Grids Considering Wind Park and Energy Storage Systems. IEEE Access 2021, 9, 46674–46685. [Google Scholar] [CrossRef]
  7. Mostafa, M.H.; Ali, S.G.; Ćalasan, M.; Abdelaziz, A.Y.; Aleem, S.H.A. Scenario-Based Approach for Efficient Energy Management in Microgrids Considering Parameters Uncertainty. In Proceedings of the 25th International Conference on Information Technology IT, Zabljak, Montenegro, 16–20 February 2021; pp. 1–7. [Google Scholar]
  8. Tan, H.; Ren, Z.; Yan, W.; Wang, Q.; Mohamed, M.A. Wind Power Accommodation Capability Assessment Method for Multi-Energy Microgrids. IEEE Trans. Sustain. Energy 2021, 12, 2482–2492. [Google Scholar] [CrossRef]
  9. Yin, F.; Hajjiah, A.; Jermsittiparsert, K.; Al-Sumaiti, A.S.; Elsayed, S.K.; Ghoneim, S.S.M.; Mohamed, M.A. A secured social-economic framework based on PEM-blockchain for optimal scheduling of reconfigurable interconnected microgrids. IEEE Access 2021, 9, 40797–40810. [Google Scholar] [CrossRef]
  10. Wang, P.; Wang, D.; Zhu, C.; Yang, Y.; Abdullah, H.M.; Mohamed, M.A. Stochastic management of hybrid AC/DC microgrids considering electric vehicles charging demands. Energy Rep. 2020, 6, 1338–1352. [Google Scholar] [CrossRef]
  11. Javanmard, B.; Tabrizian, M.; Ansarian, M.; Ahmarinejad, A. Energy management of multi-microgrids based on game theory approach in the presence of demand response programs, energy storage systems and renewable energy resources. J. Energy Storage 2021, 42, 102971. [Google Scholar] [CrossRef]
  12. Divshali, P.H.; Choi, B.J.; Liang, H. Multi-agent transactive energy management system considering high levels of renewable energy source and electric vehicles. IET Gener. Transmiss. Distrib. 2017, 11, 3713–3721. [Google Scholar] [CrossRef] [Green Version]
  13. İnci, M.; Büyük, M.; Demir, M.H.; İlbey, G. A review and research on fuel cell electric vehicles: Topologies, power electronic converters, energy management methods, technical challenges, marketing and future aspects. Renew. Sustain. Energy Rev. 2021, 137, 110648. [Google Scholar] [CrossRef]
  14. Espín-Sarzosa, D.; Palma-Behnke, R.; Núñez-Mata, O. Energy management systems for microgrids: Main existing trends in centralized control architectures. Energies 2020, 13, 547. [Google Scholar] [CrossRef] [Green Version]
  15. Zhou, B.; Zou, J.; Chung, C.Y.; Wang, H.; Liu, N.; Voropai, N.; Xu, D. Multi-microgrid Energy Management Systems: Architecture, Communication, and Scheduling Strategies. J. Mod. Power Syst. Clean Energy 2021, 9, 463–476. [Google Scholar] [CrossRef]
  16. Rocha, H.R.; Honorato, I.H.; Fiorotti, R.; Celeste, W.C.; Silvestre, L.J.; Silva, J.A. An Artificial Intelligence based scheduling algorithm for demand-side energy management in Smart Homes. Appl. Energy 2021, 282, 116145. [Google Scholar] [CrossRef]
  17. Miglani, A.; Kumar, N.; Chamola, V.; Zeadally, S. Blockchain for Internet of Energy management: Review, solutions, and challenges. Comput. Commun. 2020, 151, 395–418. [Google Scholar] [CrossRef]
  18. Ranjan, S.; Moin, S.; Vashist, P.; Uddin, A.S.M. Role of Cyber-Security in Smart Energy Management Systems. Sustain. Energy Technol. Assess. 2021, 10, 1–18. [Google Scholar]
  19. Najafi, A.; Tavakoli, A.; Pourakbari-Kasmaei, M.; Lehtonen, M. A risk-based optimal self-scheduling of smart energy hub in the day-ahead and regulation markets. J. Clean. Prod. 2021, 279, 123631. [Google Scholar] [CrossRef]
  20. Wang, F.; Xu, H.; Xu, T.; Li, K.; Shafie-Khah, M.; Catalão, J.P. The values of market-based demand response on improving power system reliability under extreme circumstances. Appl. Energy 2017, 193, 220–231. [Google Scholar] [CrossRef]
  21. Tan, H.; Yan, W.; Ren, Z.; Wang, Q.; Mohamed, M.A. A robust dispatch model for integrated electricity and heat networks considering price-based integrated demand response. Energy 2022, 239, 121875. [Google Scholar] [CrossRef]
  22. Jadidbonab, M.; Mohammadi-Ivatloo, B.; Marzband, M.; Siano, P. Short-term self-scheduling of virtual energy hub plant within thermal energy market. IEEE Trans. Ind. Electron. 2020, 68, 3124–3136. [Google Scholar] [CrossRef] [Green Version]
  23. Chassin, D.P.; Behboodi, S.; Shi, Y.; Djilali, N. H2-optimal transactive control of electric power regulation from fast-acting demand response in the presence of high renewables. Appl. Energy 2017, 205, 304–315. [Google Scholar] [CrossRef]
  24. Cesena, E.A.M.; Good, N.; Syrri, A.L.; Mancarella, P. Techno-economic and business case assessment of multi-energy microgrids with co-optimization of energy, reserve and reliability services. Appl. Energy 2018, 210, 896–913. [Google Scholar] [CrossRef]
  25. Behboodi, S.; Chassin, D.P.; Djilali, N.; Crawford, C. Transactive control of fast-acting demand response based on thermostatic loads in realtime retail electricity markets. Appl. Energy 2018, 210, 1310–1320. [Google Scholar] [CrossRef]
  26. Wu, J.; Guan, X. Coordinated multi-microgrids optimal control algorithm for smart distribution management system. IEEE Trans. Smart Grid 2013, 4, 2174–2181. [Google Scholar] [CrossRef]
  27. Zeng, C.; Jiang, Y.; Liu, Y.; Tan, Z.; He, Z.; Wu, S. Optimal Dispatch of Integrated Energy System Considering Energy Hub Technology and Multi-Agent Interest Balance. Energies 2019, 12, 3112. [Google Scholar] [CrossRef] [Green Version]
  28. Liang, G.; Weller, S.R.; Zhao, J.; Luo, F.; Dong, Z.Y. The 2015 ukraine blackout: Implications for false data injection attacks. IEEE Trans. Power Syst. 2017, 32, 3317–3318. [Google Scholar] [CrossRef]
  29. Liu, Y.; Ning, P.; Reiter, M.K. False data injection attacks against state estimation in electric power grids. ACM Trans. Inf. Syst. Secur. 2011, 14, 1–33. [Google Scholar] [CrossRef]
  30. Liu, X.; Li, Z.; Liu, X.; Li, Z. Masking transmission line outages via false data injection attacks. IEEE Trans. Inf. Forensics Secur. 2016, 11, 1592–1602. [Google Scholar] [CrossRef]
  31. Deng, R.; Xiao, G.; Lu, R.; Liang, H.; Vasilakos, A.V. False data injection on state estimation in power Systems—Attacks, impacts, and defense: A survey. IEEE Trans. Ind. Informat. 2017, 13, 411–423. [Google Scholar] [CrossRef]
  32. Rahman, M.A.; Mohsenian-Rad, H. False data injection attacks with incomplete information against smart power grids. In Proceedings of the IEEE Global Global Communications Conference (GLOBECOM), Anaheim, CA, USA, 3–7 December 2012; pp. 3153–3158. [Google Scholar]
  33. Dehghani, M.; Niknam, T.; Ghiasi, M.; Siano, P.; Alhelou, H.H.; Al-Hinai, A. Fourier Singular Values-Based False Data Injection Attack Detection in AC Smart-Grids. Appl. Sci. 2021, 11, 5706. [Google Scholar] [CrossRef]
  34. Julier, S.J. The scaled unscented transformation. In Proceedings of the of the 2002 American Control Conference (IEEE Cat. No. CH37301), Anchorage, AK, USA, 8–10 May 2002; IEEE. Volume 6. [Google Scholar]
  35. Wang, S.; Gao, W.; Meliopoulos, A.P.S. An alternative method for power system dynamic state estimation based on unscented transform. IEEE Trans. Power Syst. 2011, 27, 942–950. [Google Scholar] [CrossRef]
  36. Xiao, L.; Li, Y.; Han, G.; Liu, G.; Zhuang, W. PHY-layer spoofing detection with reinforcement learning in wireless networks. IEEE Trans. Veh. Technol. 2016, 65, 10037–10047. [Google Scholar] [CrossRef]
  37. Zou, H.; Tao, J.; Elsayed, S.K.; Elattar, E.E.; Almalaq, A.; Mohamed, M.A. Stochastic multi-carrier energy management in the smart islands using reinforcement learning and unscented transform. Int. J. Electr. Power Energy Syst. 2021, 130, 106988. [Google Scholar] [CrossRef]
  38. Mirjalili, S.; Gandomi, A.; Mirjalili, S.Z.; Saremi, S.; Faris, H.; Mirjalili, S.M. Salp Swarm Algorithm: A bio-inspired optimizer for engineering design problems. Adv. Eng. Softw. 2017, 114, 163–191. [Google Scholar] [CrossRef]
  39. Abualigah, L.; Shehab, M.; Alshinwan, M.; Alabool, H. Salp swarm algorithm: A comprehensive survey. Neural Comput. Appl. 2020, 32, 11195–11215. [Google Scholar] [CrossRef]
  40. Mohamed, M.A.; Hajjiah, A.; Khalid Alnowibet, A.; Alrasheedi, A.F.; Awwad, E.M.; Muyeen, S.M. A Secured Advanced Management Architecture in Peer-to-Peer Energy Trading for Multi-Microgrid in the Stochastic Environment. IEEE Access 2021, 9, 92083–92100. [Google Scholar] [CrossRef]
  41. Kiros, S.; Khan, B.; Padmanaban, S.; Haes Alhelou, H.; Leonowicz, Z.; Mahela, O.P.; Holm-Nielsen, J.B. Development of Stand-Alone Green Hybrid System for Rural Areas. Sustainability 2020, 12, 3808. [Google Scholar] [CrossRef]
  42. Gong, X.; Dong, F.; Mohamed, M.A.; Abdalla, O.M.; Ali, Z.M. A secured energy management architecture for smart hybrid microgrids considering PEM-fuel cell and electric vehicles. IEEE Access 2020, 8, 47807–47823. [Google Scholar] [CrossRef]
  43. Zhang, Y.; Li, X.; Gao, L.; Chen, W.; Li, P. Intelligent fault diagnosis of rotating machinery using a new ensemble deep auto-encoder method. Measurement 2020, 151, 107232. [Google Scholar] [CrossRef]
  44. Ahmed, I.; Aftab, S.; Ullah, I.; Saeed, M.A.; Husen, A. A Classification Framework to Detect DoS Attacks. Int. J. Comput. Netw. Inf. Secur. 2019, 11, 40–47. [Google Scholar]
  45. Israr, U.; Fayaz, M.; DoHyeun, K. Analytical modeling for underground risk assessment in smart cities. Appl. Sci. 2018, 8, 921. [Google Scholar]
  46. Hossain, M.A.; Chakrabortty, R.K.; Ryan, M.J.; Pota, H.R. Energy management of community energy storage in grid-connected microgrid under uncertain real-time prices. Sustain. Cities Soc. 2021, 66, 102658. [Google Scholar] [CrossRef]
  47. Masrur, H.; Sharifi, A.; Islam, M.R.; Hossain, M.A.; Senjyu, T. Optimal and economic operation of microgrids to leverage resilience benefits during grid outages. Int. J. Electr. Power Energy Syst. 2021, 132, 107137. [Google Scholar] [CrossRef]
Figure 1. Illustrative representation of the proposed system.
Sustainability 13 11836 g001
Figure 2. The reinforcement learning approach.
Sustainability 13 11836 g002
Figure 3. The attack detection scheme.
Sustainability 13 11836 g003
Figure 4. The framework of the IPS algorithm.
Sustainability 13 11836 g004
Figure 5. Single line schematic of IEEE 24-bus grid.
Sustainability 13 11836 g005
Figure 6. The output power of the desalination unit.
Sustainability 13 11836 g006
Figure 7. The power output of CHP and boiler units in the hub1 system.
Sustainability 13 11836 g007
Figure 8. The power output of CHP and boiler units in the hub 2 system.
Sustainability 13 11836 g008
Figure 9. The power output of PV units.
Sustainability 13 11836 g009
Figure 10. The power output of WT units.
Sustainability 13 11836 g010
Figure 11. The power output of tidal units.
Sustainability 13 11836 g011
Figure 12. Power exchanging between the energy hub1 system and microgrid.
Sustainability 13 11836 g012
Figure 13. Power exchanging between the energy hub2 system and microgrid.
Sustainability 13 11836 g013
Figure 14. Comparison of the costs of energy carriers under different conditions.
Sustainability 13 11836 g014
Figure 15. Illustration of the FDI.
Sustainability 13 11836 g015
Figure 16. Comparison of the monitoring data fluctuation.
Sustainability 13 11836 g016
Figure 17. Illustration of the monitoring data under attack condition considering IPR-RL method.
Sustainability 13 11836 g017
Figure 18. Comparison of the F-score value for different detection approaches.
Sustainability 13 11836 g018
Figure 19. Assessing the successful probability of attack for different cases.
Sustainability 13 11836 g019
Figure 20. Illustration of the electrical load of energy hub1 system.
Sustainability 13 11836 g020
Figure 21. Illustration of the electrical load of energy hub2 system.
Sustainability 13 11836 g021
Figure 22. Comparison of the power transaction of the energy hub1 system under normal/attack conditions.
Sustainability 13 11836 g022
Figure 23. Comparison of the power transaction of the energy hub2 system under normal/attack conditions.
Sustainability 13 11836 g023
Figure 24. The thermal load of energy hub1 system.
Sustainability 13 11836 g024
Figure 25. The water load of energy hub2 system.
Sustainability 13 11836 g025
Figure 26. The input gas related to the energy hub1 system.
Sustainability 13 11836 g026
Figure 27. Analysis of the proposed detection system.
Sustainability 13 11836 g027
Figure 28. Illustration of the compromised thermal load considering the detection system.
Sustainability 13 11836 g028
Figure 29. The operation cost of each microgrid for both deterministic and stochastic conditions.
Sustainability 13 11836 g029
Table 1. Categorization of the different approaches.
Reinforcement LearningHub EnergyMicrogridUncertaintyAttack Detection
[19]
[29,32]
[35]
[36]
[37]
Proposed Model
Table 2. The bus and demand parameters.
Bus NumberVminVmaxPd (MW)Qd (MVAR)
10.951.0510822
20.951.059720
30.951.0518037
40.951.057415
50.951.057114
60.951.0513628
70.951.0512525
80.951.0517135
90.951.0517536
100.951.0519540
110.951.0500
120.951.0500
130.951.0526554
140.951.0519439
150.951.0531764
160.951.0510020
170.951.0500
180.951.0533368
190.951.0518137
200.951.0512826
210.951.0500
220.951.0500
230.951.0500
240.951.0500
Table 3. Comparison of costs of energy carriers.
Operation ConditionsInput Gas
Cost
Grid Water
Cost
Microgrid
Cost
Normal1.3307^10503.7196^108
Attack (water & thermal)1.6795^1052.7479^1073.937^108
Table 4. Comparison of the grid water cos under different conditions.
Operation ConditionsAttack without IPS-RLAttack with IPS-RL
Grid Water Cost2.7479^107436
Publisher’s Note: MDPI stays neutral with regard to jurisdictional claims in published maps and institutional affiliations.

