
Effect of Different HVAC Control Strategies on Thermal Comfort and Adaptive Behavior in High-Rise Apartments


Abstract
:1. Introduction
2. Methods
3. Experiments
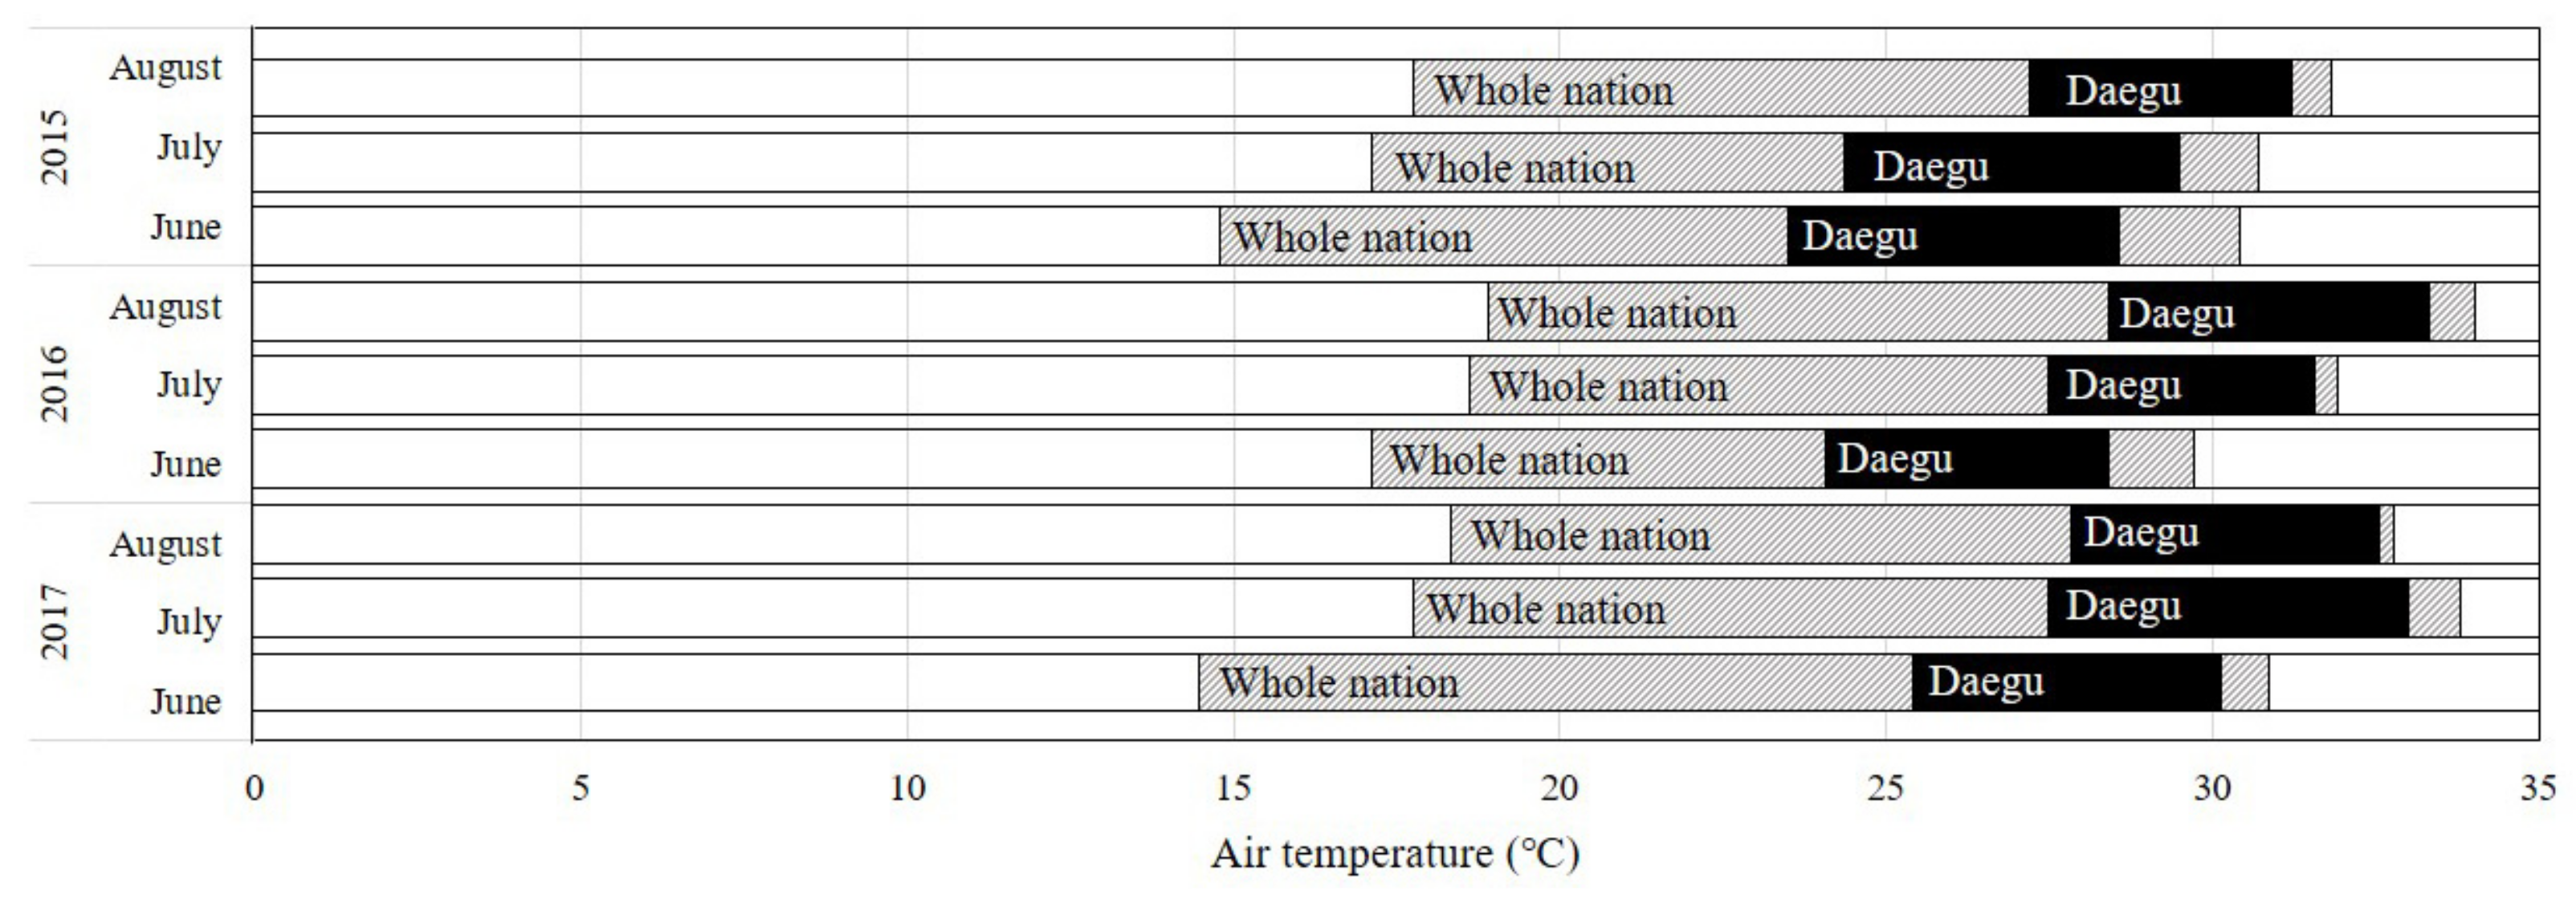
3.1. Field Survey
3.2. Indoor Environmental Variables
3.3. Subjects and Survey Questionnaire
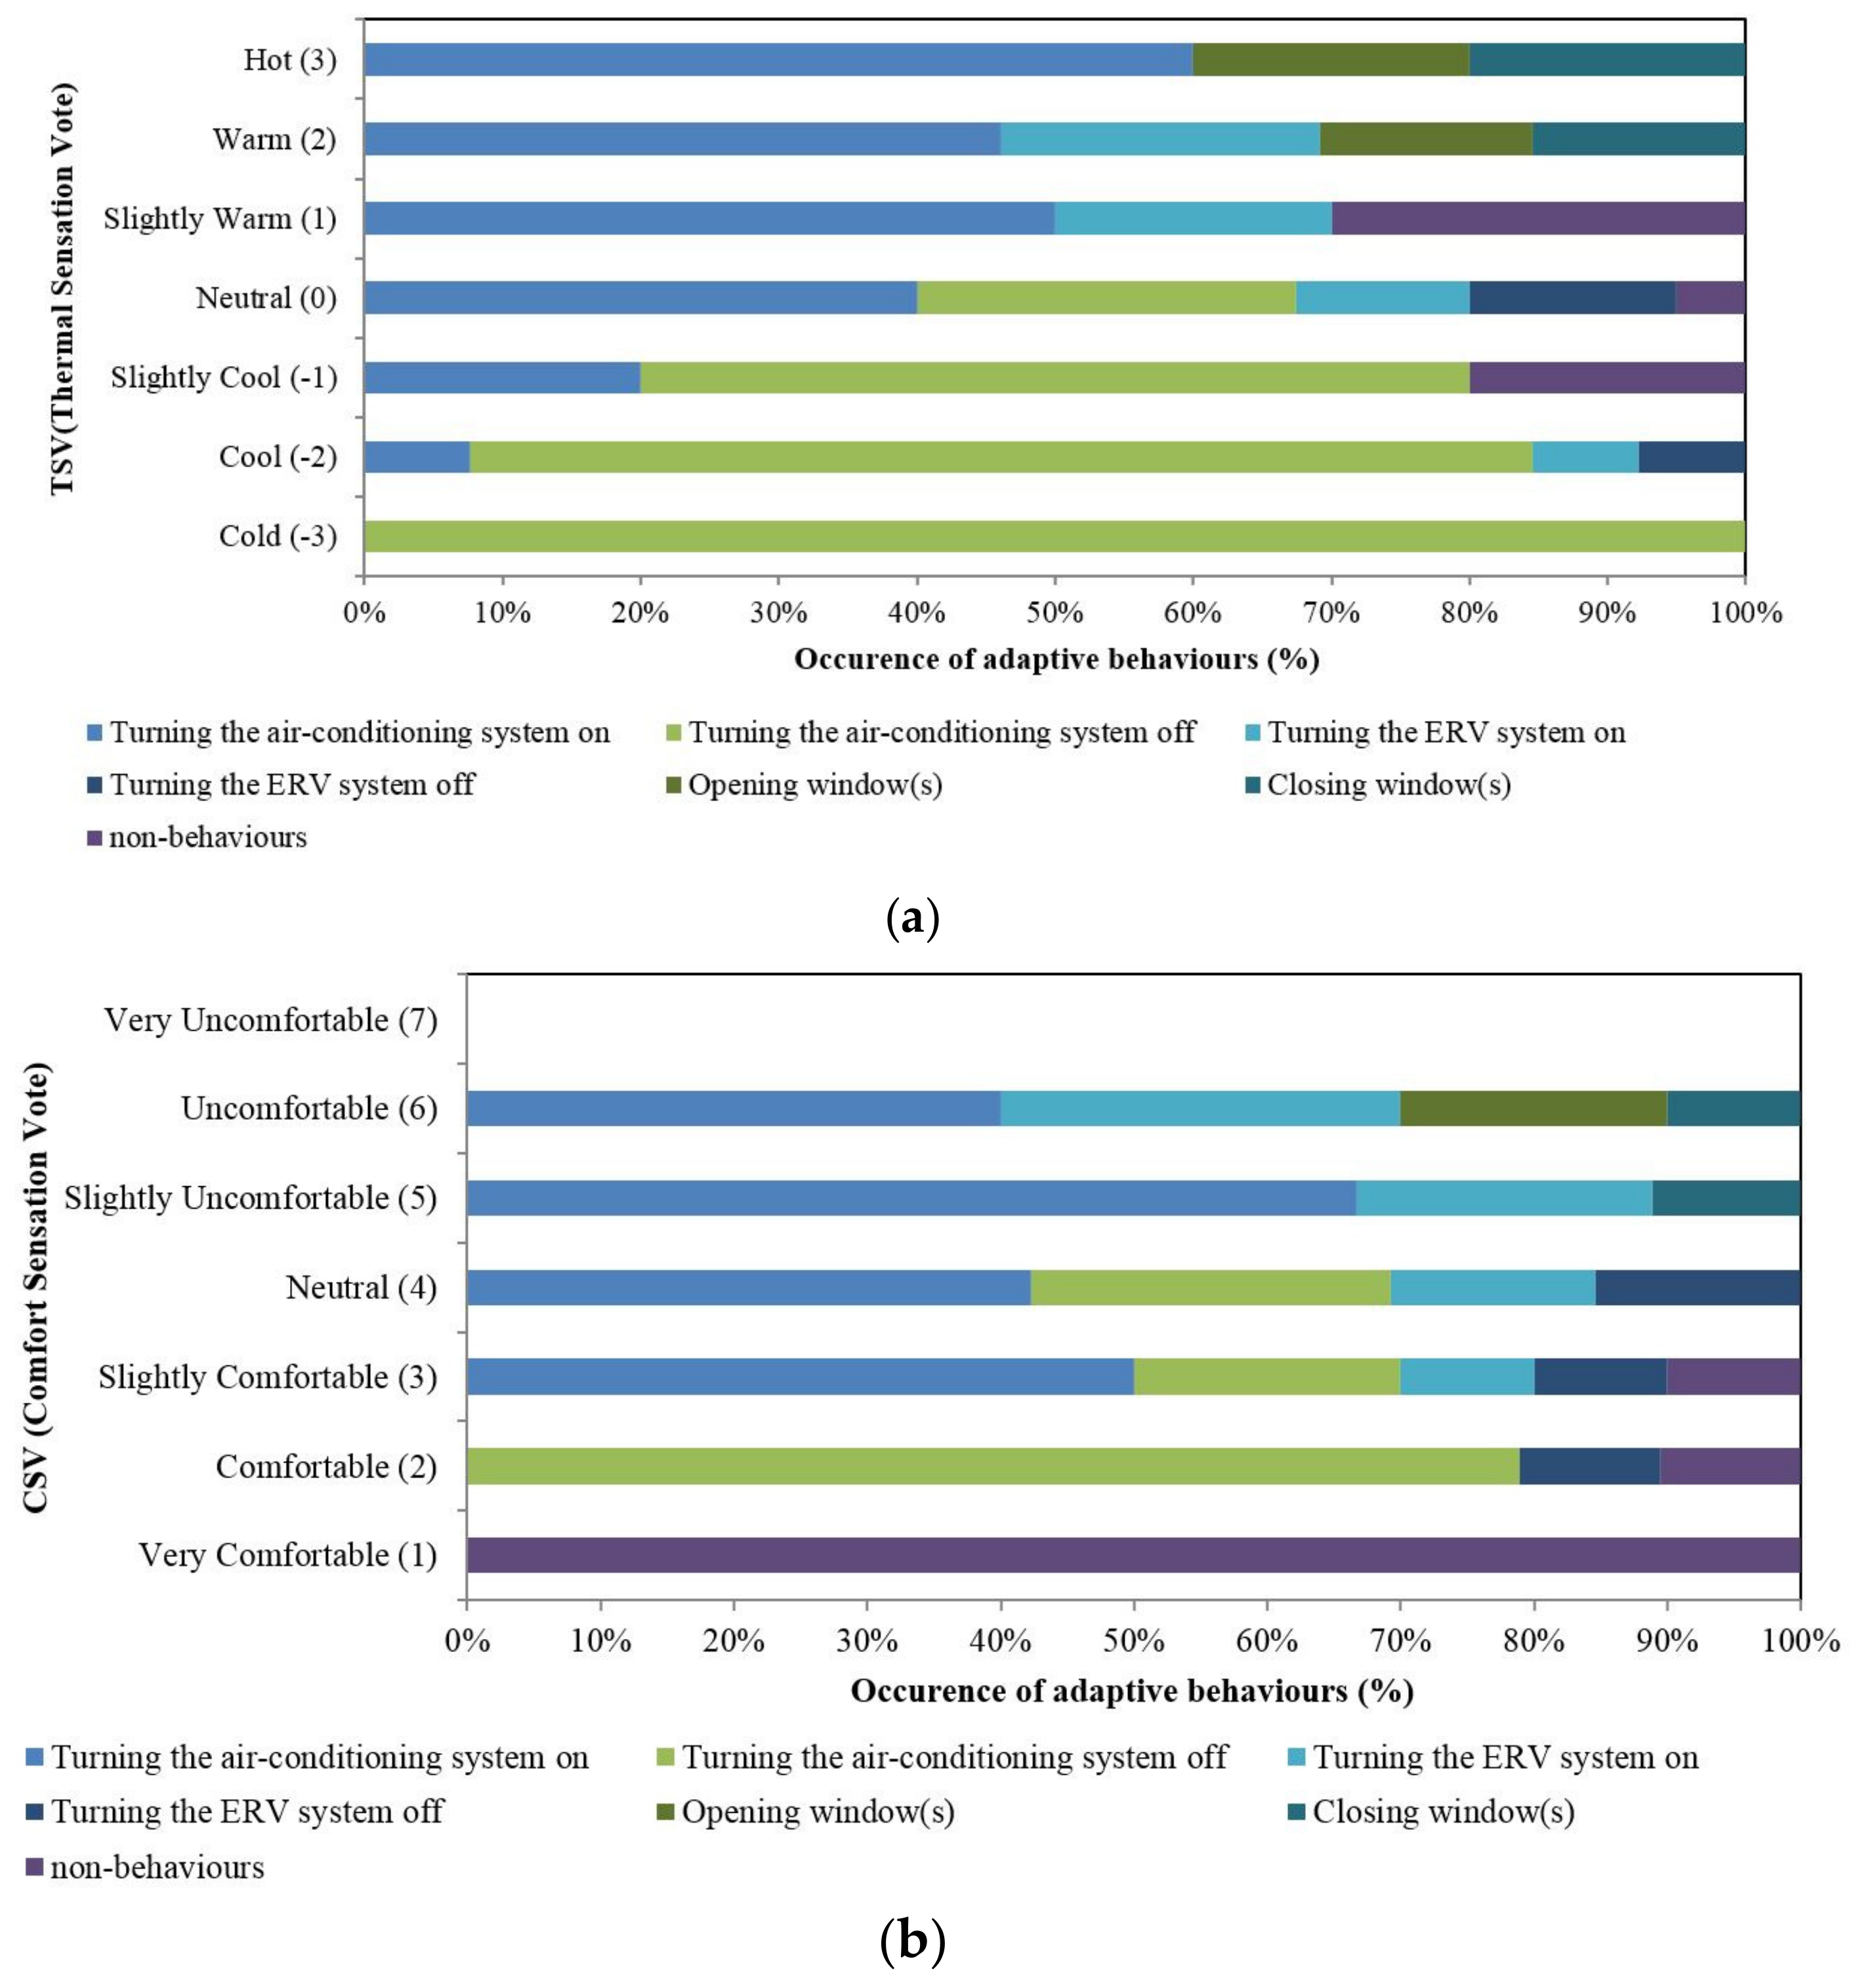
3.4. Adaptive Behavior According to Occupant Thermal, Comfort Sensation
- Behavioral adjustment: personal adaptation (clothing, activity, change of posture, etc.), control of indoor thermal environment, adjustment of cultural habits (clothing habits)
- Physiological adjustment: genetic adaptation, acclimatization
- Psychological adjustment: changes of thermal cognition and reaction to repetitive thermal stimulus
- Adaptive behavior to improve indoor thermal environment: turning AC system on/off
- Adaptive behavior to improve ventilation: turning ERV system on/off, opening or closing window(s) (window behavior is exclusive to the OC mode)
4. Results
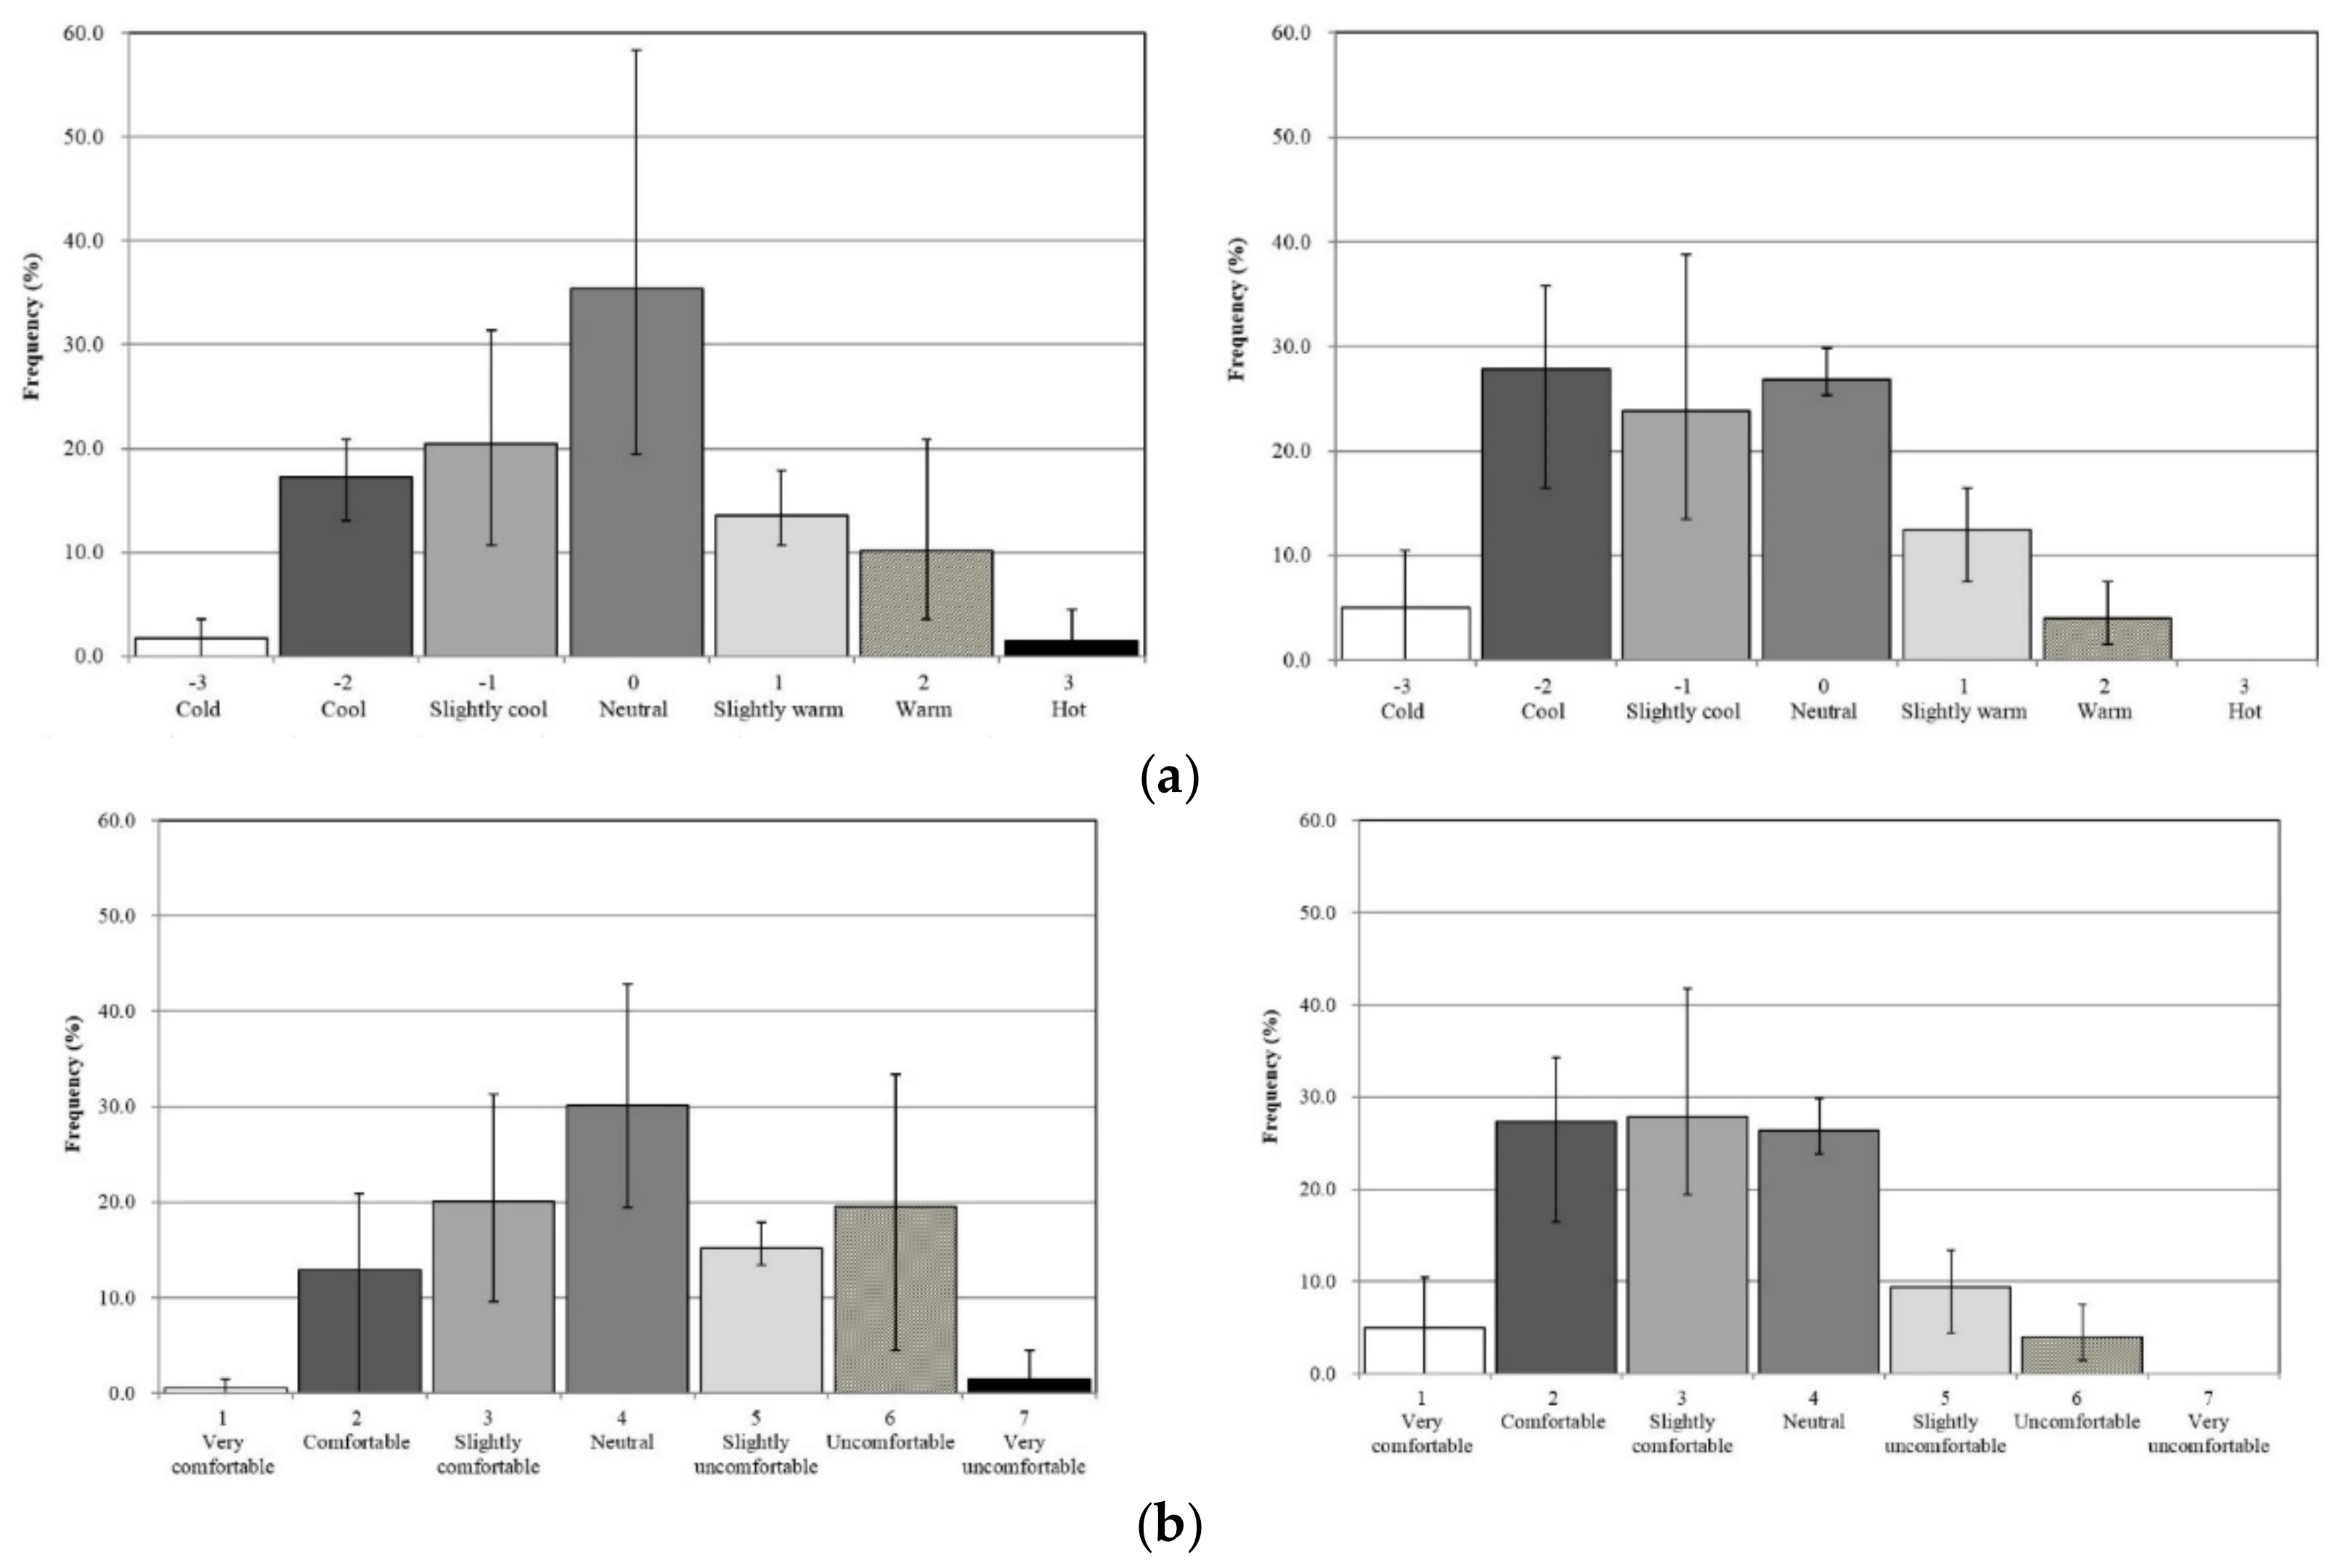
4.1. Subjective Thermal Responses
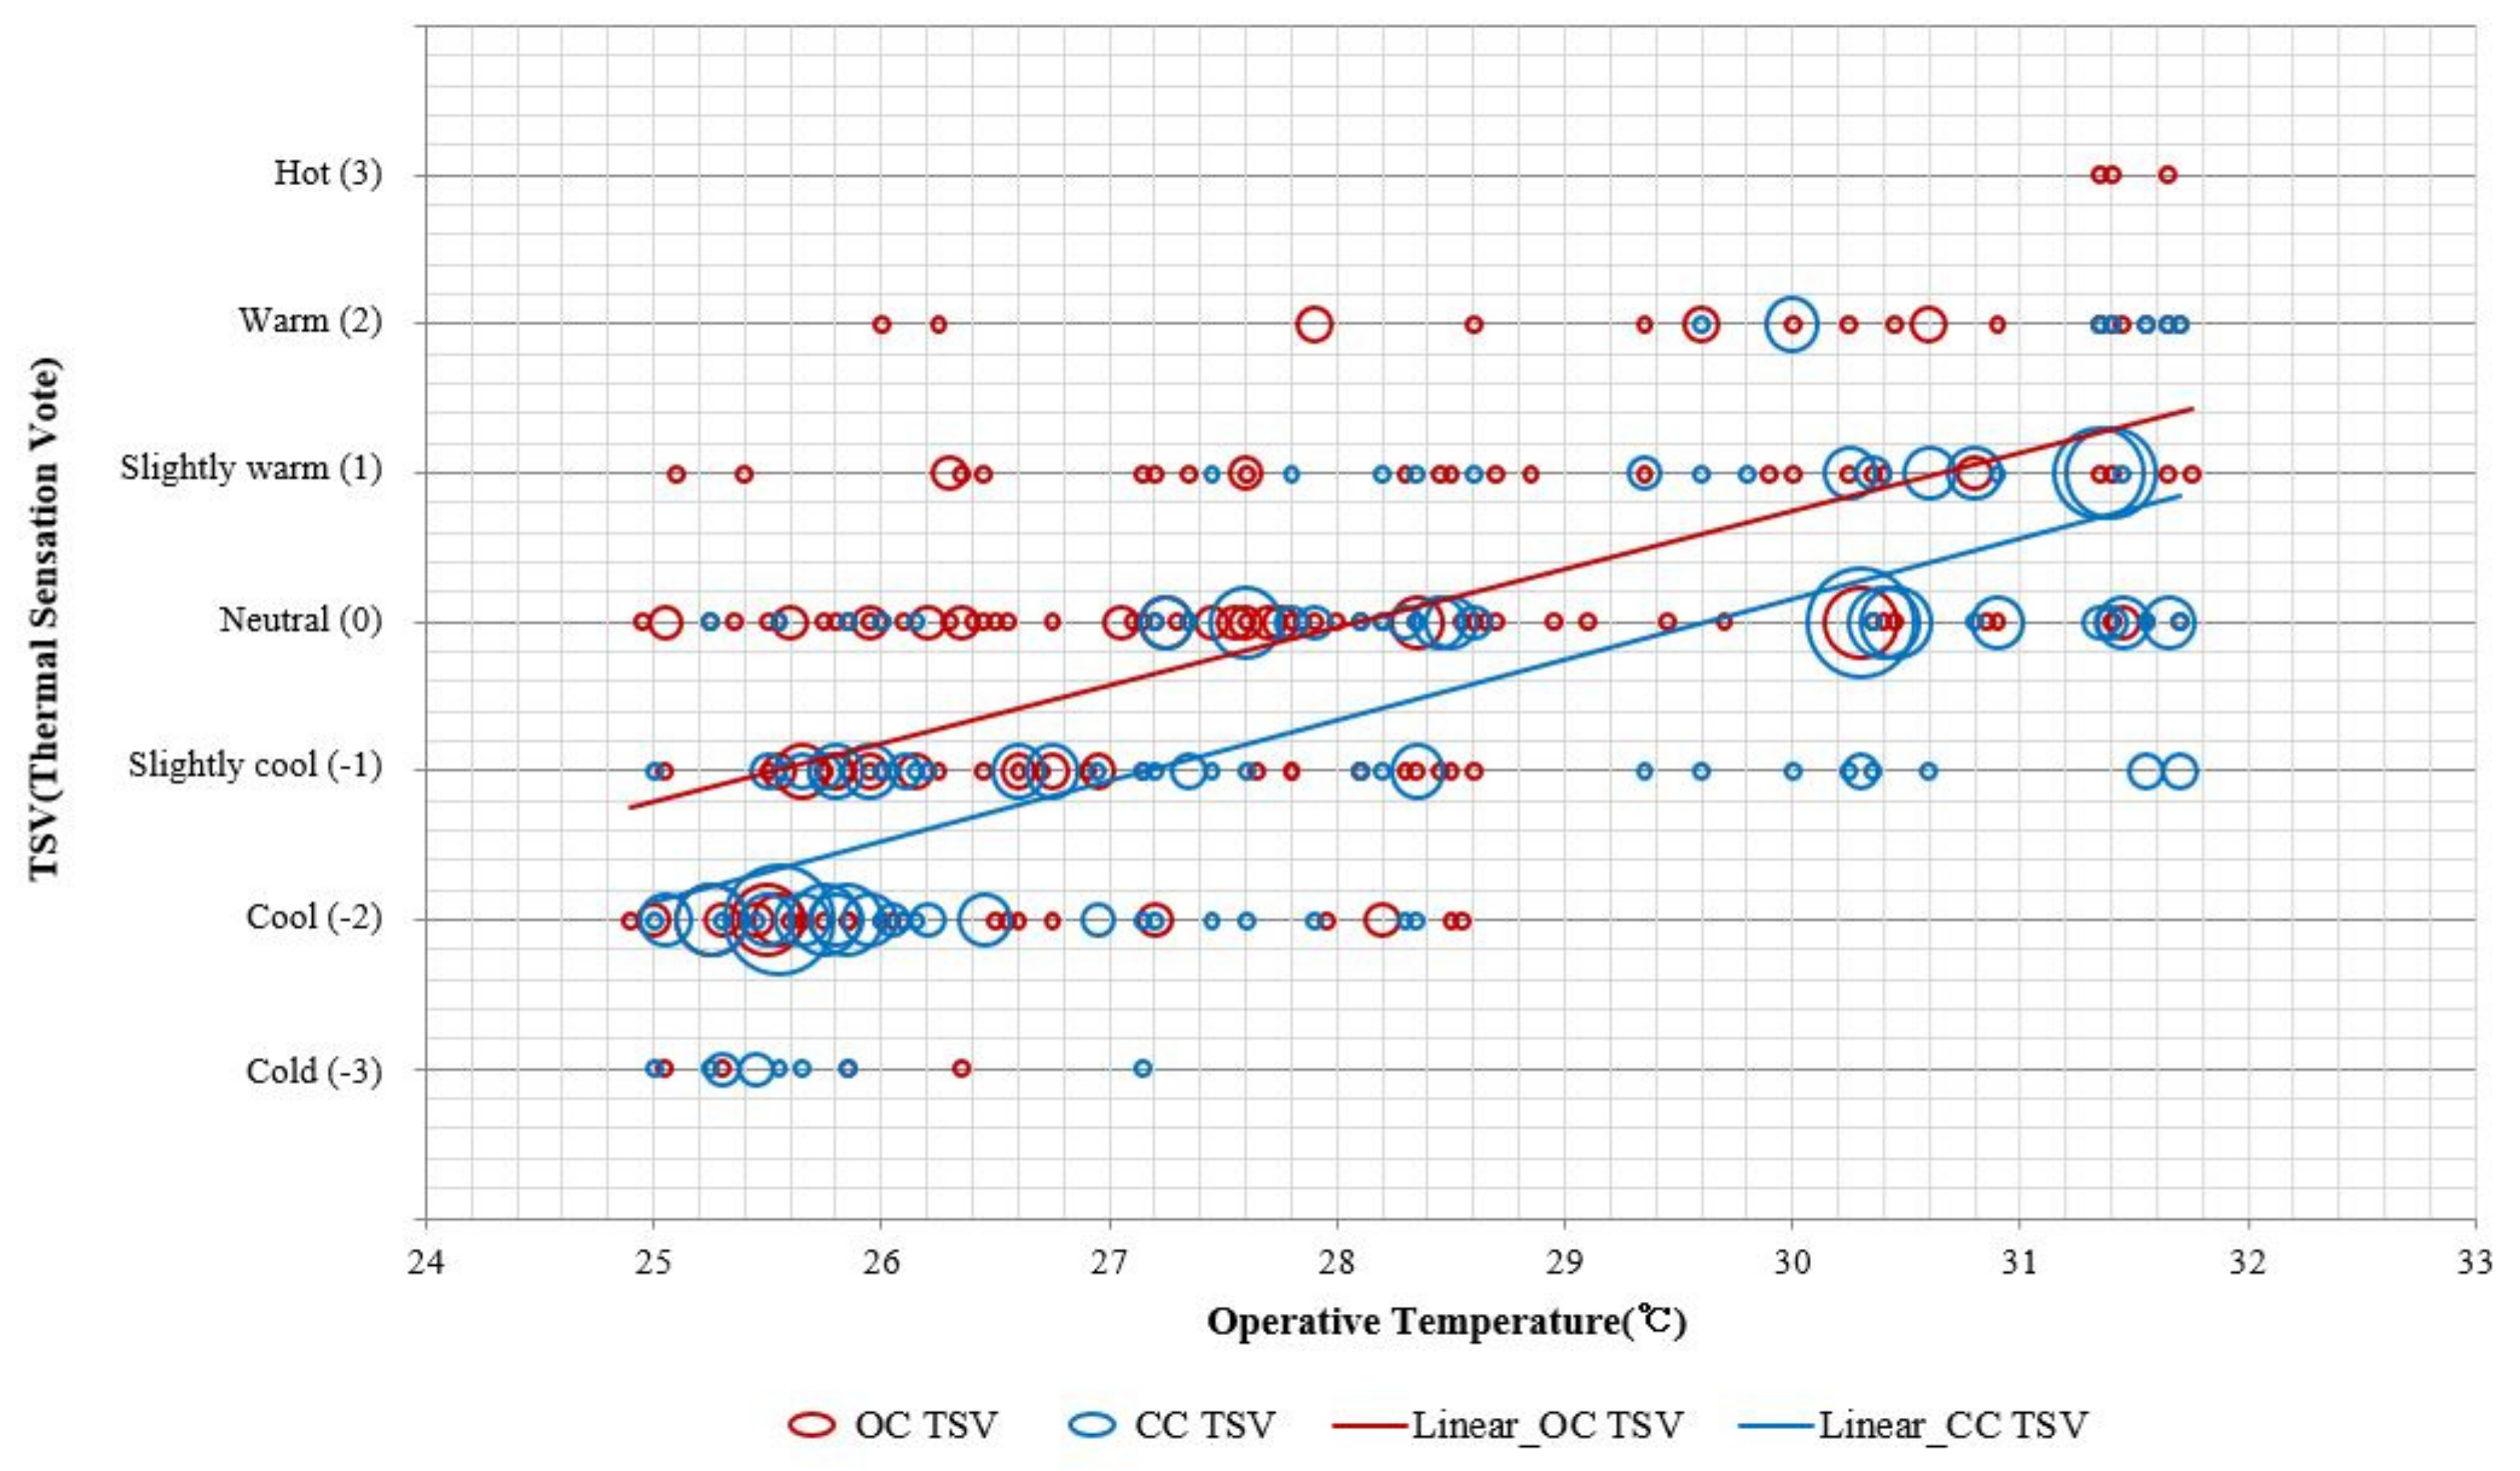
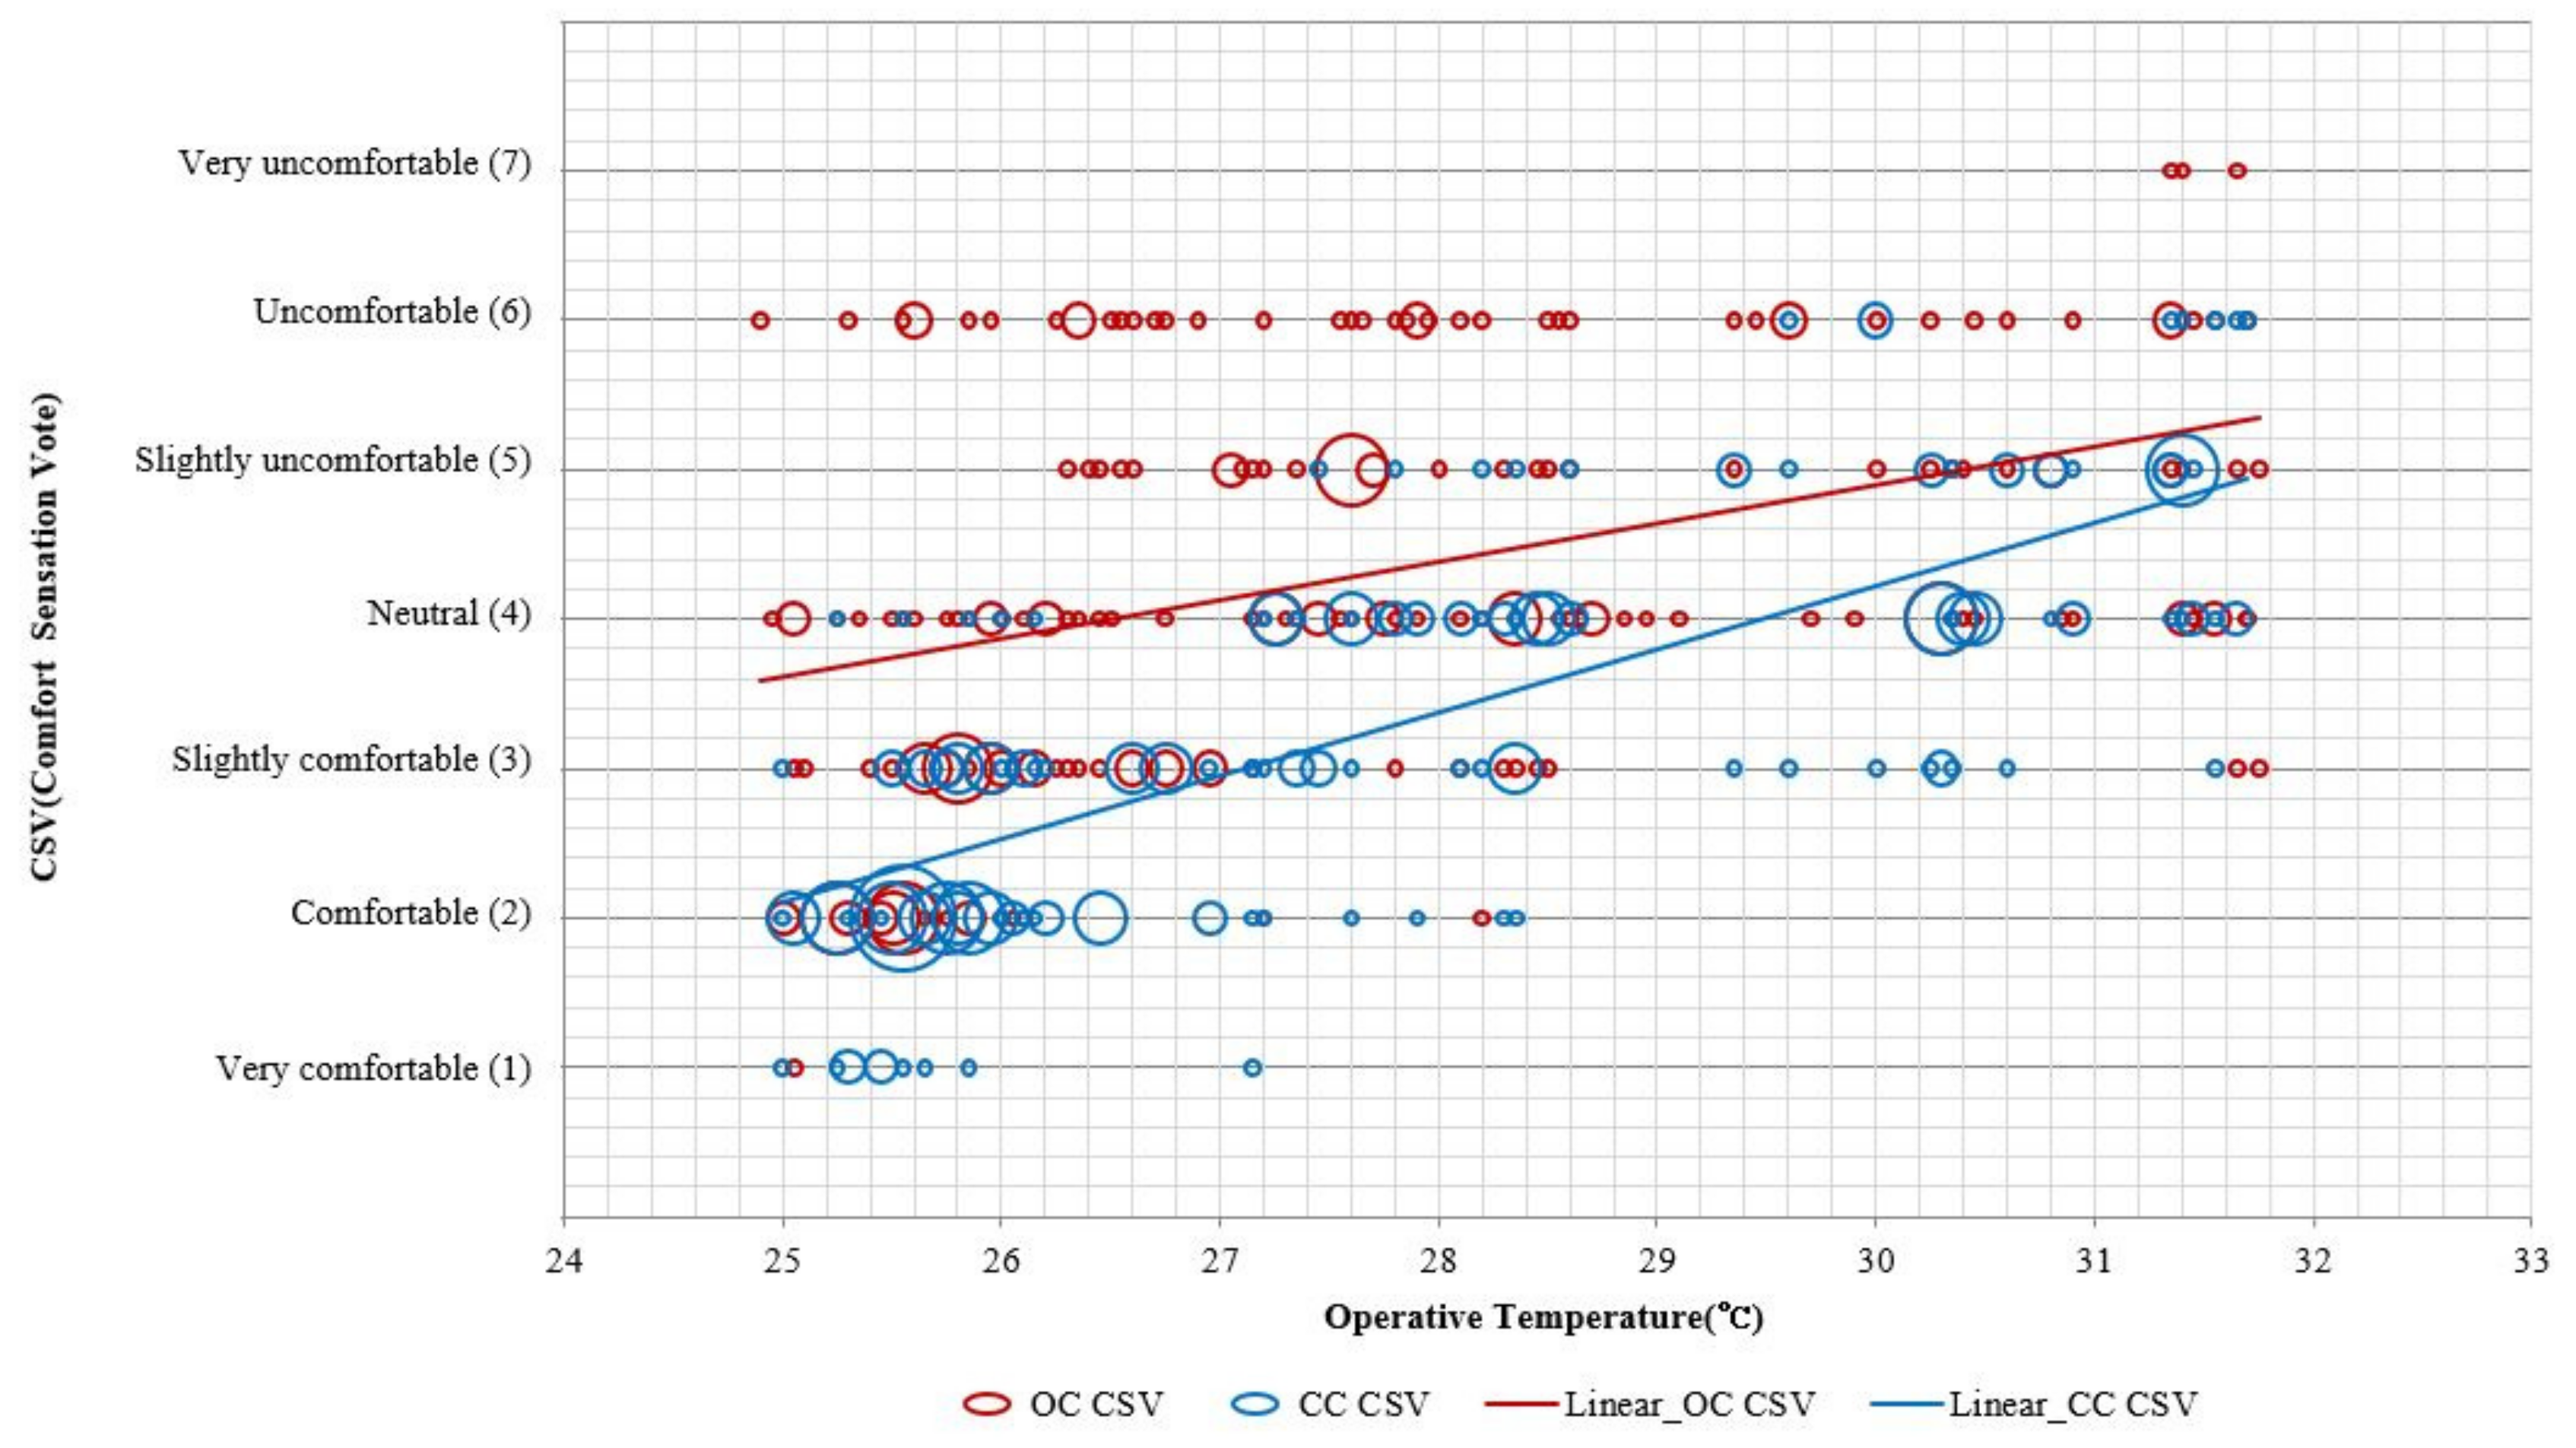
4.2. Correlation between Indoor Thermal Environment and Thermal Comfort
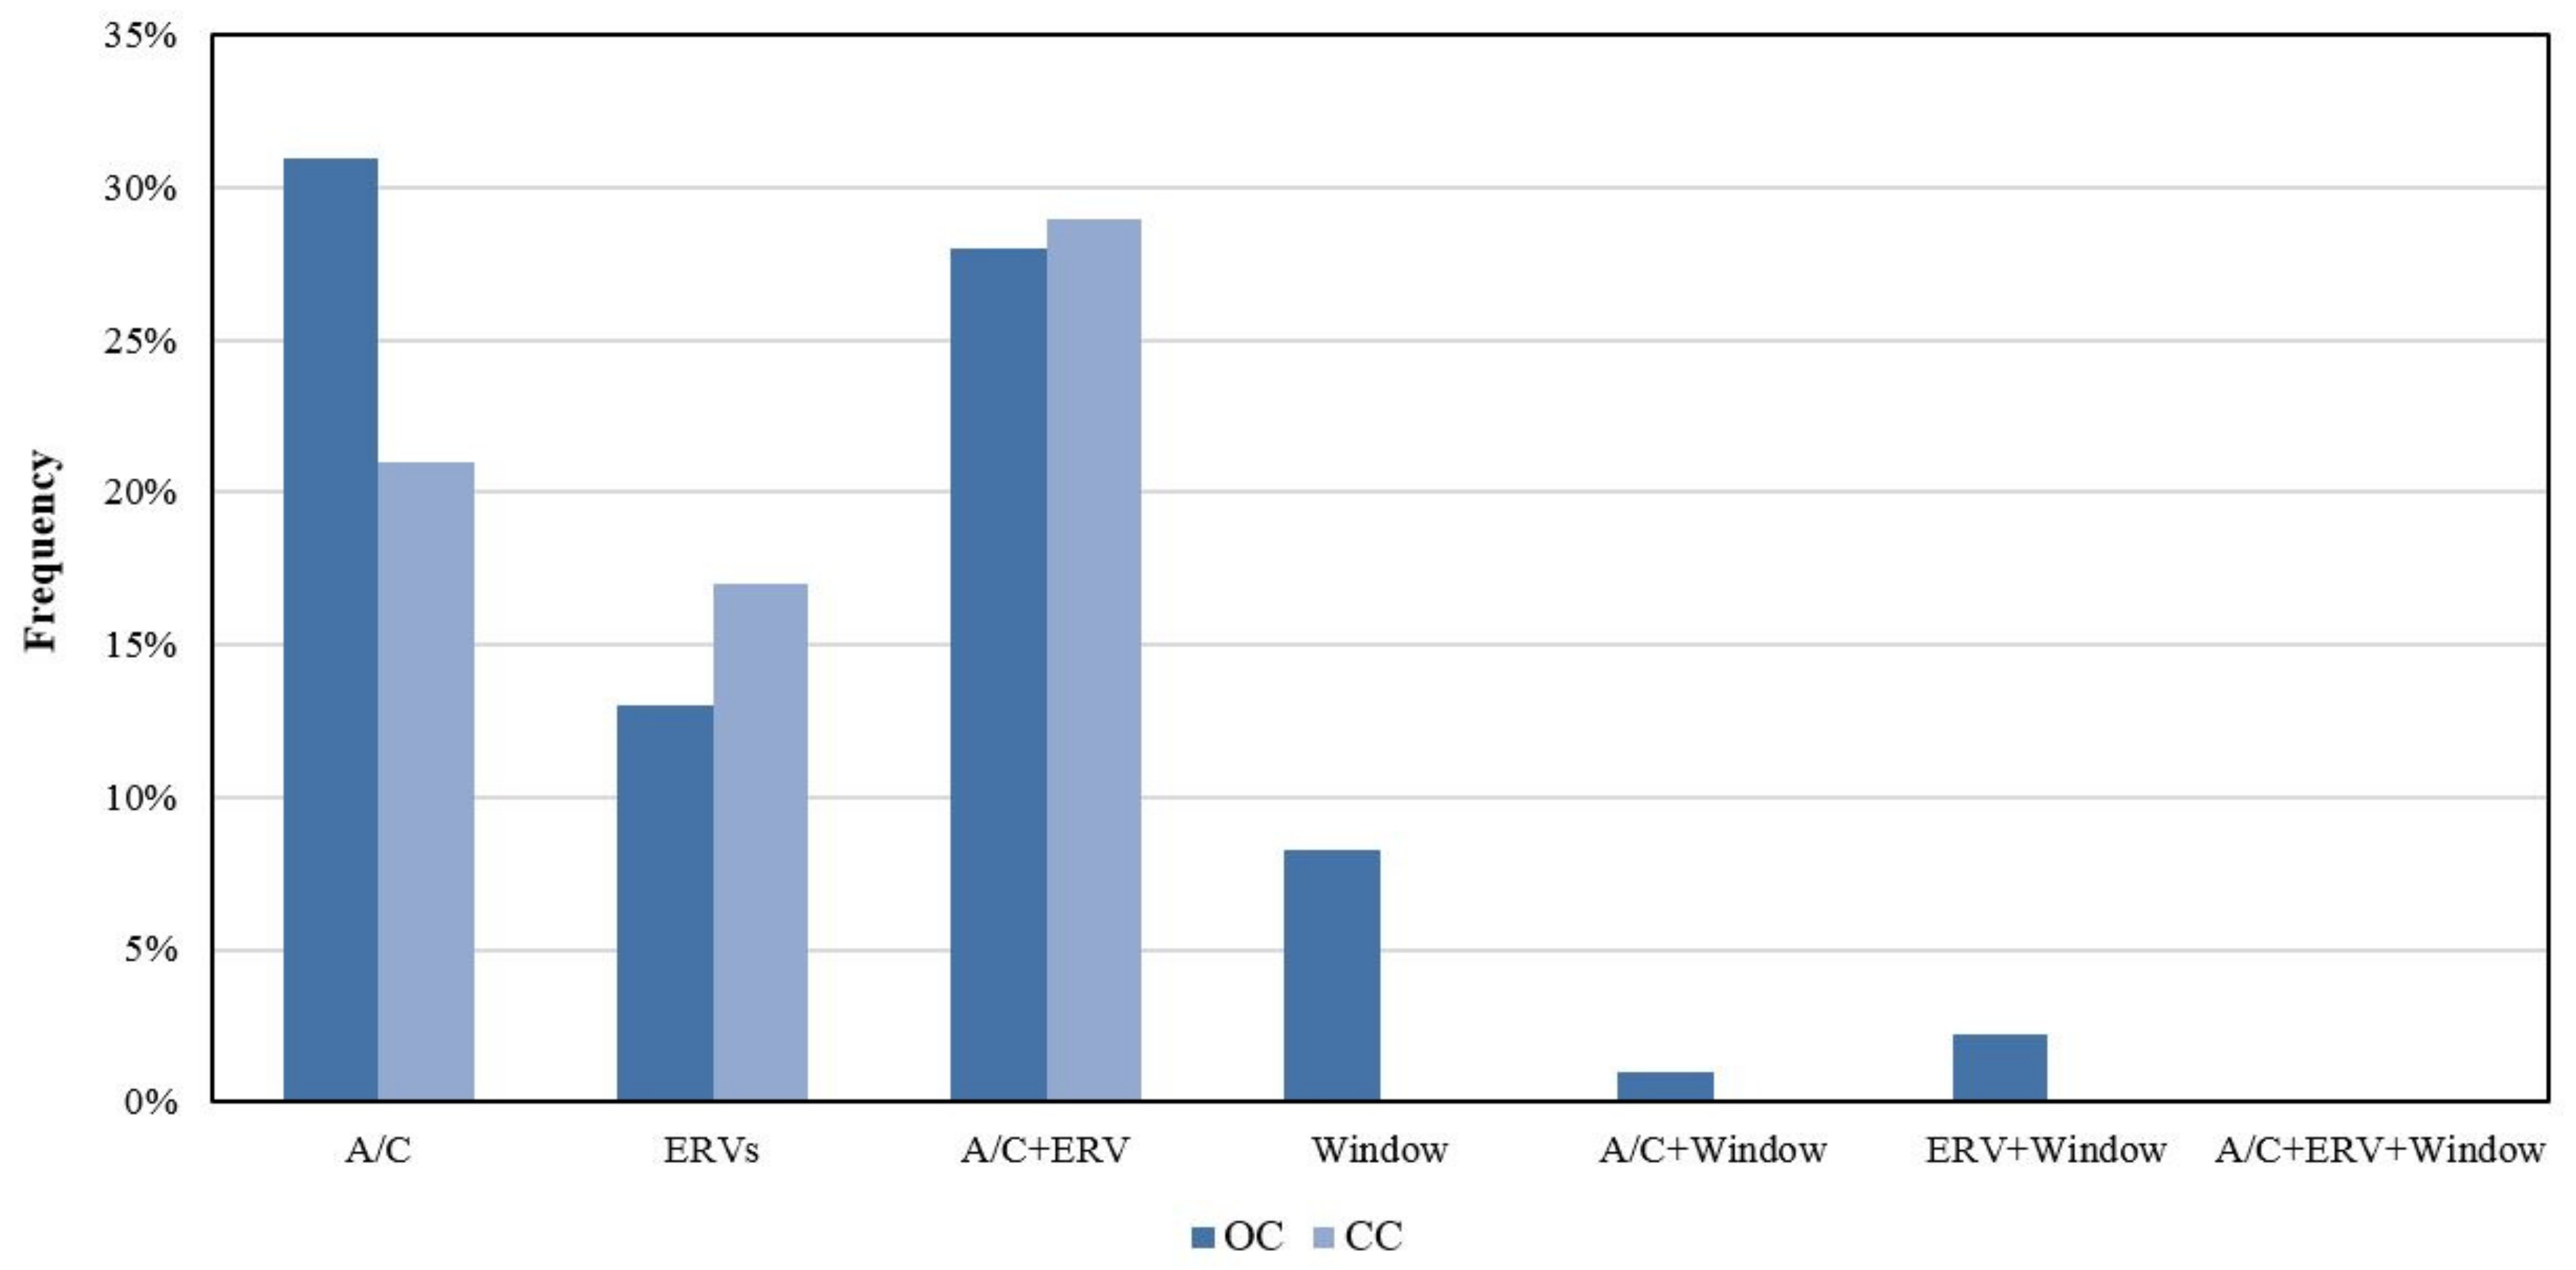
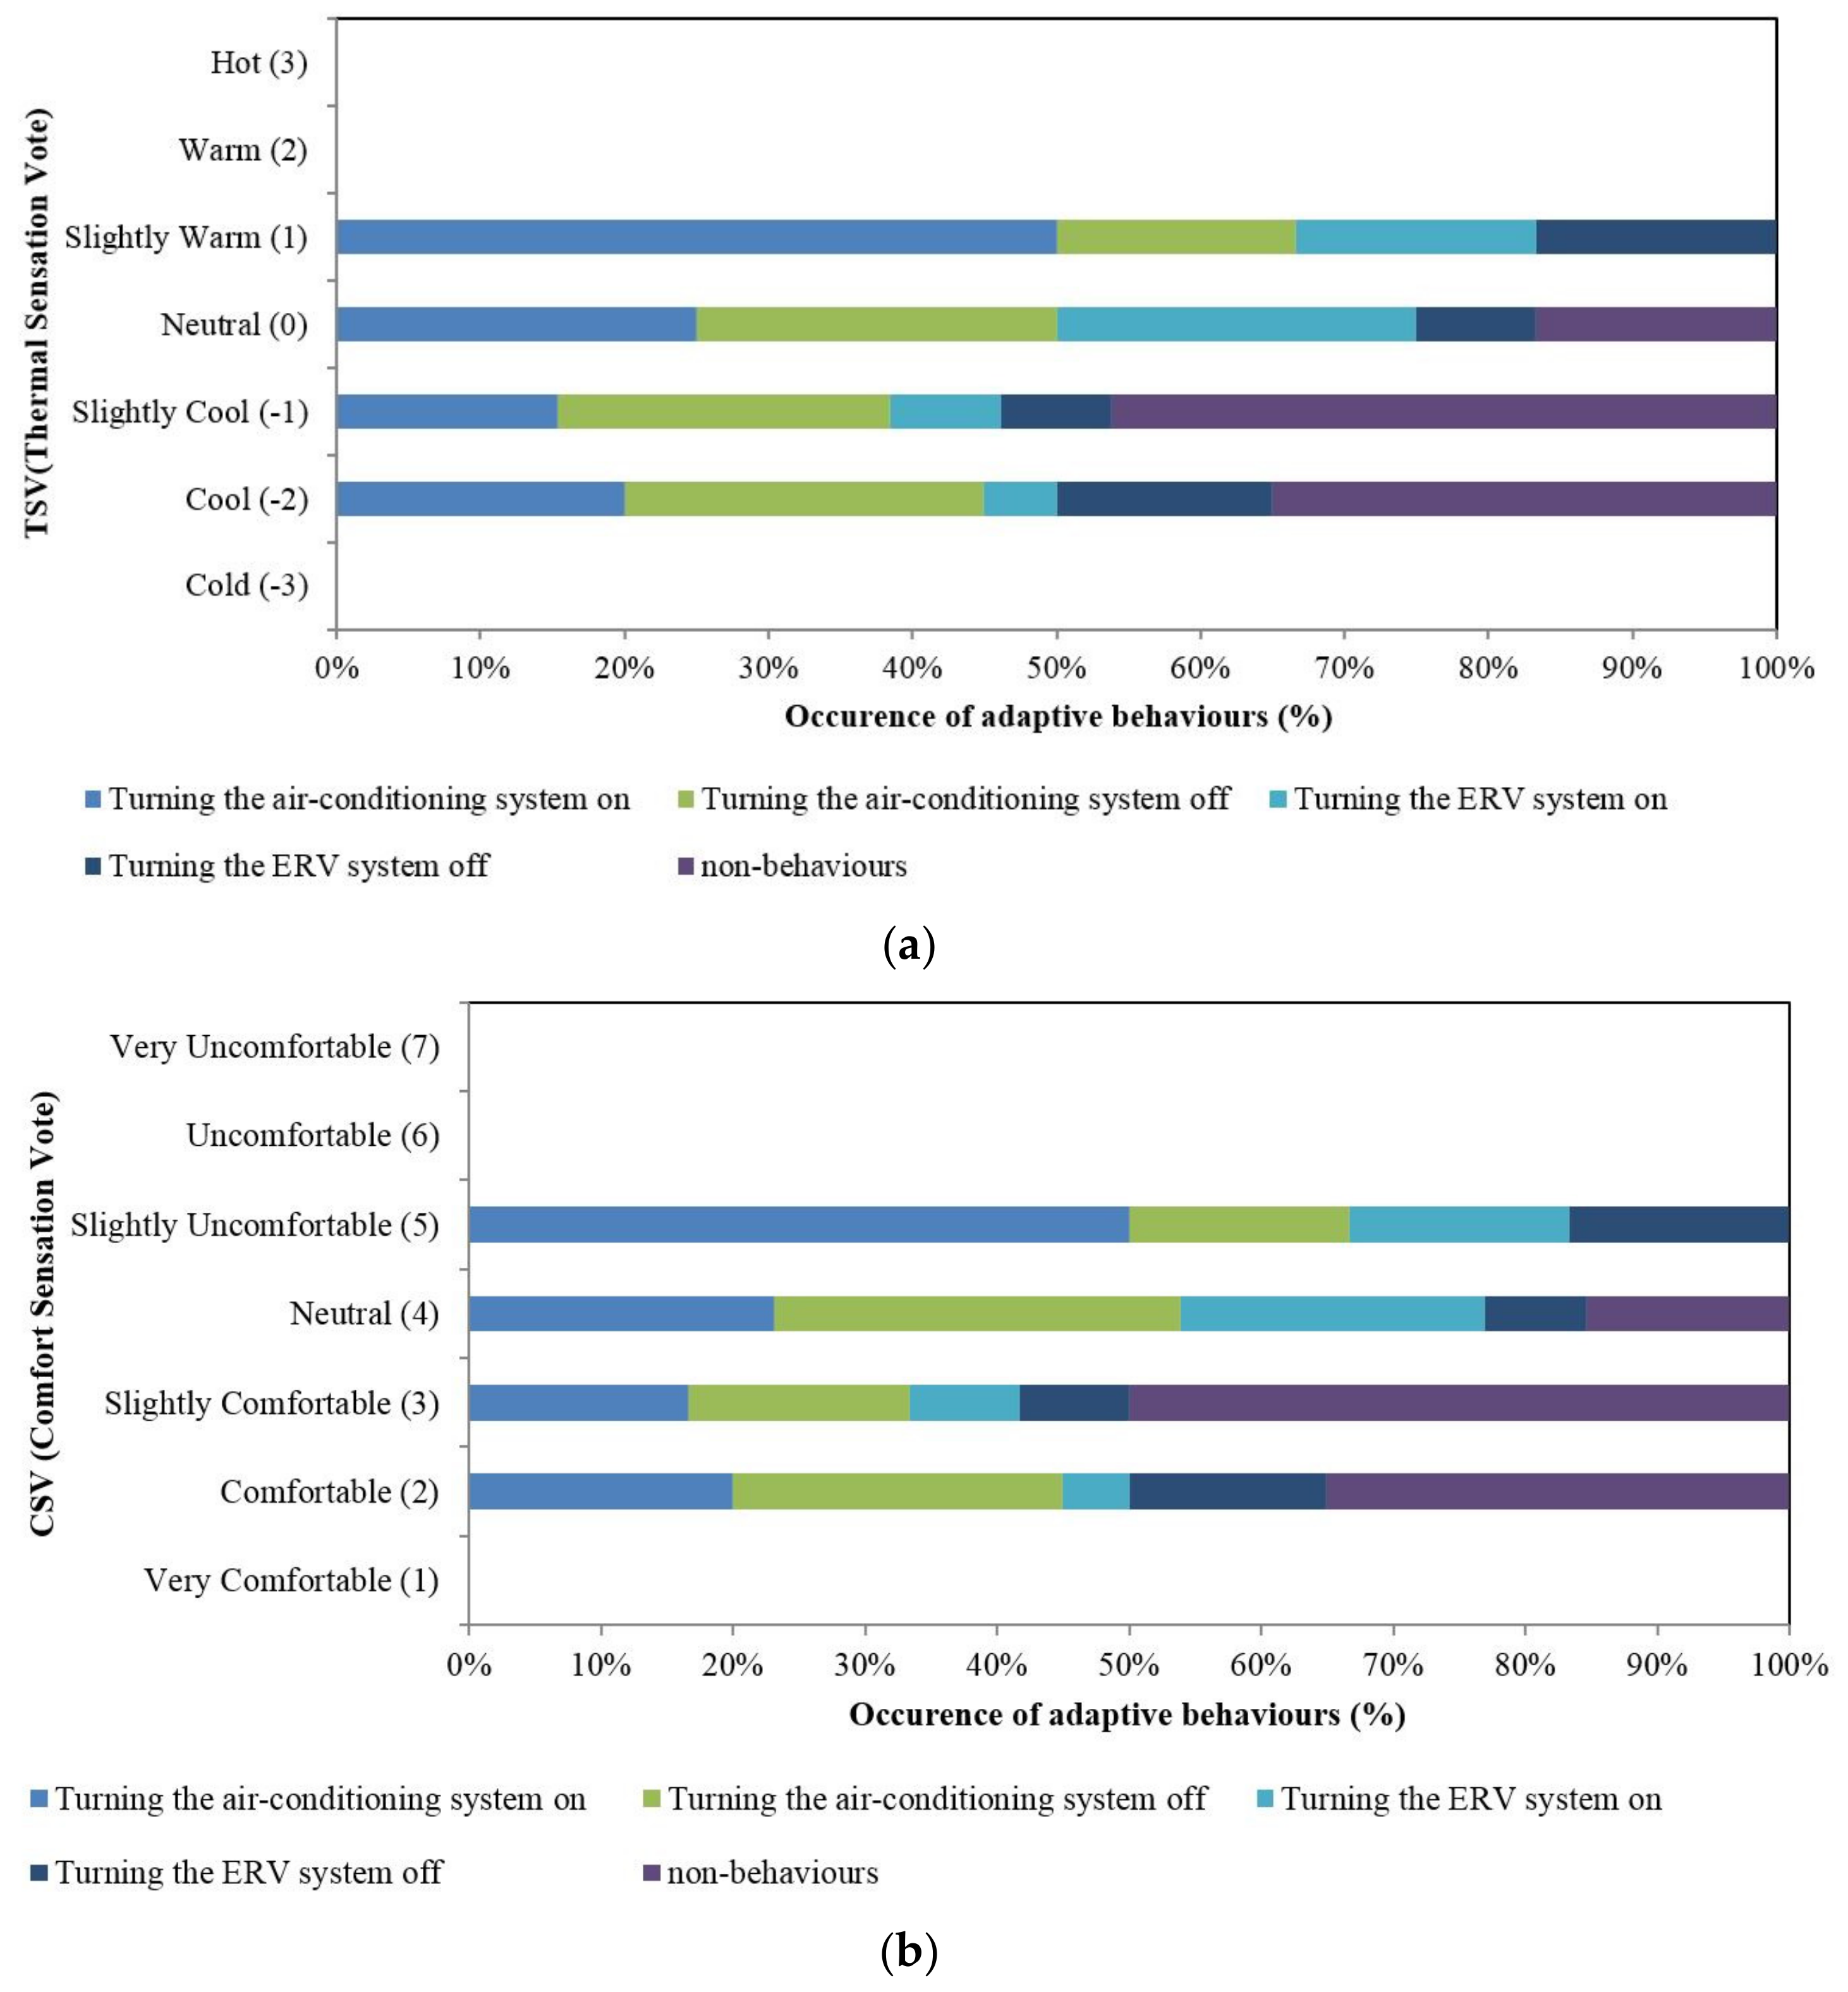
4.3. Variation of Adaptive Behavior According to Control Method
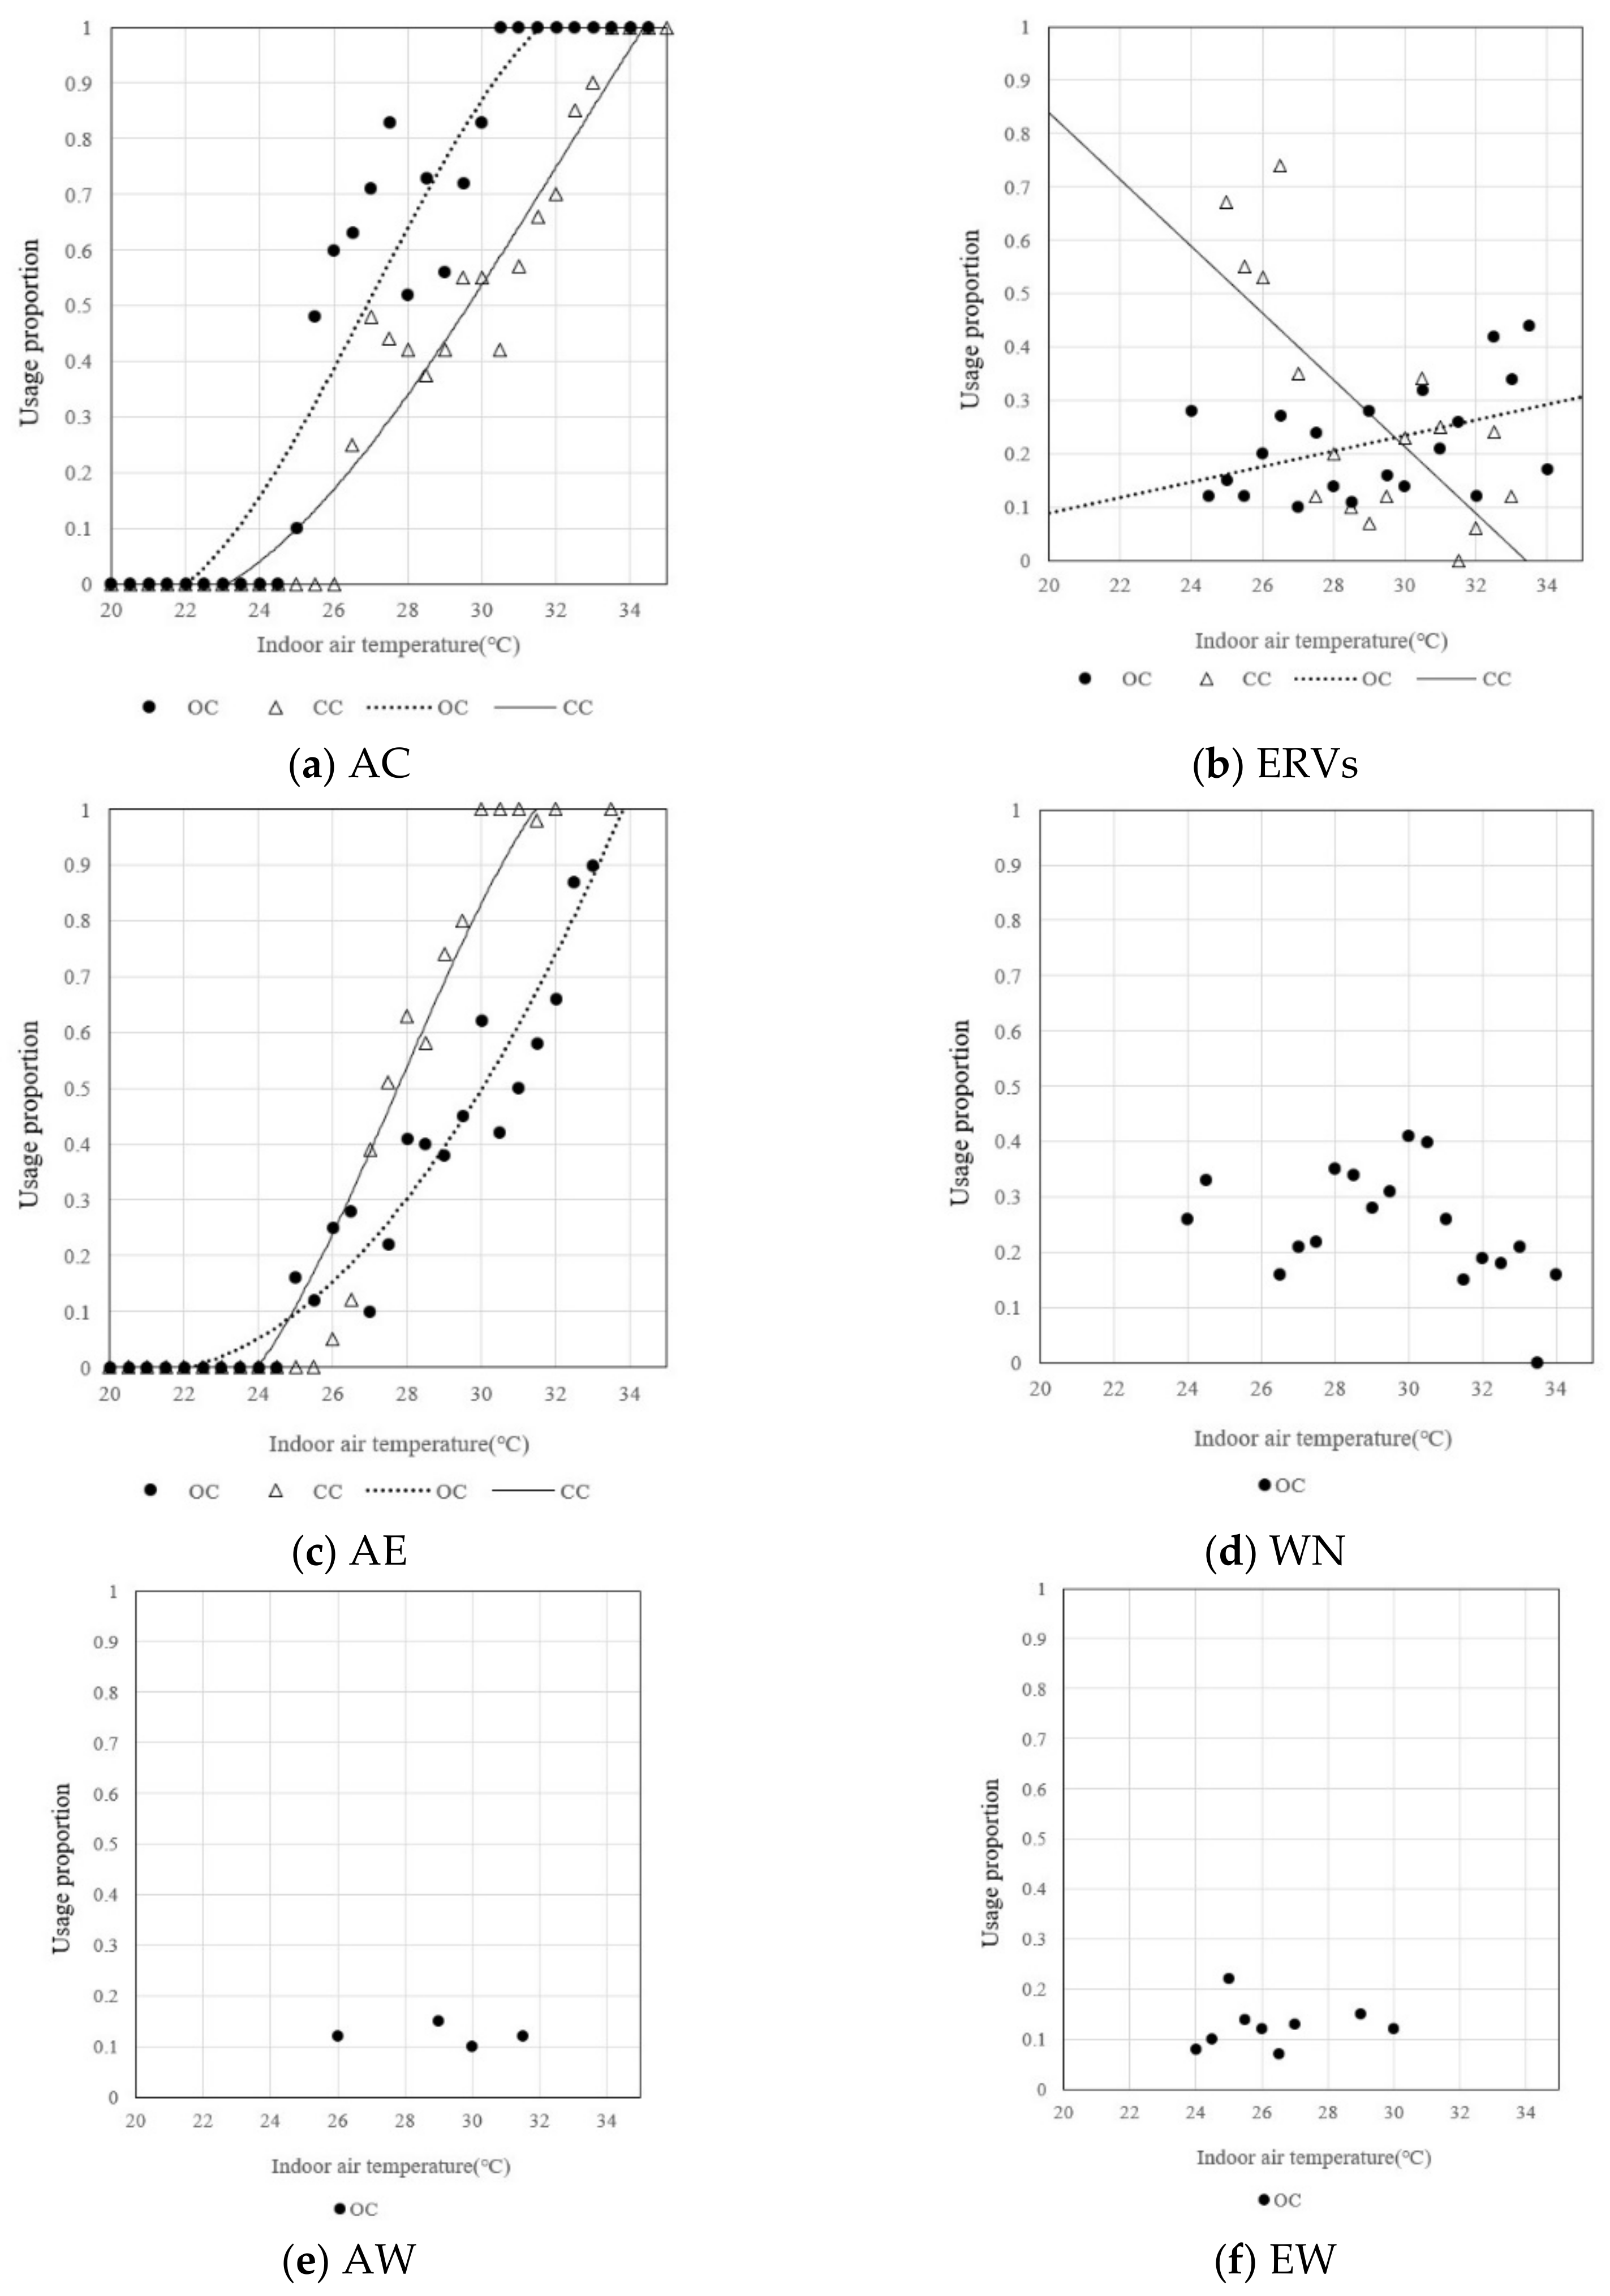
4.4. Relationship between Adaptive Behavior and Physical Environmental Parameters
5. Discussion
6. Conclusions
- When CC was applied, the physical indices of the indoor thermal environment (i.e., temperature and humidity) exhibited a higher correlation with occupant subjective responses (i.e., TSV and CSV) than when OC was applied.
- The operation of the HVAC system was classified into six cases (AC system operation alone, simultaneous operation of AC and ERV systems, operation of ERV system alone, window opening, simultaneous operation of ERV system and window opening, and simultaneous operation of AC system and window opening). We found that the OC mode corresponded to a high percentage of discomfort responses and triggered more frequent adaptive behaviors, compared to the CC mode.
- A quantitative analysis was conducted to estimate how occupant thermal comfort was affected by the operation method of the HVAC system. The CC mode was more effective than the OC mode in maintaining occupant thermal comfort.
- A linear regression analysis was also performed to calculate neutral temperatures. The neutral temperature in the CC mode was higher than that in the OC mode. This indicates that when CC is applied to control the HVAC system, occupant thermal comfort can be achieved at a higher indoor temperature.
Author Contributions
Funding
Institutional Review Board Statement
Informed Consent Statement
Data Availability Statement
Conflicts of Interest
Abbreviations
| TSV | Thermal sensation vote |
| TSVoc | The surveyed TSV in OC mode |
| TSVcc | The surveyed TSV in CC mode |
| CSV | Comfort sensation vote |
| CSVoc | The surveyed CSV in OC mode |
| CSVcc | The surveyed CSV in CC mode |
| PMV | Predicted mean vote |
| OC | Occupant control |
| CC | Comfort-zone control |
| HVAC | Heating, ventilation, and air conditioning systems |
| AC | Air conditioning system |
| ERVs | Energy recovery ventilation system |
| ASHRAE | American Society of Heating, Refrigerating, and Air-Conditioning Engineers |
| CLO | The clothing insulation |
| SD | Standard deviation |
| Tin | Indoor air temperature (°C) |
| Top | Indoor operative temperature (°C) |
| Tout | Outdoor mean temperature (°C) |
| Tc | Comfort temperature (°C) |
| RH | Relative humidity (%) |
| AE | Air-conditioning system and Energy recovery ventilation system |
| WN | Window |
| AW | Air-conditioning system and Window |
| EW | Energy recovery ventilation system and Window |
References
- Sabri Mustapa, M.; Zaki, A.; Rijal, H.B.; Hagishima, A.; Sukri, M.; Ali, M. Thermal comfort and occupant adaptive behaviour in Japanese university buildings with free running and cooling mode offices during summer. Build. Environ. 2006, 105, 332–342. [Google Scholar] [CrossRef]
- Zhao, R.; Sun, S.; Ding, R. Conditioning strategies of indoor thermal environment in warm climates. Energy Build. 2004, 36, 1281–1286. [Google Scholar] [CrossRef]
- de Dear, R.J.; Brager, G.S. Developing an adaptive model of thermal comfort and preference. ASHRAE Trans. 1998, 104, 145–167. [Google Scholar]
- Ole Fanger, P.; Toftum, J. Extension of the PMV model to non-air-conditioned buildings in warm climates. Energy Build. 2002, 34, 533–536. [Google Scholar] [CrossRef]
- Yau, Y.H.; Chew, B.T.; Saifullah, A.Z.A. A Field Study on Thermal Comfort of Occupants and Acceptable Neutral Temperature at the National Museum in Malaysia. Indoor Built. Environ. 2011, 22, 433–444. [Google Scholar] [CrossRef]
- Baker, N.; Steemers, K. Energy and Environment in Architecture; Routledge: Oxfordshire, UK, 2003. [Google Scholar]
- Humphreys, M.A.; Nicol, J.F. Understanding the adaptive approach to thermal comfort. ASHRAE Trans. 1998, 104, 991–1004. [Google Scholar]
- Brager, G.S.; De Dear, R.J. Thermal adaptation in the built environment: A literature review. Energy Build. 1998, 27, 83–96. [Google Scholar] [CrossRef] [Green Version]
- Nicol, F.; Humphreys, M.; Roaf, S. Adaptive Thermal Comfort: Principles and Practice; Routledge: London, UK, 2012. [Google Scholar]
- Liu, J.; Yao, R.; McCloy, R. An investigation of thermal comfort adaptation behaviour in office buildings in the UK. Indoor Built Environ. 2013, 23, 675–691. [Google Scholar] [CrossRef]
- Brager, G.S.; Paliaga, G.; de Dear, R.J. Operable windows, personal control and occupant comfort. ASHRAE Trans. 2004, 110, 17–35. [Google Scholar]
- Schweiker, M.; Shukuya, M. Comparison of theoretical and statistical models of air-conditioning unit usage behaviour in a res-idential setting under Japanese climatic conditions. Build. Environ. 2009, 44, 2137–2149. [Google Scholar] [CrossRef]
- Fabi, V.; Andersen, R.V.; Corgnati, S.P.; Olesen, B.W. A methodology for modelling energy-related human behaviour: Application to window opening behaviour in residential buildings. Build. Simul. 2013, 6, 415–427. [Google Scholar] [CrossRef]
- Rijal, H.B.; Tuohy, P.; Humphreys, M.A.; Nicol, J.F.; Samuel, A.; Clarke, J. Using results from field surveys to predict the effect of open windows on thermal comfort and energy use in buildings. Energy Build. 2007, 39, 823–836. [Google Scholar] [CrossRef] [Green Version]
- Haldi, F.; Robinson, D. Interactions with window openings by office occupants. Build. Environ. 2009, 44, 2378–2395. [Google Scholar] [CrossRef]
- Liu, W.; Deng, Q.; Ma, W.; Huangfu, H.; Zhao, J. Feedback from human adaptive behaviour to neutral temperature in naturally ventilated buildings: Physical and psychological paths. Build. Environ. 2013, 67, 240–249. [Google Scholar] [CrossRef]
- Haldi, F.; Robinson, D. On the unification of thermal perception and adaptive actions. Build. Environ. 2010, 45, 2440–2457. [Google Scholar] [CrossRef]
- Barthelmes, V.M.; Becchio, C.; Corgnati, S.P. Occupant behaviour lifestyles in a residential nearly zero energy building: Effect on energy use and thermal comfort. Sci. Technol. Built Environ. 2016, 22, 960–975. [Google Scholar] [CrossRef]
- Yun, G.Y.; Steemers, K. Time-dependent occupant behaviour models of window control in summer. Build. Environ. 2008, 43, 1471–1482. [Google Scholar] [CrossRef]
- Haldi, F.; Robinson, D. On the behaviour and adaptation of office occupants. Build. Environ. 2008, 43, 2163–2177. [Google Scholar] [CrossRef]
- Herkel, S.; Knapp, U.; Pfafferott, J. Towards a model of user behaviour regarding the manual control of windows in office buildings. Build. Environ. 2008, 43, 588–600. [Google Scholar] [CrossRef]
- Rijal, H.B.; Tuohy, P.; Humphreys, M.A.; Nicol, J.F.; Samuel, A.; Raja, I.A.; Clarke, J. Development of adaptive algorithms for the operation of windows, fans and doors to predict thermal comfort and energy use in Pakistani buildings. ASHRAE Trans. 2008, 114, 555–573. [Google Scholar]
- Roetzel, A.; Tsangrassoulis, A.; Dietrich, U.; Busching, S. A review of occupant control on natural ventilation. Renew. Sustain. Energy Rev. 2010, 14, 1001–1013. [Google Scholar] [CrossRef]
- Quan, J.; Duanmu, L. Experimental study of thermal sensation and physiological response during step changes in non-uniform indoor environment. Sci. Technol. Built Environ. 2016, 22, 237–247. [Google Scholar]
- Lee, T.K.; Cho, S.H.; Kim, J.T. Residents’ Adjusting Behaviour to Enhance Indoor Environmental Comfort in Apartments. Indoor Built Environ. 2011, 21, 28–40. [Google Scholar] [CrossRef]
- Macfarlane, W.V. Thermal comfort studies since 1958. Arch. Sci. Rev. 1978, 21, 86–92. [Google Scholar] [CrossRef]
- Liu, W.; Zheng, Y.; Deng, Q.; Yang, L. Human thermal adaptive behaviour in naturally ventilated offices for different outdoor air temperatures: A case study in Changsha China. Build. Environ. 2012, 50, 76–89. [Google Scholar] [CrossRef]
- Raja, I.A.; Nicol, J.F.; McCartney, K.J.; Humphreys, M.A. Thermal comfort: Use of controls in naturally ventilated buildings. Energy Build. 2001, 33, 235–244. [Google Scholar] [CrossRef]
- Park, J.S.; Kim, H.J. A field study of occupant behaviour and energy consumption in apartment with mechanical ventilation. Energy Build. 2012, 50, 19–25. [Google Scholar] [CrossRef]
- Jazizadeh, F.; Ghahramani, A.; Becerik-Gerber, B.; Kichkaylo, T.; Orosz, M. Personalized thermal comfort-driven control in HVAC-operated office buildings. Comput. Civil Eng. 2013, 218–225. [Google Scholar] [CrossRef] [Green Version]
- Keyvanfar, A.; Shafaghat, A.; Abd Majid, M.Z.; bin Lamit, H.; Warid Hussin, M.; Binti Ali, K.N.; Dhafer Saad, A. User satisfaction adaptive behaviours for assessing energy efficient building indoor cooling and lighting environment. Renew. Sust. Energ. Rev. 2014, 39, 277–295. [Google Scholar] [CrossRef]
- Nation Law Information Center. Enforcement Decree of the Building Act Attached Table 2. Design Book Required for Building Permission Application (related to Article 6 (1)). 2018. Available online: https://www.law.go.kr/ (accessed on 28 May 2020).
- Daum, D.; Haldi, F.; Morel, N. A personalized measure of thermal comfort for building controls. Build. Environ. 2011, 46, 3–11. [Google Scholar] [CrossRef]
- Ghahramani, A.; Tang, C.; Becerik-Gerber, B. An online learning approach for quantifying personalized thermal comfort via adaptive stochastic modeling. Build. Environ. 2015, 92, 86–96. [Google Scholar] [CrossRef] [Green Version]
- Li, D.; Menassa, C.C.; Kamat, V. Personalized human comfort in indoor building environments under diverse conditioning modes. Build. Environ. 2017, 126, 304–317. [Google Scholar] [CrossRef]
- Jazizadeh, F.; Ghahramani, A.; Becerik-Gerber, B.; Kichkaylo, T.; Orosz, M. User-led decentralized thermal comfort driven HVAC operations for improved efficiency in office buildings. Energy Build. 2014, 70, 398–410. [Google Scholar] [CrossRef]
- Jazizadeh, F.; Jung, W. Personalized thermal comfort inference using RGB video images for distributed HVAC control. Appl. Energy 2018, 220, 829–841. [Google Scholar] [CrossRef]
- Jung, W.; Jazizadeh, F. Comparative assessment of HVAC control strategies using personal thermal comfort and sensitivity models. Build. Environ. 2019, 158, 104–119. [Google Scholar] [CrossRef]
- Jung, W.; Jazizadeh, F. Vision-based thermal comfort quantification for HVAC control. Build. Environ. 2018, 142, 513–523. [Google Scholar] [CrossRef]
- Murakami, Y.; Terano, M.; Mizutani, K.; Harada, M.; Kuno, S. Field experiments on energy consumption and thermal comfort in the office environment controlled by occupants’ requirements from PC terminal. Build. Environ. 2007, 42, 4022–4027. [Google Scholar] [CrossRef]
- Jung, W.; Jazizadeh, F. Human-in-the-loop HVAC operations: A quantitative review on occupancy, comfort, and energy-efficiency dimensions. Appl. Energy 2019, 239, 1471–1508. [Google Scholar] [CrossRef]
- Ryu, J.H.; Hong, W.H.; Seo, H.; Seo, Y.K. Determination of an acceptable comfort zone for apartment occupants in South Korea: An empirical analysis of cooling operation. Build. Environ. 2017, 125, 484–501. [Google Scholar] [CrossRef]
- Korea Legislation Research Institute. Korean Building Act 11.1. Regulation for Facility in Buildings. Available online: https://elaw.klri.re.kr/eng_service/lawView.do?hseq=31602&lang=ENG (accessed on 1 November 2020).
- National Climate Data Center, Meteorological Office. Climate Characteristics Analysis Data. Available online: http://sts.kma.go.kr (accessed on 10 June 2019).
- ASHRAE 55. Thermal Environmental Conditions for Human Occupancy; ASHRAE: Peachtree Corners, GA, USA, 2020. [Google Scholar]
- ASHRAE 55. The Design of Sustainable Buildings for Occupant Comfort; ASHRAE: Peachtree Corners, GA, USA, 2020. [Google Scholar]
- ISO Standard 10551. Ergonomics of the Physical Environment—Subjective Judgement Scales for Assessing Physical Environments; ISO: Geneva, Switzerland, 2019. [Google Scholar]
- Humphreys, M.; Rijal, H.; Nicol, J. Updating the adaptive relation between climate and comfort indoors; new insights and an extended database. Build. Environ. 2013, 63, 40–55. [Google Scholar] [CrossRef]
- Heidari, S.; Sharples, S. A comparative analysis of short-term and long-term thermal comfort surveys in Iran. Energy Build. 2002, 34, 607–614. [Google Scholar] [CrossRef]
- Rijal, H.B.; Honjo, M.; Kobayashi, R.; Nakaya, T. Investigation of comfort temperature, adaptive model and the window-opening behaviour in Japanese houses. Arch. Sci. Rev. 2013, 56, 54–69. [Google Scholar] [CrossRef]
- Nakaya, T.; Matsubara, N.; Kurazumi, Y. A field study of thermal environment and thermal comfort in Kansai region, Japan: Neutral temperature and acceptable range in summer. J. Environ. Eng. 2005, 70, 51–56. [Google Scholar] [CrossRef] [Green Version]
- Honjo, M.; Rijal, H.B.; Kobayashi, R.; Nakaya, T. Investigation of the Comfort Temperature and Adaptive Model in Japanese Houses. In Proceedings of the 7th Windsor Conference: The Changing Context of Comfort in an Unpredictable World Cumberland Lodge, Windsor, UK, 12–15 April 2012; Network for Comfort and Energy Use in Buildings: London, UK, 2013. [Google Scholar]
- Yoshimura, S.; Rijal, H.B.; Kikuchi, S. Research on the comfort temperature and the adaptive model of houses. AIJ Kanto Chapter Archit. Res. Meet. 2012, 82, 113–116. [Google Scholar]
- Rijal, H.B.; Yoshida, H.; Umemiya, N. Seasonal and regional differences in neutral temperatures in Nepalese traditional vernacular houses. Build. Environ. 2010, 45, 2743–2753. [Google Scholar] [CrossRef]
- Rijal, H.B.; Stevenson, F. Thermal comfort in UK housing to avoid overheating: Lessons from a ‘zero carbon’ case study. In Proceedings of the Conference: Adapting to Change: New Thinking on Comfort, Windsor, UK, 9–11 April 2010; Network for Comfort and Energy Use in Buildings: London, UK, 2010. [Google Scholar]
- Rangsiraksa, P. Thermal Comfort in Bangkok Residential Buildings, Thailand. In Proceedings of the PLEA2006 23rd Conference on Passive and Low Energy Architecture, Geneva, Switzerland, 6–8 September 2006; pp. 541–546. [Google Scholar]
- Udaykumar, A.; Rajasekar, E.; Venkateswaran, R. Thermal comfort characteristics in naturally ventilated, residential apartments in a hot-dry climate of India. Indoor Built Environ. 2015, 24, 101–115. [Google Scholar] [CrossRef]
- Feriadi, H.; Wong, N.H. Thermal comfort for naturally ventilated houses in Indonesia. Energy Build. 2004, 36, 614–626. [Google Scholar] [CrossRef]
- Han, J.; Zhang, G.; Zhang, Q.; Zhang, J. Field study on adaptive thermal comfort and residential thermal environment in a hot humid climate of China. Build. Environ 2007, 42, 4043–4050. [Google Scholar] [CrossRef]
- de Dear, R.; Kim, J.; Parkinson, T. Residential adaptive comfort in a humid subtropical climate—Sydney Australia. Energy Build. 2018, 158, 1296–1305. [Google Scholar] [CrossRef]
- Nicol, F.; Roaf, S. Pioneering new indoor temperature standards: The Pakistan project. Energy Build. 1996, 23, 169–174. [Google Scholar] [CrossRef]
- Damiati, S.A.; Zaki, S.A.; Rijal, H.B.; Wonorahardjo, S. Field study on adaptive thermal comfort in office buildings in Malaysia, Indonesia, Singapore, and Japan during hot and humid season. Build. Environ. 2016, 109, 208–223. [Google Scholar] [CrossRef]
- Indraganti, M.; Ooka, R.; Rijal, H.B. Thermal comfort in offices in summer: Findings from a field study under the ‘setsuden’ conditions in Tokyo, Japan. Build. Environ. 2013, 61, 114–132. [Google Scholar] [CrossRef]
- Indraganti, M.; Boussaa, D. Comfort temperature and occupant adaptive behavior in offices in Qatar during summer. Energy Build. 2017, 150, 23–36. [Google Scholar] [CrossRef]


| Block | District (gu/gun) | Household Area/ Experimental Area (m2) | HVAC Specifications | Mode | Measurement Period | |||
|---|---|---|---|---|---|---|---|---|
| Air-Conditioning System | Energy Recovery Ventilation System | |||||||
| Cooling Capacity (kW) | Cooling Area (m2) | Air Volume (CMH) | Cooling Temperature, Heat Transfer Efficiency (%, %) | |||||
| A1 | Jung | 113/40.68 | 6.5 | 52.8 | 150 | 70, 40 | OC 1 | 25 June 2015–27 June 2015 |
| CC 1 | 28 June 2015–30 June 2015 | |||||||
| A2 | Buk | 127/38.91 | 7.2 | 58.5 | 250 | 65, 35 | OC | 6 July 2015–8 July 2015 |
| CC | 9 July 2015–11 July 2015 | |||||||
| A3 | Dalseong | 106/38.16 | 6.0 | 48.8 | 150 | 70, 40 | OC | 20 July 2015–22 July 2015 |
| CC | 23 July 2015–25 July 2015 | |||||||
| A4 | Dong | 135/43.21 | 8.1 | 65.9 | 250 | 65, 35 | OC | 4 August 2015–6 August 2015 |
| CC | 7 August 2015–9 August 2015 | |||||||
| A5 | Dalseong | 82/35.28 | 5.2 | 42.3 | 150 | 75, 55 | OC | 28 June 2016–30 June 2016 |
| CC | 1 July 2016–3 July 2016 | |||||||
| A6 | Dong | 126/38.30 | 7.2 | 58.5 | 250 | 70, 50 | OC | 11 July 2016–13 July 2016 |
| CC | 14 July 2016–16 July 2016 | |||||||
| A7 | Dalseo | 165/47.88 | 9.0 | 81.8 | 360 | 70, 50 | OC | 25 July 2016–27 July 2016 |
| CC | 28 July 2016–30 July 2016 | |||||||
| A8 | Dalseong | 97/34.92 | 5.2 | 42.3 | 150 | 75, 55 | OC | 8 August 2016–10 August 2016 |
| CC | 11 August 2016–13 August 2016 | |||||||
| A9 | Nam | 109/37.24 | 6.5 | 50.2 | 250 | 70, 50 | OC | 10 July 2017–12 July 2017 |
| CC | 13 July 2017–15 July 2017 | |||||||
| A10 | Dalseo | 78/30.31 | 5.2 | 40.8 | 150 | 65, 35 | OC | 24 July 2017–26 July 2017 |
| CC | 27 July 2017–29 July 2017 | |||||||
| A11 | Susung | 162/43.09 | 9.0 | 81.8 | 360 | 55, 35 | OC | 7 August 2017–9 August 2017 |
| CC | 11 August 2017–13 August 2017 | |||||||
| No. of Occupants | Age (Year) | Height (m) | Weight (kg) | Clothing Insulation (clo) | ||||||
|---|---|---|---|---|---|---|---|---|---|---|
| Male | Female | Male | Female | Male | Female | Male | Female | Male | Female | |
| A1 | 2 | 2 | 43 (22.62) 1 | 43 (19.79) | 1.69 (1.41) | 1.59 (4.97) | 63 (1.41) | 55 (7.07) | 0.47 (0.03) | 0.52 (0.03) |
| A2 | 2 | 2 | 43 (26.87) | 45 (21.21) | 1.75 (3.53) | 1.61 (2.12) | 72.5 (3.53) | 60 (7.07) | 0.49 (0.01) | 0.51 (0.01) |
| A3 | 2 | 3 | 30 (4.24) | 30.33 (2.30) | 1.75 (7.77) | 1.62 (2.51) | 70 (11.31) | 57.33 (4.61) | 0.48 (0.04) | 0.50 (0.01) |
| A4 | 2 | 3 | 40.5 (26.16) | 37 (18.35) | 1.75 (9.89) | 1.64 (3.21) | 72.5 (10.60) | 60.66 (6.65) | 0.49 (0.01) | 0.51 (0.04) |
| A5 | 3 | 3 | 38 (6.24) | 38 (18.24) | 1.75 (2.08) | 1.60 (9.59) | 69.66 (4.72) | 56.33 (10.21) | 0.51 (0.01) | 0.50 (0.01) |
| A6 | 2 | 4 | 42.5 (19.09) | 32.5 (11.78) | 1.76 (5.65) | 1.64 (6.60) | 90 (0) | 58.5 (7.85) | 0.49 (0.07) | 0.50 (0.03) |
| A7 | 3 | 2 | 38 (19.05) | 30 (1.41) | 1.75 (5.03) | 1.60 (3.53) | 71.66 (10.59) | 52.5 (10.60) | 0.47 (0.03) | 0.51 (0.01) |
| A8 | 2 | 3 | 48 (19.79) | 41 (18.24) | 1.71 (1.41) | 1.59 (5.56) | 71.5 (9.19) | 55 (5) | 0.52 (0.02) | 0.52 (0.03) |
| A9 | 1 | 3 | 62 | 39 (14.16) | 1.69 | 1.58 (0.47) | 68.3 | 54 (4.54) | 0.52 | 0.53 (0.02) |
| A10 | 2 | 2 | 45 (17.0) | 42.5 (12.50) | 1.80 (2.0) | 1.61 (0.50) | 66.5 (1.50) | 61.5 (1.50) | 0.50 (0.03) | 0.52 (0.02) |
| A11 | 3 | 2 | 46.3 (16.1) | 52 (13) | 1.74 (1.24) | 1.58 (3.0) | 74 (4.92) | 51.5 (1.5) | 0.47 (0.02) | 0.53 (0.01) |
| Description | Instrument/ Sensor | Parameter | Range | Accuracy | Resolution |
|---|---|---|---|---|---|
| Data logger | TR-72Ui | Air temperature (°C) | −10–60 °C | ±0.3 °C | 0.1 °C |
| RH (%) | 10–95% RH | ±5% | 1% RH | ||
| Amenity Meter: PMV evaluation | AM-101 | Air temperature (°C) | 0–50 °C | ±0.5 °C (at 15–35 °C) | 0.1 °C |
| Globe temperature (°C) | 0–50 °C | ±1.0 °C (at 15–35 °C) | 0.1 °C | ||
| Convection temperature (°C) | 0–50 °C | from ISO 7726 | 0.1 °C | ||
| RH (%) | 10–90% RH | ±3% RH (at 20–80% RH) | 1% RH | ||
| Air velocity (m/s) | 0–1 m/s | ±0.1 m/s | 0.1 m/s | ||
| 1–5 m/s | ±0.5 m/s | 0.1 m/s | |||
| Amount of clothing (clo) | 0–2 | - | 0.1 clo | ||
| Metabolic rate (met) | 0.8–4.0 | - | 0.1 met | ||
| PMV 1 | −3–+3 | - | 0.01 | ||
| PPD 1 | 0–100% | - | 0.1% | ||
| CO2 evaluation | TESTO 435 | CO2 level | 0–5000 ppm CO2 | ± (500 ppm CO2 ± 3% of mv) | 1 ppm |
| 5000–10,000 ppm CO2 | ± (100 ppm CO2 ± 2% of mv) | 1 ppm |
| Description | Time Interval | Each (EA) | Measuring Locations | Measuring Heights | |
|---|---|---|---|---|---|
| Data logger | 5 min | 8 | Outdoor | ||
| Indoor | The middle point of the living space | 1.1 m above ground level (Near the head when occupants are seated) | |||
| A distance of 1 m from the Air-conditioning system | |||||
| A distance of 3 m from the Air-conditioning system | |||||
| Outlet of the ERV 1 system (1) | |||||
| Outlet of the ERV system (2) | |||||
| Outlet of the ERV system (3) | |||||
| Outlet of the ERV system (4) | |||||
| PMV evaluation | 5 min | 1 | Indoor | The middle point of the living space | |
| CO2 evaluation | 5 min | 1 | Indoor | The middle point of the living space | |
| TSV, CSV check point | 5 min | - | Indoor | The middle point of the living space | - |
| Adaptive behavior | Every moment | - | Indoor | At the point where adaptive behavior occurs | - |
| (a) TSV | ||||||
| −3 | −2 | −1 | 0 | 1 | 2 | 3 |
| Cold | Cool | Slightly cool | Neutral | Slightly warm | Warm | Hot |
| (b) CSV | ||||||
| 1 | 2 | 3 | 4 | 5 | 6 | 7 |
| Very comfortable | Comfortable | Slightly comfortable | Neutral | Slightly uncomfortable | Uncomfortable | Very uncomfortable |
| Thermal Sensation Vote (TSV) | Comfort Sensation Vote (CSV) | ||||
|---|---|---|---|---|---|
| Occupant Control Mode | Comfort-Zone Control Mode | Occupant Control Mode | Comfort-Zone Control Mode | ||
| Temperature | Pearson’s correlation coefficient | 0.619 | 0.746 | 0.457 | 0.748 |
| p-value | 0.000 | 0.000 | 0.000 | 0.000 | |
| N | 218 | 201 | 218 | 201 | |
| Relative Humidity | Pearson’s correlation coefficient | 0.295 | 0.546 | 0.102 | 0.542 |
| p-value | 0.000 | 0.000 | 0.132 | 0.000 | |
| N | 218 | 201 | 218 | 201 | |
| CO2 | Pearson’s correlation coefficient | −0.218 | −0.315 | 0.159 | −0.309 |
| p-value | 0.001 | 0.000 | 0.019 | 0.000 | |
| N | 218 | 201 | 218 | 201 | |
| Control Method | Adaptive Behaviors | Percentage (%) |
|---|---|---|
| Occupant Control | The behaviors of improving thermal environment (AC) | 67.1 |
| The behaviors of improving ventilation (ERV or windows) | 26.5 | |
| Non-behavior | 6.4 | |
| Comfort-zone Control | The behaviors of improving thermal environment (AC) | 47.1 |
| The behaviors of improving ventilation (ERV) | 23.5 | |
| Non-behavior | 29.4 |
| Mode | Dependent Variable | Independent Variable | B | R2 | T | P | VIF |
|---|---|---|---|---|---|---|---|
| Occupant Control mode | TSV 1 | (constant) | −10.975 | ||||
| Top 1 | 0.391 | 0.384 | 11.597 | 0.000 | 1.000 | ||
| CSV 1 | (constant) | −4.6786 | |||||
| Top | 0.322 | 0.209 | 7.554 | 0.000 | 1.000 | ||
| Comfort-zone Control mode | TSV | (constant) | −11.256 | ||||
| Top | 0.379 | 0.557 | 15.821 | 0.000 | 1.000 | ||
| CSV | (constant) | −1.840 | |||||
| Top | 0.192 | 0.529 | 14.961 | 0.000 | 1.000 |
| Authors | Country | Building Type | Season of Experiment | N | Tc (°C) 1 |
|---|---|---|---|---|---|
| Heidari and Sharples [49] | Iran | Residential | Summer (July, August) | - | 28.4 |
| Rijal et al. [50] | Japan | Residential | Summer | 13,471 | 26.1 |
| Nakaya et al. [51] | Japan | Residential | Summer | 70 | 27.6 |
| Katsuno et al. [52] | Japan | Residential | Summer | 1093 | 27.1 |
| Yoshimura et al. [53] | Japan | Residential | Summer | - | 29.1 |
| Rijal et al. [54] | Nepal | Residential | Summer | 103 | 21.1–30.0 |
| Rijal and Stevenson [55] | UK | Residential | Summer | 235 | 22.9 |
| Rangsiraksa [56] | Thailand | Residential | Summer | 687 | 25.2 |
| Anupama et al. [57] | India | Residential | Summer | - | 27.4 |
| Feriadi and Wong [58] | Indonesia | Residential | Summer | 525 | 29.1 |
| Han et al. [59] | China | Residential | Summer | 110 | 28.6 |
| de Dear et al. [60] | Australia | Residential | Summer | 1525 | 22–24 |
| Nicol and Roaf [61] | Pakistan | Residential, office | Summer | 4927 | 28.2 |
| Damaiti et al. [62] | Malaysia | Office | Summer (March, April, May) | 1114 | 25.6 |
| Indraganti et al. [63] | Japan | Office | Summer (July, August, September) | 1979 | 26.4 |
| Damaiti et al. [64] | Singapore | Office | Summer (January) | 14 | 26.4 |
| Mustapa et al. [1] | Japan | Office | Summer (August) | 222 | 26.6 |
| Damaiti et al. [62] | Japan | Office | Summer (September) | 418 | 25.8 |
| Madhavi et al. [64] | Qatar | Office | Summer | 1850 | 24.2 |
| Damaiti et al. [62] | Indonesia | Office | Summer (February, March) | 91 | 26.3 |
Publisher’s Note: MDPI stays neutral with regard to jurisdictional claims in published maps and institutional affiliations. |
© 2021 by the authors. Licensee MDPI, Basel, Switzerland. This article is an open access article distributed under the terms and conditions of the Creative Commons Attribution (CC BY) license (https://creativecommons.org/licenses/by/4.0/).
Share and Cite
Ryu, J.; Kim, J. Effect of Different HVAC Control Strategies on Thermal Comfort and Adaptive Behavior in High-Rise Apartments. Sustainability 2021, 13, 11767. https://doi.org/10.3390/su132111767
Ryu J, Kim J. Effect of Different HVAC Control Strategies on Thermal Comfort and Adaptive Behavior in High-Rise Apartments. Sustainability. 2021; 13(21):11767. https://doi.org/10.3390/su132111767
Chicago/Turabian StyleRyu, Jihye, and Jungsoo Kim. 2021. "Effect of Different HVAC Control Strategies on Thermal Comfort and Adaptive Behavior in High-Rise Apartments" Sustainability 13, no. 21: 11767. https://doi.org/10.3390/su132111767