Article

Global Seafood Trade: Insights in Sustainability Messaging and Claims of the Major Producing and Consuming Regions

1
Institute of Aquaculture, Faculty of Natural Science, University of Stirling, Stirling FK9 4LA, UK
2
Perfect Food Consulting srl, Via Raffaello Morghen 5, 10143 Torino, Italy
3
Global Academy of Agriculture and Food Security, The Royal (Dick) School of Veterinary Studies, Easter Bush Campus, University of Edinburgh, Midlothian EH25 9RG, UK
4
Department of Hygiene and Preventive Medicine, Faculty of Veterinary Medicine, Kafrelsheikh University, Kafrelsheikh 33516, Egypt
5
Key Laboratory of South China Sea Fishery Resources Exploitation & Utilization, South China Sea Fisheries Research Institute, Chinese Academy of Fishery Sciences, Ministry of Agriculture, Guangzhou 510300, China
6
College of Fisheries and Life Science, Shanghai Ocean University, Shanghai 201306, China
7
Faculty of Arts and Humanities, University of Stirling, Stirling FK9 4LA, UK
8
School for the Environment, University of Massachusetts Boston, Boston, MA 02125, USA
*
Author to whom correspondence should be addressed.
Sustainability 2021, 13(21), 11720; https://doi.org/10.3390/su132111720
Submission received: 22 July 2021 / Revised: 15 October 2021 / Accepted: 17 October 2021 / Published: 23 October 2021
(This article belongs to the Collection Advertising and Sustainable Development)

Abstract

:
Seafood supply chains are complex, not least in the diverse origins of capture fisheries and through aquaculture production being increasingly shared across nations. The business-to-business (B2B) seafood trade is supported by seafood shows that facilitate networking and act as fora for signaling of perceptions and values. In the Global North, sustainability related certifications and messaging have emerged as an important driver to channel the demands of consumers, institutions, and lead firms. This study investigates which logos, certifications, and claims were presented at the exhibitor booths within five seafood trade shows in China, Europe, and USA. The results indicate a difference in the way seafood is advertised. Messaging at the Chinese shows had less of an emphasis on sustainability compared to that in Europe and the USA, but placed a greater emphasis on food safety and quality than on environmental concerns. These findings suggest cultural differences in the way seafood production and consumption is communicated through B2B messaging. Traders often act as choice editors for final consumers. Therefore, it is essential to convey production processes and sustainability issues between traders and the market. An understanding of culture, messaging strategies, and interpretation could support better communication of product characteristics such as sustainability between producers, traders, and consumers.

1. Introduction

Global seafood apparent consumption per capita increased from 9.96 kg in 1961 [1] to 20.50 kg in 2018 [2]. The demand for high-value species such as salmonids, shrimps, and prawns has shown some of the greatest growth as a result of the growing appetite in OECD countries, and also rising income levels and urbanization fueling demand in emerging markets [3]. New players have emerged in global trade with significant global influence, such as Thailand and China, while exports from South America and Asia have also increased [4]. Capture fisheries and aquaculture produced 179 million metric tonnes (MMT) in 2018 with an estimated value of USD 401 billion, from which aquaculture produced 82 MMT at a value of USD 250 billion [2]. China and the rest of Asia are the largest seafood producers with market shares of 34% and 35%, respectively [2]. Europe (EU-28) represents one of the largest markets for seafood products and is highly dependent on imports to the EU market [5,6], as domestic production from local (EU member states) capture fisheries and aquaculture produced only 28% and 9% of the EU supply (14.61 MMT, live weight equivalent) in 2017, respectively [7]. Seafood was most commonly imported from Norway, representing more than one-quarter of seafood products imported into the EU [7]. The USA also shows a dependency on imports, with estimates ranging from approximately 62% up to 90% of domestic supply. This could be partly explained by the complex supply chains and the role of important seafood trading partners such as China, which imports a third of US seafood exports, from which a proportion is shipped back to the USA after being processed [8]. Europe and North America produce a relatively small proportion of global seafood, but they account for approximately 63% of the global certified seafood destined for retail markets. In contrast, Asia which produces 69% of the global seafood supply, accounts for only 11% of global certified seafood production [9].
The global seafood trade is not only driven by consumer demands and lead firms but is highly affected by the multi-polarity between producing and consuming regions and their respective cultural values [10]. The diversity of culture and economic status indicates different value and quality perceptions between the major producers and consumers in the Global South and North, respectively [10,11,12]. While China is a key player in global production, consumption, and trade of seafood [13], it is also the largest aquaculture producer in the world in terms of volume [14]. Additionally, an increasingly large proportion of seafood is imported into China, which creates a diverse market for Chinese and global stakeholders [15]. Chinese exports of diversified products indicate an economic opportunity, but the sustainability criteria could be challenging [15]. Alternative markets (e.g., eco-certification) in the Global North and emerging southern domestic seafood markets align with differing consumer perceptions and demands [10,11,16].
Concerns about the sustainability of seafood production have led to the introduction of ecolabels in an effort to reward good practices with price premiums, while producers exhibiting bad practices could be excluded from more lucrative markets [17,18,19]. Ecolabels fulfil an important role to guide consumers and the general public to make sustainability choices [20]. However, sustainability certification is largely focused on capture fisheries, with 80% of certified seafood being wild catch. The historical dominance of wild catch certification over aquaculture certification can be explained by rising awareness in Western markets of declining wild fish stock levels [9], and concerns related to the illegal, unreported, and unregulated fishing (IUU), and associated socioeconomic and environmental impacts [21]. Such issues led to the introduction of the Marine Stewardship Council (MSC) in 1997 [22,23], which is more recognized in the US and Europe compared to other continents where environmental awareness is now increasing and similar labels are being introduced [24,25,26,27,28].
Over the past decade, certified aquaculture production has grown twice as fast as certified wild catch volumes [9]. The relative growth of aquaculture production certification is reflected by supply constraints and the growing importance of aquaculture production in fulfilling global demand for seafood [9]. Examples of widespread aquaculture certification schemes are the Global Good Agricultural Practices (GlobalG.A.P.) committed to good agriculture, livestock, and aquaculture farm practices; Best Aquaculture Practices (BAP), developed by the Global Aquaculture Alliance (GAA), promoting responsible practices across farms, feed mills, hatcheries, and processing facilities; and the Aquaculture Stewardship Council (ASC), aiming to determine adequate environmental sustainability and to raise the global standards of responsible aquaculture [29]. Nevertheless, the literature indicates that Chinese governance, traders, and consumers have a greater emphasis on food safety, traceability, quality, and freshness, rather than environmental sustainability [30]. This is evidenced by national labeling programs that often are not as rigorous as the global (voluntary) programs [31]. Additionally, a systematic review by Carlucci et al. [32] on consumer purchasing behavior in developed countries indicates variability of perceptions towards seafood production, consumption, and attitudes towards food safety, product form, and sustainability. More specifically, country of origin, production method, preservation method, packaging, product innovation, and ecolabeling are considered most relevant in affecting consumers’ choices. Carlucci et al. [32] highlighted that fish and seafood are still mainly sold unbranded and unlabeled, but that it would be interesting to investigate the impact of sustainability, health, and nutritional claims on consumer behavior. Nevertheless, it is relatively unknown to what extent this has been influenced or picked up by the global seafood traders. A better understanding of consumer preferences and alignment of trade messaging strategies would facilitate trade between stakeholders. The importance of seafood as a globally traded commodity has led to international trade shows being crucial to the initiation and maintenance of business relationships. Such seafood shows are fora for agents of both producers and consumers, and locations where communication, in time and space, is intense and business deals brokered. Communicating product qualities from a standardized seafood exhibitor booth is necessarily constrained, and we hypothesized a study of logos and words would inform understanding of key communication strategies. We visited five international seafood shows in the USA (Boston), Belgium (Brussels), and China (Guangzhou, Qingdao and Shanghai) and reviewed messaging displayed at the booths for terms specific to sustainability, health, and food safety. Given the global trade in seafood, one would expect there to be no difference in messaging across the different shows (our null hypothesis). Alternatively, if there were regional differences in the importance of sustainability, health, and safety, then differences in messaging should appear across the different shows.

2. Methodology

In this study, a cross-sectional survey was conducted at five seafood shows in the major producing and consuming regions to gain understanding of the type of business-to-business messaging and virtue signaling by seafood traders on a global level. Specific data were collected to gain an understanding of the main messaging strategies, namely the type of logos and words used by different exhibitor booths from Africa, Asia, China, Europe (geographical), Latin America (LA), North America (NA), and Oceania.

2.1. Survey Design

The target population were seafood exhibitor booths at business-to-business seafood shows in the USA (Boston), Belgium (Brussels), and China (Guangzhou, Qingdao and Shanghai) (Table 1) in 2019. The details of the study population (companies represented by exhibitor booth(s)) were obtained from the website of the seafood show event. Exhibitor booths active in, e.g., logistics and processing equipment were excluded from the list since their messaging strategy is focused on themes other than seafood sales or purchases, such as processing efficiency. Our sample size was calculated based on the assumption that 50% of the exhibitors were using the type of messaging in the form of logos and words with 95% confidence level and 8% accepted error level (precision) [33]. The population was then stratified by country, using probability proportion to size (PPS) and simple random sampling.
The survey tool was developed in the English language and was piloted at the Boston seafood show then optimized for Brussels. It was then translated to Chinese by WZ and CZ for use at the Guangzhou, Qingdao, and Shanghai seafood shows. This was a passive survey in that the data collected were from text and logos observed at the exhibitor booths. Direct observation of human activity is a necessary and important methodology in marketing research, according to Lee and Broderick [38]. Our motivation for an observational research method was (1) practical—interview with salespeople at such busy shows is unproductive, (2) cultural—neutral and consistent method for the observational researcher with different cultural backgrounds assessing booths from different nationalities at different shows, (3) sales booths are designed to display messages. Employees at the booths were not asked any direct questions during the collection of these data. The following data were collected: country of origin, companies’ activities, followed by observations of booth contents aimed at identifying messaging in the form of logos and/or words displayed at the exhibitor booths. More specifically, the focus was on messages related to sustainability (socioeconomic and environmental spectrum), quality, health characteristics, food safety, and provenance of the product (Supplementary Info (SI) Data—5 Seafood Shows). It is important to note that all the messaging strategies (logos and words) from the sampled booths were noted, but it was not possible by visual observation to verify their veracity. In other terms, exhibitors were not asked whether their logos and words were supported by certification or not. This also accounts for the use of certain advertising words, which could be restricted by, e.g., China’s Advertising Law prohibiting superlatives and false and misleading content [39]. In these cases, the display of certain logos and words is often due to the needs of specific buyers to use them, while their absence is generally due to policy restrictions. The causes of this possible non-conformity between message and actual certification have not been investigated, but we only recorded what was displayed.

2.2. Resolution

Data were collected on a country level and converted to a continent/area level. In this case all countries were categorized under the major continents/areas, e.g., Africa, Asia, Europe (geographical), Latin America (LA), North America (NA), and Oceania. China was categorized separately (not included in “Asia”), because of its large seafood production and associated international trade. Hong Kong was included in China, as it is an administrative region of China. However, the Taiwan province of China (as defined in FAO FishstatJ database) was considered Asian [40].
Europe (geographical) covers the following peninsulas: mainland Europe, Scandinavia, Iberia, Italy, and the Balkans, including the European Union (EU) member states, European Economic Area (EEA), and the British Isles. Russia was considered Europe (geographical) because most Russians live on the western side of Russia. Latin America (LA) was defined as all countries south of the USA, including Central America and South America.

2.3. Data Cleaning and Analysis

A high heterogeneity in message type was observed among seafood shows and exhibitor booths, therefore consistent data cleaning was necessary to homogenize similarities and eliminate non-relevant words and logos from the analysis (examples in SI Tables S1 and S2). For instance, the use of a combination of words could differ per exhibitor booth, while the type of messaging was the same (e.g., no-chemicals and chemical free). Moreover, unknown acronyms or logos were deleted from the analysis, such as ‘’SC’’ because the term was unknown and was not applicable to the non-American exhibitor booths. Any logos observed only once and of unknown meaning were removed. The words “fresh” and “delicious” were excluded from the analysis as they were not consistently assessed throughout the seafood shows, due to cultural differences between the researchers who surveyed the exhibitor booths. It was therefore important to gain understanding of the use and interpretation of these words, before observing them and including them in the analysis. For example, the term “fresh” is formed by two Chinese characters: xin (new) and xian (fresh) and seafood itself is also called 海 (hǎi: sea) 鲜 (xiān: fresh) in Mandarin. It is therefore no surprise to see that Chinese consumers use this term less at their exhibitor booths as freshness is already implied. Chinese consumers value “freshness” and prefer purchasing live fish, in contrast to, e.g., North European consumers who often prefer more processed products. As a result, Chinese do not sell seafood as “fresh”, because seafood consumption is already associated with “freshness”. Comparing the use of these words across shows could therefore give a skewed interpretation of the results.
The exhibitor booths and recorded data (seafood show, country, continent, messaging, logos, and words) were organized in an Excel sheet (Supplementary Info (SI) Data—5 Seafood Shows). Pivot tables were used to calculate the proportion of the total number of exhibitor booths at each show using some form of messaging, logos, words, or both. This was followed up by an analysis of the use of specific logos and words at a seafood show and exhibitor booth continent/area level. In case of the latter, results show the top 10 logos and words at a seafood show and exhibitor booth continent/area resolution.

2.4. Aggregated Logo and Word Categories

Exhibitor booths use different messaging strategies and themes to target customers interested in product sustainability, quality, safety, health, social aspects, and/or provenance. However, each exhibitor booth might use different quantities, types, and themes of words and logos depending on its country of origin, location of the seafood show, and nationality and product preferences of the customer. The categorization of the logos and words in aggregated groups provides insight into the type of “theme” messaging of the exhibitor booths across the different seafood shows.
The categorization into one or more themes was based on the available information on the website (main page or under “about”) of the certifier/logo. The logos presented in the exhibitor booths were categorized in five themes: “Sustainability/Environment”, “Quality”, “Safety”, “Health”, and “Provenance” (SI Table S2). Most of the logos were categorized perfectly under a single theme, except for a few which could be placed in several categories, e.g., Bureau Veritas. The major seafood certification labels (e.g., ASC, BAP, and MSC) were considered a “sustainability” theme. The booth was the experimental unit, so there was no additional value to display more than one logo within the “sustainability” theme. In other words, if ASC was displayed at one exhibitor booth, and another exhibitor booth displayed the ASC and MSC logo together, both booths covered the “sustainability” theme. Words were categorized in six themes: “Sustainability/Environment”, “Quality”, “Safety”, “Health”, “Provenance”, and “Social” (SI Table S3).

2.5. Statistics

Results were analyzed using Minitab® v18.1 statistical software package (Minitab Inc., Pennsylvania, USA). We used a chi-square test to explore if there was a significant difference in the frequency of use of a logo or word category between the five seafood shows (not between the exhibitor booth regions within a show). The frequency of each word and logo category (“sustainability/environment”, “quality”, and “safety”) was tested independently between the five seafood shows (SI Table S7).

3. Results

In total, we surveyed 984 exhibitor booths across five international seafood shows. In the following sections the results are presented and categorized under “Combination of Logo and Word Signaling”, and “Type of Messaging”.

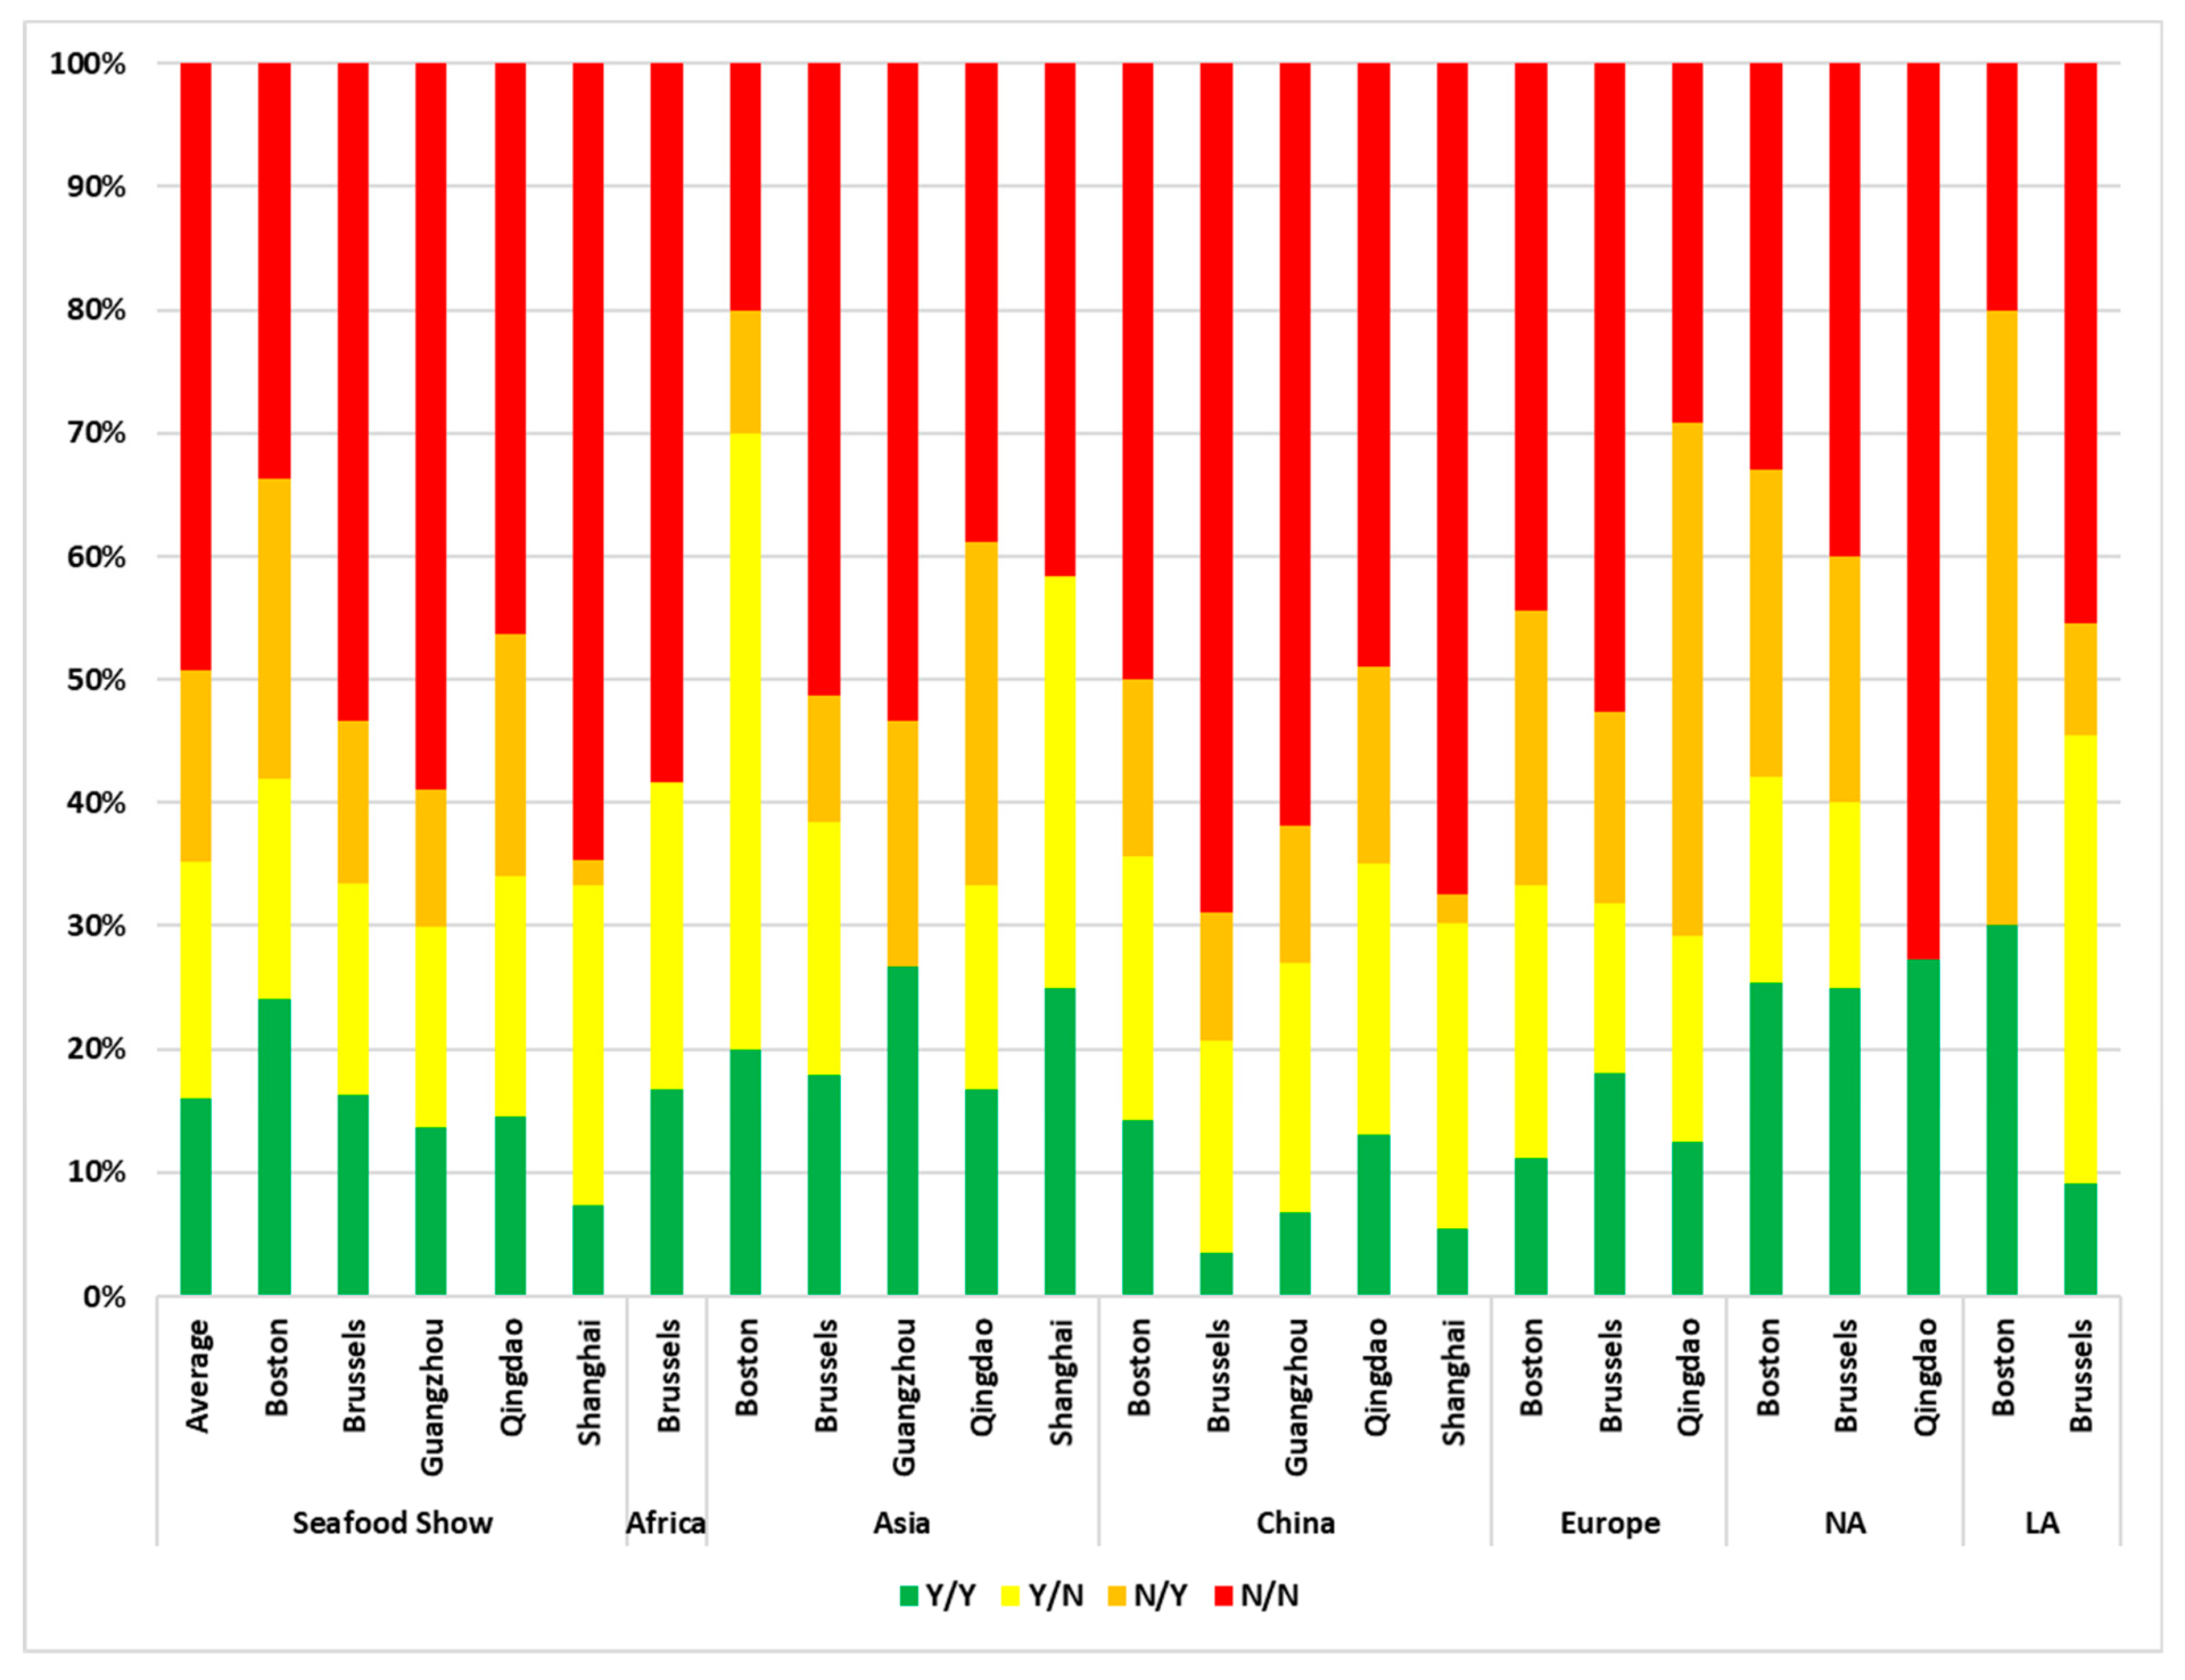
3.1. Combination of Logo and World Signaling

Across all seafood trade shows (average), 16% of the exhibitor booths displayed both a logo and a word at the same time (Y/Y), while 49% had no messaging at all (N/N) (Figure 1). The remainder used either a logo or word, but not both. The average use of a combination of logos and words was relatively similar to that at the Brussels and Qingdao shows, while Boston was at the higher end, and Shanghai at the lower end in terms of messaging in the form of logos and words. More specifically, Chinese exhibitor booths at Brussels, Guangzhou, and Shanghai were least likely to display both logos as well as words. The results also indicate that a relatively small share of exhibitor booths at Boston used neither logos nor words (N/N) compared to the other seafood shows, where N/N seemed to be more common.
The results (Figure 1) indicate that overall messaging seemed to be more present at the Boston seafood show compared to seafood shows in China. This trend was also observed at Chinese exhibitor booths across the seafood shows, which showed relatively less messaging (especially Y/Y) compared with the average (all exhibitor booth nationalities combined) across the five seafood shows. Interestingly, Asian (excluding China) exhibitor booths at each of the five seafood shows had relatively similar values compared with the average of the five seafood shows (all exhibitor booth nationalities combined), while these values were relatively higher than those of the Chinese exhibitor booths across the five shows.
Exhibitor booth messaging through both logos and words was most present at the Boston seafood show. On an exhibitor booth continent/area resolution, the use of both logos and words was dominated by Asian exhibitor booth holders at the Guangzhou and Shanghai seafood shows, NA exhibitor booth holders at Boston, Brussels, and Qingdao seafood shows, and LA exhibitor booth holders at the Boston show.

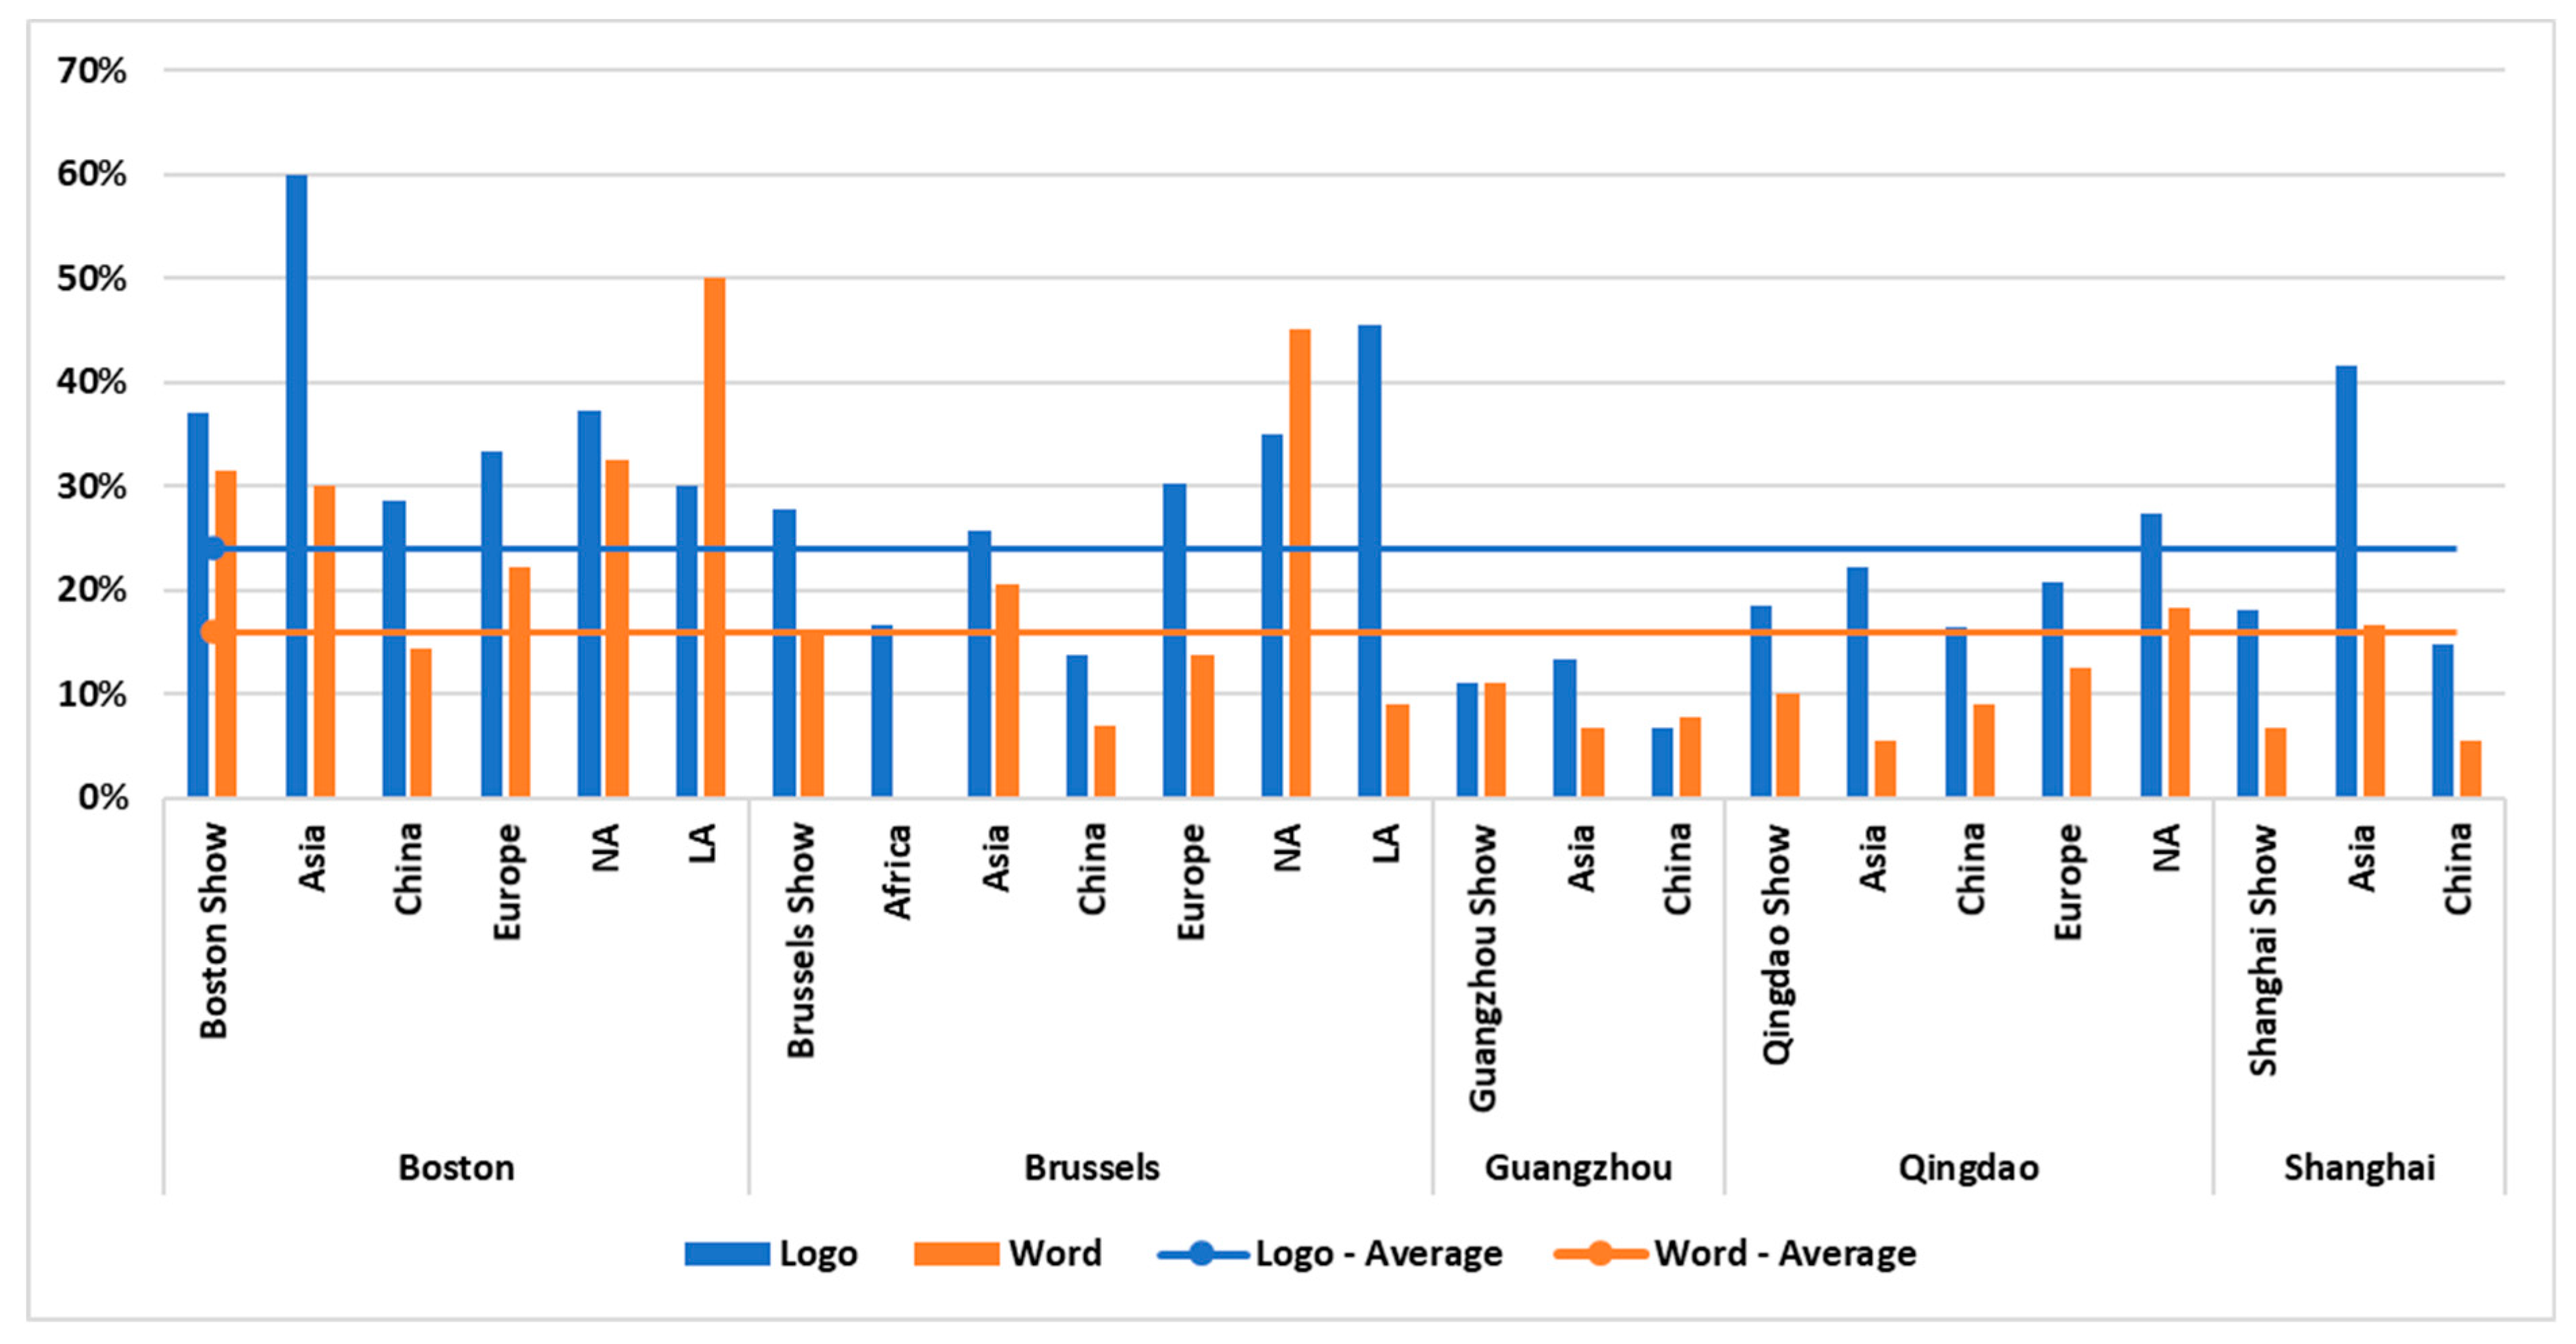
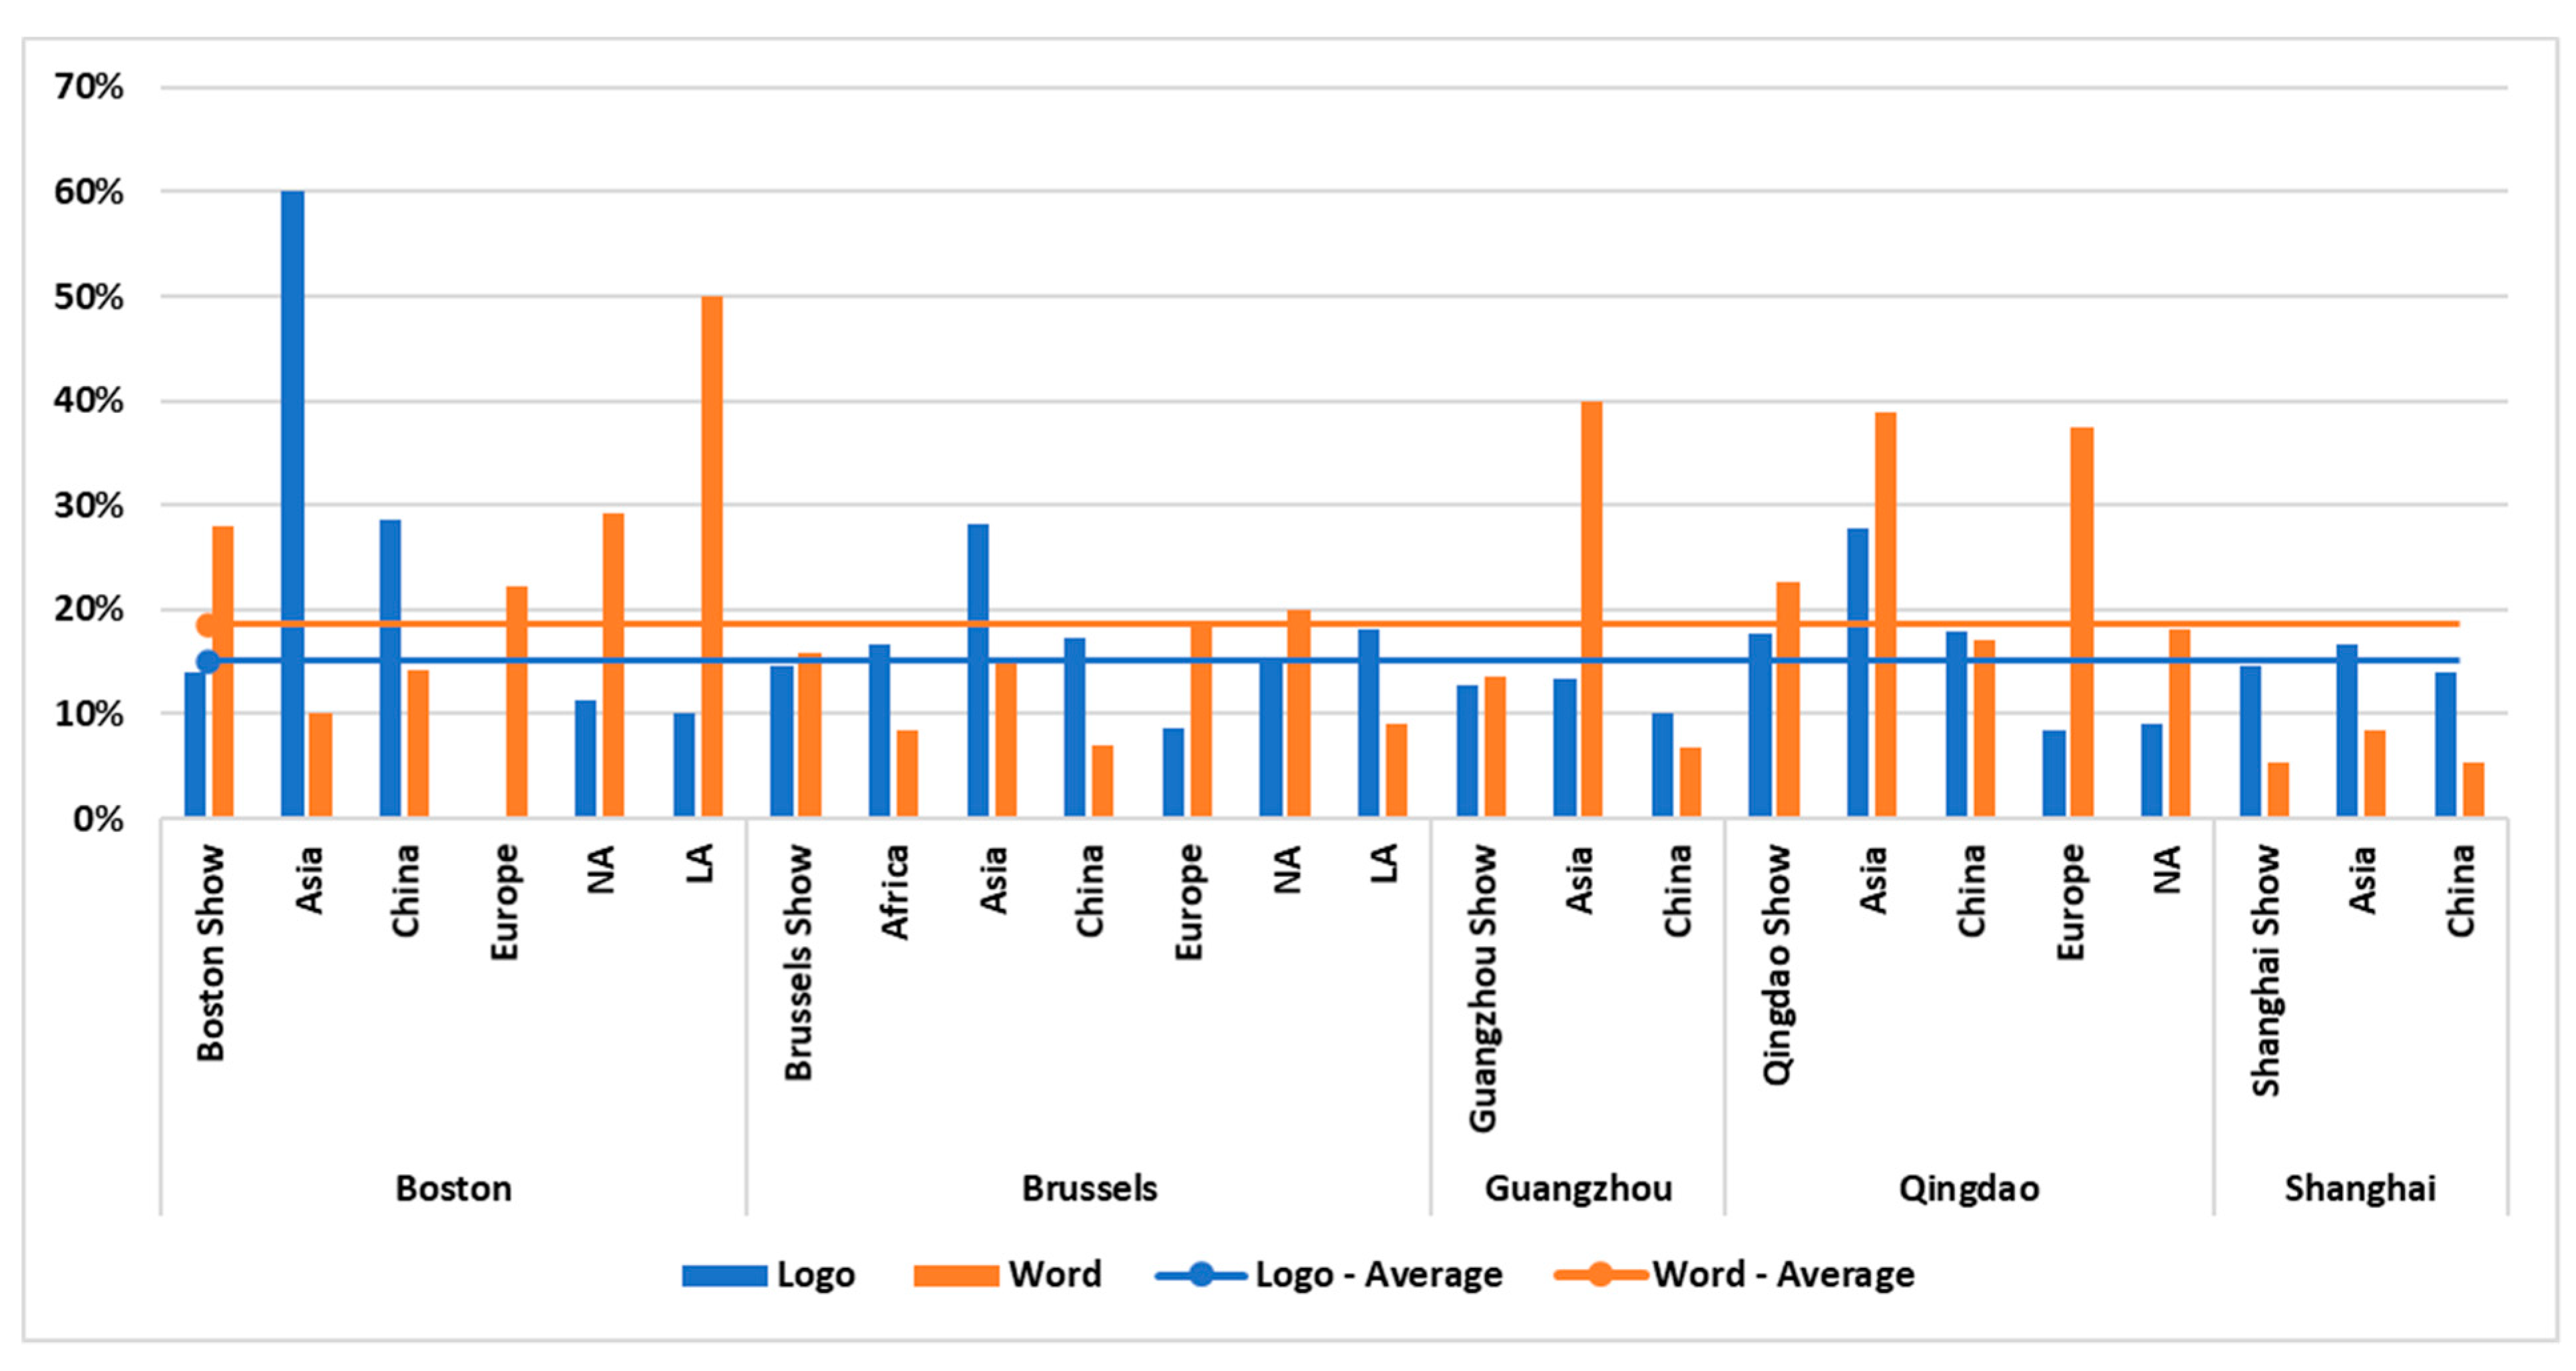
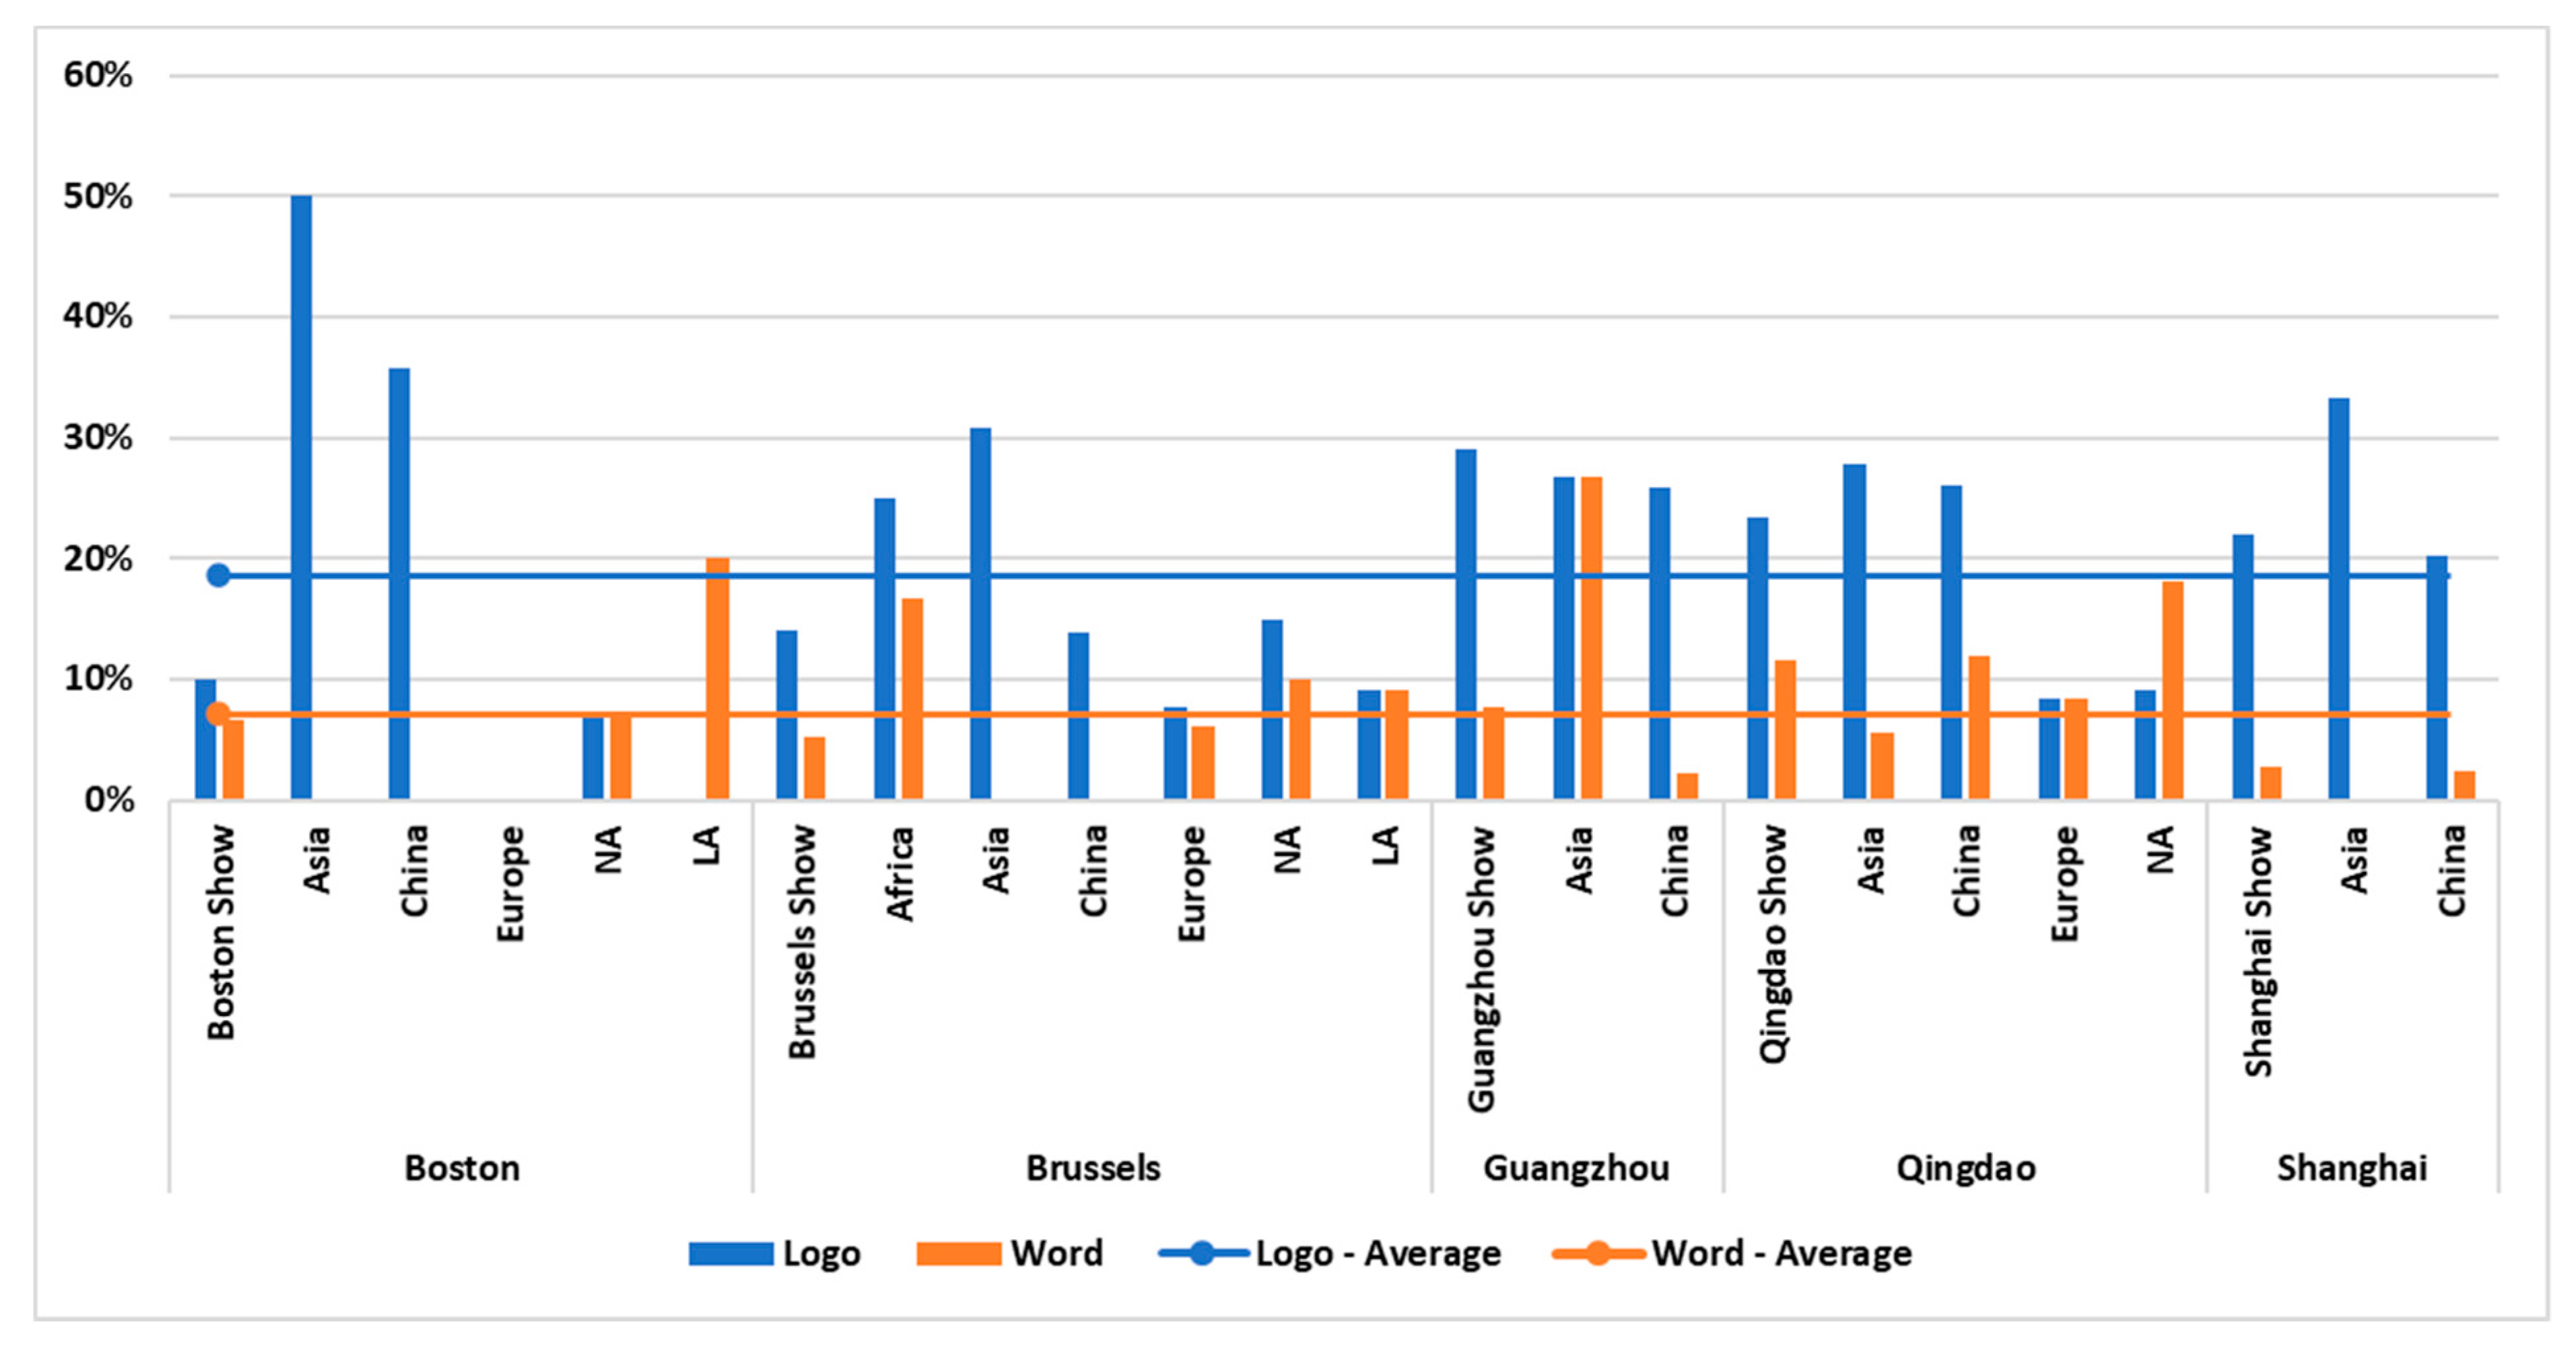
3.2. Type of Messaging

The Sustainability/Environmental messages were more present at the Boston and Brussels shows than at the Chinese shows (Figure 2, SI Figure S6a). Across all shows, “sustainability” logos were more prevalent than “sustainability” words, with the exception of Boston (LA), Brussels (NA), and Guangzhou (China). Overall, it seemed that Asian exhibitor booths exhibited relatively more “sustainability” category logos than words.
We found that there was a significant difference between the use of “sustainability” logos and “sustainability” words at the five seafood shows (Figure 2; DF = 4, p < 0.0001, SI Table S7). Overall, the use of “sustainability” logos (SI Table S4) was most commonly shown at the Boston and Brussels seafood shows. More specifically, “sustainability” logos, such as MSC, were present at 11% of all exhibitor booths across the five seafood shows (average), followed up by BRC (“quality” logo) and HACCP (“safety” logo) at 11% and 10%, respectively. The MSC logo was shown at 17% and 14% of the exhibitor booths at Boston and Brussels shows, respectively. For the Brussels show, the second most commonly shown logo was ASC (“sustainability” logo), which was present at 14% of the exhibitor booths, while the second most commonly shown logo at Boston was BAP (“sustainability” logo) (13%), with the ASC logo ranked 4th (7% of exhibitor booths).
A similar trend was observed with words such as “sustainability” (SI Table S5), which was shown at 21% and 10% of the exhibitor booths at the Boston and Brussels seafood shows. However, this was significantly different for most Chinese shows such as Guangzhou and Qingdao, where the word “quality” was shown at 7% and 5% of the exhibitor booths, respectively. This also explains the presence of “quality” at 9% of all exhibitor booths across the five seafood shows (average), followed by words such as “sustainability” and “natural” at 8% and 6%, respectively.
There was a significant difference between the presence of ‘‘quality” words but not between logos (p < 0.0001 and p > 0.7209, respectively) at the five shows (Figure 3; DF = 4). Asian and Chinese exhibitor booths across Boston and Brussels seafood shows were noted for a relatively high presence of the ‘‘quality” logo category, whereas for Asian exhibitor booths in Guangzhou and Qingdao, and European and NA exhibitor booths at Qingdao, the use of “quality” words compared to logos increased. Results indicate that European exhibitor booths use mostly words rather than logos to communicate quality across seafood shows. The most common “quality” logo across the shows (average) was BRC (SI Table S4) and the word “quality” itself was also common across all shows (average) (SI Table S5).
The frequency of logos and words related to “safety” was different between the five shows (Figure 4; DF = 4, p < 0.0001 and p < 0.0101, respectively). Overall, the category “safety” was most commonly shown at the Chinese seafood shows and Chinese and Asian exhibitor booths across all shows (Figure 4, SI Figure S6c). Interestingly, overall “safety” logos were more commonly shown compared to the category “safety” words. However, some exhibitor booths from NA, Europe, and LA seemed to use a more balanced presentation of words and logo categories. The top three logos included HACCP (13–20%) and ISO (9–11%) and these “safety” logos were most commonly shown at the Guangzhou, Qingdao, and Shanghai seafood shows (SI Table S4). The word “safety” was less common, shown at 2% of the exhibitor booths across all five seafood shows combined (SI Table S5).
The following categories were less commonly present at the exhibitor booths and are therefore briefly discussed (graphs included in the SI Figure S6). The category “health” was dominated by words rather than logos (up to 1%), with a word presence between 10% and 13% for all shows, except for the Shanghai seafood show, where the “health” category for words was present at approximately 4% of the exhibitor booths (SI Figure S6d). The logo category “provenance” was present at between 1% and 8% of the booths, while the word category “provenance” was not present at most shows, except for up to 2% of exhibitor booths at Brussels and Qingdao (SI Figure S6e). The logo category “social” was not present at all, while words in this category were only present at approximately 6%, 3%, and 2% of the exhibitor booths at the Boston, Brussels, and Qingdao shows (SI Figure S6f).

4. Discussion

In 2019, across five seafood trade shows, close to half of the exhibitor booths did not use logos or words at the booths to signal characteristics of the products. Seafood traders from the major producing and consuming regions use different types of messaging at the seafood shows where they exhibit.
Certification in the Global North is driven by lead firms such as large retailers and manufacturers [9]. These commercial entities often function as “choice editors”, guaranteeing and displaying a certain product quality or environmental standard through third-party certification [11]. Meanwhile, distribution in Asia is facilitated by a range of middle-sized regional retail companies that require certification for the whole supply chain, which is more costly [41,42]. In the context of aquaculture smallholders in the Global South, obtaining certification is complex, expensive, and requires a certain level of managerial capability, often resulting in their exclusion from markets that require certification [43].
In additional to ethical considerations to meet consumer demands, a recent study indicates that in the case of companies listed on the Oslo Seafood Index, sustainability reporting commitments on, for example, the ASC, Global Salmon Initiative (GSI), and Global Reporting Standard (GRI) standards could have a positive effect on the market value of a company [44]. However, this does not always reflect sustainability performance, as companies in controversial industries seem to be more active in corporate social responsibility (CSR) communication activities compared to companies in non-controversial industries [45].
In general, European consumers show an interest in the environmental impact associated with aquaculture production or capture fisheries [46]. From a global perspective, some consumers are willing to pay a premium for labeled, more sustainable products [47,48,49], but this could differ depending on the product’s geographical origin [48] and type of product (wild-caught vs. farmed) [49]. Additionally, some consumers prefer seafood products from local retailers because of the perception that they are of higher quality [49]. Nevertheless, interest in sustainability is reflected by our findings, showing common messaging of sustainability logos and words at the Boston and Brussels seafood shows. In contrast, our results indicate a relatively lower presence of sustainability messaging at Chinese seafood shows, perhaps suggesting its lower priority among consumers in Asia. The literature around relative interest in the environment and affluence is mixed. Whereas higher rates of individual affluence have been associated with higher rates of environmental concerns [50,51], affluence on a national level has been associated with lower levels of individual environmental concern [50].
On an aquaculture or fishery certification level, MSC was commonly shown at the Boston and Brussels seafood shows, while ASC was in fourth and second place, respectively (SI Table S4). In contrast, the Chinese seafood shows had a high presence of “safety” and “quality” logos at their exhibitor booths. The obvious emphasis on safety and quality seems to address the increasing concern of the public following well published food-related public health scandals. It was only in 2009 that China’s first law to regulate food safety came into force [52]. The results of this study echo investigations that China is in the development phase of outlining (sea)food traceability processes, and further regulations and industry guidance are needed [53,54].
Most of the certification schemes focus on environmental health and governance (implementing environmental indicators) and show a minor focus on cultural and economic issues. This is also the result of the fact that sustainability as a concept is poorly defined and often used as a narrow interpretation [55,56,57]. The incentives to buy sustainable seafood from the perspective of, e.g., a UK customer, are strong moral obligation, pressure from family and friends, and a positive attitude toward buying sustainable seafood [58], while German consumers highlight the importance of the type of fish species, taste, country of origin, and concerns about sustainability, which are relevant factors influencing purchase decisions [59]. This is also reflected in our findings that “sustainability” was a word commonly shown at exhibitor booths at the Boston, Brussels, and Shanghai shows, while other “sustainability” words, such as “environment”, “natural”, “responsible”, “no pollution”, were less present at the exhibitor booths. However, the top ten ‘’sustainability” words across all seafood shows were more related to environmental impact (SI Table S5). Nevertheless, sustainability is a journey, while it is often being marketed as a static point (“it is sustainable”), which limits further development through a lack of incentives [57,60]. Despite Osmundsen et al. [20] concluding that certifications have narrow definitions of sustainability centering around the environment and governance, which many seafood traders still follow, perceptions of sustainability may be changing as some certifying organizations broaden the indicators they use. Increasing evidence suggests that consumers and firms are more interested in improvements to production that positively impact ocean health [56]. This is reflected in the results for the seafood shows’ average and the Boston and Brussels seafood shows in particular, where MSC was by far the most commonly shown logo at the exhibitor booths (SI Table S4).
Narrow narratives drive seafood production away from broader sustainability discussions within the food production system [56]. Aquaculture is increasingly dependent on both marine and terrestrial systems for feed ingredients, both having associated environmental impacts [61,62,63,64], and it is therefore crucial to integrate aquaculture into the global food production system and broader sustainability discussions.
A certain segment of consumers showed a preference for wild products, which was reflected in the minor use of the word “wild” at the exhibitor booths at the Qingdao and Shanghai seafood shows (SI Table S5). A survey among Chinese middle-class urban seafood consumers indicates that taste, nutrition, and health are the most important motives to consume seafood, while wild seafood appears to be preferred over farmed, even if the consumer cannot tell the difference between them [15]. A web-based survey by Wang and Somogyi [65] on the motives for luxury seafood consumption among Chinese consumers indicated two dimensions of importance: food value and symbolic value. This study showed that 5 out of the 8 most important specific motives were closely related to nutrition and taste (“umami”, “delicious”, “fresh”, “like to eat”), and health (“high quality life”). Additionally, the study of Gao [66] found that health awareness was high in the coastal area of Dalian in China, and this was also an important driver for the seafood purchasing frequency of local Chinese consumers. The importance of health as a consumption driver was also reflected in our study in the word category ‘‘health”, which was present at the Chinese exhibitor booths at Guangzhou, Qingdao, and Shanghai seafood shows. This is in line with our results for the Boston and Brussels seafood shows, where this type of messaging was also present at some exhibitor booths (SI Figure S6d).
The increased exhibition of sustainability logos in Boston and Brussels may be in part a response to the perception among some people that farmed fish has a negative environmental impact [49]. This is also a common narrative around offshore/marine aquaculture in the USA [67], which could also be influenced by the generalization of other environmental disasters. Additionally, certain consumers have the perception that farmed fish is less healthy and has lower quality compared to wild caught fish [68,69], which can be explained as the consumer perception of an “artificial” product. This could be caused by the lack of available information on production practices [68,70,71]. Consequently, this perception could create incentives to pay a premium for wild caught fish [49,72,73,74,75], shellfish and seaweed, especially in the coastal regions where there is more awareness regarding certification and the origin of seafood [76]. This clearly indicates a need to better understand the many reasons that drive seafood consumption and the importance of transparent communication around seafood products by means of information, programs, and certifications [49,77].
Our findings indicate that seafood shows in China show relatively less messaging including “sustainability” compared to the Boston and Brussels seafood shows. However, Asian exhibitor booths at Boston and Shanghai showed relatively more messaging in the category “sustainability” compared to the show average. Similarly, sustainability certification was not present in the top three logos of all three Chinese seafood shows, while it was widely in evidence at the Boston and Brussels seafood shows (SI Table S4). This could be explained by consumer demand and the way seafood distribution, trade, and certification schemes are organized. Distribution in Asia takes place in a range of middle-sized regional retail companies, which are often individually not certified, because of the associated costs and lack of benefits [41,42]. Additionally, in the case of Chinese consumers, less public interest is shown towards sustainable production as there is more emphasis on food safety [78]. Overall, this was also reflected in results indicating less sustainability messaging at Chinese shows compared to the Brussels and Boston seafood shows, while product safety and quality (indicated by HACCP, BRC, and ISO in the top three logos, SI Table S4) was valued over environmental concerns. The logo and word category “safety” was commonly observed at Chinese shows (Guangzhou, Qingdao, and Shanghai) compared to the Boston and Brussels seafood shows (SI Figure S6c).
In China there is a strong connection between seafood and freshness, and therefore quality and other associated positive attributes, partly due to the enduring popularity of “wet markets”, a marketplace in which independent vendors sell fresh food including vegetables, meat, and fish. Product freshness is achieved as an outcome of the short supply chains connecting vendors to wholesalers, often facilitated by middlemen [79]. Chinese and other Asian vendors at international seafood trade shows may feel obliged to emphasize safety and quality aspects aligned with good health properties and naturalness because the freshness associated with wet markets is not so apparent. When it comes to fish consumption in China, there has been limited attention to freshwater fish consumption in the literature [80]. Nevertheless, according to key informants in the study of Fang and Fabinyi [81], freshness, but also food safety, quality, price, and local culinary traditions were considered important influences on patterns of freshwater fish consumption at Chengdu fish market (Sichuan province, China).
Consumers are increasingly demanding clearly labeled, sustainable products, and it is therefore important for producers, processors, and traders to position themselves well by means of product differentiation to meet different demands of consumers, while taking sustainability aspects into account [49,76,82]. While the market for sustainable aquaculture products is relatively small, a study by Risius et al. [83] emphasized the importance of providing information on production criteria for German consumers, e.g., production in natural ponds, practices, and country of origin. Country of origin is reflected in the results by words such as “traceability”, which was in the top 10 of the Boston, Brussels, Qingdao, and Shanghai seafood shows (SI Table S5). Additionally, overall, the messaging category “provenance” for logos was present at all five shows, but had a relatively higher presence at the Chinese seafood shows (SI Table S6e). In China, the certification logo “Product of Geographical Indication” has been promoted with considerable subsidies to highlight product provenance for the (domestic) premium market [84]. It also follows the recent bilateral agreement on the protection and cooperation of the geographical indication between China and the European Union [52]. This is relevant because of the importance of consumer decision-making regarding the origin of products, with some consumers having a preference and willingness to pay a premium for local produce compared to imported products. In Germany, the highest importance was placed on “country of origin”, while sustainability claims and labels were considered positive but less important [83]. Another study showed a preference for locally produced food over “organic food”, but this could vary depending on the consumers’ place of residence and product type [85]. This could be explained by the fact that the market for sustainable aquaculture products is growing, but covers a relatively small market and is often less in demand by the mainstream consumer [83].
It is important to take cultural perceptions into account, as consumer attitudes towards seafood safety are often conflated with perceptions of sustainability, quality, and traceability [86]. Certain European consumers seem to be willing to pay more for ‘‘fresh” seafood compared to frozen seafood [72,87,88]. Additionally, while frozen seafood is commonly sold in most marketplaces, in some countries, such as China, fresh seafood is highly preferred, ideally purchased “live” compared to other product forms (e.g., frozen or canned) [79]. Chinese consumers already associate seafood with “fresh”, as seafood itself is also called 海 (hǎi: sea) 鲜 (xiān: fresh) in Mandarin. The nature of this terminology excludes the need for messaging on this type. Conclusively, the interpretation of messaging and the use of it could differ from culture to culture.
In the case of consumers in the European Union, Cantillo et al. [88] found that consumers who do not understand all the information provided on seafood products tend to consume less seafood. This indicates an opportunity to increase consumption by providing clearer information about the product. Such messaging, currently unusual, might lead on the benefits associated with seafood consumption, such as health benefits (e.g., containing little fat). Ensuring optimal appearance of the seafood at point of sale and prominent use of brands and labeling would be part of such a strategy. Certification of quality, certification, origin of the product, and associated socioenvironmental impacts would also be important [88]. Currently certification focuses on ecolabels, which could be an important driver for increased consumption in the EU, which already demands compliance on presenting product information on labeling [88]. Such a strategy might also be suitable for other major markets such as the USA but is unlikely to work in Asia at this stage due to cultural differences and the fact that a high proportion of seafood is sold unpackaged. A focus on food safety and quality, a well-managed cold chain, and the consumption of the whole fish would meet the cultural demands of the Asian consumer.

Study Limitations and Future Research

The visual survey was conducted by researchers with a high proficiency level in the language used in the show. However, there are different cultural backgrounds regarding messaging and the way this is interpreted. This could influence the way data was written down during the visual survey and processed in a later stage. Additionally, certain logos and certifications, such as FDA and HACCP, are shown differently across seafood shows but are the same. However, HACCP is part of the FDA and is therefore assessed separately, mainly because FDA is USA-specific.
The survey was conducted across five seafood shows in three countries in a single year, pre-pandemic. This means that our scope was limited to processed seafood, mainly marketed for the international trade and (long-distance) domestic trade, requiring a long shelf life. However, in China a large proportion of seafood is still purchased in live form in wet markets (~60–80%), without packaging, and not easy to label or trace, thus certifications are not easy to promote with these products. In contrast, most seafood in developed countries is in imported processed forms, which are often labeled and traceable [89,90,91].
The seafood shows are business-to-business orientated: the final consumer was not directly served at the show. This potentially affected the messaging strategy used by exhibitor booths, where messaging via packaging was not emphasized. Clearly sustainability messaging to final consumers would require systematic analysis of packaging, and likely reflect specific cultural norms and market conditions.
Preferences in the style and content of sustainability messaging used by actors will likely depend on their position within the seafood value chain. Therefore, for future research, an analysis of the type of value chain actor behind the exhibitor booths could provide more specific insights into the incentives to use certain types of logos and words. This could also include information on the amount and size of the exhibitor booths that certain companies occupy. It is important to collect a consistent dataset across the seafood shows, which could potentially include the size of the company in terms of revenue and number of employees associated with the exhibitor booth(s), type of seafood sold in terms of species and origin (aquaculture versus wild), and product form (fresh versus frozen). This would add additional resolution to the current baseline where messaging has been compared across seafood shows.

5. Conclusions

Seafood is an important component in diets and is part of a complex trade network stretching across the globe. A variety of cultures show different perceptions towards the production and consumption of seafood. Our analysis indicates a clear difference in messaging at business-to-business seafood shows between the Global South (major producer in terms of volume) and Global North (major consumer in terms of monetary value). There is a clear difference between the focus on the product (e.g., quality and health aspects) and the production process (e.g., environmental sustainability and provenance). The Global North (Europe and the USA) shows a high interest in “sustainability” messaging, which is driven by consumer demand for ecolabels and sustainable production practices, while the Global South (China) shows a relatively higher interest in messaging around “safety” and “quality”. The preference for sustainable products comes from moral values and ethical considerations. The use of “safety” messaging can be traced back to concerns around food safety due to a lack of an established cold chain and, more broadly, standard operating procedures, already established by supermarkets and large retailers in the Global North. The use of “quality” messaging is strongly associated with virtue signaling about the natural characteristics and health benefits of seafood consumption in the Chinese market. Understanding the preferences of consumers across different socioeconomic and cultural backgrounds could improve business practices and better meet the expectations of the consumer, while improving production practices at the same time. Messaging strategies could be adjusted and improved to highlight the products’ unique selling points and to find a match with the right customer.

Supplementary Materials

The following are available online at https://www.mdpi.com/article/10.3390/su132111720/s1: the original cleaned and anonymized data; detailed tables and figures that support the findings of this study are openly available in the Supplementary Information (SI).

Author Contributions

Conceptualization, M.T., W.M.; formal analysis, W.M., M.T.; investigation (data collection), W.M., M.T., S.M., C.Z., R.W.N., W.Z.; methodology, W.M., M.T. R.W.N., D.C.L.; project administration, M.T., R.W.N., D.C.L.; resources, W.M., M.T., R.W.N.; D.C.L.; supervision, M.T., D.C.L., R.W.N.; validation, W.M., M.T., R.W.N.; visualization, W.M., M.T., R.W.N.; writing—original draft, W.M.; writing—review and editing, W.M., R.W.N., D.C.L., M.T., S.M., M.E., C.Z., W.Z., S.L. All authors have read and agreed to the published version of the manuscript.

Funding

This research was funded by GAIN (EU, Horizon 2020 Framework Research and Innovation Programme under GA n. 773330).

Institutional Review Board Statement

Not applicable.

Informed Consent Statement

Not applicable.

Acknowledgments

The authors appreciate the hospitality of the exhibitor booths at the seafood shows, which made this research possible. The authors would like to thank the anonymous reviewers and the editor for their valuable comments and suggestions. Additionally, the authors would like to thank the University of Stirling for financial support regarding the article processing charges (APC) to make this research open access and free for readers.

Conflicts of Interest

The authors declare that the research was conducted in the absence of any commercial or financial relationships that could be construed as a potential conflict of interest. D.L. is a current member of the GAA Standards and Oversight Committee, and he and M.T. have both participated in the creation and critique of aquaculture standards. MT is a member of the Seafood Nutrition Partnership’s Scientific and Nutritional Advisory Council, and is on the Board of The Center for Responsible Seafood. R.N. is Chair of the GSA Climate Action Committee.

References

  1. FAO. World Aquaculture Performance Indicators (WAPI)—Fish Consumption Module (WAPI-FISHCSP v.2018.1). Available online: http://www.fao.org/fishery/statistics/software/wapi/en (accessed on 5 December 2020).
  2. FAO. The State of World Fisheries and Aquaculture 2020. Sustainability in Action; Food and Agriculture Organization of the United Nations: Rome, Italy, 2020. [Google Scholar]
  3. FAO. The State of World Fisheries and Aquaculture 2018—Meeting the Sustainable Development Goals; Food and Agriculture Organization of the United Nations: Rome, Italy, 2018. [Google Scholar]
  4. Gephart, J.A.; Pace, M.L. Structure and evolution of the global seafood trade network. Environ. Res. Lett. 2015, 10, 125014. [Google Scholar] [CrossRef] [Green Version]
  5. STECF. Economic Report of the EU Aquaculture Sector (STECF-18-19); Scientific, Technical and Economic Committee for Fisheries (STECF), Publications Office of the European Union: Luxembourg, 2018. [Google Scholar]
  6. EUMOFA. The EU Fish Market 2018 Edition; European Market Observatory for Fisheries and Aquaculture Products: Luxembourg, 2018. [Google Scholar]
  7. EUMOFA. The EU Fish Market 2019 Edition; European Market Observatory for Fisheries and Aquaculture Products: Luxembourg, 2019. [Google Scholar]
  8. Gephart, J.A.; Froehlich, H.E.; Branch, T.A. To create sustainable seafood industries, the United States needs a better accounting of imports and exports. Proc. Natl. Acad. Sci. USA 2019, 116, 9142–9146. [Google Scholar] [CrossRef] [PubMed] [Green Version]
  9. Potts, J.; Wilkings, A.; Lynch, M.; McFatridge, S. The State of Sustainability Initiatives: Standards and the Blue Economy; International Institute for Sustainable Development (IISD): Winnipeg, MB, Canada, 2016; ISBN 978-1-894784-74-0. [Google Scholar]
  10. Bush, S.R.; Belton, B.; Little, D.C.; Islam, M.S. Emerging trends in aquaculture value chain research. Aquaculture 2019, 498, 428–434. [Google Scholar] [CrossRef] [Green Version]
  11. Little, D.C.; Young, J.A.; Zhang, W.; Newton, R.W.; Mamun, A.A.; Murray, F.J. Sustainable intensification of aquaculture value chains between Asia and Europe: A framework for understanding impacts and challenges. Aquaculture 2018, 493, 338–354. [Google Scholar] [CrossRef]
  12. Pieterse, J.N. Multipolar Globalization—Emerging Economies and Development; Routledge: New York, NY, USA, 2018. [Google Scholar]
  13. Crona, B.; Wassenius, E.; Troell, M.; Barclay, K.; Mallory, T.; Fabinyi, M.; Zhang, W.; Lam, V.W.Y.; Cao, L.; Henriksson, P.J.G.; et al. China at a Crossroads: An Analysis of China’s Changing Seafood Production and Consumption. One Earth 2020, 3, 32–44. [Google Scholar] [CrossRef]
  14. Newton, R.; Zhang, W.; Xian, Z.; McAdam, B.; Little, D.C. Intensification, regulation and diversification: The changing face of inland aquaculture in China. Ambio 2021, 50, 1739–1756. [Google Scholar] [CrossRef] [PubMed]
  15. Fabinyi, M.; Liu, N.; Songd, Q.; Li, R. Aquatic product consumption patterns and perceptions among the Chinese middle class. Reg. Stud. Mar. Sci. 2016, 7, 1–9. [Google Scholar] [CrossRef]
  16. Mialhea, F.; Morales, E.; Dubuisson-Quellierc, S.; Vagnerond, I.; Dabbadiee, L.; Little, D.C. Global standardization and local complexity. A case study of an aquaculture system in Pampanga delta, Philippines. Aquaculture 2018, 493, 365–375. [Google Scholar] [CrossRef] [Green Version]
  17. Barclay, K.; Miller, A. The Sustainable Seafood Movement Is a Governance Concert, with the Audience Playing a Key Role. Sustainability 2018, 10, 180. [Google Scholar] [CrossRef] [Green Version]
  18. Tlusty, M.F. Environmental improvement of seafood through certification and ecolabelling: Theory and analysis. Fish Fish. 2012, 13, 1–13. [Google Scholar] [CrossRef]
  19. Ward, T.; Phillips, B. Seafood Ecolabelling: Principles and Practice; Wiley-Blackwell: Hoboken, NJ, USA, 2008; p. 472. [Google Scholar]
  20. Osmundsen, T.C.; Amundsen, V.S.; Alexander, K.A.; Asche, F.; Bailey, J.; Finstad, B.; Olsen, M.S.; Hernández, K.; Salgado, H. The operationalisation of sustainability: Sustainable aquaculture production as defined by certification schemes. Glob. Environ. Change 2020, 60, 102025. [Google Scholar] [CrossRef]
  21. Pramod, G.; Nakamura, K.; Pitcher, T.J.; Delagran, L. Estimates of illegal and unreported fish in seafood imports to the USA. Mar. Policy 2014, 48, 102–113. [Google Scholar] [CrossRef]
  22. Christian, C.; Ainley, D.; Bailey, M.; Dayton, P.; Hocevar, J.; LeVine, M.; Nikoloyuk, J.; Nouvian, C.; Velarde, E.; Werner, R.; et al. A review of formal objections to Marine Stewardship Council fisheries certifications. Biol. Conserv. 2013, 161, 10–17. [Google Scholar] [CrossRef]
  23. Sutton, M. The Marine Stewardship Council: New hope for marine fisheries. Naga 1996, 19, 10–12. [Google Scholar]
  24. Gutierrez, A.; Thornton, T.F. Can Consumers Understand Sustainability through Seafood Eco-Labels? A U.S. and UK Case Study. Sustainability 2014, 6, 8195–8217. [Google Scholar] [CrossRef] [Green Version]
  25. Jacquet, J.L.; Pauly, D. The rise of seafood awareness campaigns in an era of collapsing fisheries. Mar. Policy 2007, 31, 308–313. [Google Scholar] [CrossRef]
  26. Fabinyi, M. Historical, cultural and social perspectives on luxury seafood consumption in China. Environ. Conserv. 2011, 39, 83–92. [Google Scholar] [CrossRef] [Green Version]
  27. Hanson, A.J.; Potts, J.; Cui, H.; Zou, L.; Clarke, S.; Muldoon, G.; Potts, J.; Zhang, H. Greening China’s Fish and Fish Products Market Supply Chains; International Institute for Sustainable Development (IISD): Winnipeg, MB, Canada, 2011. [Google Scholar]
  28. Xu, P.; Zeng, Y.; Fong, Q.; Lone, T.; Liu, Y. Chinese consumers’ willingness to pay for green- and eco-labeled seafood. Food Control 2012, 28, 74–82. [Google Scholar] [CrossRef]
  29. Nhu, T.T.; Schaubroeck, T.; Henriksson, P.J.G.; Bosma, R.; Sorgeloos, P.; Dewulf, J. Environmental impact of non-certified versus certified (ASC) intensive Pangasius aquaculture in Vietnam, a comparison based on a statistically supported LCA. Environ. Pollut. 2016, 219, 156–165. [Google Scholar] [CrossRef]
  30. Fabinyi, M.; Liu, N. The Social Context of the Chinese Food System: An Ethnographic Study of the Beijing Seafood Market. Sustainability 2016, 8, 244. [Google Scholar] [CrossRef] [Green Version]
  31. Tlusty, M.F.; Thompson, M.; Tausig, H. Statistical tools to assess the breadth and depth of shrimp aquaculture certification schemes. Fish. Res. 2016, 182, 172–176. [Google Scholar] [CrossRef]
  32. Carlucci, D.; Nocella, G.; De Devitiis, B.; Viscecchia, R.; Bimbo, F.; Nardone, G. Consumer purchasing behaviour towards fish and seafood products. Patterns and insights from a sample of international studies. Appetite 2015, 84, 212–227. [Google Scholar] [CrossRef] [PubMed]
  33. CRS. Sample Size Calculator. Available online: https://www.surveysystem.com/sscalc.htm (accessed on 5 February 2019).
  34. Diversified. Welcome to Diversified Communications UK. Available online: https://www.divcom.co.uk/ (accessed on 1 February 2021).
  35. CHINAFISHEX. China International (Guangzhou) Fishery & Seafood Expo 2019. Available online: http://www.chinafishex.com/about/?153.html (accessed on 1 February 2021).
  36. CFSE. China Fisheries & Seafood Expo 2019. Available online: http://chinaseafoodexpo.com/ (accessed on 1 February 2021).
  37. WorldSeafoodShanghai. Exhibition Profile. Available online: https://www.worldseafoodshanghai.com/en/About_the_exhibition/ (accessed on 1 February 2021).
  38. Lee, N.; Broderick, A.J. The past, present and future of observational research in marketing. Qual. Mark. Res. 2007, 10, 121–129. [Google Scholar] [CrossRef]
  39. MOFCOM. The Ministry of Commerce of the People’s Republic of China. Advertising Law of the People’s Republic of China. Available online: http://english.mofcom.gov.cn/aarticle/lawsdata/chineselaw/200211/20021100053452.html (accessed on 1 September 2021).
  40. FAO. FishStatJ—Software for Fishery and Aquaculture Statistical Time Series. In Installing FishStatJ v4.01.4 (June 2021); FAO: Rome, Italy, 2020; Volume 2020. [Google Scholar]
  41. Tsantiris, K.; Zheng, L.; Chomo, V. Seafood Certification and Developing Countries: Focus on Asia; FAO: Rome, Italy, 2018. [Google Scholar]
  42. Wakamatsu, H. The Impact of the MSC Certification on the Japanese Fisheries: Case of the Kyoto Flathead Flounder Danish Seine Fishery; University of Rhode Island: Kingston, RI, USA, 2014. [Google Scholar]
  43. Bush, S.R.; Belton, B.; Hall, D.; Vandergeest, P.; Murray, F.J.; Ponte, S.; Oosterveer, P.; Islam, M.S.; Mol, A.P.J.; Hatanaka, M.; et al. Certify sustainable aquaculture? Science 2013, 341, 1067–1068. [Google Scholar] [CrossRef]
  44. Nygård, R. Trends in environmental CSR at the Oslo Seafood Index: A market value approach. Aquac. Econ. Manag. 2020, 24, 194–211. [Google Scholar] [CrossRef]
  45. Kilian, T.; Hennigs, N. Corporate social responsibility and environmental reporting in controversial industries. Eur. Bus. Rev. 2014, 26, 79–101. [Google Scholar] [CrossRef]
  46. Schlag, A.K.; Ystgaard, K. Europeans and aquaculture: Perceived differences between wild and farmed fish. Br. Food J. 2013, 115, 209–222. [Google Scholar] [CrossRef]
  47. Hynes, S.; Ravagnan, E.; Gjerstad, B. Do concerns for the environmental credentials of salmon aquaculture translate into WTP a price premium for sustainably farmed fish? A contingent valuation study in Ireland and Norway. Aquac. Int. 2019, 27, 1709–1723. [Google Scholar] [CrossRef]
  48. Lim, K.H.; Hu, W.; Nayga, R.M., Jr. Is Marine Stewardship Council’s ecolabel a rising tide for all? Consumers’ willingness to pay for origin-differentiated ecolabel canned tuna. Mar. Policy 2018, 96, 18–26. [Google Scholar] [CrossRef]
  49. Bronnmann, J.; Hoffmann, J. Consumer preferences for farmed and ecolabeled turbot: A North German perspective. Aquac. Econ. Manag. 2018, 22, 342–361. [Google Scholar] [CrossRef]
  50. Givens, J.E.; Jorgenson, A.K. The Effects of Affluence, Economic Development, and Environmental Degradation on Environmental Concern: A Multilevel Analysis. Organ. Environ. 2011, 24, 74–91. [Google Scholar] [CrossRef]
  51. Nawrotzki, R.J.; Guedes, G.; do Carmo, R.L. Affluence and objective environmental conditions: Evidence of differences in environmental concern in metropolitan Brazil. J. Sustain. Dev. 2014, 7, 173–193. [Google Scholar] [CrossRef] [PubMed]
  52. Li, S.; Hope, W. Translating Food Terminology as Cultural and Communicative Processes: A Corpus-based Approach. In Terminology Translation in Chinese Contexts: Theory and Practice; Routledge: London, UK, 2021; pp. 81–98. [Google Scholar] [CrossRef]
  53. Charlebois, S.; Sterling, B.; Haratifar, S.; Naing, S.K. Comparison of global food traceability regulations and requirements. Compr. Rev. Food Sci. Food Saf. 2014, 13, 1104–1123. [Google Scholar] [CrossRef]
  54. Qian, J.; Ruiz-Garcia, L.; Fan, B.; Villalba, J.I.R.; McCarthy, U.; Zhang, B.; Yu, Q.; Wu, W. Food traceability system from governmental, corporate, and consumer perspectives in the European Union and China: A comparative review. Trends Food Sci. Technol. 2020, 99, 402–412. [Google Scholar] [CrossRef]
  55. Béné, C.; Oosterveer, P.; Lamotte, L.; Brouwer, I.D.; Haan, S.d.; Prager, S.D.; Talsma, E.F.; Khoury, C.K. When food systems meet sustainability—Current narratives and implications for actions. World Dev. 2019, 113, 116–130. [Google Scholar] [CrossRef]
  56. Tlusty, M.F.; Tyedmers, P.; Bailey, M.; Ziegler, F.; Henriksson, P.J.G.; Béné, C.; Bush, S.; Newton, R.; Asche, F.; Little, D.C.; et al. Reframing the sustainable seafood narrative. Glob. Environ. Chang. 2019, 59, 101991. [Google Scholar] [CrossRef]
  57. Tlusty, M.F.; Thorsen, Ø. Claiming seafood is ‘sustainable’ risks limiting improvements. Fish Fish. 2017, 18, 340–346. [Google Scholar] [CrossRef]
  58. Honkanen, P.; Young, J.A. What determines British consumers’ motivation to buy sustainable seafood? Br. Food J. 2015, 117, 1289–1302. [Google Scholar] [CrossRef]
  59. Hinkes, C.; Schulze-Ehlers, B. Consumer attitudes and preferences towards pangasius and tilapia: The role of sustainability certification and the country of origin. Appetite 2018, 127, 171–181. [Google Scholar] [CrossRef]
  60. Tlusty, M.; Tausig, H.; Taranovski, T.; Jeans, M.; Thompson, M.; Cho, M.; Eppling, M.; Clermont, J.J.; Goldstein, J.; Fitzsimons, E. Refocusing Seafood Sustainability as a Journey Using the Law of the Minimum. Sustainability 2012, 4, 2038–2050. [Google Scholar] [CrossRef] [Green Version]
  61. Newton, R.W.; Little, D.C. Mapping the impacts of farmed Scottish salmon from a life cycle perspective. Int. J. Life Cycle Assess. 2018, 23, 1018–1029. [Google Scholar] [CrossRef] [Green Version]
  62. Malcorps, W.; Kok, B.; Land, M.v.t.; Fritz, M.; Doren, D.v.; Servin, K.; Heijden, P.v.d.; Palmer, R.; Auchterlonie, N.A.; Rietkerk, M.; et al. The Sustainability Conundrum of Fishmeal Substitution by Plant Ingredients in Shrimp Feeds. Sustainability 2019, 11, 1212. [Google Scholar] [CrossRef] [Green Version]
  63. Zhang, W.; Liu, M.; Sadovy de Mitcheson, Y.; Cao, L.; Leadbitter, D.; Newton, R.; Little, D.C.; Li, S.; Yang, Y.; Chen, X.; et al. Fishing for feed in China: Facts, impacts and implications. Fish Fish. 2019, 21, 47–62. [Google Scholar] [CrossRef]
  64. Naylor, R.L.; Hardy, R.W.; Buschmann, A.H.; Bush, S.R.; Cao, L.; Klinger, D.H.; Little, D.C.; Lubchenco, J.; Shumway, S.E.; Troell, M. A 20-year retrospective review of global aquaculture. Nature 2021, 591, 551–563. [Google Scholar] [CrossRef]
  65. Wang, O.; Somogyi, S. Motives for luxury seafood consumption in first-tier cities in China. Food Qual. Prefer. 2020, 79, 103780. [Google Scholar] [CrossRef]
  66. Gao, Y. Analysis on the Influencing Factors of Consumers’ Seafood Purchase Behavior in Dalian. Ph.D. Thesis, Shenyang Agricultural University, Shenyang, China, 2020. [Google Scholar] [CrossRef]
  67. Froehlich, H.E.; Gentry, R.R.; Rust, M.B.; Grimm, D.; Halpern, B.S. Public Perceptions of Aquaculture: Evaluating Spatiotemporal Patterns of Sentiment around the World. PLoS ONE 2017, 12, e0169281. [Google Scholar] [CrossRef] [PubMed] [Green Version]
  68. Claret, A.; Guerrero, L.; Ginés, R.; Grau, A.; Hernández, M.D.; Aguirre, E.; Peleteiro, J.B.; Fernández-Pato, C.; Rodríguez-Rodríguez, C. Consumer beliefs regarding farmed versus wild fish. Appetite 2014, 79, 25–31. [Google Scholar] [CrossRef]
  69. Verbeke, W.; Sioen, I.; Brunsø, K.; Henauw, S.D.; Camp, J.V. Consumer perception versus scientific evidence of farmed and wild fish: Exploratory insights from Belgium. Aquac. Int. 2007, 15, 121–136. [Google Scholar] [CrossRef]
  70. Vanhonacker, F.; Altintzoglou, T.; Luten, J.; Verbeke, W. Does fish origin matter to European consumers? Insight from a consumer survey in Belgium, Norway and Spain. Br. Food J. 2011, 113, 535–549. [Google Scholar] [CrossRef]
  71. Altintzoglou, T.; Verbeke, W.; Vanhonacker, F.; Luten, J. The image of fish from aquaculture among Europeans: Impact of exposure to balanced information. J. Aquat. Food Prod. Technol. 2010, 19, 103–119. [Google Scholar] [CrossRef]
  72. Bronnmann, J.; Asche, F. Sustainable Seafood from Aquaculture and Wild Fisheries: Insights from a Discrete Choice Experiment in Germany. Ecol. Econ. 2017, 142, 113–119. [Google Scholar] [CrossRef]
  73. Darko, F.A.; Quagrainie, K.K.; Chenyambuga, S. Consumer preferences for farmed tilapia in Tanzania: A choice experiment analysis. J. Appl. Aquac. 2016, 28, 131–143. [Google Scholar] [CrossRef]
  74. Davidson, K.A.; Pan, M.; Hu, W.; Poerwanto, D. Consumers’ willingness to pay for aquaculture fish products vs. wild-caught seafood—A case study in Hawaii. Aquac. Econ. Manag. 2012, 16, 136–154. [Google Scholar] [CrossRef]
  75. Ariji, M. Conjoint analysis of consumer preferences for bluefin tuna. Fish Sci. 2010, 76, 1023–1028. [Google Scholar] [CrossRef]
  76. Brayden, C.; Noblet, C.L.; Evans, K.S.; Rickard, L. Consumer preferences for seafood attributes of wild harvested and farm-raised products. Aquac. Econ. Manag. 2018, 22, 1–21. [Google Scholar] [CrossRef]
  77. Murray, G.; Wolff, K.; Patterson, M. Why eat fish? Factors influencing seafood consumer choices in British Colombia, Canada. Ocean Coast. Manag. 2017, 144, 16–22. [Google Scholar] [CrossRef]
  78. Fabinyi, M. Sustainable seafood consumption in China. Mar. Policy 2016, 74, 85–87. [Google Scholar] [CrossRef]
  79. Zhong, S.; Crang, M.; Zeng, G. Constructing freshness: The vitality of wet markets in urban China. Agric. Hum. Values 2019, 37, 175–185. [Google Scholar] [CrossRef] [Green Version]
  80. Xian, Z. A Study of Carp Production and Consumption in Hubei Province of China. Master’s Thesis, Institute of Aquaculture, University of Stirling, Stirling, UK, 2016. [Google Scholar]
  81. Fang, J.; Fabinyi, M. Characteristics and Dynamics of the Freshwater Fish Market in Chengdu, China. Front. Sustain. Food Syst. 2021, 5, 247. [Google Scholar] [CrossRef]
  82. Kumar, G. Aquaculture production and marketing: A peek into the world of producers and consumers. Aquac. Econ. Manag. 2018, 22, 279–283. [Google Scholar] [CrossRef]
  83. Risius, A.; Hamm, U.; Janssen, M. Target groups for fish from aquaculture: Consumer segmentation based on sustainability attributes and country of origin. Aquaculture 2019, 499, 341–347. [Google Scholar] [CrossRef]
  84. EP. EU/China Agreement: Cooperation on and Protection of Geographical Indications (Resolution). Available online: https://www.europarl.europa.eu/doceo/document/TA-9-2020-0298_EN.html (accessed on 1 March 2021).
  85. Hempel, C.; Hamm, U. Local and/or organic: A study on consumer preferences for organic food and food from different origins. Int. J. Consum. Stud. 2016, 40, 732–741. [Google Scholar] [CrossRef]
  86. Rahmaniya, N.; Sekharan, M. Consumer behaviour towards seafood and seafood safety. Int. J. Curr. Adv. Res. 2018, 7, 8727–8736. [Google Scholar] [CrossRef]
  87. Ankamah-Yeboah, I.; Jacobsen, J.B.; Olsen, S.B.; Nielsen, M.; Nielsen, R. The Impact of Animal Welfare and Environmental Information on the Choice of Organic Fish: An Empirical Investigation of German Trout Consumers. Mar. Resour. Econ. 2019, 34, 247–266. [Google Scholar] [CrossRef]
  88. Cantillo, J.; Martín, J.C.; Román, C. Determinants of fishery and aquaculture products consumption at home in the EU28. Food Qual. Prefer. 2021, 88, 104085. [Google Scholar] [CrossRef]
  89. Guan, C.; Yang, Z.; Wang, Q.; Ni, Q.; Huang, B.; Lin, H.; Du, Z.; Zhang, Y.; Zhang, Y. Turbot Industry Development Report. China Fish. 2021, 1, 22–35. (In Chinese) [Google Scholar]
  90. Peng, L.; Liu, D.; Li, Z.; Lang, Q. Analysis of the Influence of COVID-19 on the Consumption Intention and Behavior of Aquatic Products of Chinese Residents. Chin. Fish. Econ. 2020, 38, 37–45, (In Chinese with English Abstract). [Google Scholar]
  91. Sun, H.; Cheng, G.; Wang, Y.; Zhu, X.; Zhao, M. Whole-Industry Chain Loss of Aquatic Products in China. Freshw. Fish. 2021, 51, 3–10, (In Chinese with English Abstract). [Google Scholar] [CrossRef]
Figure 1. Proportion of exhibitor booths from different regions displaying logos and words (Y = yes, N = no) at Boston, Brussels, Guangzhou, Qingdao, Shanghai seafood shows (N = 984).
Sustainability 13 11720 g001
Figure 2. Percentage of exhibitor booths displaying “sustainability/environment” messaging at five international seafood shows (N = 984).
Sustainability 13 11720 g002
Figure 3. Proportion of exhibitor booths from different regions displaying “quality” wording or logos at five international seafood shows (N = 984).
Sustainability 13 11720 g003
Figure 4. Proportion of exhibitor booths displaying “safety” wording or logos across five international seafood shows (N = 984).
Sustainability 13 11720 g004
Table 1. Surveyed booths.
Seafood Show 1Date (2019)Exhibitor Booths Continent/Area Surveyed 2Total Exhibitor Booths (Population)Exhibitor Booths Surveyed
(Actual Sample)
Author Conducting Sampling 4
Boston17–19 MarchAsia (10)
China (14)
Europe 3 (9)
LA (10)
NA (185)
1329229MT
Brussels7–9 MayAfrica (12)
Asia (39)
China (29)
Europe 3 (116)
LA (11)
NA (20)
1946227WM & SM
Guangzhou23–25 AugAsia (15)
China (89)
658117CZ
Qingdao30 Oct–1 NovAsia (17)
China (200)
Europe 3 (24)
NA (8)
1579261WZ & RN
Shanghai28–30 AugAsia (12)
China (129)
2029150WZ
1 The shows in Boston and Brussels were organized by Diversified Communications [34]. The shows in Guangzhou [35], Qingdao [36], and Shanghai [37] were organized by individual organizations. 2 All booth nationalities with 6 or less booths at a show were sampled and included in the seafood show total, but excluded from the analysis on a continent/area resolution due to small sample size: Boston (Oceania (1)); Guangzhou (Africa (2), Europe (2), LA (6), NA (1), Oceania (2)); Qingdao (LA (6), Oceania (6)); Shanghai (Europe (4), LA (3), NA (1), Oceania (1)). 3 Europe (geographical). 4 Michael Tlusty (MT), Wesley Malcorps (WM), Silvia Maiolo (SM), Changbo Zhu (CZ), Wenbo Zhang (WZ), Richard W. Newton (RN)
Publisher’s Note: MDPI stays neutral with regard to jurisdictional claims in published maps and institutional affiliations.

