
A Study on Optimal Agroforestry Planting Patterns in the Buffer Zone of World Natural Heritage Sites

Abstract
:1. Introduction
2. Materials and Methods
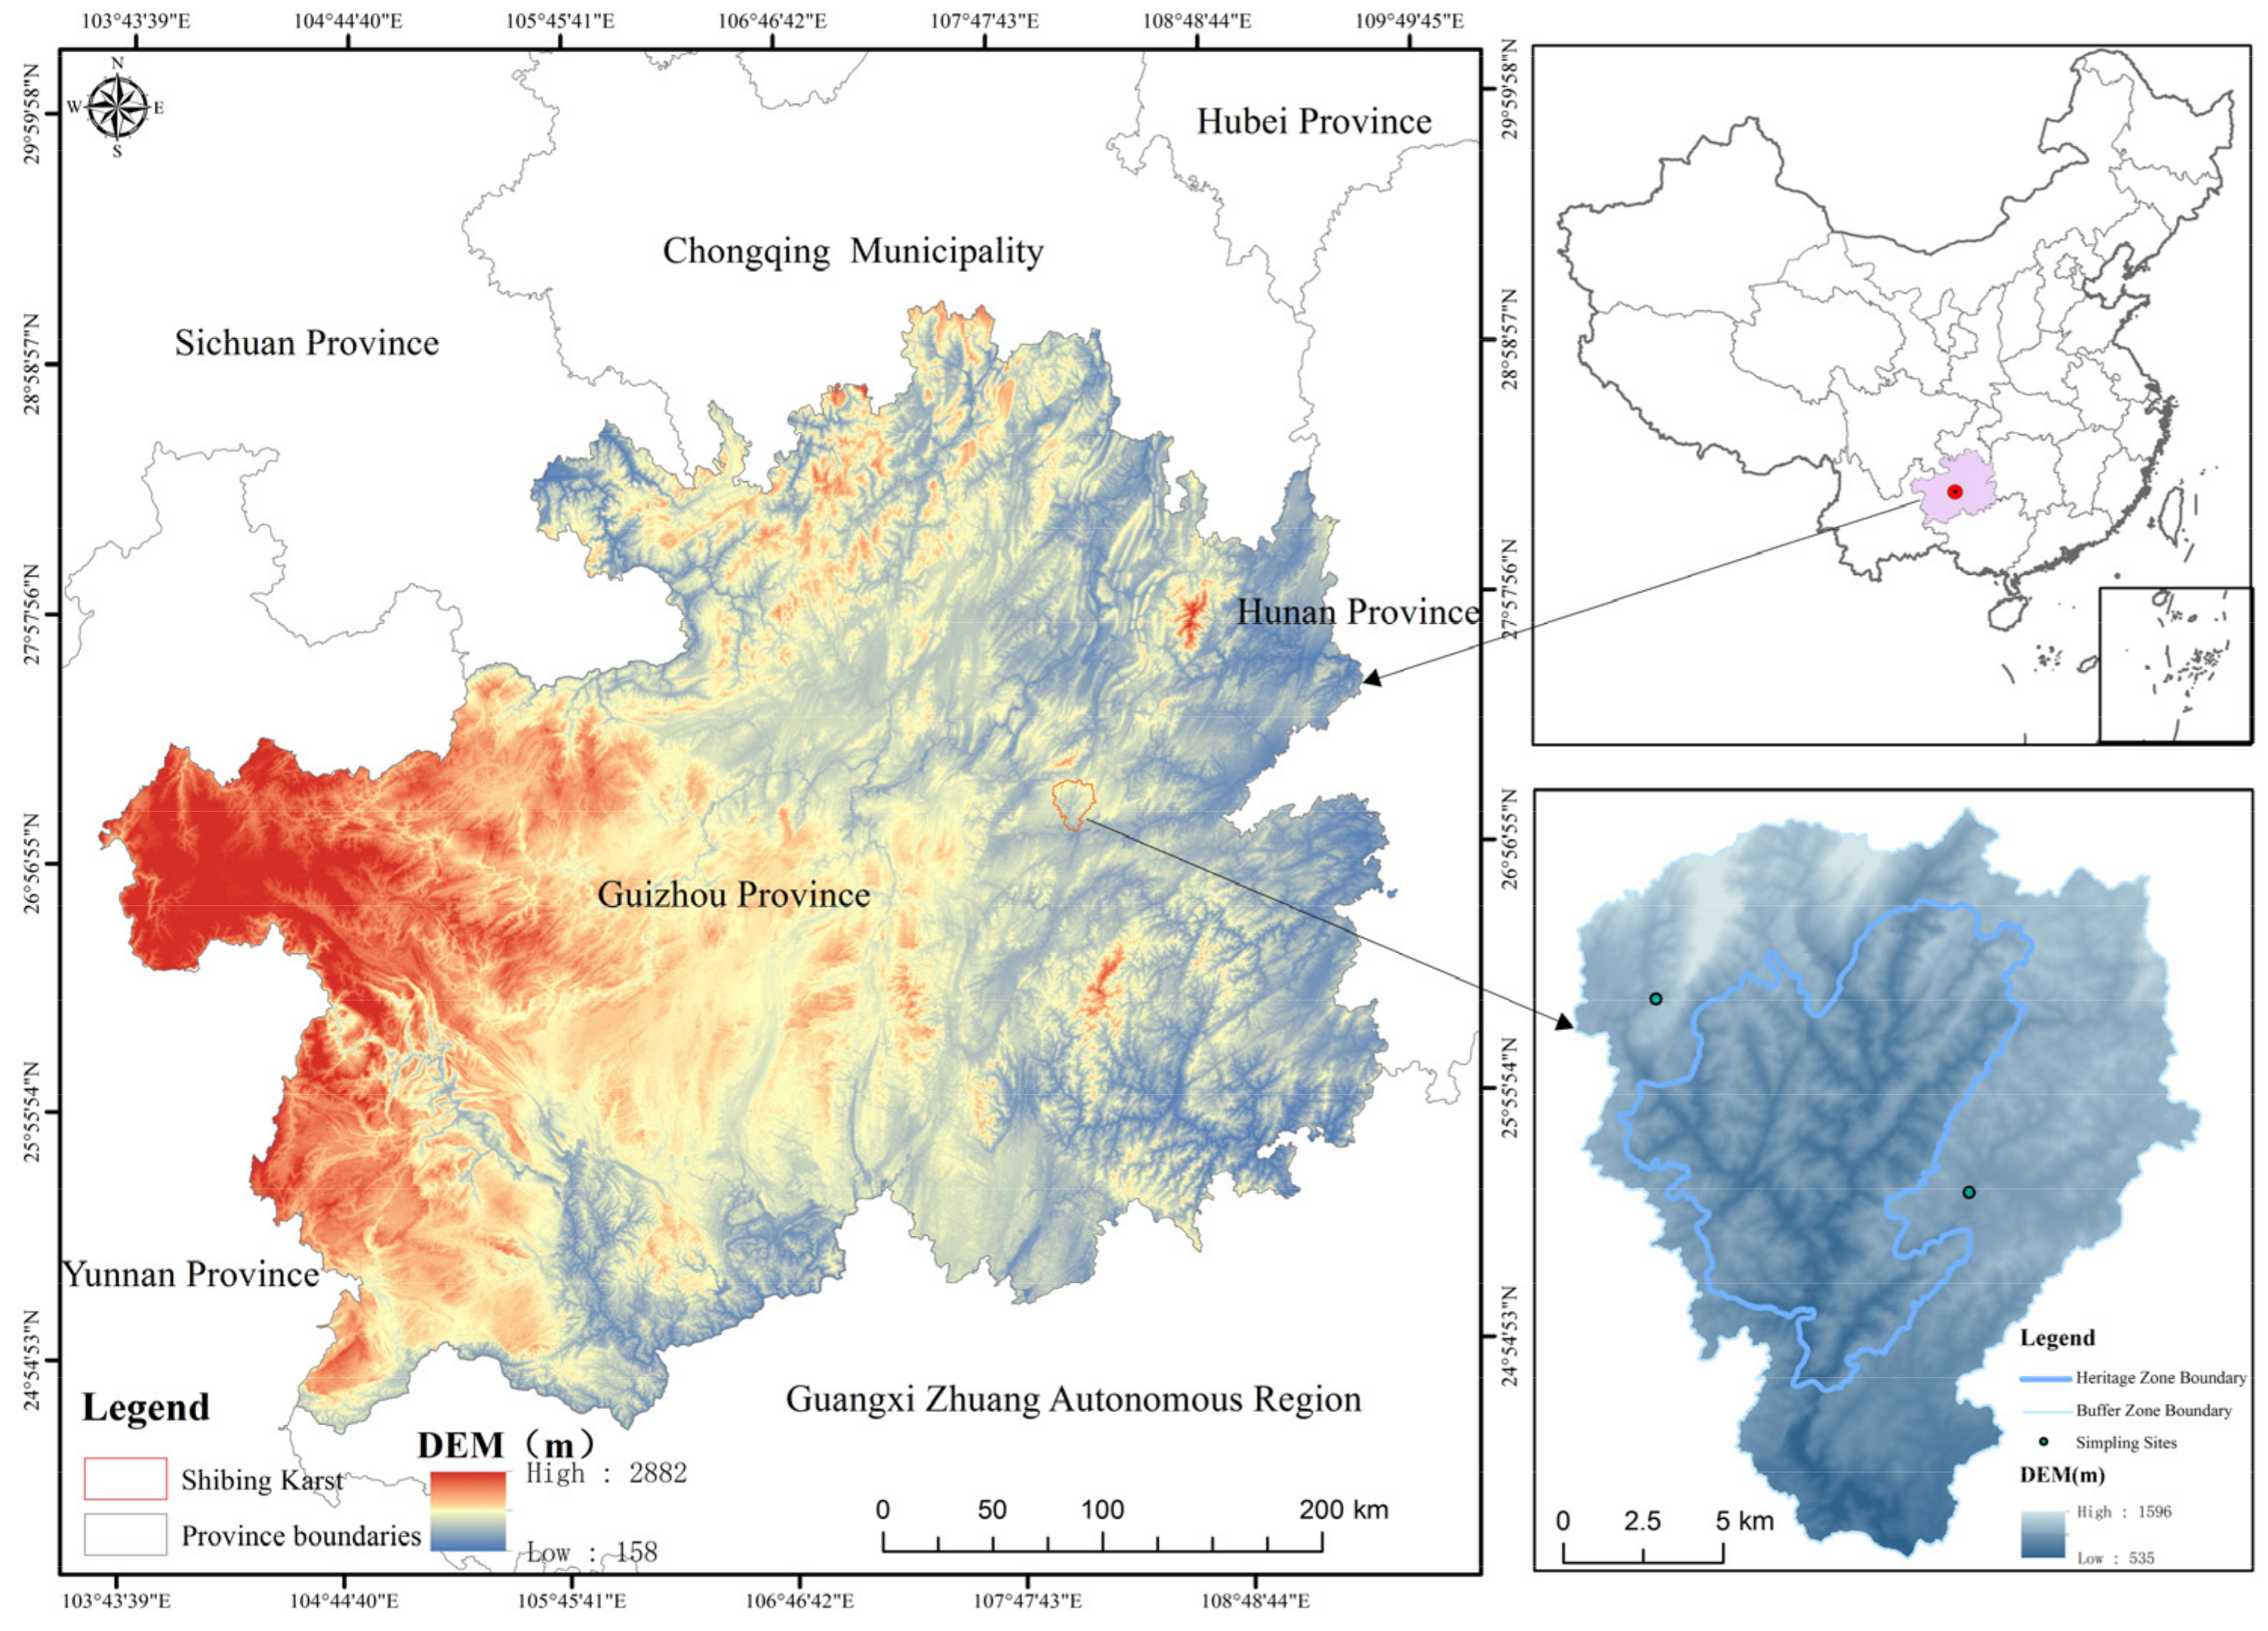
2.1. Research Area
2.2. Methods
2.3. Data Collection and Calculation
2.3.1. Estimation of Net Output Value
2.3.2. Estimation of Agricultural Supplies
2.3.3. Livelihood Asset
3. Results
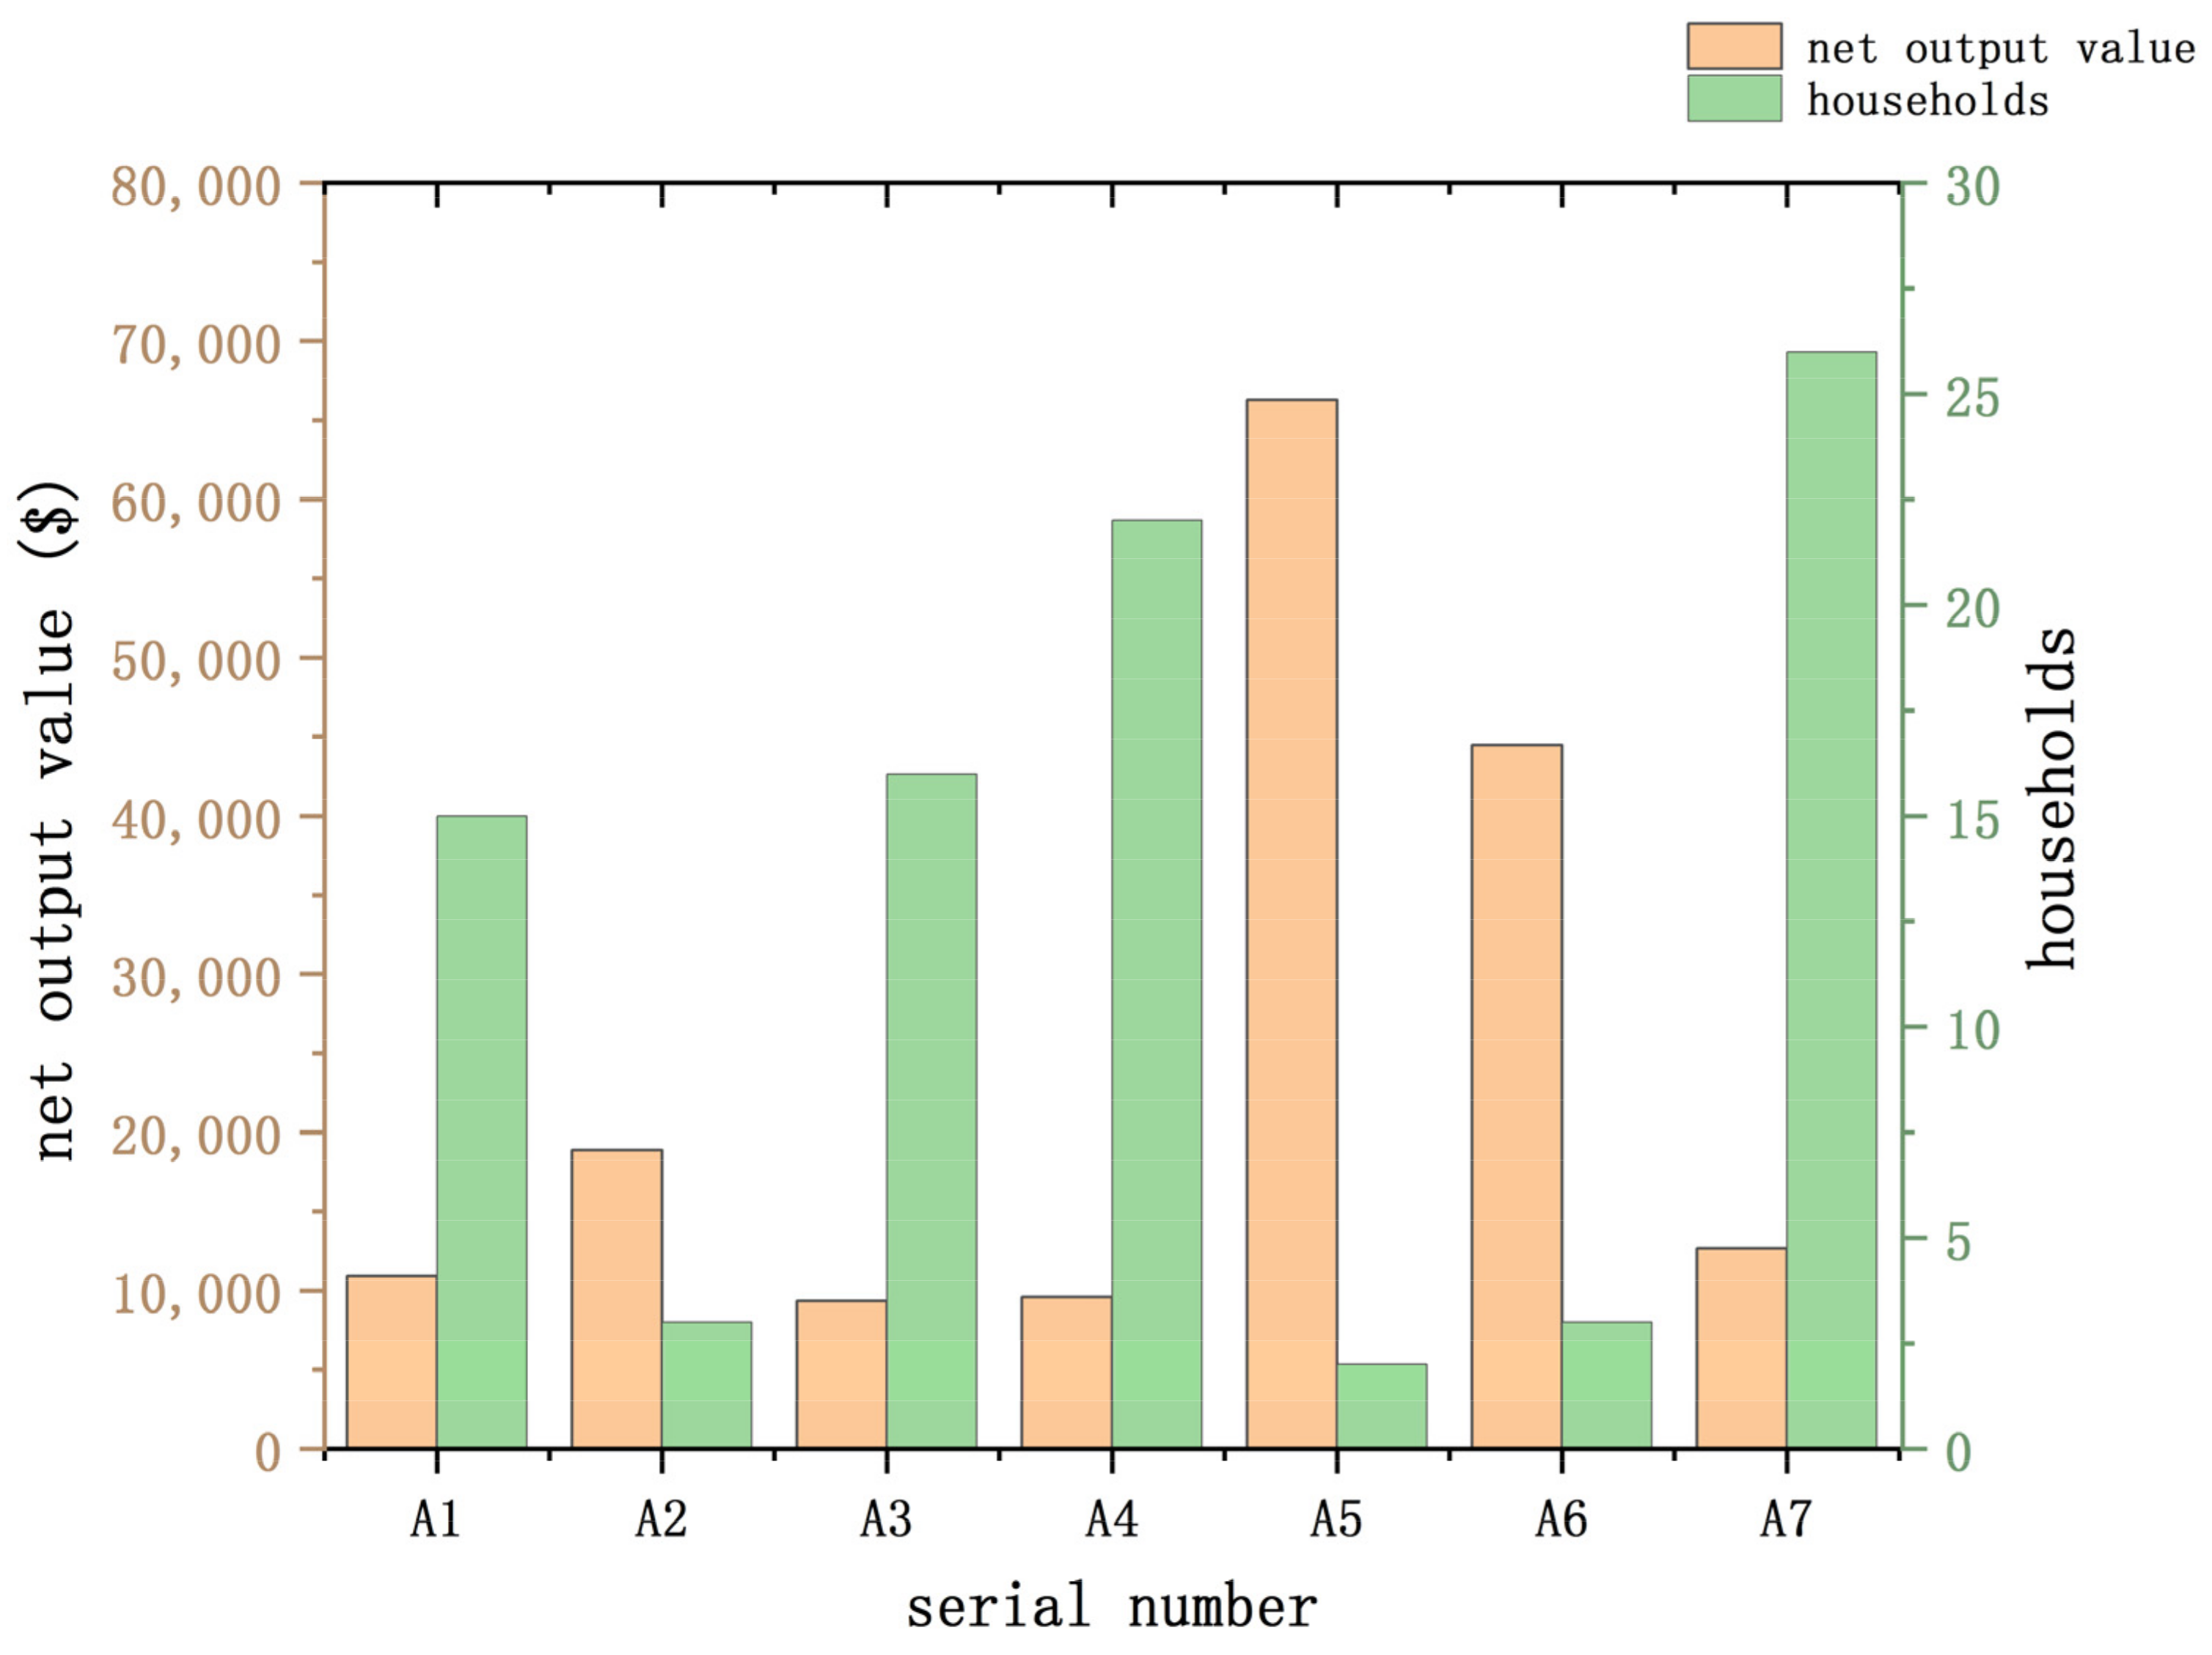
3.1. Net Output Value
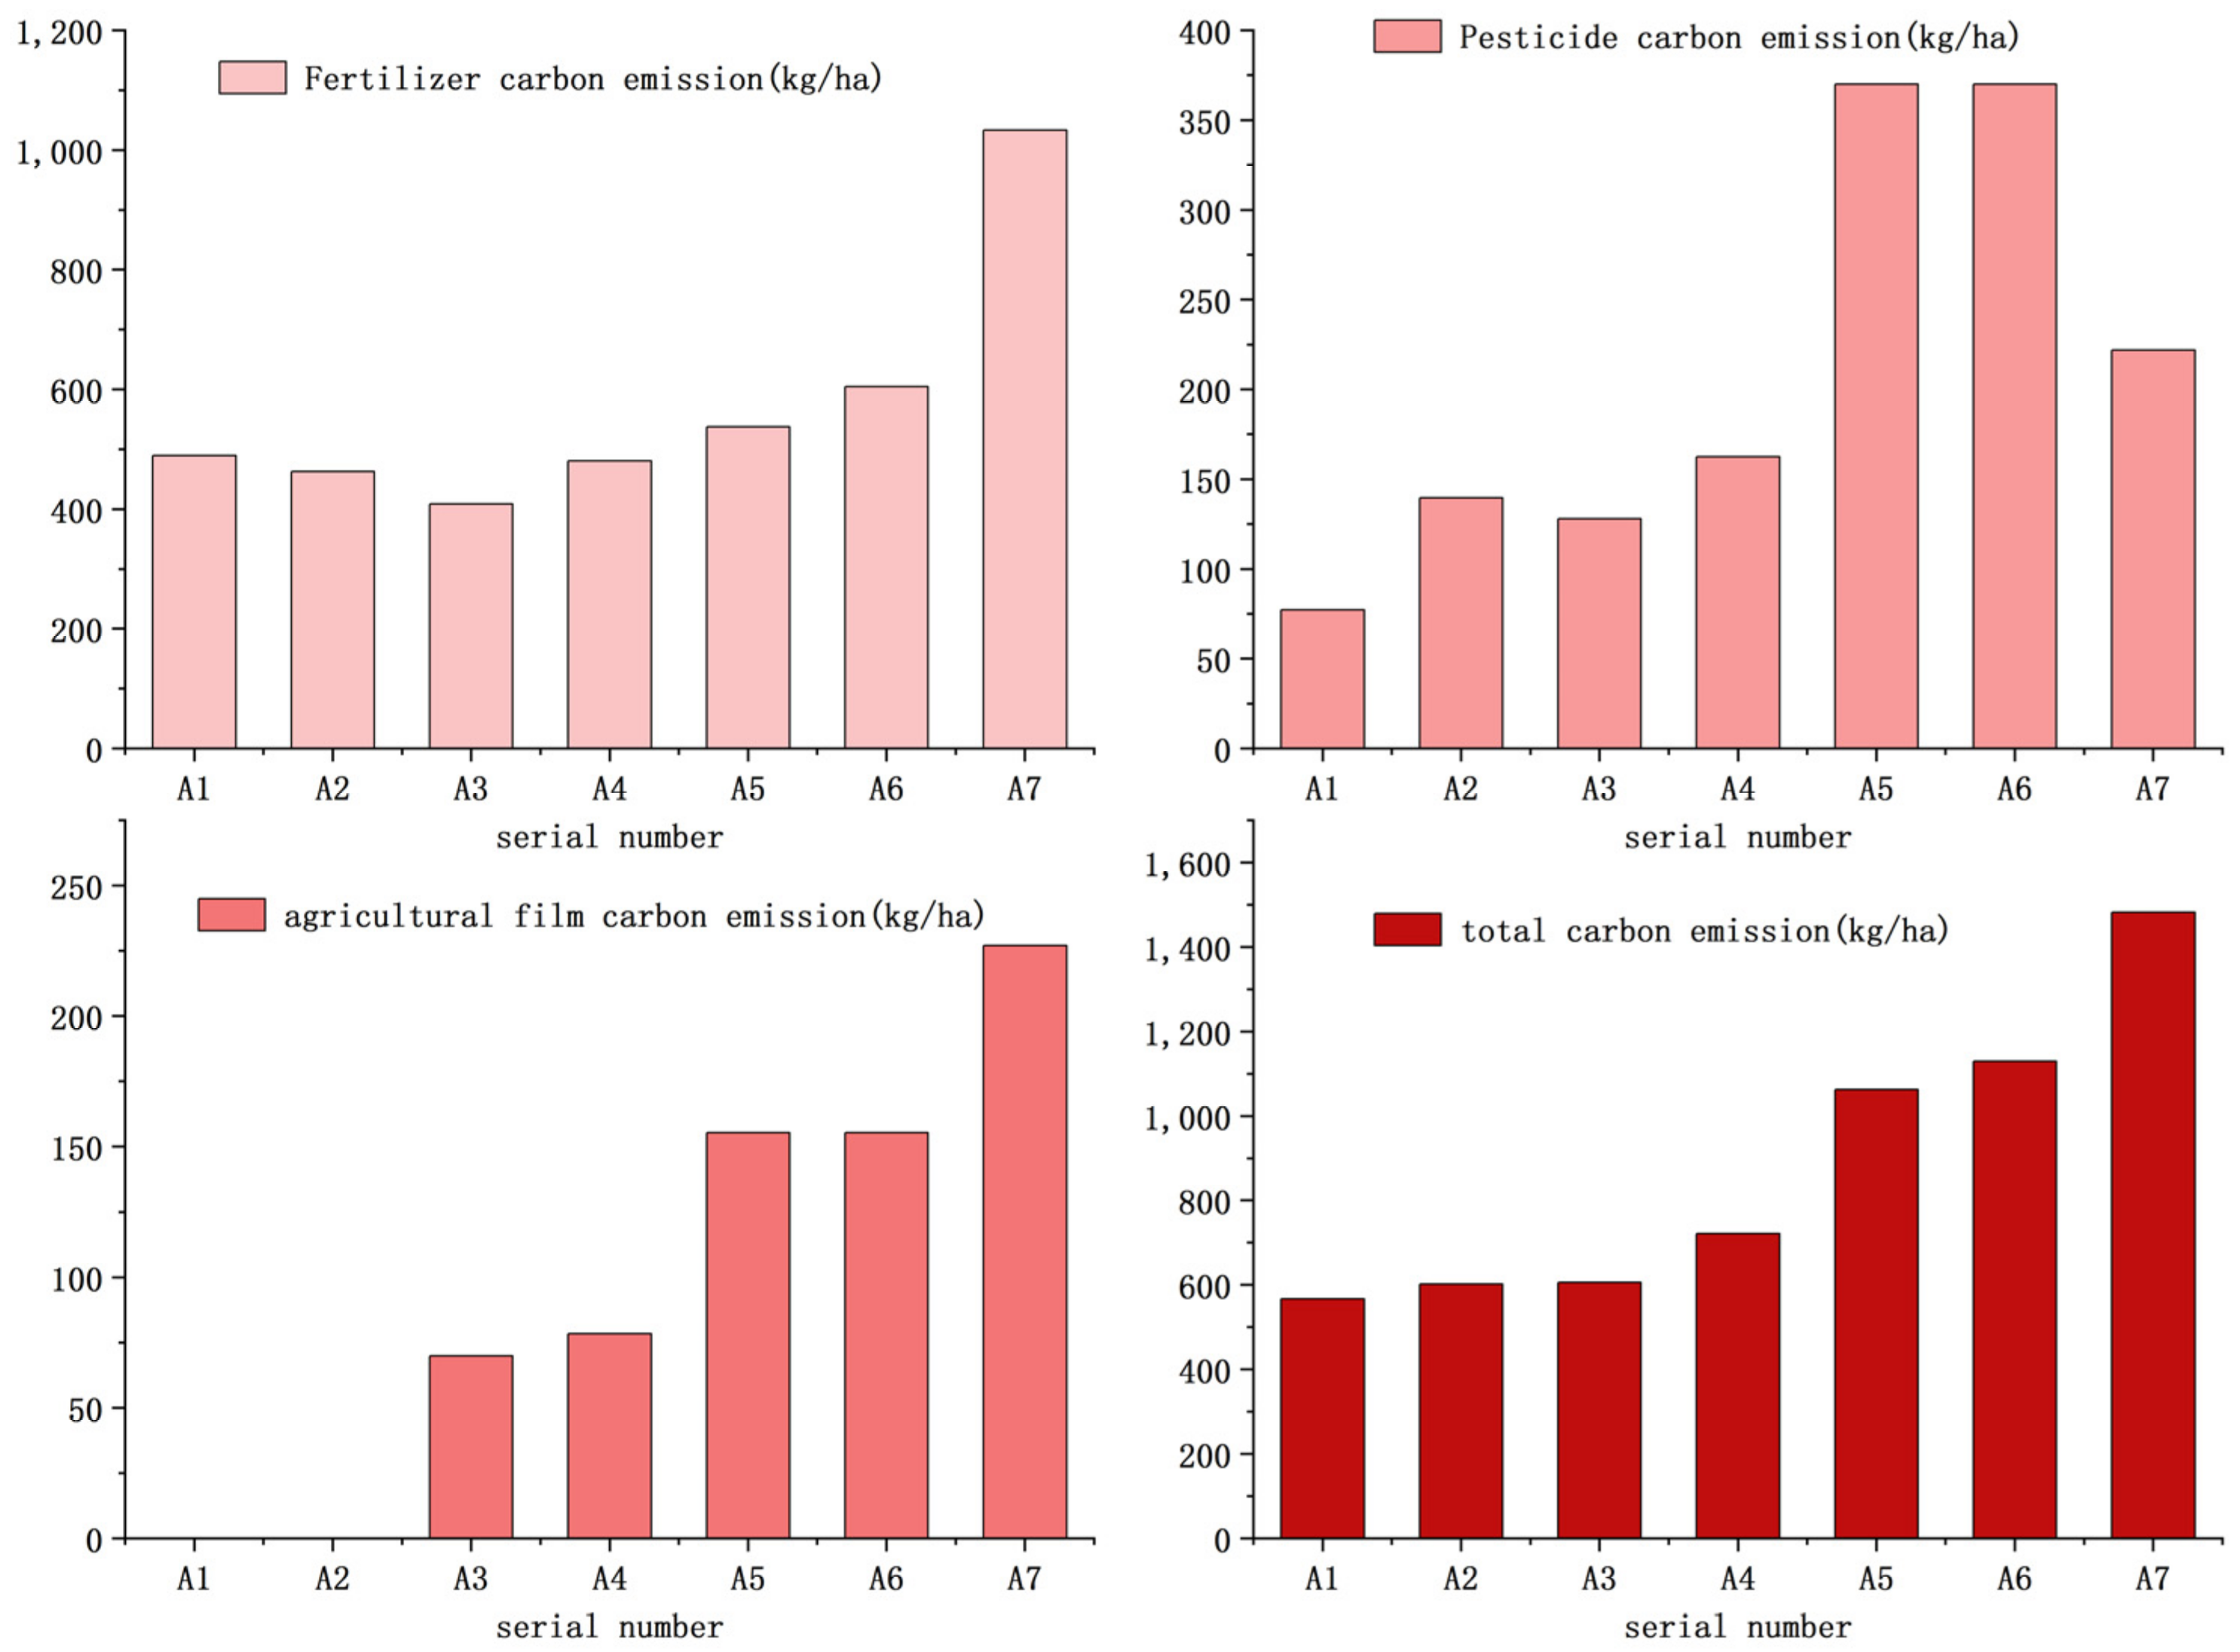
3.2. Carbon Emissions
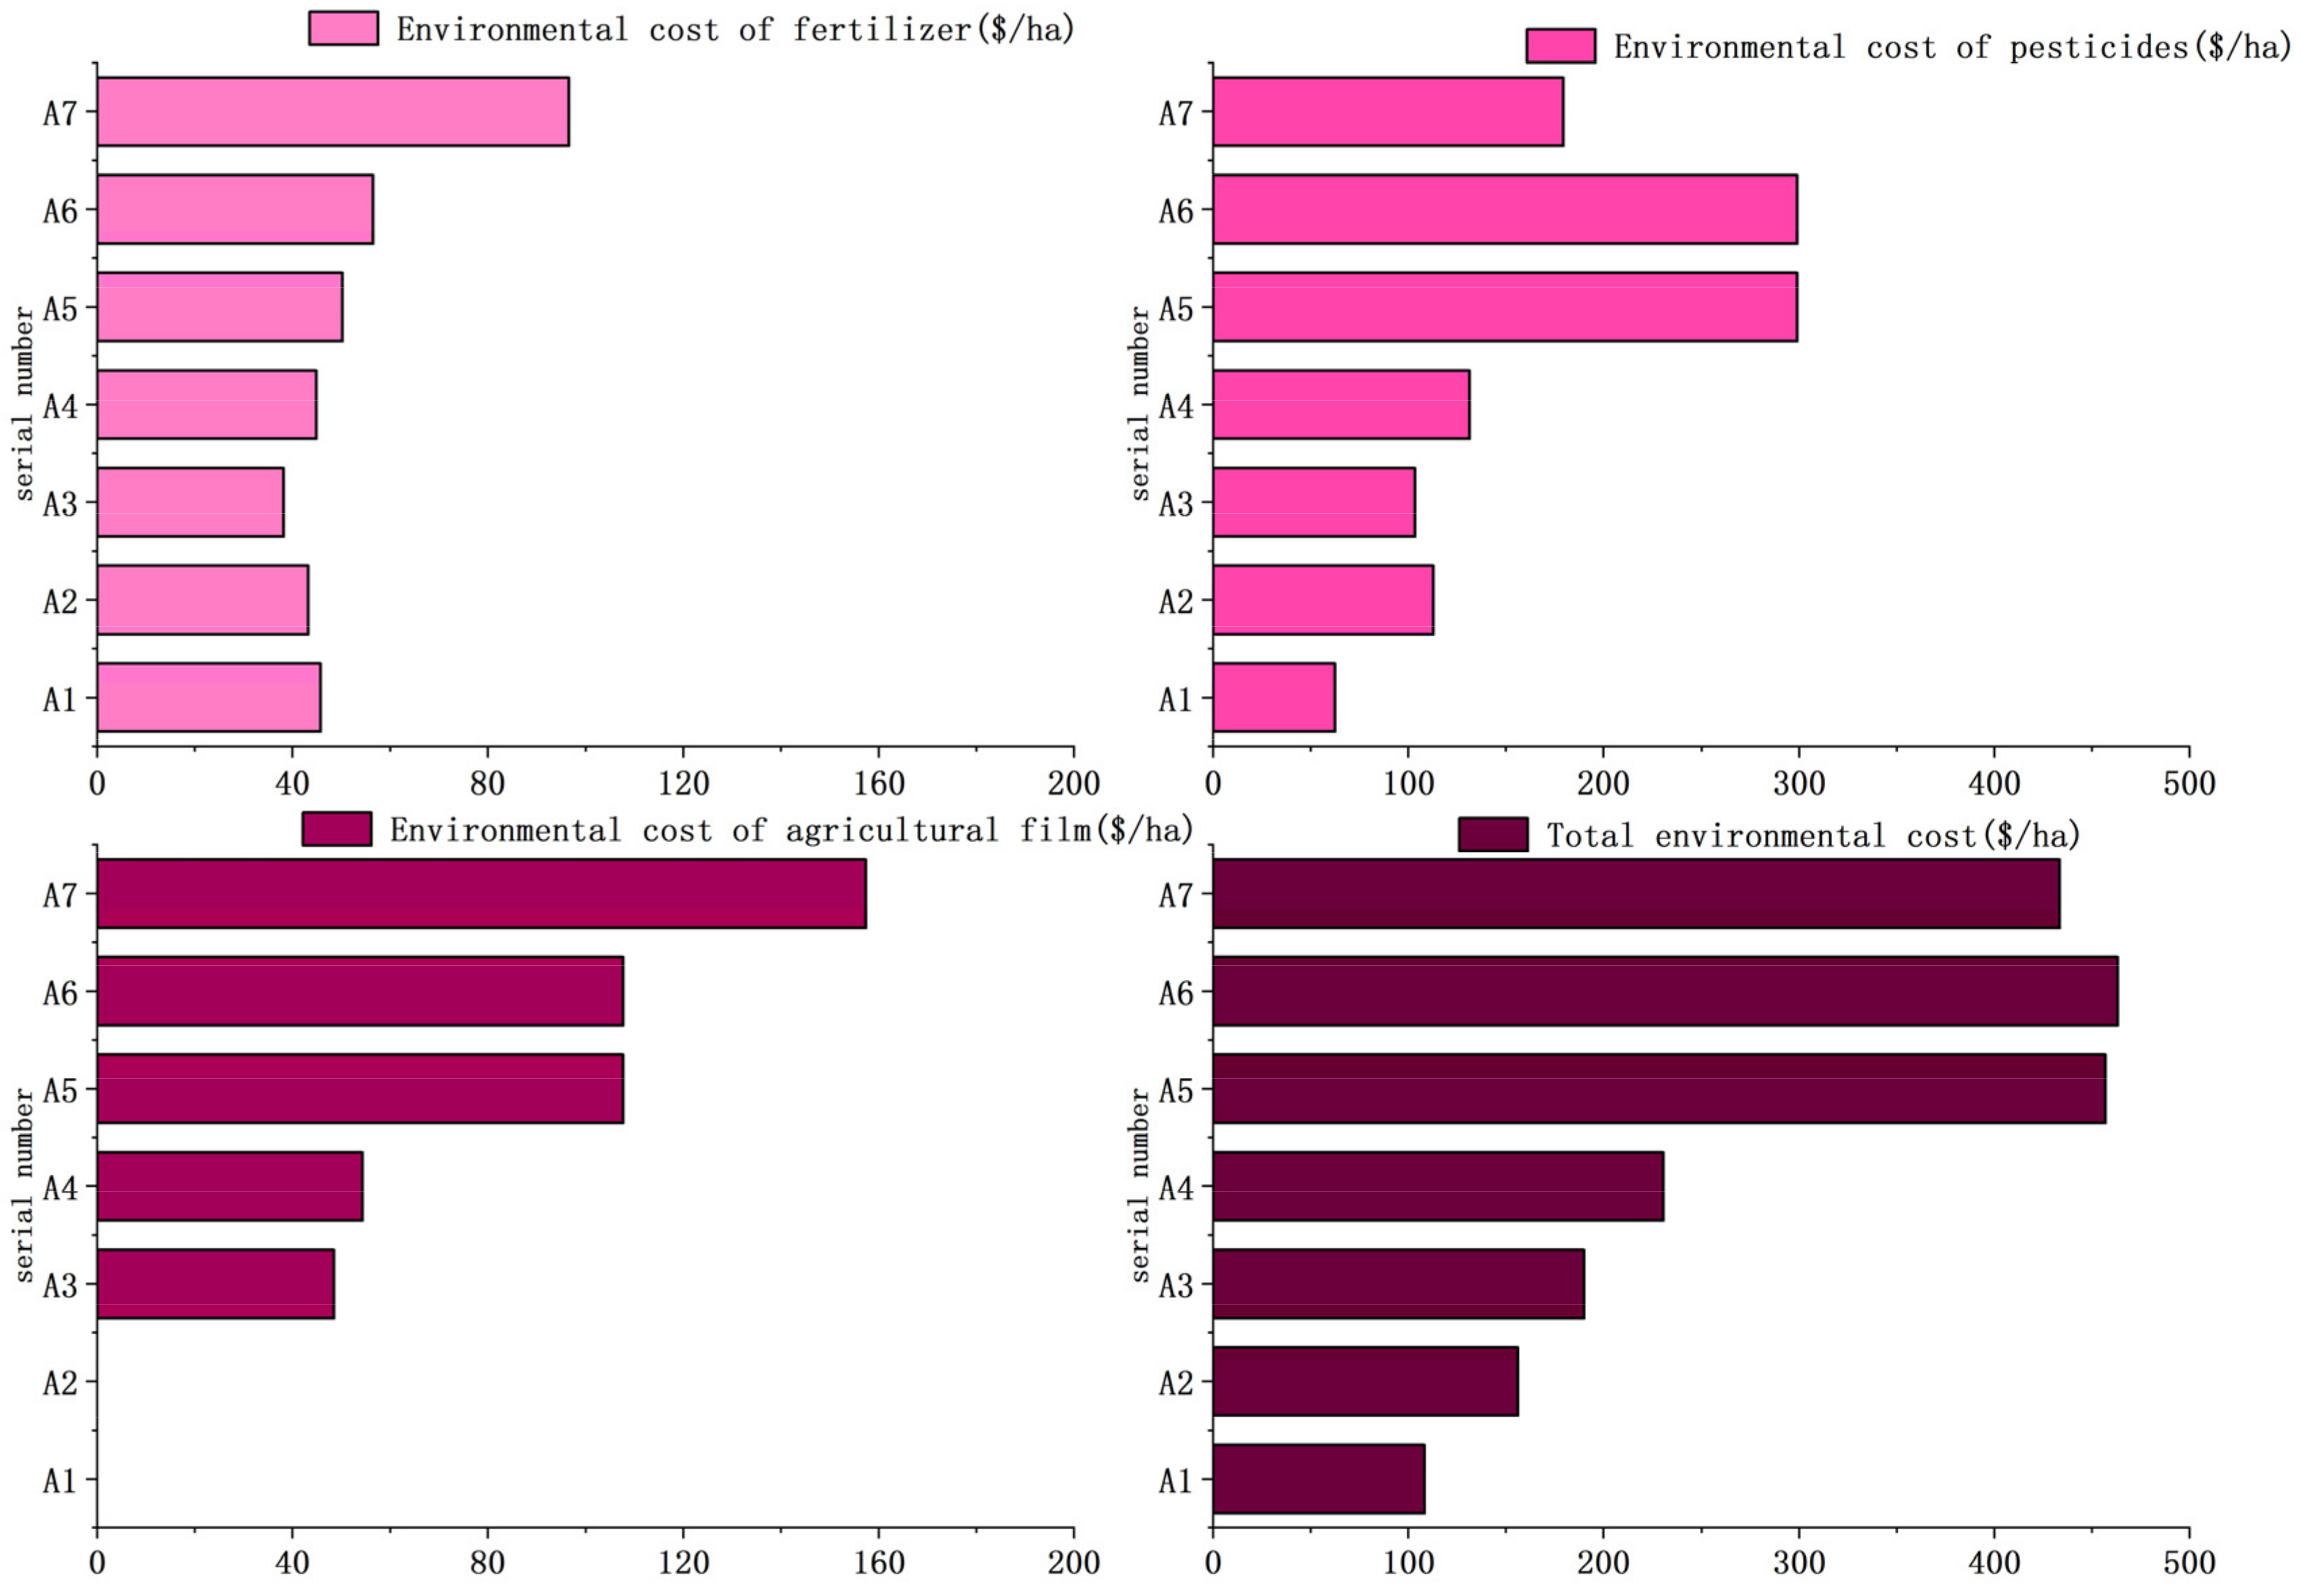
3.3. Environmental Costs
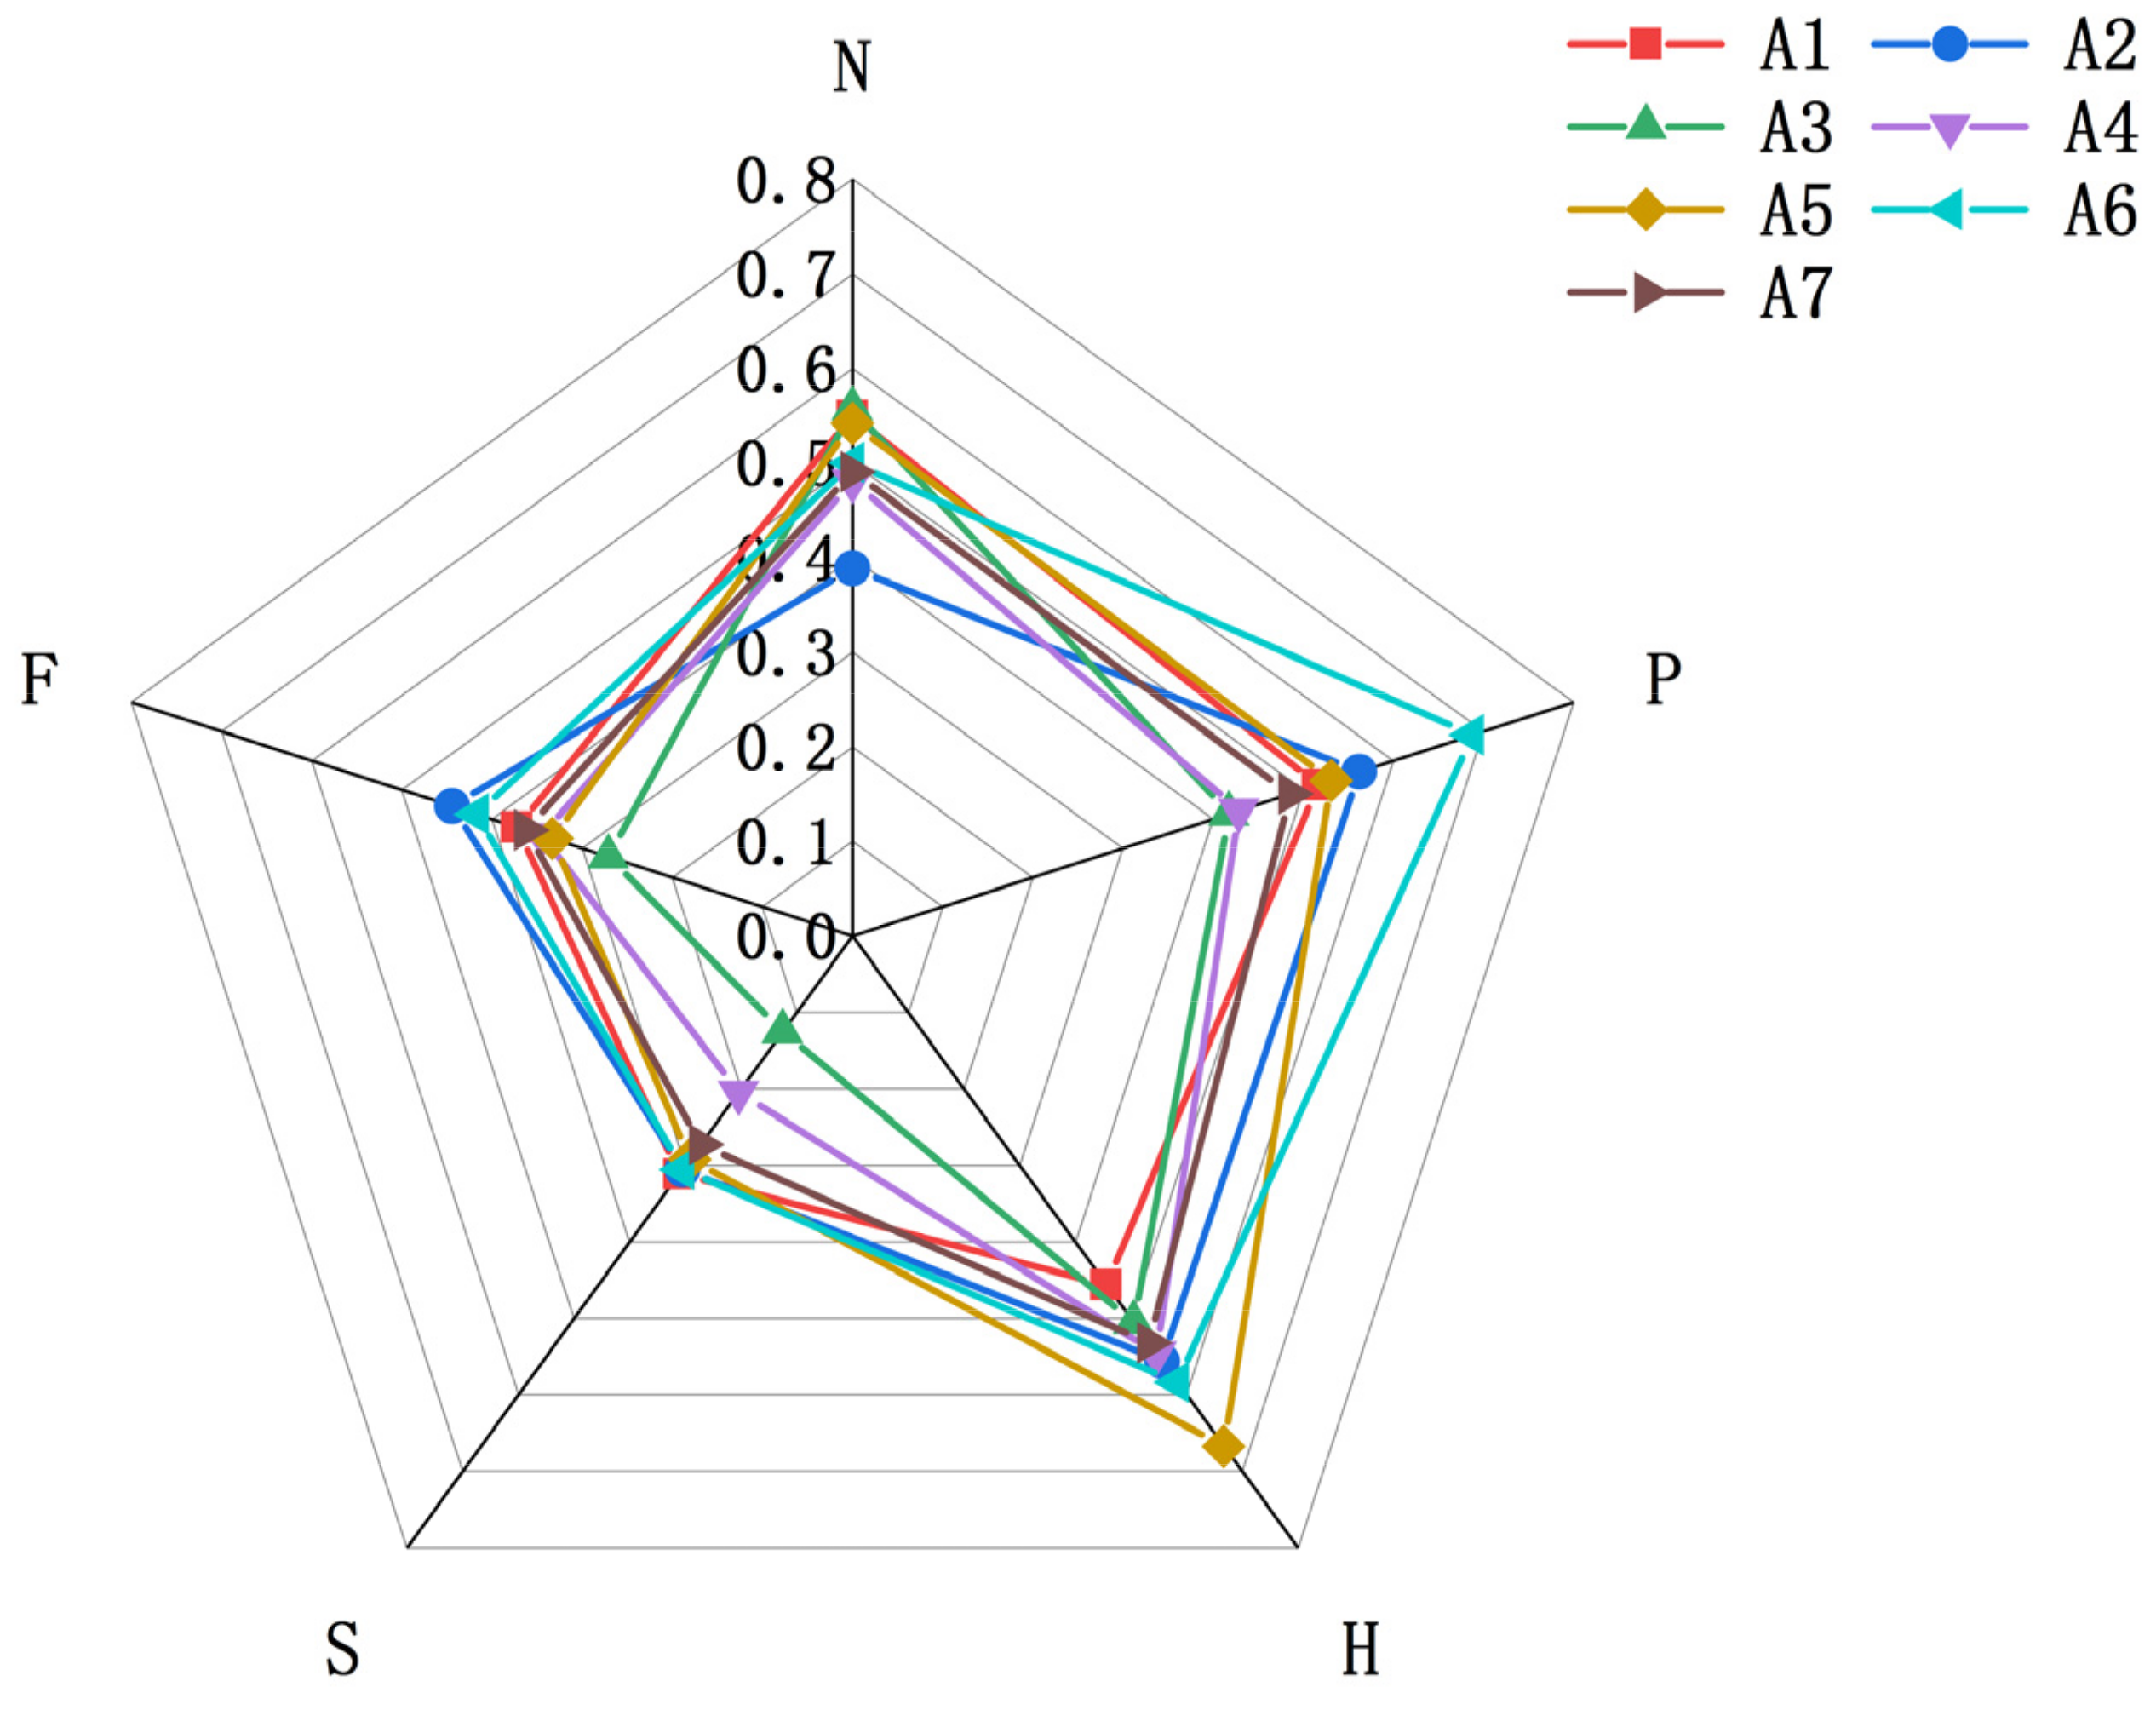
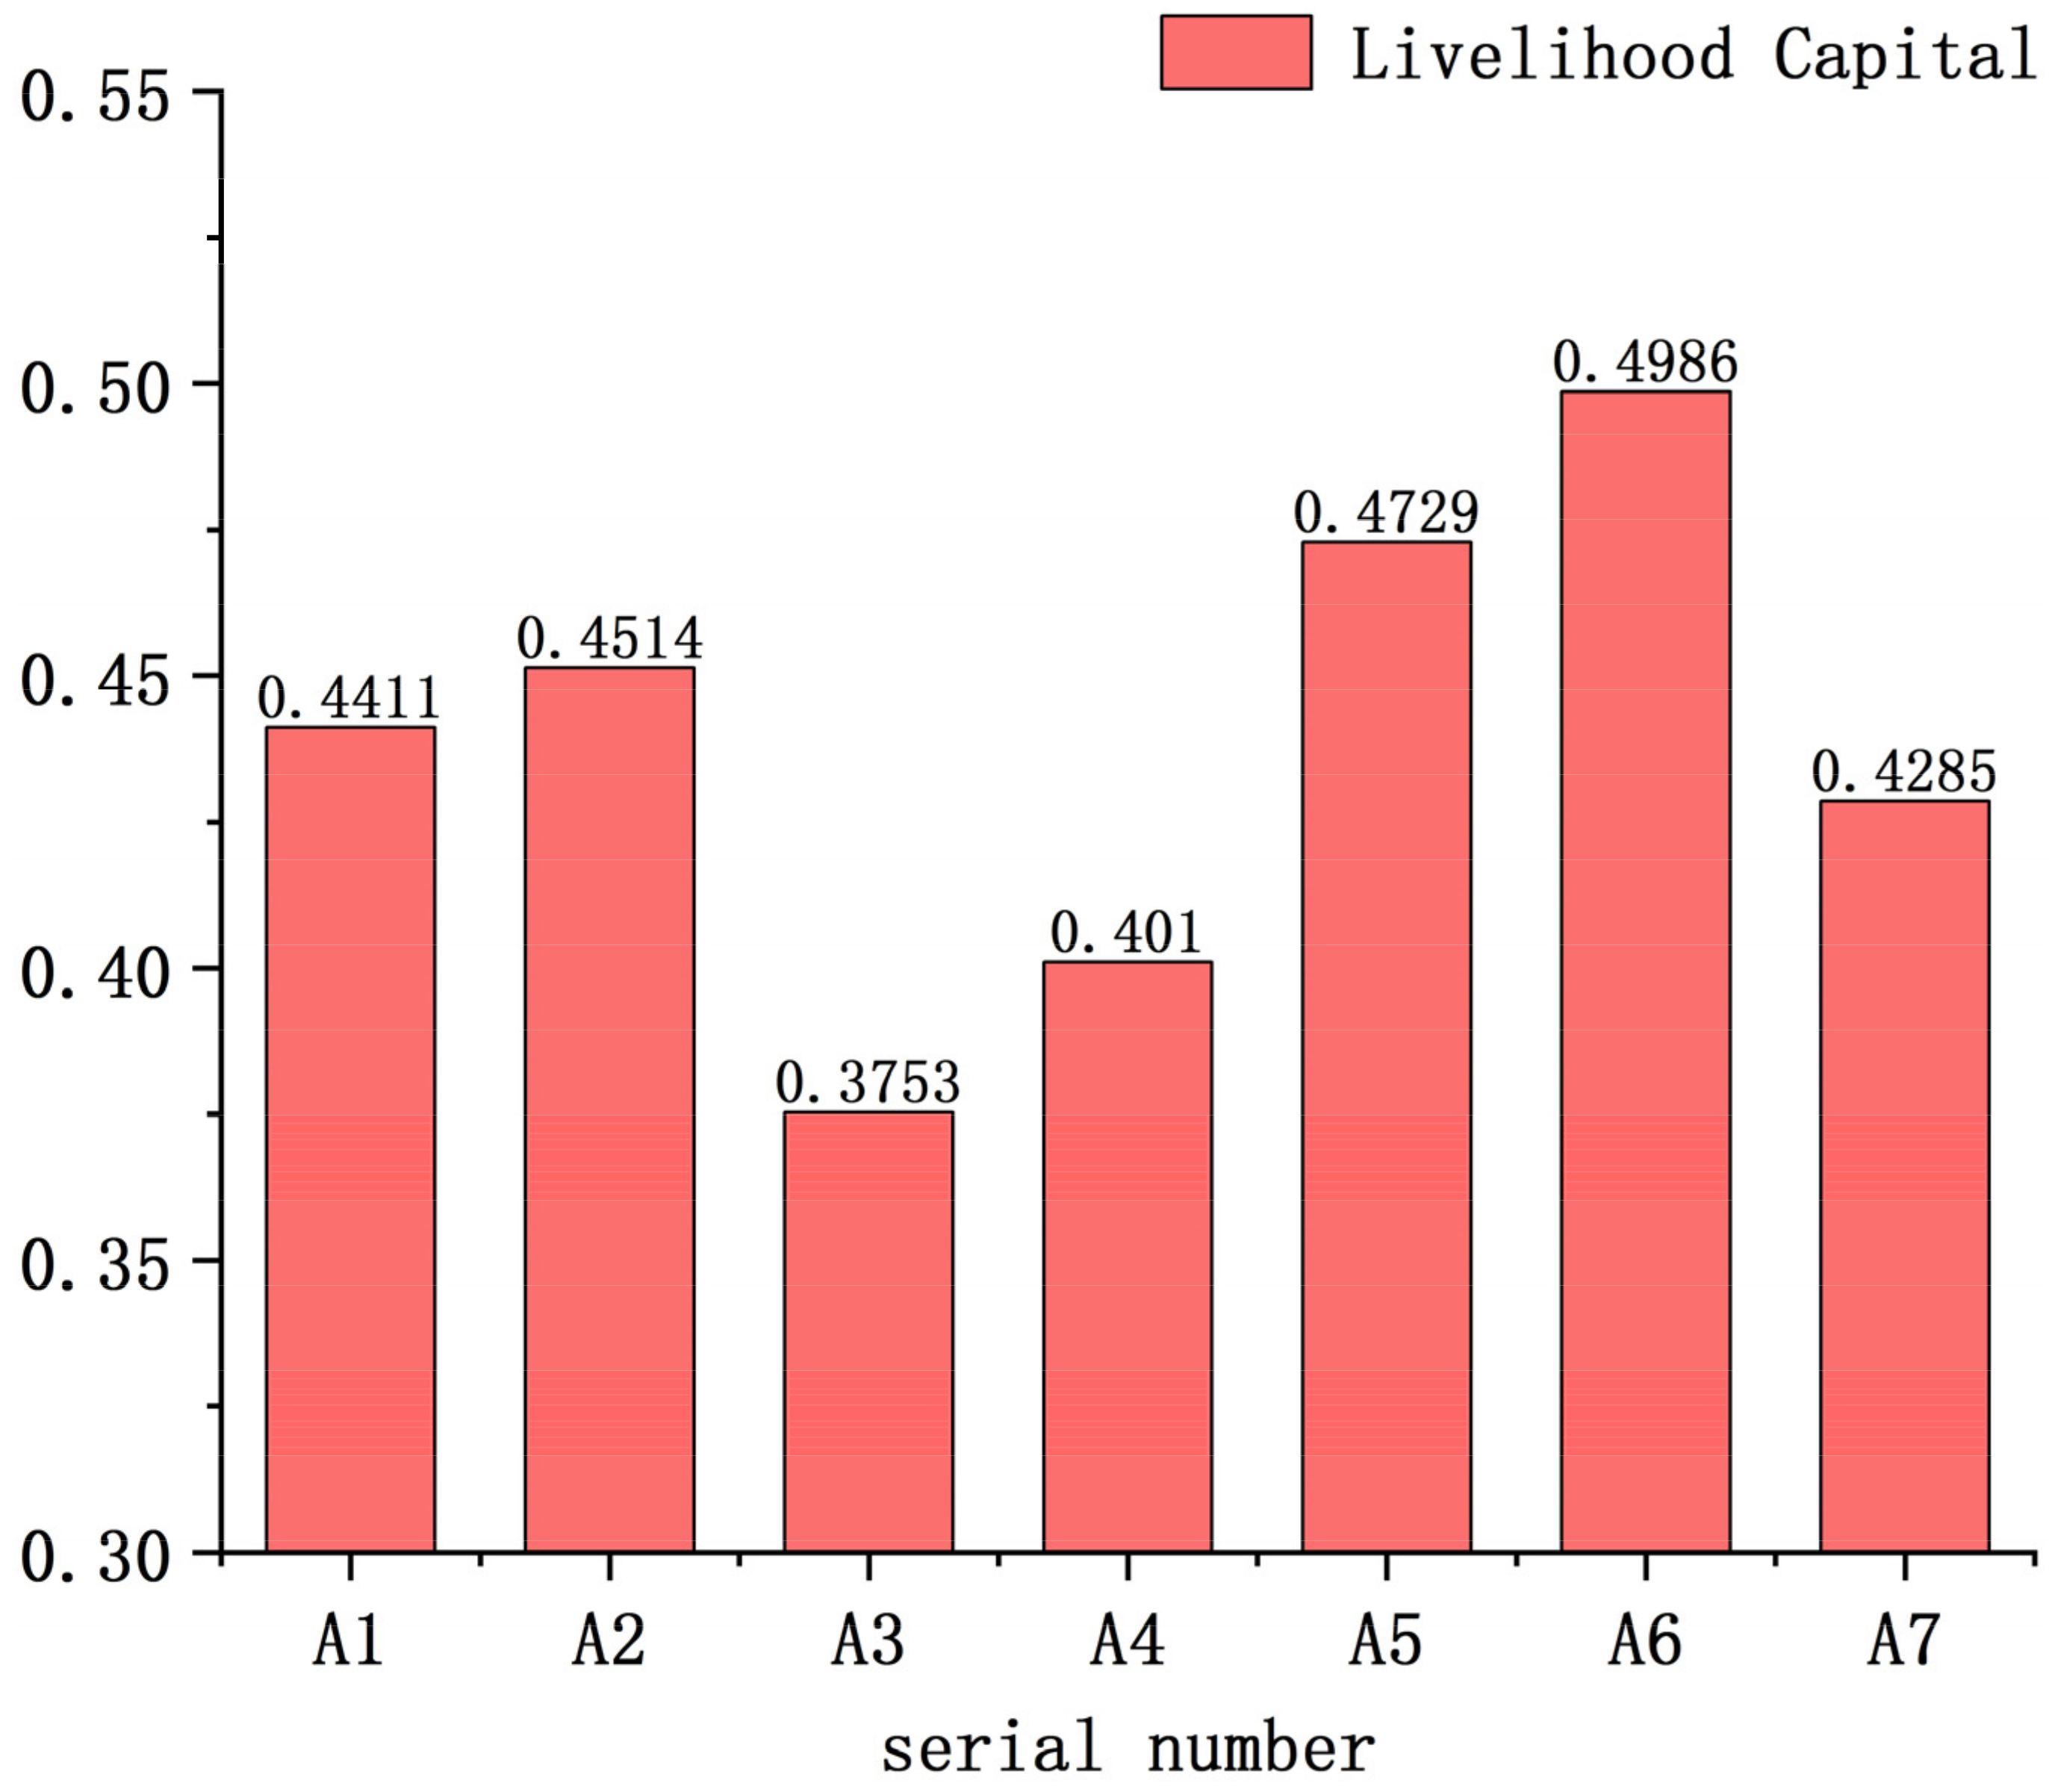
3.4. Livelihood Capital
3.5. Ranking and Optimization of Different Agroforestry Planting Patterns
4. Discussion
4.1. Consideration of Research Directions and Methods
4.2. Consideration of Environmental Indicators
4.3. Analysis on the Livelihood of Agroforestry
4.4. Deficiencies and Prospects
4.4.1. Index and Weight
4.4.2. Data Error
4.4.3. Outlook
5. Conclusions
Author Contributions
Funding
Institutional Review Board Statement
Informed Consent Statement
Data Availability Statement
Conflicts of Interest
References
- Atsri, H.; Abotsi, K.E.; Kokou, K.; Dendi, D.; Segniagbeto, G.H.; Fa, J.E.; Luiselli, L. Ecological challenges for the buffer zone management of a West African National Park. J. Environ. Plan. Manag. 2020, 63, 689–709. [Google Scholar] [CrossRef]
- Kelty, M.J. Species interactions, stand structure, and productivity in agroforestry systems. In Silvicultural Basis for Agroforestry Systems; CRC: Boca Raton, FL, USA, 2000; pp. 183–205. [Google Scholar]
- Amaral, Y.T.; dos Santos, E.M.; Ribeiro, M.C.; Barreto, L. Landscape structural analysis of the Lençóis Maranhenses national park: Implications for conservation. J. Nat. Conserv. 2019, 51, 125725. [Google Scholar] [CrossRef]
- Murniati; Garrity, D.P.; Gintings, A.N. The contribution of agroforestry systems to reducing farmers’ dependence on the resources of adjacent national parks: A case study from Sumatra, Indonesia. Agrofor. Syst. 2001, 52, 171–183. [Google Scholar] [CrossRef]
- Awazi, N.P.; Quandt, A. Livelihood resilience to environmental changes in areas of Kenya and Cameroon: A comparative analysis. Clim. Chang. 2021, 165, 1–17. [Google Scholar] [CrossRef]
- Kormos, C.F.; Bertzky, B.; Jaeger, T.; Shi, Y.; Badman, T.; Hilty, J.A.; Mackey, B.G.; Mittermeier, R.A.; Locke, H.; Osipova, E.; et al. A wilderness approach under the world heritage convention. Conserv. Lett. 2016, 9, 228–235. [Google Scholar] [CrossRef] [Green Version]
- Newmark, W.D. Isolation of African protected areas. Front. Ecol. Environ. 2008, 6, 321–328. [Google Scholar] [CrossRef]
- Hansen, A.J.; DeFries, R. Ecological mechanisms linking protected areas to surrounding lands. Ecol. Appl. 2007, 17, 974–988. [Google Scholar] [CrossRef]
- Laurance, W.F.; Useche, D.C.; Rendeiro, J.; Kalka, M.; Bradshaw, C.; Sloan, S.; Laurance, S.; Campbell, M.; Abernethy, K.; Alvarez, P.; et al. Averting biodiversity collapse in tropical forest protected areas. Nat. Cell Biol. 2012, 489, 290–294. [Google Scholar] [CrossRef] [Green Version]
- Santos, P.Z.F.; Crouzeilles, R.; Sansevero, J. Can agroforestry systems enhance biodiversity and ecosystem service provision in agricultural landscapes? A meta-analysis for the Brazilian Atlantic Forest. For. Ecol. Manag. 2019, 433, 140–145. [Google Scholar] [CrossRef]
- Smith, J.; Pearce, B.D.; Wolfe, M.S. Reconciling productivity with protection of the environment: Is temperate agroforestry the answer? Renew. Agric. Food Syst. 2013, 28, 80–92. [Google Scholar] [CrossRef]
- De Jalón, S.G.; Graves, A.; Palma, J.; Williams, A.; Upson, M.; Burgess, P. Modelling and valuing the environmental impacts of arable, forestry and agroforestry systems: A case study. Agrofor. Syst. 2018, 92, 1059–1073. [Google Scholar] [CrossRef] [Green Version]
- Tiezzi, S. External effects of agricultural production in Italy and environmental accounting. Environ. Resour. Econ. 1999, 13, 459–472. [Google Scholar] [CrossRef]
- Pretty, J.; Brett, C.; Gee, D.; Hine, R.; Mason, C.; Morison, J.; Rayment, M.; Van Der Bijl, G.; Dobbs, T. Policy Challenges and priorities for internalizing the externalities of modern agriculture. J. Environ. Plan. Manag. 2001, 44, 263–283. [Google Scholar] [CrossRef]
- Muhammed, N.; Masum, F.H.; Hossain, M.; Chakma, S.; Oesten, G. Economic dependence of rural people on homestead forestry in Mymensingh, Bangladesh. J. For. Res. 2013, 24, 591–597. [Google Scholar] [CrossRef]
- Stone, M.T.; Nyaupane, G.P. Ecotourism influence on community needs and the functions of protected areas: A systems thinking approach. J. Ecotourism 2016, 16, 222–246. [Google Scholar] [CrossRef]
- Conradin, K.; Hammer, T. Making the most of world natural heritage—Linking conservation and sustainable regional development? Sustainability 2016, 8, 323. [Google Scholar] [CrossRef] [Green Version]
- Erenstein, O.; Hellin, J.; Chandna, P. Poverty mapping based on livelihood assets: A meso-level application in the Indo-Gangetic Plains, India. Appl. Geogr. 2010, 30, 112–125. [Google Scholar] [CrossRef]
- Naughton-Treves, L.; Holland, M.B.; Brandon, K. The role of protected areas in conserving biodiversity and sustaining local livelihoods. Annu. Rev. Environ. Resour. 2005, 30, 219–252. [Google Scholar] [CrossRef] [Green Version]
- Gebru, B.M.; Wang, S.W.; Kim, S.J.; Lee, W.-K. Socio-Ecological niche and factors affecting agroforestry practice adoption in different agroecologies of Southern Tigray, Ethiopia. Sustainability 2019, 11, 3729. [Google Scholar] [CrossRef] [Green Version]
- Thorlakson, T.; Neufeldt, H. Reducing subsistence farmers’ vulnerability to climate change: Evaluating the potential contribu-tions of agroforestry in western Kenya. Agric. Food Secur. 2012, 1, 15. [Google Scholar] [CrossRef] [Green Version]
- Sanchez, P.A. Soil fertility and hunger in Africa. Science 2002, 295, 2019–2020. [Google Scholar] [CrossRef] [PubMed] [Green Version]
- Scherr, S.J.; Franzel, S. Trees on the farm: Assessing the adoption potential of agroforestry practices in Africa. Forestry 2003, 76, 182. [Google Scholar]
- Hanif, A.; Roy, R.M.; Bari, S.; Ray, P.C.; Rahman, S.; Hasan, F. Livelihood improvements through agroforestry: Evidence from Northern Bangladesh. Small Scale For. 2018, 17, 505–522. [Google Scholar] [CrossRef]
- Quandt, A. Measuring livelihood resilience: The household livelihood resilience approach (HLRA). World Dev. 2018, 107, 253–263. [Google Scholar] [CrossRef]
- Ecer, F. A consolidated MCDM framework for performance assessment of battery electric vehicles based on ranking strategies. Renew. Sustain. Energy Rev. 2021, 143, 110916. [Google Scholar] [CrossRef]
- Wu, W.-W. Beyond Travel & Tourism competitiveness ranking using DEA, GST, ANN and Borda count. Expert Syst. Appl. 2011, 38, 12974–12982. [Google Scholar] [CrossRef]
- Rosa-Schleich, J.; Loos, J.; Mußhoff, O.; Tscharntke, T. Ecological-economic trade-offs of Diversified Farming Systems—A review. Ecol. Econ. 2019, 160, 251–263. [Google Scholar] [CrossRef]
- Liu, Q.; Gu, Z.; Lu, Y.; Xiao, S.; Li, G. Weathering processes of the dolomite in Shibing (Guizhou) and formation of collapse and stone peaks. Environ. Earth Sci. 2015, 74, 1823–1831. [Google Scholar] [CrossRef]
- Bai, Y.; He, Q.; Liu, Z.; Wu, Z.; Xie, S. Soil nutrient variation impacted by ecological restoration in the different lithological karst area, Shibing, China. Glob. Ecol. Conserv. 2021, 25, e01399. [Google Scholar] [CrossRef]
- Dummett, M. The Borda count and agenda manipulation. Soc. Choice Welf. 1998, 15, 289–296. [Google Scholar] [CrossRef]
- García-Lapresta, J.L.; Martínez-Panero, M.; Meneses, L. Defining the Borda count in a linguistic decision making context. Inf. Sci. 2009, 179, 2309–2316. [Google Scholar] [CrossRef]
- Qiu, Z.; Dosskey, M.G.; Kang, Y. Choosing between alternative placement strategies for conservation buffers using Borda count. Landsc. Urban Plan. 2016, 153, 66–73. [Google Scholar] [CrossRef] [Green Version]
- García-Lapresta, J.L.; Martínez-Panero, M. Borda count versus approval voting: A fuzzy approach. Public Choice 2002, 112, 167–184. [Google Scholar] [CrossRef]
- Neveling, M.; Rothe, J. Control complexity in Borda elections: Solving all open cases of offline control and some cases of online control. Artif. Intell. 2021, 298, 103508. [Google Scholar] [CrossRef]
- West, T.; Marland, G. A synthesis of carbon sequestration, carbon emissions, and net carbon flux in agriculture: Comparing tillage practices in the United States. Agric. Ecosyst. Environ. 2002, 91, 217–232. [Google Scholar] [CrossRef]
- Wu, F.; Li, L.; Zhang, H.; Chen, F. Effects of conservation tillage on net carbon flux from farmland ecosystems. Chin. J. Ecol. 2007, 26, 4. [Google Scholar]
- Song, M. Analysis and assessment on environmental costs of arable land utilization: A Ccase of Wuhan city. China Popul. Resour. Environ. 2013, 23, 76–83. [Google Scholar] [CrossRef]
- Xiang, P.; Huang, H.; Yan, H.; Zhou, Y.; Zheng, H.; Huang, X. Environmental cost of rice production in Dongting Lake area of Hunan Province. Ying Yong Sheng Tai Xue Bao J. Appl. Ecol. 2005, 16, 2187–2193. [Google Scholar]
- Reganold, J.P.; Wachter, J.M. Organic agriculture in the twenty-first century. Nat. Plants 2016, 2, 15221. [Google Scholar] [CrossRef] [PubMed]
- Zerihun, M. Agroforestry practices in livelihood improvement in the eastern cape province of South Africa. Sustainability 2021, 13, 8477. [Google Scholar] [CrossRef]
- Kiyani, P.; Andoh, J.; Lee, Y.; Lee, D.K. Benefits and challenges of agroforestry adoption: A case of Musebeya sector, Nyamagabe District in southern province of Rwanda. For. Sci. Technol. 2017, 13, 174–180. [Google Scholar] [CrossRef]
- Renganathan, S. Educating the Orang Asli children: Exploring indigenous children’s practices and experiences in schools. J. Educ. Res. 2016, 109, 275–285. [Google Scholar] [CrossRef]
- Mohri, H.; Lahoti, S.; Saito, O.; Mahalingam, A.; Gunatilleke, N.; Irham; Hoang, V.T.; Hitinayake, G.; Takeuchi, K.; Herath, S. Assessment of ecosystem services in homegarden systems in Indonesia, Sri Lanka, and Vietnam. Ecosyst. Serv. 2013, 5, 124–136. [Google Scholar] [CrossRef]
- Rakodi, C. A Capital assets framework for analysing household livelihood strategies: Implications for policy. Dev. Policy Rev. 1999, 17, 315–342. [Google Scholar] [CrossRef]
- Campbell, B.; Sayer, J.A.; Frost, P.; Vermeulen, S.; Ruiz-Pérez, M.; Cunningham, T.; Prabhu, R. Assessing the performance of natural resource systems. Conserv. Ecol. 2002, 5, 22. [Google Scholar] [CrossRef] [Green Version]
- SShen, Y.; Liu, D.; Luo, Y.; Huang, M.; Lan, S. Research on the evaluation model of community settlements development modes of Fujian taining world natural heritage site of “China Danxia”. Chin. Landsc. Archit. 2020, 36, 29–33. [Google Scholar] [CrossRef]
- Vallejo, M.; Ramírez, M.I.; Reyes-González, A.; López-Sánchez, J.G.; Casas, A. Agroforestry systems of the Tehuacán-Cuicatlán Valley: Land use for biocultural diversity conservation. Land 2019, 8, 24. [Google Scholar] [CrossRef] [Green Version]
- Zou, Z.; Zeng, F.; Wang, K.; Zeng, Z.; Zhao, L.; Du, H.; Zhang, F.; Zhang, H. Emergy and economic evaluation of seven typical agroforestry planting patterns in the Karst region of Southwest China. Forests 2019, 10, 138. [Google Scholar] [CrossRef] [Green Version]
- Zou, Z.; Zeng, F.; Wang, K.; Zeng, Z.; Tang, H.; Zhang, H. Evaluation and tradeoff analysis of ecosystem service for typical land-use patterns in the Karst region of Southwest China. Forests 2020, 11, 451. [Google Scholar] [CrossRef] [Green Version]
- Ma, Q.; Wang, Y. Evaluating the externally environmental cost of cotton production in Xinjiang. J. Arid. Land Resour. Environ. 2015, 29, 64–68. [Google Scholar] [CrossRef]
- Wang, J. The Ecological Value and Environmental Cost Research of Agroforestry System in Southern Xinjiang—Take the Typical Area as an Example; Tarim University: Xinjiang, China, 2016. [Google Scholar]
- Nautiyal, S.; Maikhuri, R.K.; Semwal, R.L.; Rao, K.S.; Saxena, K.G. Agroforestry systems in the rural landscape—A case study in Garhwal Himalaya, India. Agrofor. Syst. 1998, 41, 151–165. [Google Scholar] [CrossRef]


| Carbon Source | Coefficient | Reference |
|---|---|---|
| fertilizer (kg/kg) | 0.8956 | Oak Ridge National Laboratory [36] |
| pesticide (kg/kg) | 4.9341 | Oak Ridge National Laboratory [36] |
| agricultural films (kg/kg) | 5.1800 | Institute of Resources and Ecological Environment, Nanjing Agricultural University [37] |
| Serial Number | Patterns | Fertilizer Inputs (kg) | Pesticide Inputs (kg) | Agricultural Films Inputs (kg) |
|---|---|---|---|---|
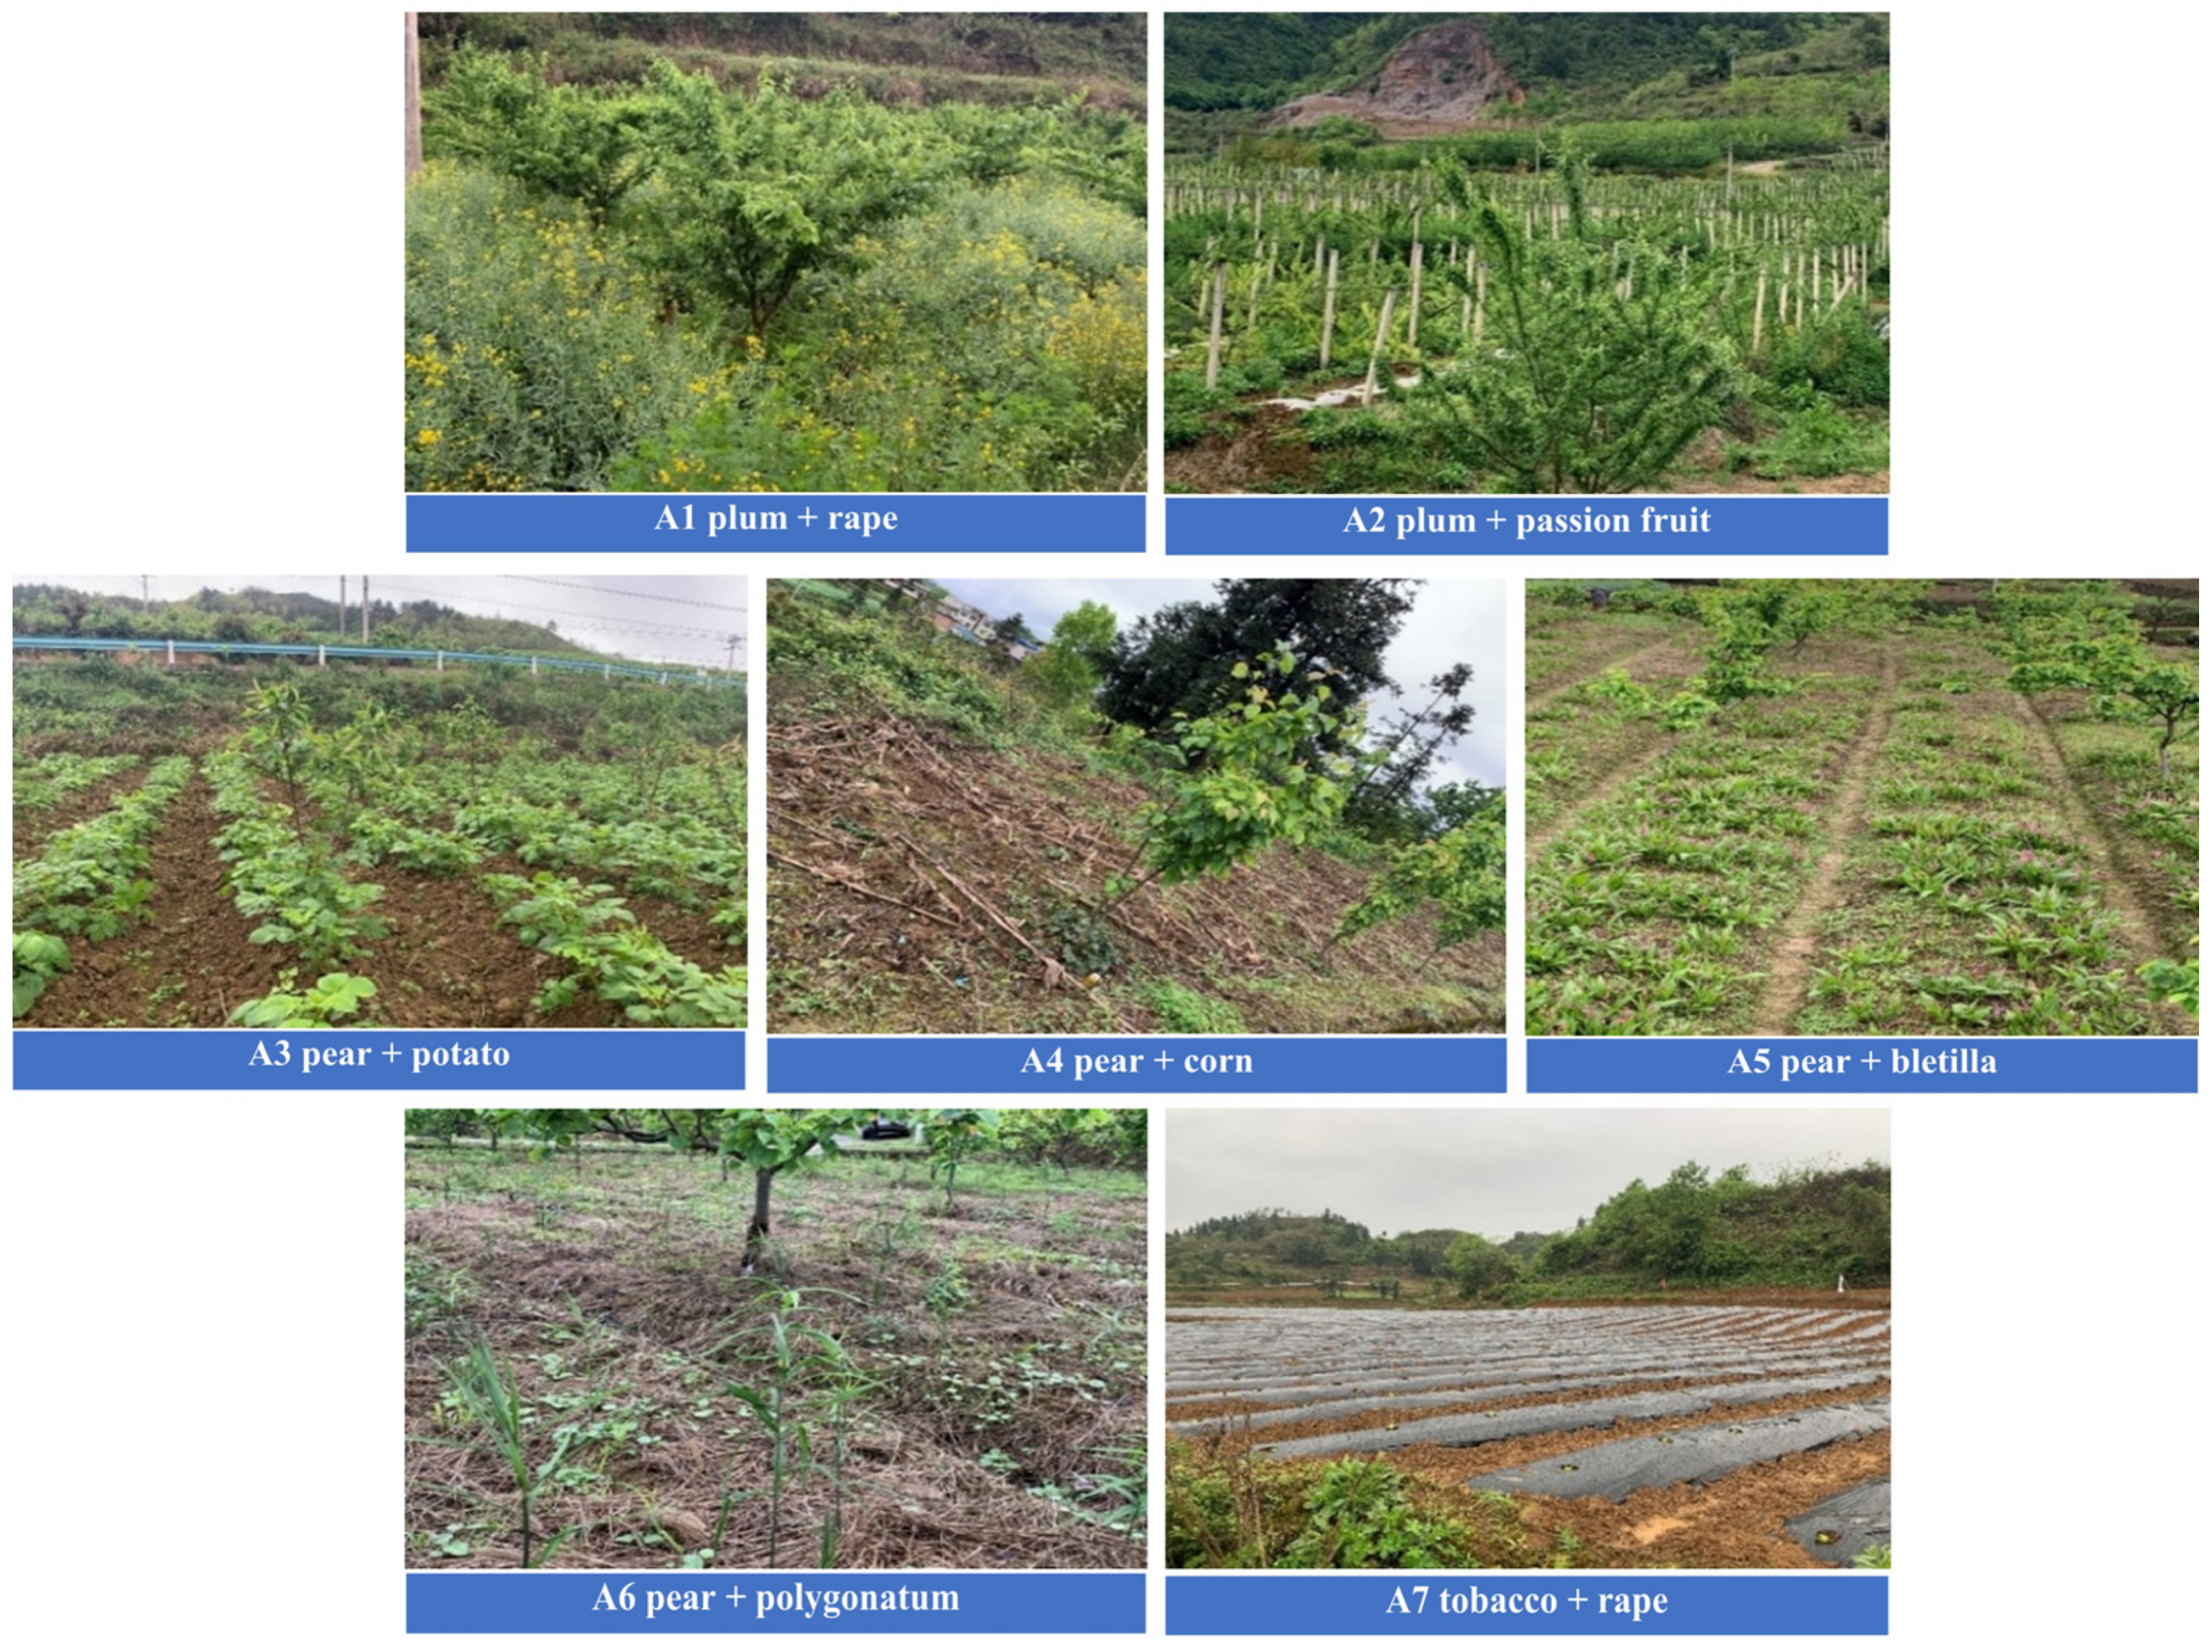
| A1 | plum + rape | 546.67 | 15.67 | 0.00 |
| A2 | plum + passion fruit | 516.67 | 28.30 | 0.00 |
| A3 | pear + potato | 456.25 | 25.94 | 13.50 |
| A4 | pear + corn | 536.36 | 32.95 | 15.14 |
| A5 | pear + bletilla | 600.00 | 75.00 | 30.00 |
| A6 | pear + polygonatum | 675.00 | 75.00 | 30.00 |
| A7 | tobacco + rape | 1153.85 | 45.00 | 43.85 |
| Asset | Quantitative Indicator |
|---|---|
| Natural Capital | Size of farmland (area) The quality of farmland (level) Crop diversity (the number of) |
| Physical Capital | Road conditions (level) Distance of public facilities from home (how far) The traffic tools (the number of) Agricultural machinery (the number of) |
| Human Capital | Labor (the number of) The degree of education (level) Family health (yes or no) |
| Social Capital | Political influence (yes or no) Social cost (level) Participation in cooperatives (yes or no) |
| Financial Capital | Paid work (yes or no) Bank deposits (the number of) Livestock (the number of) |
| Serial Number | Net Output Value ($) | Carbon Emission (kg) | Environmental Cost ($) | Livelihood Capital |
|---|---|---|---|---|
| A1 | 10,909.99 | 566.91 | 108.23 | 0.4411 |
| A2 | 18,854.92 | 602.36 | 156.08 | 0.4514 |
| A3 | 9351.60 | 606.54 | 190.07 | 0.3753 |
| A4 | 9601.26 | 721.37 | 230.61 | 0.401 |
| A5 | 66,280.99 | 1062.82 | 456.94 | 0.4729 |
| A6 | 44,480.85 | 1129.99 | 463.22 | 0.4986 |
| A7 | 12,633.12 | 1482.57 | 433.38 | 0.4285 |
Publisher’s Note: MDPI stays neutral with regard to jurisdictional claims in published maps and institutional affiliations. |
© 2021 by the authors. Licensee MDPI, Basel, Switzerland. This article is an open access article distributed under the terms and conditions of the Creative Commons Attribution (CC BY) license (https://creativecommons.org/licenses/by/4.0/).
Share and Cite
Luo, X.; Xiong, K.; Zhang, J.; Chen, D. A Study on Optimal Agroforestry Planting Patterns in the Buffer Zone of World Natural Heritage Sites. Sustainability 2021, 13, 11544. https://doi.org/10.3390/su132011544
Luo X, Xiong K, Zhang J, Chen D. A Study on Optimal Agroforestry Planting Patterns in the Buffer Zone of World Natural Heritage Sites. Sustainability. 2021; 13(20):11544. https://doi.org/10.3390/su132011544
Chicago/Turabian StyleLuo, Xing, Kangning Xiong, Juan Zhang, and Dong Chen. 2021. "A Study on Optimal Agroforestry Planting Patterns in the Buffer Zone of World Natural Heritage Sites" Sustainability 13, no. 20: 11544. https://doi.org/10.3390/su132011544