Article

Decision-Making Behavior Analysis and Empirical Study under Information Intervention in a Cold Environment

1
Key Laboratory of Traffic Engineering, College Metropolitan Transportation, Beijing University of Technology, 100 Pingleyuan, Chaoyang District, Beijing 100124, China
2
Research Institute for Road Safety of MPS, Beijing 100062, China
*
Author to whom correspondence should be addressed.
Sustainability 2021, 13(20), 11522; https://doi.org/10.3390/su132011522
Submission received: 10 September 2021 / Revised: 11 October 2021 / Accepted: 15 October 2021 / Published: 18 October 2021

Abstract

:
Some mega-sport events such as the Winter Olympics are usually held in areas accompanied by cold environment, which has a great risk of frostbite and safety for pedestrians. Releasing guidance information have become a good way for managers to reduce freezing time, improve travel efficiency and prevent safety accidents. In this article, the 2022 Winter Olympics were taken as an example to discuss influence of information intervention on TDMB (travel decision-making behavior). The mechanism of the TDMB was explored, and a survey of pedestrian behavior was carried out in the area. In particular, the influence of the subjective perception and objective factors on the RDMB (route decision-making behavior) was analyzed based on the SEM-logit model. The results show that information, congestion and the cold have an impact on the decision-making behavior. The path coefficient values of the pedestrians’ perception of information, congestion and the cold were 0.557, 0.216 and 0.324, respectively, which indicates that guidance information has the most serious impact on the pedestrians’ comprehensive perception. The objective factors including outdoor walking time, information intervention frequency, distance to a heated space had a significant impact on the RDMB. Indeed, when information intervention frequency is 2, the compliance rate of pedestrians to the information can be effectively increased. If the manager wants to alleviate traffic congestion, setting up heated spaces within a radius of 1 km is a good way to divert pedestrians. This study can provide a scientific reference for the sustainable development of mega-sport events, long-term construction of service facilities and the passenger flow management in a cold environment.

1. Introduction

The Winter Olympics have always attracted attention of people all over the world. When bidding for the 2022 Winter Olympic Games, the Chinese government put forward the slogan “300 million people on ice and snow” to promote the development of winter sports. However, winter sports are often accompanied by severe conditions such as low temperature, rugged mountain roads, ice and snow, etc. On the one hand, if pedestrians spend too much time in a cold environment, the risk of freezing is increased and their own safety cannot be guaranteed [1]. On the other hand, during mega-sport events, the passenger flow has the characteristics of strong short-time aggregation and uneven space–time distribution, especially in the peak periods. Once emergencies occur, there is a high risk of congestion, and even of safety accidents. This is also an important factor affecting travel safety. In this case study of the 2022 Winter Olympics, the Beijing Yanqing competition area, one of the 2022 Winter Olympics areas, is located in cold mountains and has a relatively cold environment. According to the meteorological data in the recent years [2], it is predicted that the average temperature will reach −10.5 °C and the average wind speed will reach grade 6 (10.8–13.8 m/s) during the competitions. If the pedestrians are blocked on the roads in the area due to congestion, they will fall into a low-temperature and low-speed state, and the safety risk for the pedestrians will be increased. In order to reduce the impact of cold environments and congestion, pedestrians need to improve travel efficiency. It is important to implement travel decision-making. Managers can provide effective traffic information guidance to the pedestrians to change travel decision-making, and the crowded passenger flow will be separated. The purpose of alleviating traffic congestion and improving travel efficiency will be achieved.
However, there is a lack of research on the probability of pedestrian obedience to information and travel decision-making in a cold environment. It is difficult to make information release schemes formulated by managers. Therefore, the influence of information guidance on the TDMB in a cold environment is discussed in detail, and the mechanism of TDMB of pedestrians is analyzed quantitatively. The results can provide decision support for the passenger flow management and information service platform at mega-sport events.
The article is organized as follows. Section 2 presents the literature review. Section 3 analyses the mechanism of the TDMB. Section 4 introduces the questionnaire and the SEM-logit model for the RDMB. Section 5 describes the results with the model. Section 6 summarizes the conclusion.

2. Literature Review

2.1. Traffic Management in a Cold Environment

Compared with the general environment, cold environment can make pedestrians produce special physiological and physiological reactions. In terms of physiology, Chen (2019) [3] found that the pedestrians’ ability to adapt to the cold is poor. Cold environment not only easily causes frostbite, but also affects the body’s metabolism, skeletal muscle function, nerve, blood, circulation and other systems. Min (2021) [4] found that the extension of the cold time and the increase in cold intensity could gradually weaken a pedestrian’s body and even cause hypothermia or systemic frostbite. In terms of psychology, Zhang (2021) [5] found that cold environment could cause emotional disturbance and produce negative emotions such as tension, depression, anger or fatigue. As the cold time increases, the negative emotions become more severe, and the cognitive ability becomes lower. Therefore, the effect of the cold on the pedestrians’ physiology and psychology changes dramatically with the increase in freezing time.
In order to prevent frostbite brought by the cold to pedestrians, some traffic management measures have been explored by some researchers. Chen (2008) [6] proposed a series of traffic control measures for the Winter Olympics and studied the relationship between the measures and the traffic volume. Fiorucci and Gaetani (2005) [7] analyzed the impact of cold weather on the efficiency of the traffic network, explained the preventive measures for the traffic system and proposed a traffic management response system based on weather changes. With the system, the optimal allocation of resources under severe conditions can be determined by managers. Generally, mega-sport events are mostly held in the cold environment where the temperature is −5 °C and the wind speed is above grade 1 [8]. Compared with conventional traffic, travel characteristics of pedestrians undergo tremendous changes in these areas [9]. Due to the unique characteristics of the passenger flow, it is necessary to formulate the traffic management policy that is more suitable for a cold environment to enhance travel safety. However, previous works on the traffic management in snowy or cold competition areas mostly focus on the emergency safety management [10] and the layout of traffic facilities [11]; there is a lack of research involving information intervention to improve the travel experience. Actually, the impact of information intervention is quite different [12] when the environment gets cold. Therefore, discussing the internal relationship between the information intervention and the pedestrian travel in a cold environment plays an important role for managers to formulate traffic intervention measures and ensure traffic efficiency.

2.2. Travel Decision-Making Behavior

According to Maslow’s hierarchy of demands theory, pedestrians’ demands are distributed in a trapezoid form, that is, from the initial physiological and safety demands to the demands of social interaction, respect and self-actualization [13]. Pearce (1982) [14] pointed out that individuals at different demand levels have different travel demands, and with the increase in travel experience, a higher level of demand is gradually generated. Hence, pedestrians at a higher demand level are bound to adopt the travel decision-making behavior in the face of environmental changes to maintain the higher travel experience level. When the environment changes, pedestrians change or adjust the original travel plan to adapt to the travel demand in the new environment; in this process, the decision-making behavior occurs [15,16,17]. The route decision-making behavior is one of the travel decision-making behaviors. In the case of this article, it is mainly the route decision-making behavior, so the route decision-making behavior is sorted out. As for the route decision-making behavior, researchers have conducted a lot of studies from different perspectives. In terms of crowding factors, Shailes et al. (2001) [18] found that when pedestrians make travel plans, they tend to avoid congestion by adjusting travel routes and departure time. Kusakabe et al. (2012) [19] studied the impact of accident information released by VMSs (variable message signs) on the travelers’ route decision-making on highways and the results showed that travelers could assume the travel time of their alternative routes based on the VMS congestion information. Raveau et al. (2014) [20] studied the route decision-making behavior of passengers in the London Underground and the Santiago Metro and found that passengers in different cities have different tolerance for congestion. Vedel et al. (2017) [21] conducted experimental simulations of the travelers’ route decision-making and the results show that there are significant negative effects when people use a given route in parking and crowded situations. In terms of information factors, Agrawal et al. (2021) [22] analyzed the travelers’ route decision-making behavior using a hybrid route decision-making model. The model results show that more perception effort towards information increases the probability of a route choice. Zhao et al. (2019) [23] investigated and analyzed the travelers’ route decision-making behavior; the influence of VMS information attention and information content on the travelers’ path choice was studied by establishing a logit model. Han (2017) [24] concluded that the information content in scenic areas has a significant impact on the behavior of tourists. However, studies mostly focus on the RDMB in the conventional environment rather than in cold or other harsh environments. Actually, the environment is an important factor that causes great changes in travel decision-making in the area [25,26]. It is necessary to analyze the impact of a cold environment on the RDMB to provide a scientific basis for the passenger flow management.

3. Travel Decision-Making Behavior Mechanism

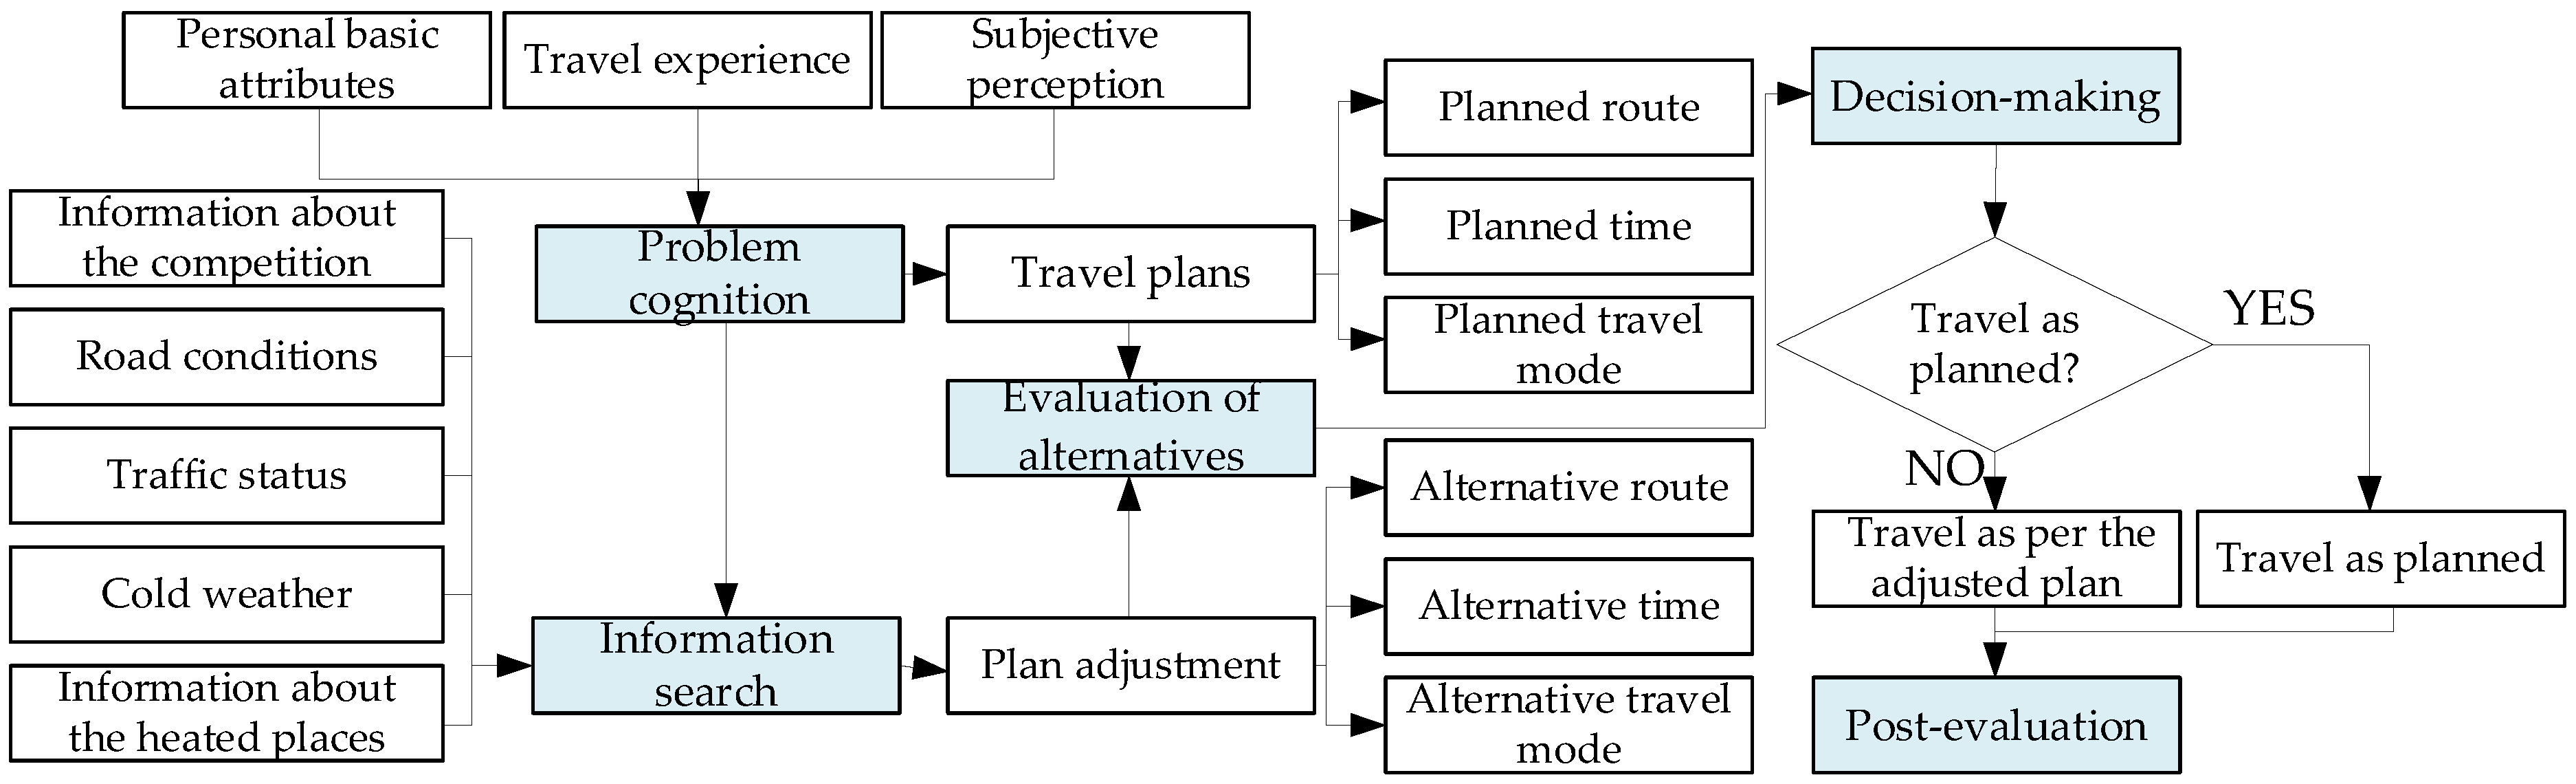
3.1. Behavior Mechanism

The pedestrians’ spectating experiences are impacted by the information displayed, the congestion state and the cold environment. According to their comprehensive perception and demands, the TDMB occurs. Based on the theory of consumer purchasing decisions [27,28], the process of the TDMB can be divided into five stages: problem cognition, information search, evaluation of alternatives, decision-making and post-evaluation. The process is shown in Figure 1.
(1) In the problem cognition stage, pedestrians clarify their travel demands in the competition area through internal psychological activities or perception of external stimulation, then make travel routes.
(2) In the information search stage, pedestrians search for or receive both internal and external information. The internal information is mainly about their original travel experience, while the external information includes information about cold weather, road conditions, etc. In this stage, the decision-making motivation is formulated.
(3) In the alternative evaluation stage, the original travel plan and the alternatives are compared and evaluated by pedestrians after the comprehensive feedback of the information in stage 2.
(4) In the decision-making stage, pedestrians make subjective decisions in their particular environment. Assuming that pedestrians are completely rational, they will choose the greatest utility among the alternatives. As can be seen from Figure 1, the route decision-making behavior is one of the travel decision-making behaviors.
(5) In the post-evaluation stage, pedestrians summarize the travel experience and compare it to the travel intention.

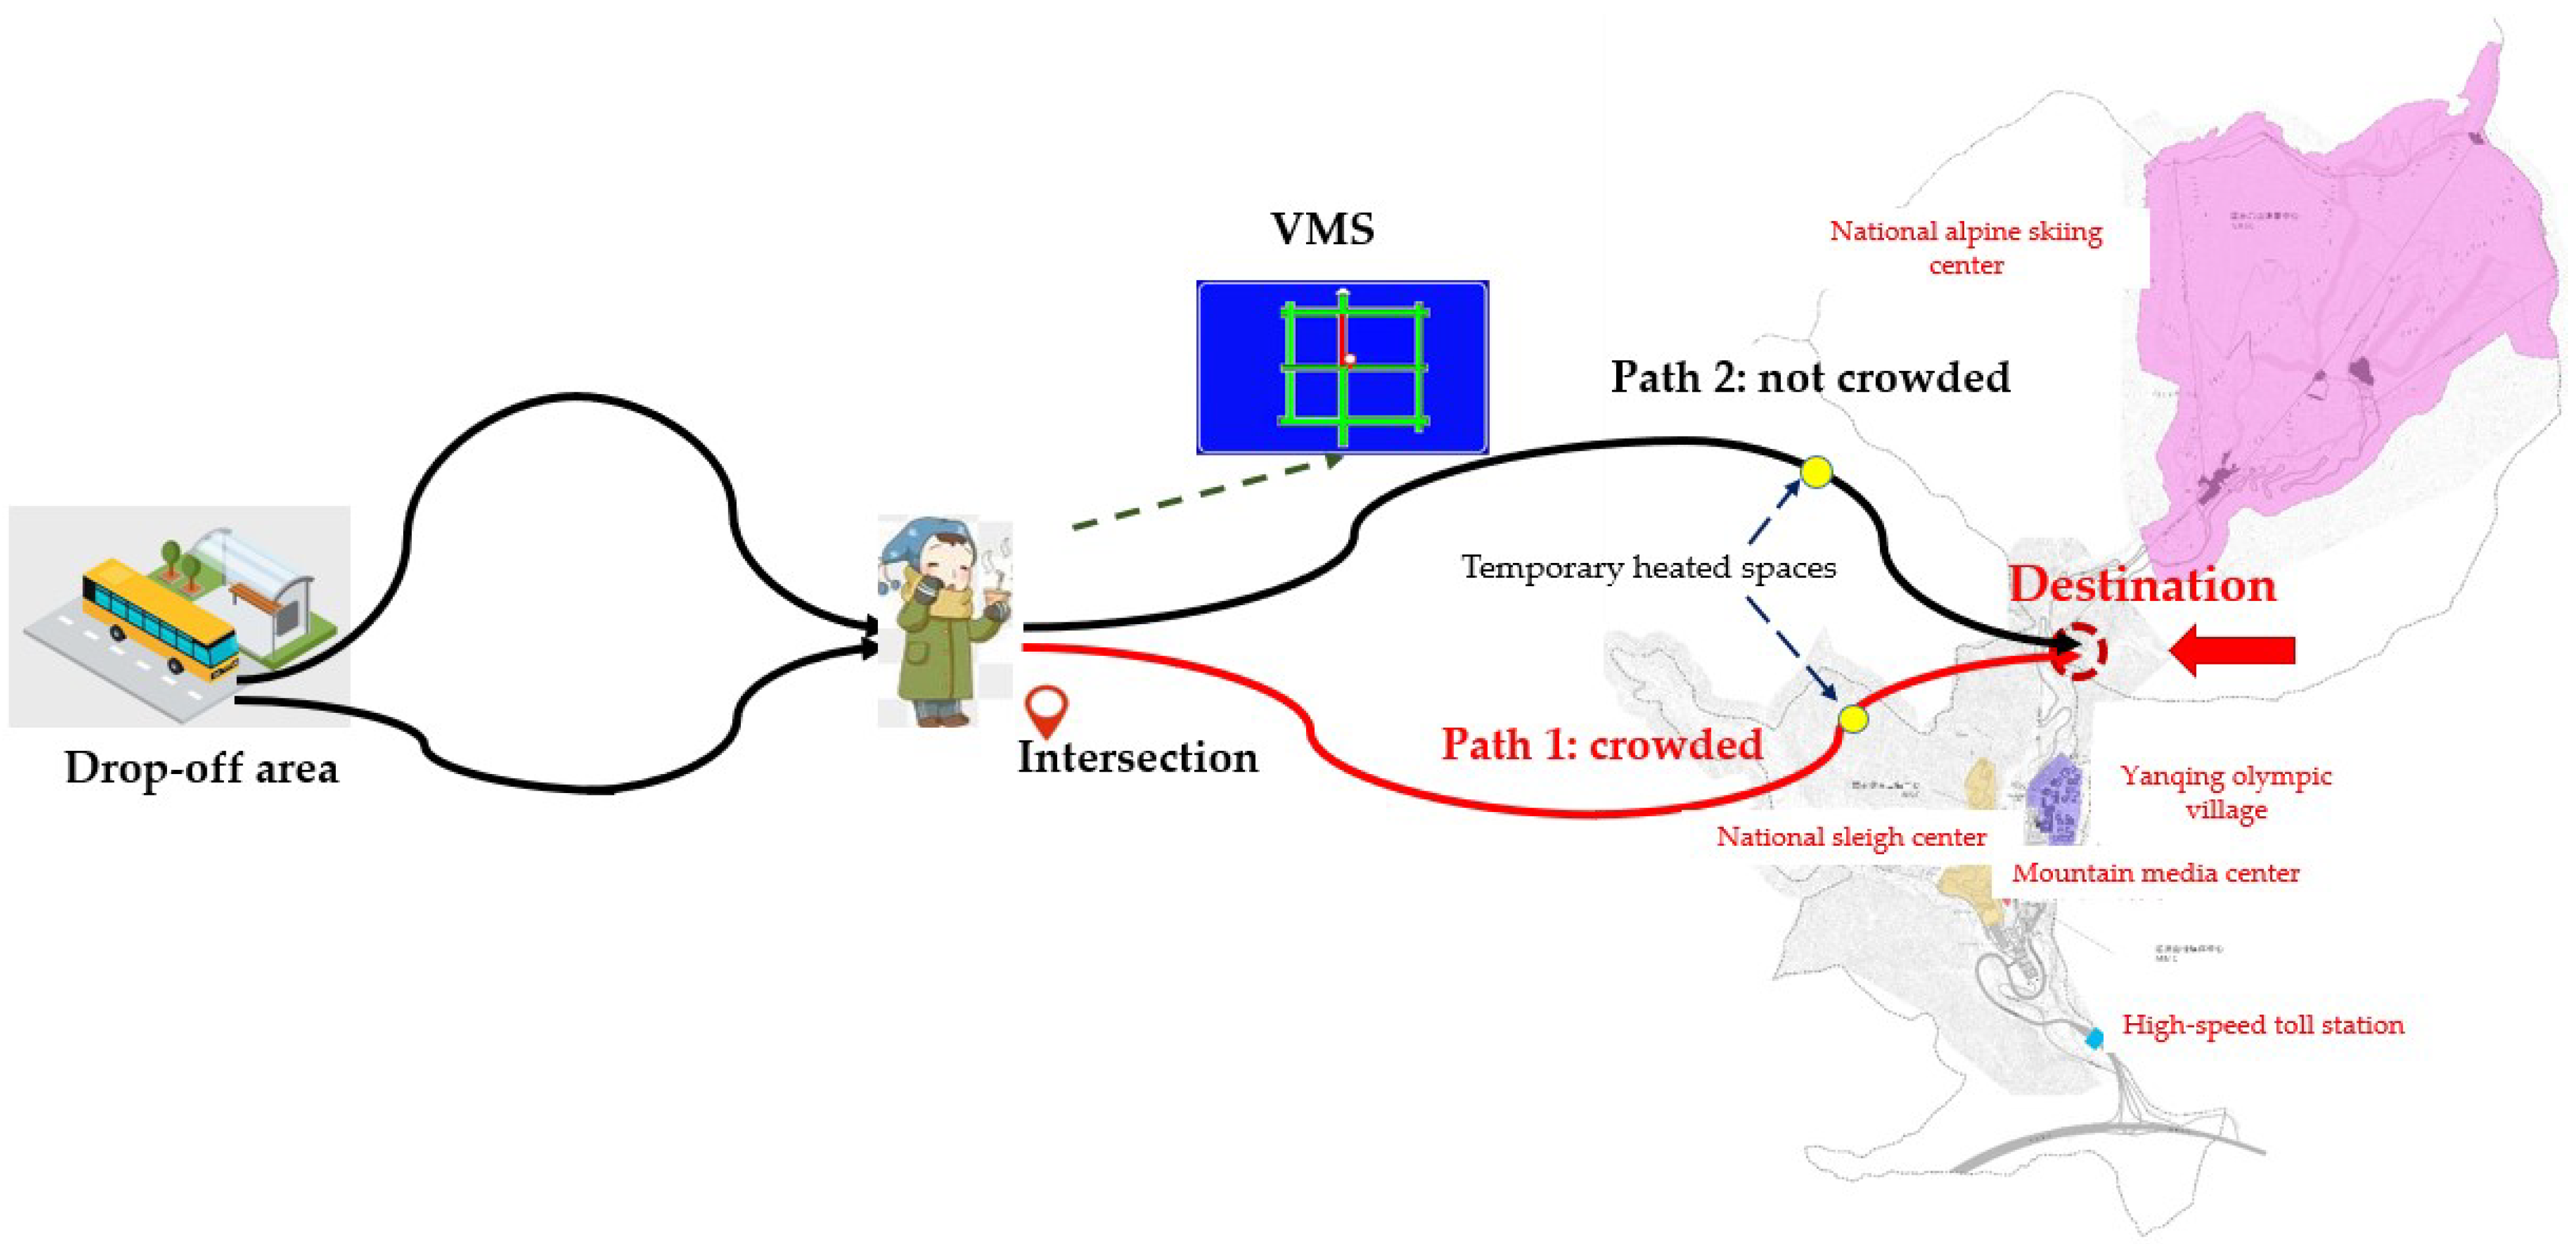
3.2. Scene Description

In the process of traveling, pedestrians make many decisions, such as travel route and traffic mode selection, etc. In this article, the study focuses on the travel route selection. In this article, the route decision-making behavior (RDMB) is described for the Beijing Yanqing competition area of the 2022 Winter Olympics. As mentioned, the area will be very cold during the Olympic Games, and there will be a large influx of passengers to the competition area. In order to avoid overcrowding and reduce the impact of bad weather when entering and leaving, the VMSs on roads and voice broadcasting will be used to provide information guidance to pedestrians so as to improve travel efficiency. With the VMSs, the traffic congestion status of the road network, temporary heated spaces or other key locations, as well as emergencies on the roads, can be displayed in real time.
Pedestrians make travel plans based on their own travel experience before entering the competition area [29]. However, when pedestrians actually get to the area, they pay attention to the traffic information and dynamically adjust the original travel route with the emergence of new demands, for example, by changing their travel routes or adopting a temporary heating behavior, etc. At this point, how to choose the route and how different factors affect route decision-making becomes the main topic of this article. The scene of the RDMB in the competition area is shown in Figure 2.

4. Methodology

4.1. Questionnaire

In order to analyze the influencing factors of the travel route decision-making behavior in the scene described in Section 3.2, surveys were conducted. Because the 2022 Winter Olympics competition area in this case study has not yet been opened, the survey of spectators in the competition area cannot be conducted. A survey can only be conducted by selecting another competition area with high similarity of the environment and scenes and used to study the general or universal laws which can be applied to the upcoming scenario. In this article, the area selected for the survey has the following similarities with the 2022 Winter Olympics competition area:
(1) Both are used for outdoor sports events, with similar pedestrian travel characteristics and passenger flow agglomeration phenomenon.
(2) Both feature cold environment accompanied by windy, snowy and low-temperature weather. In such an environment, staying outdoors for a long time leads to a great risk of frostbite and safety for pedestrians.
(3) Both have the same traffic scene, such as collective entering of the competition area, waiting for buses, route selection, collective leaving of the competition area, etc. In the traffic scene, both have similar changing laws for the passenger flow in the road network.
(4) Both need travel guidance, especially during the peak periods, to improve the spectating experience.
Meanwhile, the logit model used in later chapters is a kind of a predictive model which can be used to explain the relevance of the survey to the upcoming event, and our work is to take relevant measures after predicting the pedestrians’ behaviors. Therefore, the survey can be used to study the upcoming event. At last, 340 questionnaires were obtained. The questionnaire was divided into three parts:
(1) The survey of personal attributes of the pedestrians, including age, gender, occupation, income, etc.
(2) The survey of observable variables, including the outdoor walking time, the distance to a heated space, the temporary heating time, the ambient temperature, etc.
(3) The survey of latent variables. Since the subjective perception of the pedestrians in a competition area is mainly affected by information intervention, the passenger flow state and weather conditions, the subjective perceptions of information, congestion and the cold were taken as the latent variables.
A number of questionnaires met the requirements of SEM (structural equation model) construction [30]. This model can analyze the relationship between different factors. Thus, a structural equation model was constructed. The variables affecting the RDMB were divided into the observable variables and the latent variables. The latent variables cannot be measured directly and need to be characterized by other observable variables. In order to obtain the characteristic variables of the RDMB, Table 1 provides the characteristic variables from the questionnaire; some of the observable variables were designed to measure the latent variables as shown in Table 2.

4.2. Estimation Method of the Sem-Logit Model

Based on the survey results, the influence of subjective and objective factors on the RDMB was analyzed quantitatively with a SEM-logit model. The modeling process was as follows:
Step 1: Establishment of a structural equation model (SEM).
A SEM needs to be used to describe the mapping relationship between the latent variables that affect the TDMB and the corresponding observable variables [31,32]. The SEM is composed of a measurement model and a structural model [33]. The measurement model is used to solve the problem of how the latent variables are represented by the corresponding observable variables as shown in Equations (1) and (2). The structural model is used to study the relationship between the latent variables as shown in Equation (3).
X = Λ x ξ + δ ,
Y = Λ y η + ε ,
η = B η + Γ ξ + ζ ,
where X is the vector composed of exogenous observable variables, Y is the vector composed of endogenous observable variables, Λ x is the load factor matrix of X on ξ , Λ y is the load factor matrix of Y on η , δ is the error term of the exogenous observable variables, ε is the error term of the endogenous observable variables, B is the path coefficient matrix which describes the influence of the endogenous latent variables η , Γ is the path coefficient matrix that describes the influence of the exogenous latent variables ξ on the endogenous latent variables η and ζ is the residual term that reflects the unexplained part of η in the equations.
Step 2: Normalization of the load factor coefficients in the SEM.
Taking an exogenous latent variable ξ 1 in the SEM as an example to describe the normalization process of its load factor coefficients, suppose the exogenous latent variable ξ 1 has n corresponding observable variables, expressed as x 11 , x 12 , …, x 1 n , respectively, as shown in Equation (4).
( x 11 x 12 x 1 n ) = ( Λ x 1 Λ x 2 Λ x n ) ξ 1 ,
The load factor coefficients Λ x 1 , Λ x 2 , …, Λ x n are regarded as the weights of the observable variables [34], and the normalized weights are represented by α x 1 , α x 2 , …, α x n as shown in Equation (5). Then, the characteristic expression of the exogenous latent variable ξ 1 can be obtained as shown in Equation (6).
{ α x 1 = Λ x 1 Λ x 1 + Λ x 2 + + Λ x n α x 2 = Λ x 2 Λ x 1 + Λ x 2 + + Λ x n α x n = Λ x n Λ x 1 + Λ x 2 + + Λ x n ,
ξ 1 = α x 1 x 11 + α x 2 x 12 + + α x n x 1 n ,
Step 3: Establishment of the utility function.
According to the stochastic utility theory [35], it is assumed that pedestrians always choose the alternative scheme with the greatest utility U i n . The utility function is usually divided into a fixed term V i n and a random term ε i n as shown in Equation (7).
U i n = V i n + ε i n ,
The utility function includes not only the observable variables about the pedestrians’ personal socioeconomic characteristics and travel scheme characteristics, but also the latent variables about the pedestrians’ perceptions and attitudes towards different schemes. Thus, the fixed term V i n in the function can be expressed by Equation (8).
V i n = l L a i l s i l n + q Q b i q z i q n + k K c i k η i k n ,
where V i n is the fixed utility when pedestrian n chooses travel scheme i , L is the number of observable variables for the pedestrian’s individual characteristics, Q is the number of observable variables for the characteristics of travel scheme i , K is the number of latent variables, s i l n is the observable variable for pedestrian n , z i q n is the observable variable for travel scheme i , η i k n is the latent variable, a i l , b i q and c i k are the parameters to be estimated.
Step 4: Establishment of a discrete choice model.
With the utility function, a discrete choice model [36] can be established as shown in Equation (9).
P i n = e V i n J = 1 J n e V j n ,
where P i n is the probability of selecting travel scheme i for pedestrian n .
A binary dependent variable d i n with a value of 0 or 1 was introduced to describe the decision-making behavior of a pedestrian as shown in Equation (10). In that equation, d i n = 0 means that pedestrian n does not choose travel scheme i , while d i n = 1 means pedestrian n chooses travel scheme i .
d i n = { 1 , U i n U j n 0 ,   else .

5. Results and Discussion

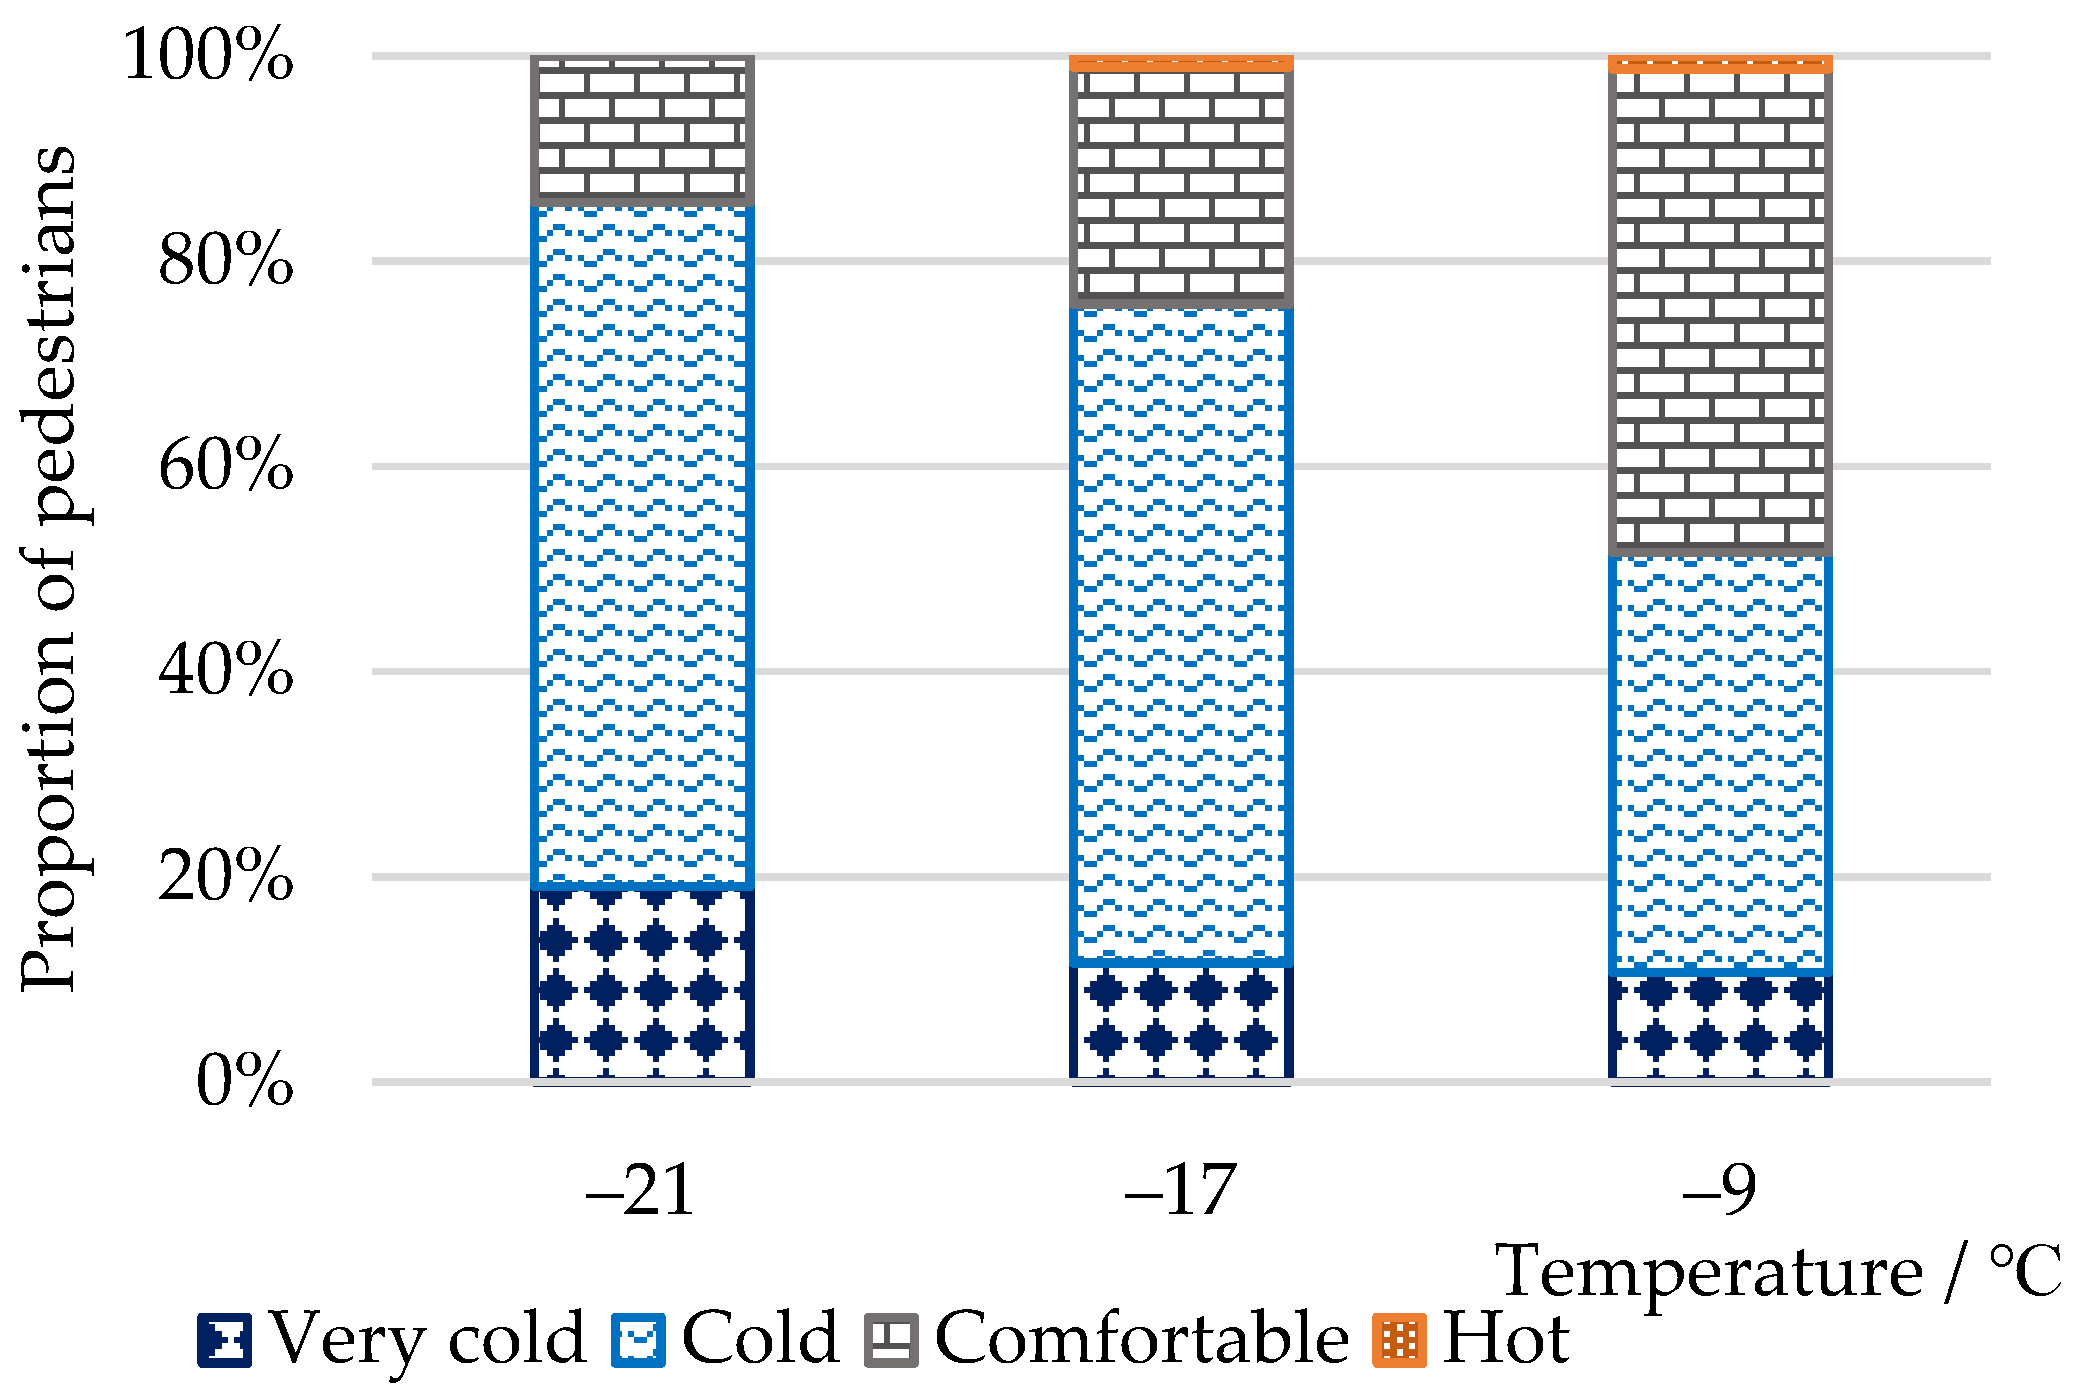
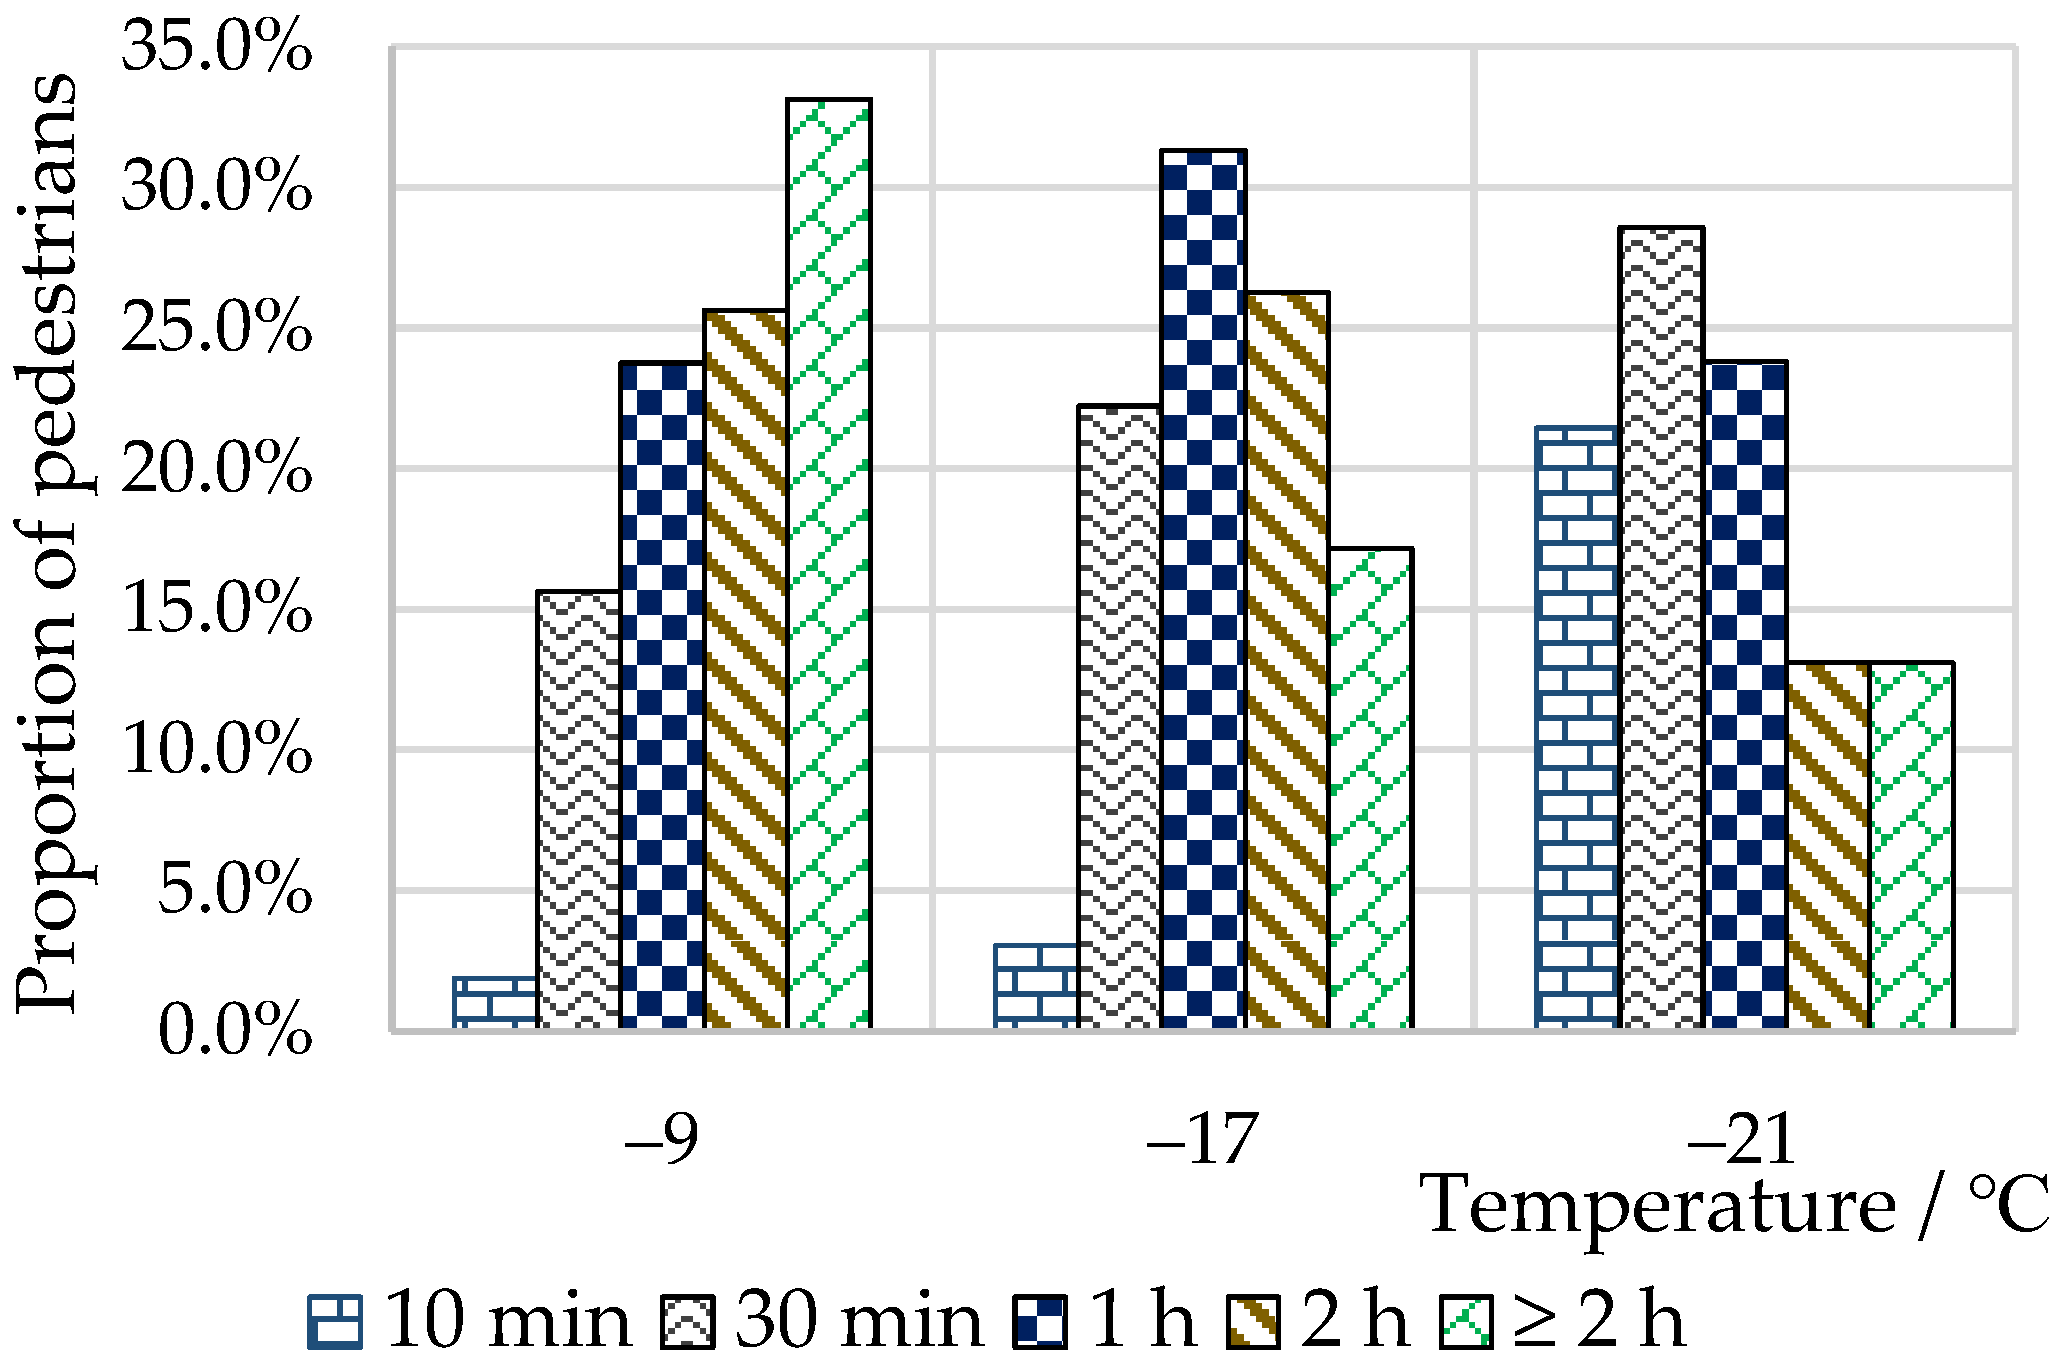
5.1. Questionnaire Analysis

Based on the literature [37], the cold perception levels were established. The four levels established in this article are very cold, cold, comfortable and hot, respectively. Figure 3 shows the distribution of pedestrians in terms of the cold perception at different temperatures. Under different temperatures, the pedestrians’ subjective perceptions are different. With the decrease in temperature, the proportion of pedestrians for the corresponding perception increases. When the temperature is −9 °C, −17 °C and −21 °C, respectively, the proportion of pedestrians for the corresponding perception is about 51.6%, 72.2% and 85.7%, respectively.
Figure 4 shows the distribution of pedestrians for the maximum outdoor waiting time at different temperatures. When the temperature is −9 °C, the proportion of pedestrians who can stay for more than 2 h is about 33.1%. When the temperature is −17 °C, the proportion of pedestrians who can stay for 1 h is about 31.3%. When the temperature is −21 °C, the proportion of pedestrians who can stay for 0.5 h is about 28.4%. The results show that the lower the temperature, the shorter the maximum outdoor waiting time.

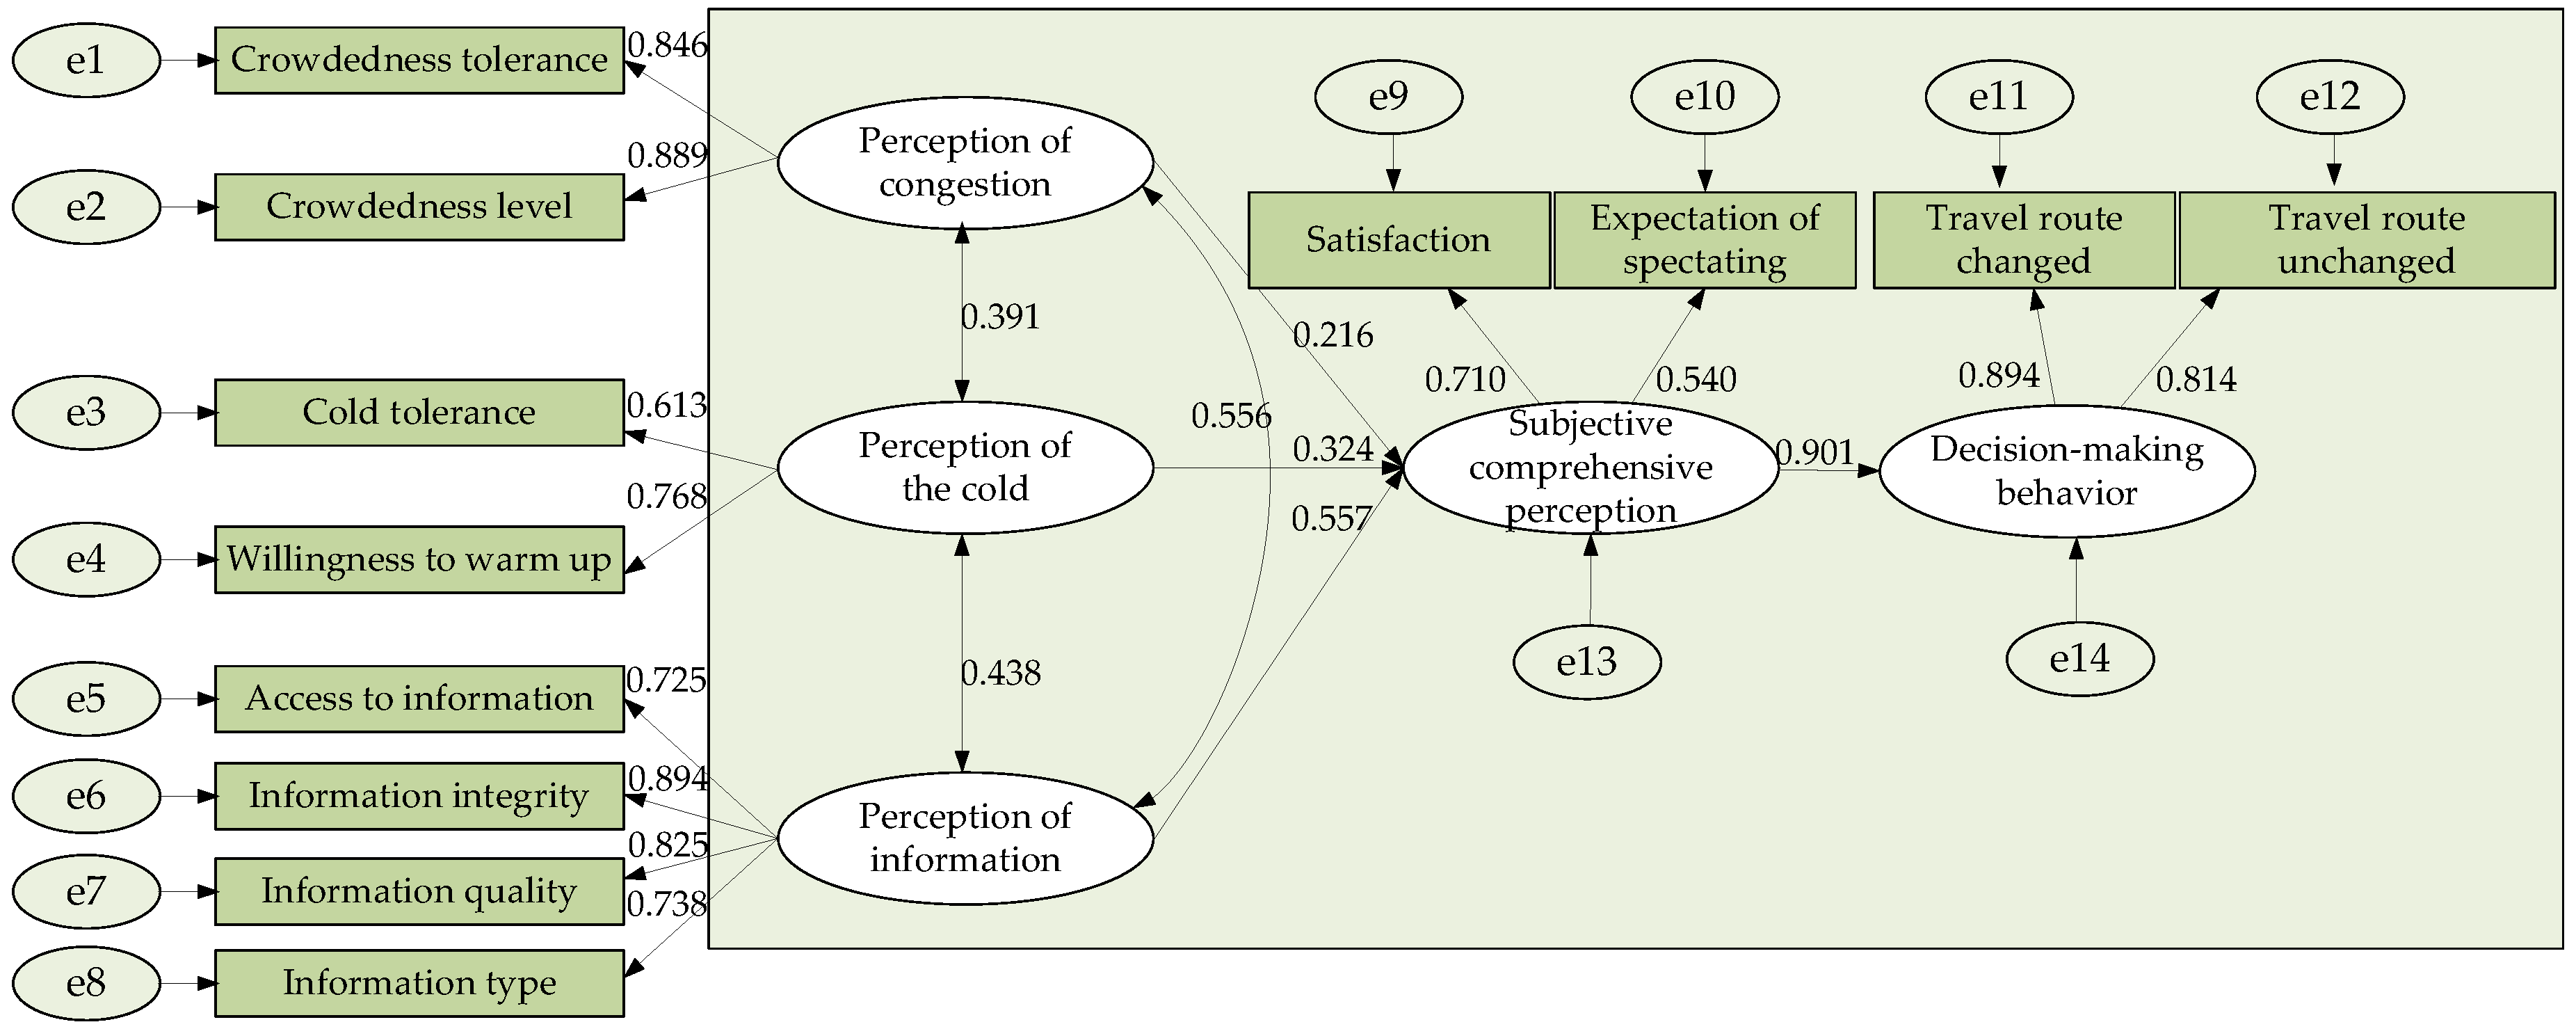
5.2. Results with the SEM

Table 3 shows the variables in the SEM. In Table 3, the “Subjective comprehensive perception” was the comprehensive perception under the influence of the three subjective perceptions and the “Decision-making behavior” was the final behavior adopted by the pedestrians. The calculated Cronbach’s α coefficients of the latent variables were all above 0.6, which indicates that the consistency of the questionnaire data was acceptable and suitable for SEM construction.
The significance of the load factor coefficients was tested as shown in Table 4. It can be seen that the corresponding p-values of the load factor coefficients among all the latent variables were all less than 0.05, which indicates that the load factors can pass the significance level test.
At the same time, the fitness of the SEM was tested as shown in Table 5. It can be seen that the RMSEA value was less than 0.08, the RMR value was less than 0.05 and the GFI, NFI, IFI and CFI values were all greater than 0.90, which indicates that the fitness of the SEM can meet the standard requirements [38].
The path coefficient values in the SEM were calculated as shown in Figure 5. The larger the path coefficient, the greater the impact of the corresponding factor. With the path coefficients, the influence of the latent variables on the RDMB can be obtained.
It can be seen that information, congestion and the cold have an impact on the decision-making behavior. The path coefficient values of the pedestrians’ perceptions of information, congestion and the cold were 0.557, 0.216 and 0.324, respectively, which indicates that the guidance information has the most serious impact on the RDMB. For the perception of information, the effect of information integrity was the highest than for others. Then, information quality had a significant impact. Therefore, the integrity of the information and information quality need to be paid attention to when managers make the information service platform. Similarly, crowdedness tolerance and crowdedness level had significant effects on the perception of crowdedness, and adopting some measures such as diversion to reduce passenger congestion will greatly help improve travel efficiency.

5.3. Results with the SEM-Logit Model

The alternative schemes which included “travel route changed” and “travel route unchanged” were taken as the choice items. Based on the results with the SEM, the SEM-logit model was calculated. The parameters in the SEM-logit model were calibrated and tested as shown in Table 6.
It can be seen that:
(1) The absolute values of the t-values of age, income, outdoor walking time, distance to a heated space, information intervention frequency and subjective comprehensive perception, etc., were all greater than 1.65, which indicates that the factors had significant effects on the RDMB.
(2) In terms of personal attributes, the coefficient of age was positive, which indicates that with the increase in age, the probability of travel route changes increases under the information intervention. The coefficients of income 1 and income 2 were both positive; this shows that pedestrians with the income of less than 5000 RMB are more inclined to adjust their original travel routes.
(3) In terms of the observable variables, the coefficient of the outdoor walking time was positive, which shows that the longer the walk in the cold, the more likely the pedestrians are to change their travel routes. The parameter of temperature was negative, which indicates that the colder the weather is, the greater the probability of travel route changes.
(4) In order to relieve the discomfort caused by the cold, pedestrians will adjust their original travel routes to go to temporary heated spaces to keep warm while traveling within a large-scale area. As can be seen in Table 6, the coefficient of the distance to a heated space was negative while that of the temporary heating time was positive, which indicates that the closer the distance to a heated space or the longer the temporary heating time needed, the greater the probability of travel route changes.

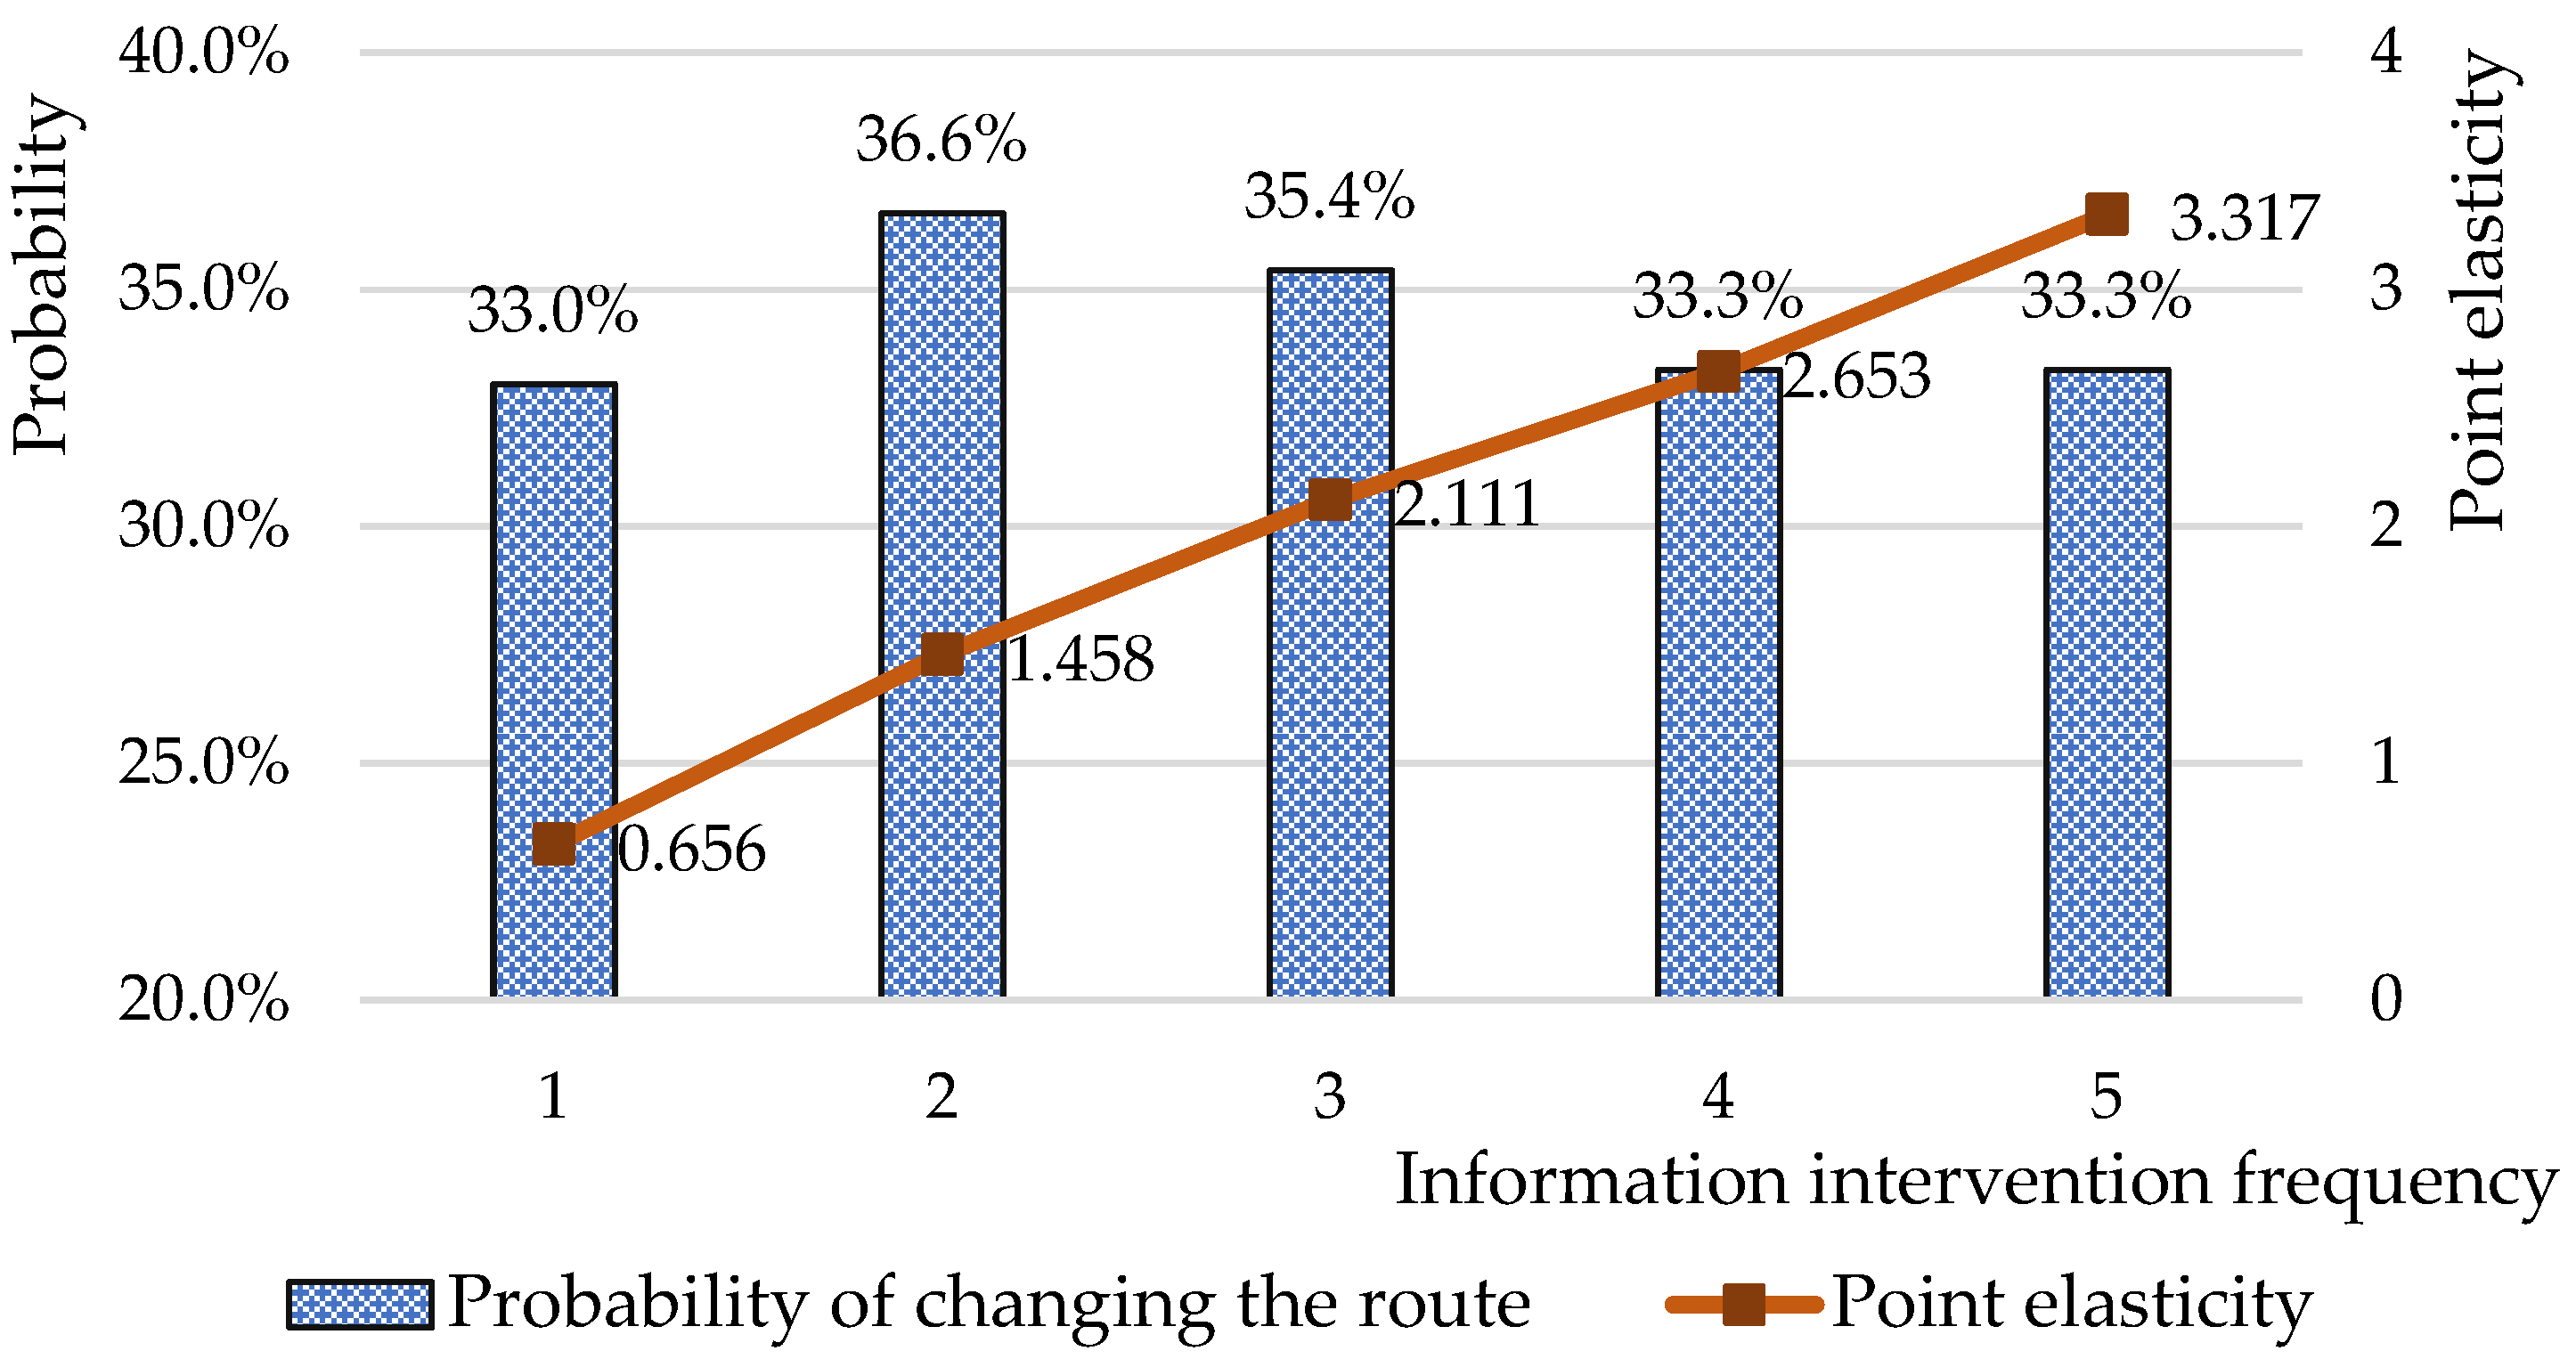
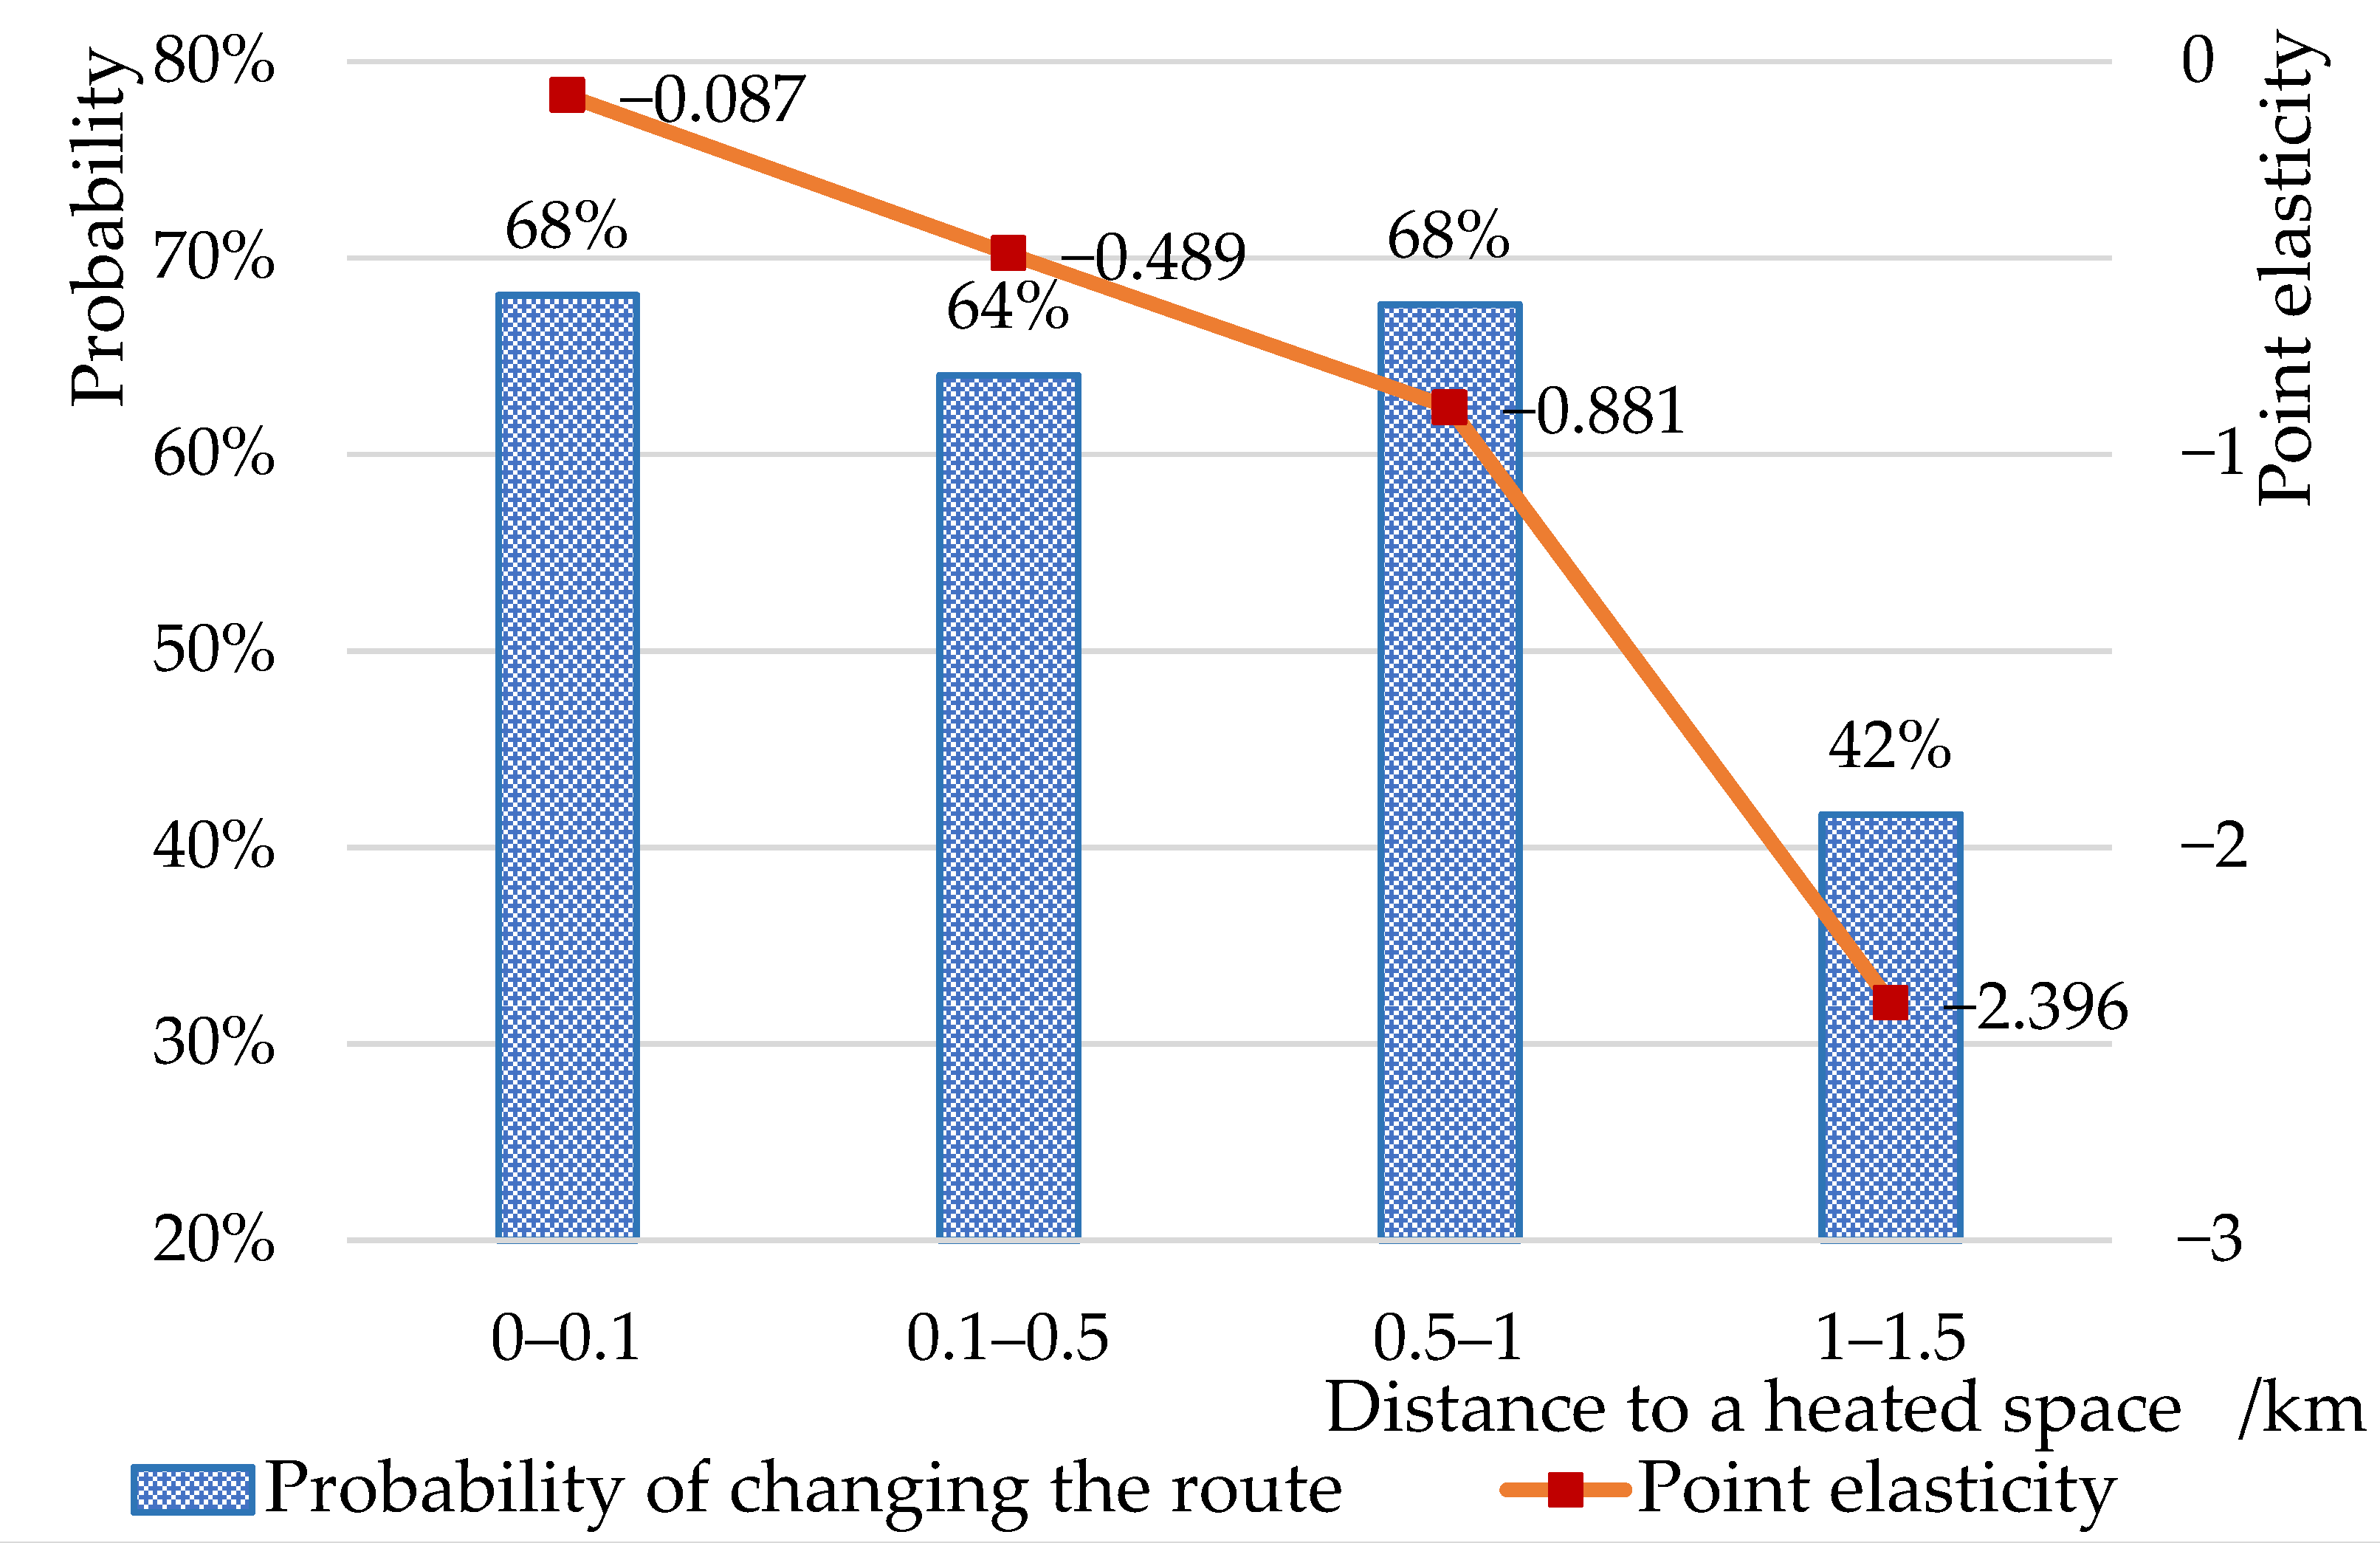
5.4. Sensitivity Analysis

In practice, information intervention and the setting of temporary heated spaces can be used by managers to influence travel decision-making and regulate the passenger flow. In this article, the influence of the information intervention frequency and distance to a heated space on the RDMB were analyzed. With the change of the factors, the probability of travel route changes and its point elasticity values were calculated. Point elasticity, which comes from microeconomics [39], refers to the sensitivity of factors in the travel route choice. When the point elasticity is ≥1, it indicates that adjusting an independent variable can cause the dependent variable to change greatly, as shown in Equation (11).
E X i n k P i n = X i n k P i n d P i n d X i n k = θ k X i n k ( 1 P i n ) ,
where E X i n k P i n is the point elasticity value, θ k is the parameter corresponding to the k th variable, P i n is the probability that pedestrian n chooses travel scheme i , X i n k is the k th variable contained in the i th scheme of pedestrian n .
In order to improve the effectiveness of information intervention, the influence of the information intervention frequency on the RDMB was analyzed, as shown in Figure 6. As can be seen, when the information intervention frequency was ≥2, the point elasticity was ≥1, which indicates that the change of the frequency had a significant effect on the RDMB. This means that managers can control the information intervention frequency to regulate the passenger flow, and a better result is achieved when the information intervention frequency is ≥2. When the pedestrians were exposed to the guidance information twice, the probability of obeying the information and choosing to change their travel route reached the maximum, which was about 36.6%. Therefore, the probability of obeying the guidance information in the competition area can be increased by increasing the information intervention frequency.
In addition to information means, managers can set up heated spaces to divert passengers, but the distance to a heated space impacts the attraction of the passenger flow. The influence of the distance to a heated space on the RDMB is shown in Figure 7. As can be seen, the point elasticity values were all negative, which shows that the smaller the distance to a heated space, the higher the probability of changing the original travel route to get warm. When the distance to a heated space was more than 1 km, the absolute value of the point elasticity was more than 1, which indicates that the change of the distance has obvious influence on the RDMB. At this time, the probability of changing the original route dropped from 68% to 42%, which was more sensitive. It indicates that when a heated space is more than 1 km away, the heating intention is reduced and the probability of changing the path is reduced. If the manager wants to alleviate traffic congestion, setting up heated spaces within a radius of 1 km is a good way to divert passenger flows.
In summary, compared with the existing research, the environment and scene in the study have their particularities. In this research, the cold environment, information guidance, pedestrian decision-making behavior and other factors are coupled, showing more complexity. In addition, the influence of the layout of temporary heated spaces and the pedestrians’ obedience to information on the pedestrians’ decision-making behavior were also discussed. This study can provide a scientific reference for the sustainable development of mega-sport events, long-term construction of service facilities and the passenger flow management in the cold environment.

6. Conclusions

In order to alleviate traffic congestion, reduce the time of freezing and ensure the safety of pedestrians, the following conclusions were drawn in this article:
(1)
The guidance information has the most serious impact on the pedestrians’ comprehensive perception compared with the congestion and the cold. Therefore, information intervention can be used by managers to regulate the pedestrians’ route choice, thereby reducing congestion, improving travel efficiency and safety.
(2)
The integrity of the information and information quality are important factors affecting information perception, so managers should improve the two aspects of information so that it can play a good role in the TDMB.
(3)
The probability of obeying the information is influenced by the information intervention frequency. In particular, when pedestrians are exposed to the guidance information twice, the probability of obeying the information reaches the maximum.
(4)
In a cold environment, the setting of temporary heated spaces can be used by managers to influence the route decisions of pedestrians. If the manager wants to alleviate traffic congestion, setting up heated spaces within a radius of 1 km is a good way to divert pedestrians.
Due to the special characteristics of pedestrians during mega-sport events, the influence of the subjective perception and objective factors on the RDMB was analyzed based on the SEM-logit model. The pedestrians’ travel decisions are affected not only by self-perception and the external environment, but can also be guided by information intervention. Therefore, managers should seriously consider the pedestrians’ compliance rate to the guidance information and the layout of temporary heated spaces, and this study can provide some suggestions on information service and temporary heating service during mega-sport events in a cold environment. Of course, some influencing factors in the model were not quantified. In the future, we will track and verify the application effect of the results, refine the influencing factors and improve the model accuracy. At the same time, the multiagent simulation method for pedestrians under the information guidance in a cold environment should be studied to provide a useful method for the prediction of the application effect.

Author Contributions

Conceptualization, W.H. and Y.C.; Data curation, W.H.; Formal analysis, W.H.; Funding acquisition, Y.C.; Investigation, W.H. and S.C.; Methodology, W.H.; Project administration, Y.C.; Resources Y.C.; Supervision, Y.C.; Validation, W.H.; Writing—original draft preparation, W.H.; Writing—review and editing, W.H., Y.C. and S.C. All authors have read and agreed to the published version of the manuscript.

Funding

This research was funded by the National Key Research and Development Program of China: The Key Special Projects “Scientific Winter Olympic Games” (2018YFF0300305).

Institutional Review Board Statement

Not applicable.

Informed Consent Statement

Informed consent was obtained from all subjects involved in the study.

Data Availability Statement

No new data were created or analyzed in this study. Data sharing is not applicable to this article.

Conflicts of Interest

The authors declare no conflict of interest.

References

  1. Olson, J.J. Antarctica: A review of recent medical research. Trend Pharmacol. Sci. 2002, 23, 487–490. [Google Scholar] [CrossRef]
  2. Beijing Municipal Bureau of Statistics. Beijing Statistical Yearbook 2019; Statistics Press: Beijing, China, 2019.
  3. Chen, X.; Xue, P.; Gao, L. Physiological and thermal response to real-life transient conditions during winter in severe cold areas. Build. Environ. 2019, 157, 284–296. [Google Scholar] [CrossRef]
  4. Min, J.Y.; Choi, Y.S.; Lee, H.S.; Lee, S.; Min, K.B. Increased cold injuries and the effect of body mass index in patients with peripheral vascular disease. BMC Public Health 2021, 21, 1–10. [Google Scholar] [CrossRef] [PubMed]
  5. Zhang, T.; Su, M.; Hong, B.; Wang, C.; Li, K. Interaction of emotional regulation and outdoor thermal perception: A pilot study in a cold region of China. Build. Environ. 2021, 198, 107870. [Google Scholar] [CrossRef]
  6. LIU, M. Comparison of pre- & post-Olympic traffic: A case study of several roads in Beijing. J. Trans. Syst. Eng. Inf. Technol. 2008, 8, 67–72. [Google Scholar]
  7. Fiorucci, P.; Gaetani, F.; Minciardi, R. Natural risk assessment and decision planning for disaster mitigation. Adv. Geosci. 2005, 2, 161–165. [Google Scholar] [CrossRef] [Green Version]
  8. Zu, X. Scientific definition of cold regions and division of cold regions in Heilongjiang province. Heilongjiang Weather. 2002, 36, 33–34. [Google Scholar]
  9. Vanja, B. Traveler anxiety and enjoyment: The effect of airport environment on traveler’s emotions. J. Air Trans. Manag. 2016, 57, 122–129. [Google Scholar]
  10. Wright, K.R. Sports facility management: Organising events and mitigating risks. J. Policy Res. Tour. Leis. Events 2012, 4, 385–387. [Google Scholar] [CrossRef]
  11. Heggie, T.W. Traveling to Canada for the Vancouver 2010 Winter Olympic and Paralympic Games. Travel Med. Infect. Disease 2009, 7, 207–211. [Google Scholar] [CrossRef]
  12. Iarca, I.; Lupu, E.; Stanescu, D.M. The psycho-Social impact of the Olympic Winter Games organization on the Romanian tourism. Proc. Soc. Behav. Sci. 2011, 30, 1806–1810. [Google Scholar] [CrossRef] [Green Version]
  13. Maslow, A.H. A theory of human motivation. Psychol. Rev. 1943, 50, 30–37. [Google Scholar] [CrossRef] [Green Version]
  14. Pearce, P. The social psychology of tourist behaviour. Contemp. Soc. 1982, 12, 728. [Google Scholar]
  15. Manning, R.E.; Valliere, W.A. Coping in outdoor recreation: Causes and consequences of crowding and conflict among community residents. J. Leis. Res. 2017, 33, 410–426. [Google Scholar] [CrossRef]
  16. Yang, G.; Han, Y.; Gong, H. Spatial-temporal response patterns of tourist flow under real-time tourist flow diversion scheme. Sustainability 2020, 12, 3478. [Google Scholar] [CrossRef] [Green Version]
  17. Han, Y.; Yang, G.; Zhang, T. Spatial-temporal response patterns of tourist flow under entrance tourist flow control scheme. Tour. Manag. 2021, 83, 104246. [Google Scholar] [CrossRef]
  18. Shailes, A.; Senior, M.L.; Andrew, B.P. Tourists’ travel behaviour in response to congestion: The case of car trips to Cornwall, United Kingdom. J. Trans. Geogr. 2001, 9, 49–60. [Google Scholar] [CrossRef]
  19. Kusakabe, T.; Sharyo, T.; Asakura, Y. Effects of traffic incident information on drivers’ route choice behaviour in urban expressway network. Proc. Soc. Behav. Sci. 2012, 54, 179–188. [Google Scholar] [CrossRef] [Green Version]
  20. Raveau, S. A behavioural comparison of route choice on metro networks: Time, transfers, crowding, topology and socio-demographics. Trans. Res. Part A 2014, 66, 185–195. [Google Scholar] [CrossRef]
  21. Vedel, S.E.; Jacobsen, J.B.; Skov-Petersen, H. Bicyclists’ preferences for route characteristics and crowding in Copenhagen–A choice experiment study of commuters. Trans. Res. Part A Policy Pract. 2017, 100, 53–64. [Google Scholar] [CrossRef]
  22. Agrawal, S.; Peeta, S. Hybrid route choice model incorporating latent cognitive effects of real-time travel information using physiological data. Trans. Res. Part F Traff. Psychol. Behav. 2021, 81, 223–239. [Google Scholar] [CrossRef]
  23. Zhao, W.; Quddus, M.; Huang, H. Analyzing drivers’ preferences and choices for the content and format of variable message signs (VMS). Trans. Res. Part C Emerg. Technol. 2019, 100, 1–14. [Google Scholar] [CrossRef] [Green Version]
  24. Han, Y.; Wu, X.; Yang, G. Tourists’ congestion perception analysis based on ordered choice model. J. Trans. Syst. Eng. Inf. Technol. 2017, 17, 138–144. [Google Scholar]
  25. Lam, W.; Shao, H.; Sumalee, A. Modeling impacts of adverse weather conditions on a road network with uncertainties in demand and supply. Trans. Res. Part B Methodol. 2008, 42, 890–910. [Google Scholar] [CrossRef]
  26. Miller, T.A.; Mccool, S.F. Coping with stress in outdoor recreational settings: An application of transactional stress theory. Leis. Sci. 2003, 25, 257–275. [Google Scholar] [CrossRef]
  27. Sirakaya, E.; Woodside, A.G. Building and testing theories of decision making by travelers. Tour. Manag. 2005, 26, 815–832. [Google Scholar] [CrossRef]
  28. Ashman, R.; Solomon, M.R.; Wolny, J. An old model for a new age: Consumer decision making in participatory digital culture. J. Custom. Behav. 2015, 14, 127–146. [Google Scholar] [CrossRef] [Green Version]
  29. Peng, J.; Zhicai, J.; Linjie, G. Application of the expanded theory of planned behavior in intercity travel behaviour. Disc. Dynam. Nat. Soc. 2014, 2014, 1–10. [Google Scholar] [CrossRef]
  30. Yin, J.; Qiu, X. AI technology and online purchase intention: Structural equation model based on perceived value. Sustainability 2021, 13, 5671. [Google Scholar] [CrossRef]
  31. Golob, T.F. Structural equation modeling for travel behavior research. Trans. Res. Part B Methodol. 2003, 37, 1–25. [Google Scholar] [CrossRef] [Green Version]
  32. Golob, T.F. A simultaneous model of household activity participation and trip chain generation. Trans. Res. Part B Methodol. 2000, 34B, 355–376. [Google Scholar] [CrossRef] [Green Version]
  33. Wu, M. Structural Equation Model: AMOS Operation and Application; Chongqing Univ. Press: Chongqing, China, 2010. [Google Scholar]
  34. Simma, A.; Axhausen, K. Interactions between travel behaviour, accessibility and personal characteristics: The case of the Upper Austria Region. Ejtir 2003, 3, 179–197. [Google Scholar]
  35. Guan, H. Disaggregate Model—A Tool of Traffic Behavior Analysis; China Communications Press: Beijing, China, 2004. [Google Scholar]
  36. Kmenta, J.; Aldrich, J.H.; Nelson, F.D. Linear Probability, Logit, and Probit Models. Sage Publications: Beverly Hills, CA, USA, 1984. [Google Scholar] [CrossRef]
  37. Ehrhart, O. Dry wind chill effect and clothing. J. Wilderness Med. 1991, 2, 102–109. [Google Scholar]
  38. Ory, D.T.; Mokhtarian, P.L. Modeling the structural relationships among short-distance travel amounts, perceptions, affections, and desires. Trans. Res. Part A Policy Pract. 2009, 43, 26–43. [Google Scholar] [CrossRef]
  39. Koppelman, F.S.; Wen, C.H. The paired combinatorial logit model: Properties, estimation and application. Trans. Res. Part B 2000, 34, 75–89. [Google Scholar] [CrossRef]
Figure 1. The process of the TDMB.
Sustainability 13 11522 g001
Figure 2. The scene of the TDMB in the Beijing Yanqing competition area.
Sustainability 13 11522 g002
Figure 3. The distribution of pedestrians in terms of the cold perception at different temperatures.
Sustainability 13 11522 g003
Figure 4. The distribution of pedestrians in terms of the maximum outdoor waiting time at different temperatures.
Sustainability 13 11522 g004
Figure 5. Path coefficient diagram of the SEM.
Sustainability 13 11522 g005
Figure 6. The influence of the information intervention frequency on the RDMB.
Sustainability 13 11522 g006
Figure 7. The influence of the distance to a heated space on the RDMB.
Sustainability 13 11522 g007
Table 1. The characteristic variables.
Variable TypeVariableAssignment Description
Personal attributesAgeContinuous value
Gender1—Male
2—Female
Occupation1—Student
2—Government or corporate staff
3—Freelancer or retiree
Income1—≤3000 RMB
2—3000–5000 RMB
3—5000–10,000 RMB
4—>10,000 RMB
Observable variablesOutdoor walking time1—≤30 min
2—0.5–1 h
3—1–1.5 h
4—1.5–2 h
5—>2 h
Distance to a heated space1—≤100 m
2—100–500 m
3—500–1000 m
4—>1000 m
Temporary heating time1—≤10 min
2—10–20 min
3—20–30 min
4—>30 min
Environment temperature1—From −30 °C to −20 °C
2—From −20 °C to −10 °C
3—From −10 °C to 0 °C
4—From 0 °C to 10 °C
Information intervention frequency1—One
2—Two
3—Three
4—Four
5—Five
Latent variablesSubjective perceptionPerception of information
Perception of congestion
Perception of the cold
Table 2. The observable variables for measuring the latent variables.
Latent VariableCorresponding Observable VariableAssignment Description
Perception of informationAccess to informationScored with a five-point Likert scale
Information integrity
Information quality
Information type
Perception of congestionCrowdedness tolerance
Crowdedness level
Perception of the coldCold tolerance
Willingness to warm up
Table 3. Variables in the SEM.
IDLatent VariableCronbach’s α CoefficientCorresponding Observable Variable
1Perception of information0.872Access to information
Information integrity
Information quality
Information type
2Perception of congestion0.654Crowdedness tolerance
Crowdedness level
3Perception of the cold0.860Cold tolerance
Willingness to warm up
4Subjective comprehensive perception0.633Expectation for spectating
Satisfaction
5Decision-making behavior0.794Travel route changed
Travel route unchanged
Notes: when 0.6 ≤ α < 0.7, the consistency of the questionnaire data is basically acceptable; when 0.7 ≤ α < 0.8, the consistency of the questionnaire data is good and acceptable; when 0.8 ≤ α < 0.9, the consistency of the questionnaire data is good and its reliability is high; when α ≥ 0.9, the consistency of the questionnaire data is very good.
Table 4. Estimation results of the load factor coefficients.
Path in the SEMEstimated ValueStandard Error (SE)Critical Ratio (CR)p
Subjective comprehensive perception—perception of information0.5570.0816.267***
Subjective comprehensive perception—perception of congestion0.2160.0493.687***
Subjective comprehensive perception—perception of the cold0.3240.0963.679***
Decision-making behavior—subjective comprehensive perception0.9010.09012.738***
Access to information—perception of information0.7250.07312.146***
Information integrity—perception of information0.8930.06616.084***
Information quality—perception of information0.825
Information type—perception of information0.7380.07312.433***
Crowdedness level—perception of congestion0.8890.07014.532***
Crowdedness tolerance—perception of congestion0.846
Willingness to warm up—perception of the cold0.7680.1347.809***
Cold tolerance—perception of the cold0.613
Satisfaction—subjective comprehensive perception0.710
Expectation for spectating—subjective comprehensive perception0.5400.1077.751***
Travel route changed—decision-making behavior0.894
Travel route unchanged—decision-making behavior0.8140.06314.372***
Notes: p-value is the statistical test probability of CR; *** p < 0.01; the corresponding variables of “—” are the reference index variables, and the significance test of the path coefficient is not required for the variables; thus, in the table, the SE, the CR and the p-value of the reference index variables are blank as expressed by “—”.
Table 5. The fitness of the SEM.
Evaluation IndicatorTest ResultsAdopted Standard
DF (degree of freedom)2.2031–3
GFI (goodness-of-fit index)0.941>0.90
RMR (root-mean-square residual)0.040<0.05
RMSEA (root-mean-square error of approximation)0.074<0.08
NFI (normed fit index)0.946>0.90
IFI (incremental fit index)0.970>0.90
CFI (comparative fit index)0.969<0.90
Table 6. Calibration results of the SEM-logit model.
VariableParameterSEt
Constant−0.4541.202−0.378
Age0.0220.0102.076
Occupation−0.7840.471−1.666
Income 11.0610.3922.707
Income 20.8490.3332.552
Outdoor walking time2.1301.0681.995
Distance to a heated space−2.7181.077−2.627
Temporary heating time0.5780.4462.605
Temperature−0.3990.172−2.323
Information intervention frequency0.3310.1642.020
Subjective comprehensive perception0.4360.2521.729
Log-likelihood at zero−461.636
Log-likelihood at end−399.943
−2(LL(zero)–LL(end))123.386
Asymptotic rho squared0.134
Adjusted rho squared0.060
Publisher’s Note: MDPI stays neutral with regard to jurisdictional claims in published maps and institutional affiliations.

