Article

Analysis of Hybrid Grid-Connected Renewable Power Generation for Sustainable Electricity Supply in Sierra Leone

by
Foday Conteh
1,*,
Hiroshi Takahashi
2,
Ashraf Mohamed Hemeida
3,
Narayanan Krishnan
4,
Alexey Mikhaylov
5 and
Tomonobu Senjyu
1,*
1
Department of Electrical and Electronics Engineering, University of the Ryukyus, Okinawa 903-0213, Japan
2
Fuji Electric Co., Ltd., Tokyo 141-0032, Japan
3
Electrical Engineering Department, Faculty of Energy Engineering, Aswan University, Aswan 81528, Egypt
4
Department of Electrical and Electronics Engineering, SASTRA Deemed University, Thanjavur 613401, India
5
Financial Research Institute of Ministry of Financial of the Russian Federation, 127006 Moscow, Russia
*
Authors to whom correspondence should be addressed.
Sustainability 2021, 13(20), 11435; https://doi.org/10.3390/su132011435
Submission received: 9 July 2021 / Revised: 11 October 2021 / Accepted: 13 October 2021 / Published: 16 October 2021
(This article belongs to the Collection Sustainable Electric Power Systems Research)

Abstract

:
The provision of electricity in a reliable and sustainable manner in provincial towns and villages in the small West Africa state of Sierra Leone requires the adoption of appropriate technologies. The rapid increase in electricity demand has generated great interest in how to tackle a possible long-lasting energy deficiency in the country. This paper aims at analyzing the techno-economic feasibility of a hybrid renewable energy system (HRES) for the sustainable rural electrification of Lungi Town, Port Loko District, Sierra Leone. Optimization, economic, reliability, and sustainability analyses were carried out using a genetic algorithm (GA), with the main objectives of minimizing the loss of power supply probability (LPSP) and cost of energy (COE). Three different case scenarios were configured, using a diesel generator (DG), wind/PV/DG/battery, and wind/PV/battery. Various combinations of these case scenarios were compared to determine which option was the most economically viable. In order to determine the case scenario with the lowest LPSP and COE, the operations and maintenance costs of the three cases were calculated. Using only DG for case one, the operations and maintenance cost amounted to USD 1050,348.12/year. The operation and maintenance cost for case two, which included wind/PV/DG/battery, was found to be USD 561,674.06/year. The operations and maintenance cost for case three, which included wind/PV/battery, was found to be USD 36,000/year. In standalone microgrids, however, the use of renewable energy sources is not reliable due to the uncertainty of renewable energy sources. Consequently, the simulation results show that the wind/PV/DG/battery-based HRES is the most cost-effective, reliable, and sustainable for the specific location in comparison to the current traditional method of electricity generation. Since there is abundant solar radiation with substantial wind speeds across the country, this HRES can be applied in most rural and remote areas in place of the current diesel generators (DGs) that are widely deployed in the country.

1. Introduction

The goal of clean, reliable, affordable, and sustainable electricity access has been Africa’s top priority in order to acquire economic growth and health security and improve the livelihoods of its citizens [1,2]. Close to 1 billion of the world‘s population are said to live without electricity, and Africa and South Asia continue to display the largest deficit [3]. It is estimated that over 600 million Africans lack access to electricity and millions more are connected to an unreliable grid that does not meet their daily energy service needs [4]. Frequent power cuts with constant shedding continue to be a regular occurrence for many African power consumers. The use of thermal oil plants, which release greenhouse gas (GHG) emissions unaltered into the surrounding atmosphere, is very much popular in Africa. Africa is blessed with abundant renewable resources that are sustainable and environmentally friendly and may substitute traditional methods of power generation [5,6]. This indicates that renewable energy technology can drive energy decentralization and sustainable development [7,8]. Overall, 60% of the Sierra Leone population live in rural areas with little or no access to electricity. This situation is seen as a major factor hampering the social and economic development of the country. Therefore, the government of Sierra Leone, with support from international partners, has launched several schemes and programs aiming at improving rural electrification, such as the chiefdom mini-grids electrification project, barefoot solar electrification project, seven districts headquarter towns electrification project, etc. These projects aim at increasing access to electricity to 60% by 2023. Presently, the majority of the provincial towns obtain electricity through fuel oil thermal plants. However, this comes with high operational costs and adverse impacts on the environment and is therefore unsustainable. Renewable energy sources are non-exhaustible and have relatively little or no emissions [9,10] compared to fossil fuels, which are exhaustible and at the same time have negative human health and environmental impacts [11,12]. In addition to its health problems, weak states find it difficult to solely rely on fossil fuels for their power generation due to the volatility of the price of crude oil in the world market [13].
Both developed and developing countries are actively pursuing the integration of renewable power into the power sector. The application of an off-grid micro-grid for the electrification of rural communities with no access to the central electricity grid was presented by Khodayar et al. [14]. The work presented some of the challenges, such as financial issues, the establishment of the technology, reliability, and uncertainty, that correspond to the capacity expansion of off-grid micro-grids to provide energy to remote areas with no access to the central electricity network. Gabra et al. performed an analysis of the techno-economic feasibility of small-scale wind systems for rural electrification in Africa [15]. The authors used a spatial mapping model to enable the visualization of the electrification costs of wind systems across the continent and the results were integrated with previous work performed for photovoltaic (PV) and diesel systems. The work presented results that show that PV and diesel systems are the most economically viable method of rural electrification in Africa, while wind systems are economically advantageous only within the horn of Africa and across a few dispersed areas. Pérez-Arriaga et al. presented a utility approach to accelerate universal electricity access in less developed countries—a regulatory proposal [16]. A large-scale business model designed to accelerate electricity access and attract corporate investment in electrification in developing countries was proposed. The authors based their model on the findings of an investigation of the factors underlying the low level of electricity access in a large number of developing countries. Barakat [17] presented a multi-objective optimization of a grid-connected hybrid PV/wind turbine-based system to supply sufficient energy to a rural community in Ismailia Governorate, Egypt, considering the minimization of two objective functions—namely loss of power supply probability (LPSP) and cost of energy (COE)—while maximizing the renewable energy fraction (REF) of the system as the third objective function, under different weather situations. The paper looked at the interrelationship between the grid and the proposed hybrid system in terms of the network’s ability to sell or buy energy from the hybrid system. Results obtained were classified into three perspectives that represented the economically optimal solution: the lowest COE, renewable energy fraction, and greenhouse gas emissions.
Moner-Girona et al. proposed decentralized rural electrification in Kenya—speeding up universal energy access [18]. The paper presents a spatial model that identifies optimal strategies for the different locations considering the current energy status and local resources for Kenya. The authors looked at the prospect of a hybrid of conventional power and renewable energy and the possibility of extension of the main grid into remote areas. An assessment of wind power generation along the coast of Ghana was given by Adaramola et al. [19]. The work focuses on the economic viability of using a wind turbine for electricity generation in the selected regions along the coastal region of Ghana. An assessment of renewable energy expansion potential and its implications on reforming Japan’s electricity system was given by Wakiyama et al. [20]. The maximum use of renewable energy for electricity generation and reduced carbon dioxide (CO2) emissions, given the nationally determined contribution (NDC) mitigation target, and the 2 °C rise limit target in Japan’s electricity sector was assessed. The authors examined the feasible CO2 emission intensity by 2030 under the current electricity system of limited transmission network capacity, as well as the government’s plans for electricity market reform towards 2020. Krishan et al. presented a techno-economic analysis and optimum design of an HRES, to meet the residential and agricultural electric load requirements of the energy-poor community of Yamunanagar District in the State of Haryana, India [21].
The authors compared wind/battery, PV/battery, and wind/PV/battery with respect to the net present cost (NPC) and cost of energy (COE) to determine the most economically viable option. Simulation results indicated that the wind/PV/battery-based HRES was the most cost-effective configuration for the specific location. Gebrehiwot et al. assessed the potential of a hybrid system to electrify a remote rural village in Ethiopia [22]. A sensitivity analysis was carried out by the authors to determine the effect of variations in solar radiation, wind speed, and diesel price on optimal system configurations, and results show that a hybrid system with a combination of a photovoltaic array, wind turbine, battery, and diesel generator is the best option from an economic point of view. Ma et al. presented a feasibility study of a stand-alone hybrid solar–wind–battery system for a remote island in Hong Kong [23]. The authors performed sensitivity analysis on its load consumption and renewable energy resources to evaluate the robustness of the economic analysis and identify which variable had the greatest impact on the results. Results presented in the work demonstrate the techno-economic feasibility of implementing the solar–wind–battery system to supply power in the island.
However, most of the authors above focused mainly on optimum sizing, economic analysis, and the management point of view between different components in HRES. Little or no attention is focused on the sustainability and reliability of the HRES. Therefore, this paper looked at the technical and economic analysis of the HRES as well as the reliability and sustainability of the HRES. The work is organized as follows; the methodology and current status of Sierra Leone’s energy sector is presented in Section 2. HRES description and component modeling is illustrated in Section 3. Operational strategies and economic analysis are discussed in Section 4. Results and discussions are presented in Section 5, followed by the conclusions in Section 6.

2. Methodology

MATLAB software, which is a programming and numeric computing platform used by millions of engineers and scientists to analyze data, develop algorithms, and create models, was used in this study. The algorithm used for analyzing the data in this work was the genetic algorithm (GA). GA is an adaptive heuristic search algorithm that belongs to the larger group of evolutionary algorithms.
GA is an advanced search method and optimization technique that utilizes the process of natural selection, where each individual has some genes that change continuously to adapt to its environment through a selection process. Several processes are involved to obtain the new population, which include the selection process called parent search using the roulette wheel, crossover, and mutation process. The algorithm is based on an analogy with the genetic structure and behavior of chromosomes in the population. At each step, GA will select individuals at random from the current population to be parents and use them to produce the children for the next generation. Over successive generations, the population “evolves” toward an optimal solution. The individuals with better fitness scores are selected and will mate and produce better offspring by combining the chromosomes of parents. Once the offspring produced have no significant difference from offspring produced by previous populations, the population converges.
The algorithm is said to converge to a set of solutions for the problem [24].

2.1. Current Energy Scenario in Sierra Leone

Sierra Leone is located on the west coast of Africa, with a total area of 71,740 km2 and a GDP of USD 4.10 billion. The country’s state-owned installed generation capacity stands at 116.81 MW for a population of 7,534,981 [25]. The country is burdened with a complex and persistent energy shortage. This complex situation prompted the government of Sierra Leone in 2018 to sign a 5-year contract with a floating Turkish power ship (Karadeniz powership) for the supply of electricity to the capital city, Freetown. The country’s source of energy from 2015 to 2020 is illustrated in Figure 1. From 2015 to 2017, hydropower plants accounted for the majority of electricity production.
Due to low water levels in the dams, electricity production from hydropower plants is greatly reduced during the dry season. Moreover, during the dry season, some mini-hydroelectric plants connected to runoff rivers cease to function. In 2018, a floating ship that generates electricity was brought in to supplement the power deficit during the dry season.
The country is home to huge deposits of RES, such as wind, solar, biomass, hydro, etc., but approximately only 16% of the country’s population have access to electricity.
In order to increase access to electricity, the government has drawn an Energy Sector Development Plan (National Energy Strategic Plan 2010–2025), which aims at increasing electricity generation from 16% to 60% by 2023 and also aims to catch up with UNSDG 7 [26]. In this context, the government of Sierra Leone has commenced transmission and distribution network activities for the electrification of seven major districts’ headquarter towns by the end of 2022. The current percentage of electrification by district is shown in Figure 2. Freetown, the capital city, is situated in the western urban area and has a rate of approximately 82% electrification. The western rural area has approximately 25%, Bombali has approximately 26%, Bo has approximately 18%, Kenema has approximately 15%, Port Loko has approximately 12%, Kono has approximately 8%, Bonthe has approximately 3%, and Tonkolili has approximately 2%, while Kailahun, Moyamba, Pujehun, Koinadugu, Falaba, Karene, and Kambia all have 0%.
Currently, the country’s transmission lines consist of the existing 161 kV line that runs from the Bumbuna hydroelectric dam to the capital city, Freetown, and the 225 kV CLSG line. The CLSG project aims at increasing access to modern electricity in member countries, which is fundamental to the socio-economic development and living standards of citizens [27,28]. The country’s projected demand for both the residential and mining sectors based on two scenarios (base scenario and low growth scenario) from 2020 to 2030 is presented in Table 1. In a bid to strengthen the energy sector, the National Power Authority (NPA), which was the entity responsible for the generation, transmission, and distribution of electricity in the country, through an act of parliament, was divided into two separate entities: the Electricity Generation and Transmission Company (EGTC) and the Electricity Distribution and Supply Authority (EDSA). EGTC’s mandate is to generate and transmit electricity, while EDSA is responsible for the distribution of electricity to the various customers.

2.2. Study Area

Lungi is located in the northern part of Sierra Leone. The town is best known for being home to the country’s international airport. The region has a subtropical climate that is characterized by two seasons: the rainy season, which runs from May to October, and the dry season, which runs from November to April. The town operates on an island mini-grid with three fuel oil thermal plants of 2000 kW each for the supply of electricity to the township. However, due to the high running costs of these plants and the limited distribution network, only one fuel oil thermal plant is operated at a time. More than half of the population in the township use kerosene, candles, and Chinese battery-powered lamps as their sources of electricity.

2.3. Demand Assessment

In 2015, the government of Sierra Leone, with support from the World Bank, sought the services of a consultancy company (NRECA International Ltd., Arlington, VA, USA) for the development of a detailed demand and transmission and distribution system investment plan for the Greater Freetown area for the period 2015 to 2030 [29]. The plan defines the work needed to serve the current and future demand and population growth for Lungi town. Although Lungi operates on island mode, less than half of the town’s population and business centers are connected to the grid. The demand for both connected and non-connected places is illustrated in Table 2 and Table 3, respectively. For connected places, the demand curve with respect to the activities of the citizens for a period of one week is illustrated in Figure 3. Figure 3 shows that evening demand peaks around 5:00 p.m. to 9:00 p.m., after citizens have returned home from work. Around 6:00 a.m. to 9:00 a.m., when most citizens are getting ready for work, demand is also high. After citizens have gone to work and switched off all electrical appliances at home in the afternoon, demand drops. From the investment plan, the demand and population growth for Lungi for the period 2015 to 2030 is illustrated in Table 4. A construction project to extend the airport is scheduled to begin shortly. As a result, demand for the airport is expected to rise significantly.
Additionally, both domestic and commercial demand will increase by 2025 due to a rapid increase in population. However, the government is still struggling to implement the recommendations from the investment plan due to financial constraints.

2.4. Renewable Energy Resources in Sierra Leone

RES is clean, efficient, and reliable and it is expected to address global challenges such as climate change, energy security, and greenhouse gas emissions [30,31]. Research carried out in recent years indicates that Sierra Leone’s renewable energy potentials countrywide include, but are not limited to, hydro-power (2000 MW), solar radiation (2200 Kwh/m2/year) (Joint Research Centre (JRC) of the European commission), and wind speed (3–7 m/s). Further studies also reveal that there is potential for wind speeds of 12 m/s in the northern part of the country. These studies indicate the country’s huge solar and wind power potential.

2.4.1. Solar PV

Sierra Leone is located under the Sunbelt, which is rich in solar potential [31]. Research conducted by the Ministry of Energy indicates that the country’s solar radiation is approximated at 1460 kWh/m2/year. Lungi enjoys relatively extensive amounts of sunshine throughout the year. The location has direct normal irradiation of 1167 kWh/m2/year, diffuse horizontal irradiation of 1004 kWh/m2/year, an air temperature of 26.4 °C, terrain elevation of 19 m, and solar radiation ranging from 5.70 kWh/m2/day to 6.67 kWh/m2/day, as illustrated in Figure 4. The study area has a high amount of solar radiation from October to May. We can also see that there is a substantial amount of solar radiation during the other months. This indicates that the area is suitable for solar PV installation.

2.4.2. Wind Power

Wind power energy has attracted a great deal of interest in recent years because of its environmental and economic benefits [32,33]. Wind power energy use has spread to almost every corner of the planet [34]. West Africa is considered to have the greatest wind potential due to its wind speeds [35]. Research on wind energy in Sierra Leone is still at a very low pace. Data on wind speeds for the study area indicate an average of 3–5 m/s. However, there is great potential for wind energy in Lungi due to the availability of wind turbines that can now be operated at low wind speeds.

2.4.3. Hydropower

Hydropower is a major energy source, holding great promise for Sierra Leone, which possesses several rivers that could be exploited for electricity [36,37]. According to the power sector master plan of Sierra Leone, the country’s hydroelectric power potential is estimated to be approximately 2000 MW [38,39]. These are mainly concentrated in the northern and eastern parts of the country. Currently, the country has five mini hydroelectric power stations ranging from 120 kW to 50 MW. Lungi is around 60 km from the headquarter town of Port Loko, which has a mini-hydro station of 2000 kW capacity. The hydro station is supposed to provide electricity to the township; however, due to the limited network, only a fraction of the population has access to electricity on a seasonal basis since the dam dries up during the dry season.

3. HRES Description and Component Modeling

The proposed hybrid system is composed of a solar PV, wind turbine, diesel engine, and battery storage system, as indicated in Figure 5. This study comprises renewables such as solar and wind and non-renewables such as diesel generators. Since renewable sources are uncertain, a battery energy storage system (BESS) is included. This MG structure will be built with an MPPT and a bidirectional converter for the BESS. By doing so, the BESS will be able to be charged and discharged as needed.

3.1. Wind Turbine Modeling

Wind turbines are classified into horizontal and vertical axes. The power produced by wind turbines is said to depend on the interaction between the wind turbine rotor and the wind [40]. The horizontal axis type is said to produce higher wind energy conversion efficiency [41], compared to the vertical axis type. Wind turbine power output is calculated in Equation (1) [42].
P W T = { 0 V < V c i   o r   V > V c o V 3 ( P r V r 3 V c i 3 ) P r ( V c i 3 V r 3 V c i 3 ) V c i V V r P r V r V V c o }  
PWT is the power output of the wind turbine, Pr is the rated wind power, V is the wind speed, and Vci, Vr, and Vco represent the cut-in wind speed, rated wind speed, and cut-out wind speed, respectively.

3.2. PV Array Modeling

Due to the decline in the cost of PV technology [43], a rapid increase in PV industries was seen in recent years. A PV panel contains multiple PV cells connected in series and parallel [44]. These PV cells compute the output power of each panel according to their solar radiation and temperature [45]. Equation (2) [42] illustrates the mathematical equations that symbolize the principal power output of a PV panel.
P P V = P V S T C G G r e f ( 1 + K T ( T c T r e f ) ) T c = T a + ( 0.0256 × G )  
PPV represents the power output of the PV, PVSTC represents the nominal power in kW, G is the global solar radiation in kW/m2, Gref represents the solar radiation under STC (1000/m2), TC is the temperature of the PV cell, Tref = 25 °C, KT is the PV temperature coefficient (3.7 ∗ 10−3 °C−1), and Ta is the surrounding temperature.

3.3. Battery Modeling

Various types of batteries, such as lead–acid, lithium-ion, nickel–cadmium, sodium–sulfur, etc., are used in renewable power systems. These batteries store excess energy from renewable sources and discharge to load centers when there is insufficient power from renewable sources. Lead–acid batteries are widely used in renewable power generation as a result of their low cost. The available capacity of the battery calculated in Equation (3) [42] depends upon the rate at which it is discharged. For this study, the charge and discharge rate of the battery is taken to be at 80% and 20%, respectively, as illustrated in Figure 6.
CB = (EL × AD)/(DOD × ηbat × ηinv)
where CB is the battery capacity, EL is the load demand, AD is the battery autonomous days, DOD represents the depth of discharge, and ηbat is the efficiency of the battery, while ηinv is the efficiency of the inverter.

3.4. Diesel Generator (DG) Modeling

The current study location is host to three MAN dual fuel systems (heavy fuel and diesel fuel) of 2000 kW each. The capital cost for the diesel engines, which includes the acquisition, is calculated through a national bidding process. The estimated cost of each DG is USD 2.50 million. The yearly O&M cost per MAN engine is estimated as USD 655,610.62 and the current fuel price is USD 0.94/L. The minimum and maximum load ratios are set at 25 and 75%, respectively. The fuel consumption, which depends on the output power of the diesel generator, is calculated in Equation (4) [46,47].
CG = β × PGr + β × PGo
where PGr and PGo are the rated and output power of the diesel generators, respectively, and α and β are the coefficients of the consumption curve. The hourly fuel cost consumed by the generators is defined in Equation (5) [48].
Cd = CG × Pd
where Pd is the cost fuel per litre.

4. Operational Strategies and Economic Analysis

Sustainable and reliable electricity can be supplied with robust operational strategies. Considering the uncertainty of renewable energy, the status of the diesel engine with its O&M cost, and the cost of fuel, three operational strategies are involved. Case one is when DG is used to supply electricity only, as analyzed in Equation (6) [42]. Case two is when renewable energy, a diesel generator, and a battery are used to supply electricity, as illustrated in Equation (7). The third stage is when renewable energy and a battery are used to supply electricity, as shown in Equation (9).
Enet(t) = PGEL(t),
Enet(t) = ERE + PG + BESSEL(t),
ERE(t) = EWT(t)+ EPV(t),
Enet(t) = ERE + BESSEL(t),
where ∆Enet(t) is the net energy of the hybrid energy systems, ERE is the energy generated from renewables, EWT is the energy generated by the wind turbines, EPV is the energy generated by the PV panels, PG is the generated power from the diesel engines, EL is the load demand, and BESS is the battery energy storage system.
Figure 7 demonstrates the operational strategy of the flow of energy at each time step. From the diagram, the process begins when the power produced from renewable sources is equal to the required load demand. In that case, the batteries will remain in their current state. However, in a situation where the power produced by renewable sources is more than the demand, excess power will be used to charge the batteries if they are not fully charged. During this period, the diesel generator will be in standby mode. The next operation strategy is activated when the power produced by renewable sources is not sufficient to meet the demand. Then, the battery will discharge power to compensate for the deficit until it reaches its minimum depth of discharge. The diesel generators will then operate to cover the power shortage in renewables and to charge the battery.

4.1. System Reliability Analysis

This study implements a multi-objective optimization technique in order to minimize the loss of power supply probability (LPSP) as well as the cost of energy (COE) production. In determining the system’s reliability and sustainability, this work examines three case scenarios: the first is when the micro-grid is operating on DG only; the second is a hybrid PV/wind/DG/battery, and the third is PV/wind/battery. The algorithm utilized in determining system reliability is the genetic algorithm (GA). The uncertainty of PV and wind energy is a major drawback. Therefore, accessing the LPSP is very much critical. Two methods are normally used in determining LPSP (probabilistic and chronological methods). The probabilistic method is considered to be one of the standard techniques normally used in evaluating the reliability of power systems [48,49]. However, even though the probabilistic method is a mature tool with high performance, it entails substantial modeling effort with a high computational burden. Meanwhile, the chronological method is able to retain much chronological information and can capture proper time-scale relationships between the load and renewable sources with a lower computational burden. Another advantage of the chronological method is the use of average values that integrate the complete behavior of these renewable sources to account for their contributions to the grid power availability. It is against this background that we decided to use the chronological method in this work. LPSP is defined as the time duration within which a utility could not meet its load, as a result of either a planned or unplanned outage of any conventional generating unit. LPSP is mathematically represented in Equation (10) [42]:
L P S P = t = 1 T E L ( t ) E R E ( t ) + ( B S O C ( t ) B S O C m i n ( t ) ) × η i n v t = 1 T E L ( t )  

4.2. Economic Analysis

The technology used in generating electricity can significantly determine its cost, and this cost can occur relative to the manner in which this power is consumed. Table 5 illustrates the components’ costs, which includes capital, O&M, and replacement and their specifications. Determining the cost of energy is one of the benchmarks of the economic profitability of hybrid renewable energy systems. COE can be defined as the cost of energy generated per kW and it is mathematically represented in Equation (11) [42].
C O E = ( C R F × T A C ) E L  
where CRF is the capital recovery factor, and it is represented as stated in Equation (12) [42].
C R F = i ( 1 + i ) T ( 1 + i ) T 1  
where i is the interest rate, which is taken as 5%, and T is the total lifespan of the project and it is to be 25 years. TAC is the total annualized cost and it is mathematically represented in Equation (13) [42].
TAC = CC + CO&M + CR
CC = (NPV × PPV × CPV) + (NWT × PWT × CWT) + (CWT × NWT × 25/100) + (NB × Cb × CB) + (NINV × CINV) + (Creg_PV + Creg_WT)
where CPV is the PV unit price for the PV panel, CWT is the unit price for the wind turbine, Cb is the unit price for the battery, NB is the number of batteries, CINV is the unit price for the inverter, Creg_PV is the PV regulator price, Creg_WT is the wind turbine regulator price, and NINV is the number of inverters. The number of inverters is 4 and the estimated cost of the wind tower is 20% of the system capital cost. TAC includes the annualized capital cost (CC) in Equation (14) [42], the operation and maintenance cost (CO&M), and the replacement cost. CR is represented in Equations (15) and (16) [42].
CR = CREP× SFF(i, PR_LF)
CREP = ir × ((NB × CRB) + (NINV × CRINV) + (Nreg_PV × (CR_reg_PV) + (Nreg_WT × CR_reg_WT))
where CRB is the replacement cost of the battery, CRINV is the replacement cost of the inverter, and PR_LF is the lifespan of the battery, inverter, and regulator. CR_reg_WT is the replacement cost of the wind turbine regulator, and CR_reg_PV is the replacement cost of the PV regulator. Nreg_PV is the number of PV voltage regulators, Nreg_WT is the number of wind turbine regulators, and SFF is the sinking factor and it is expressed in Equation (17) [42].
S F F ( i , P R _ L F ) = i ( 1 + i ) P R _ L F 1
The COE for the diesel engine is calculated considering the cost of fuel consumed by the diesel generator (DG) and the maintenance cost. Fuel prices fluctuate and the current fuel price is taken into consideration. The town has three diesel generators of 2000 kW each (total of 6000 kW). Fuel oil is transported by fuel tankers ranging from 4000 to 40,000 L in capacity and transportation is carried out by the supplier.

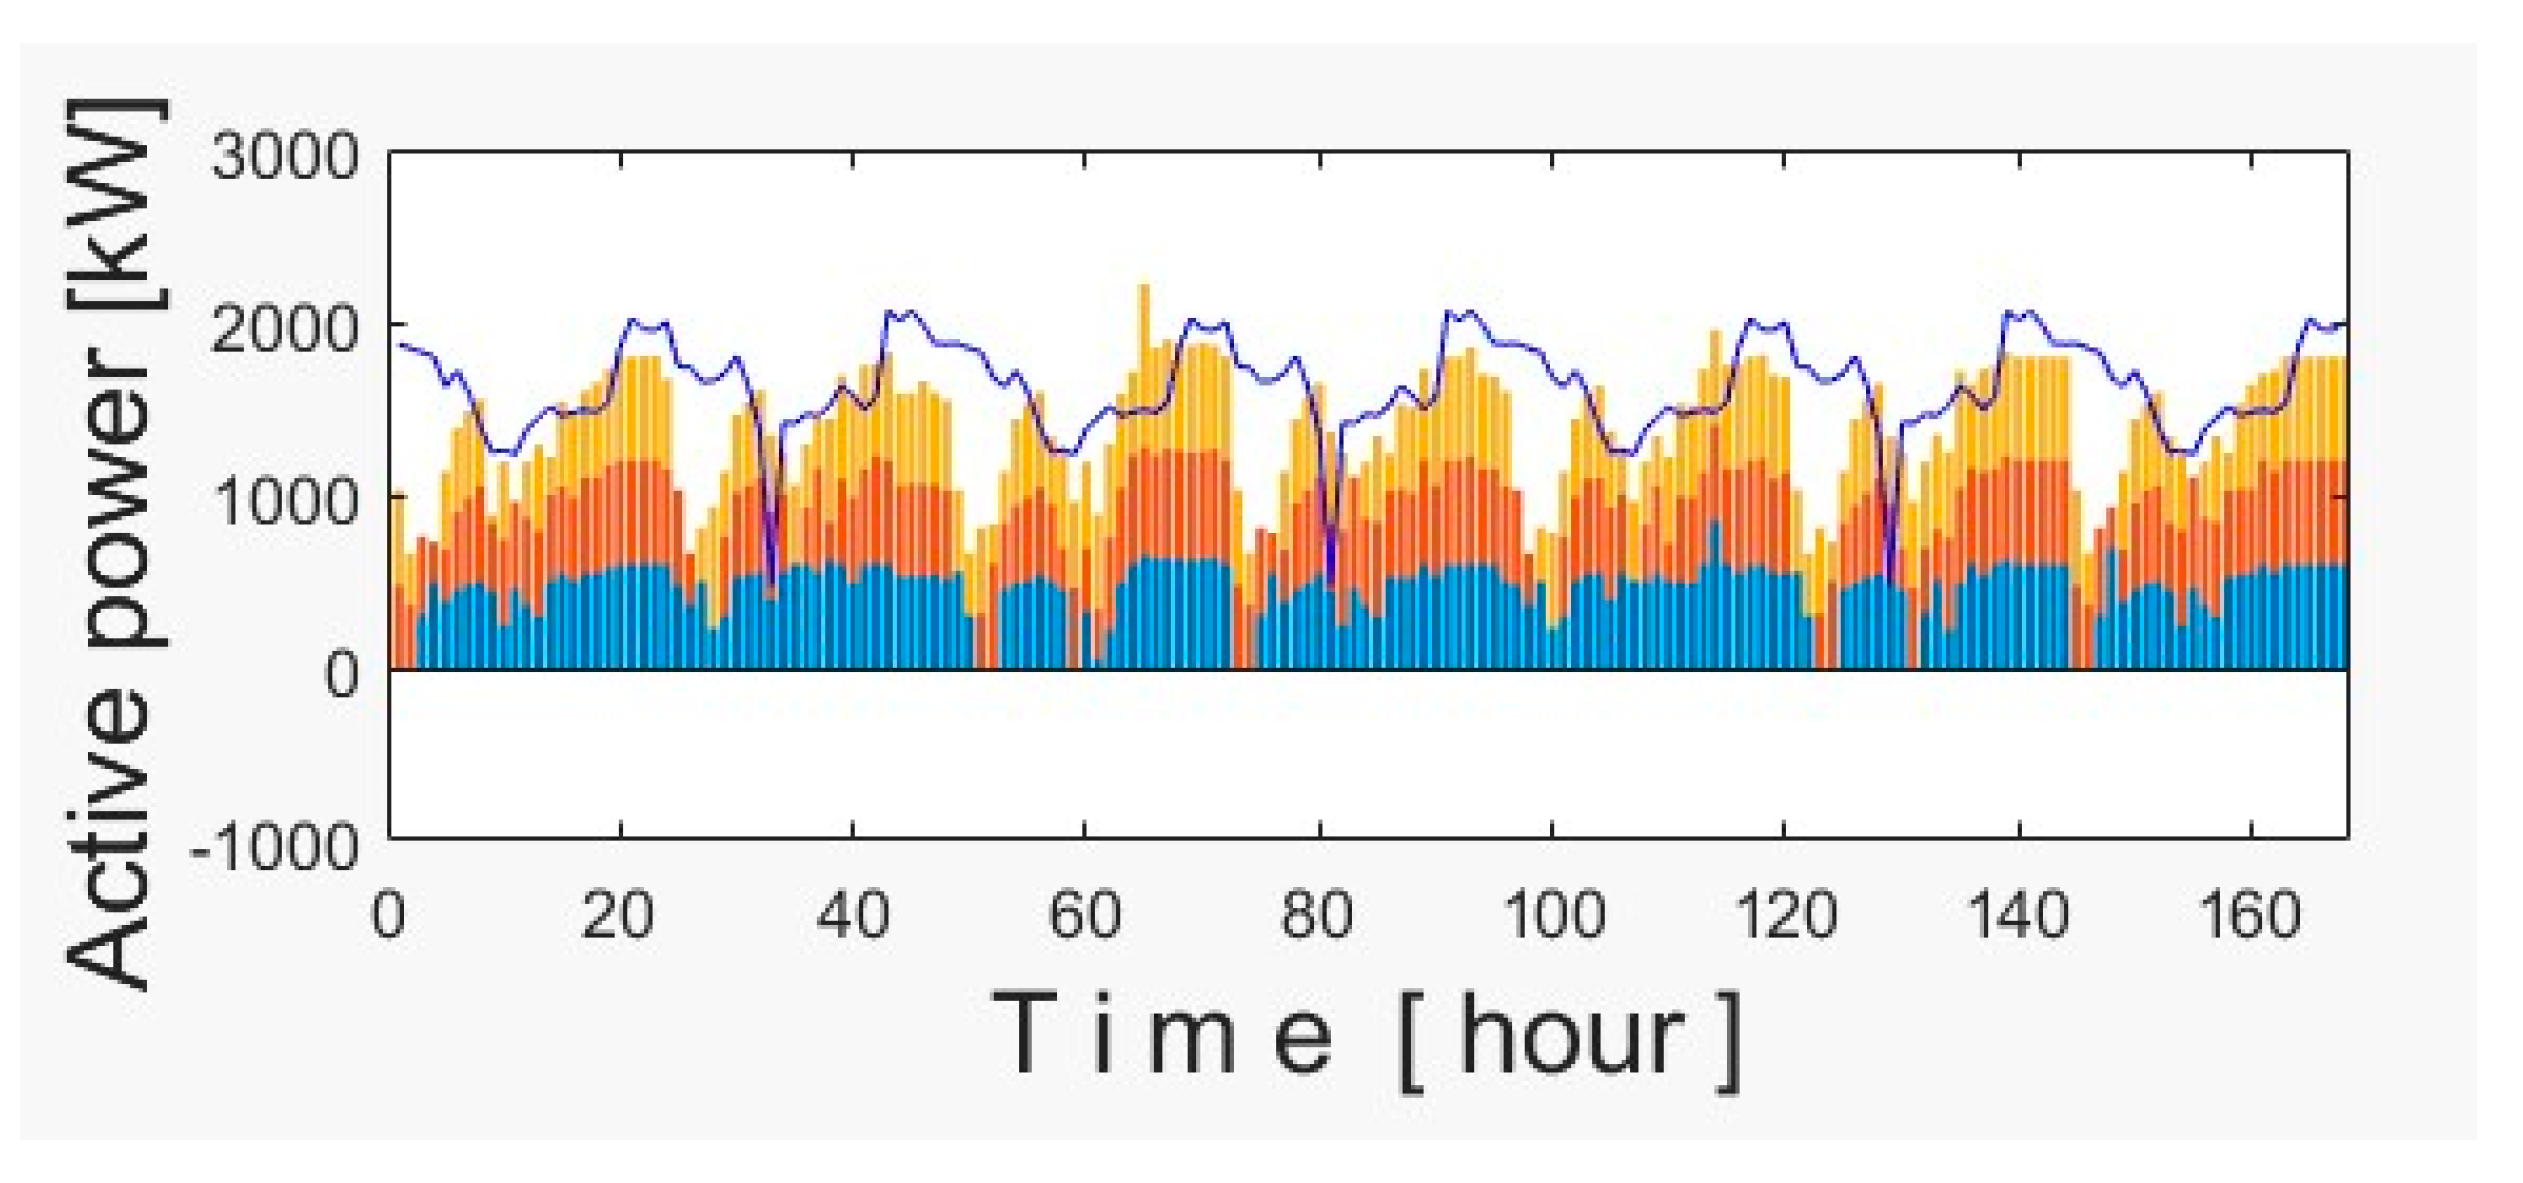
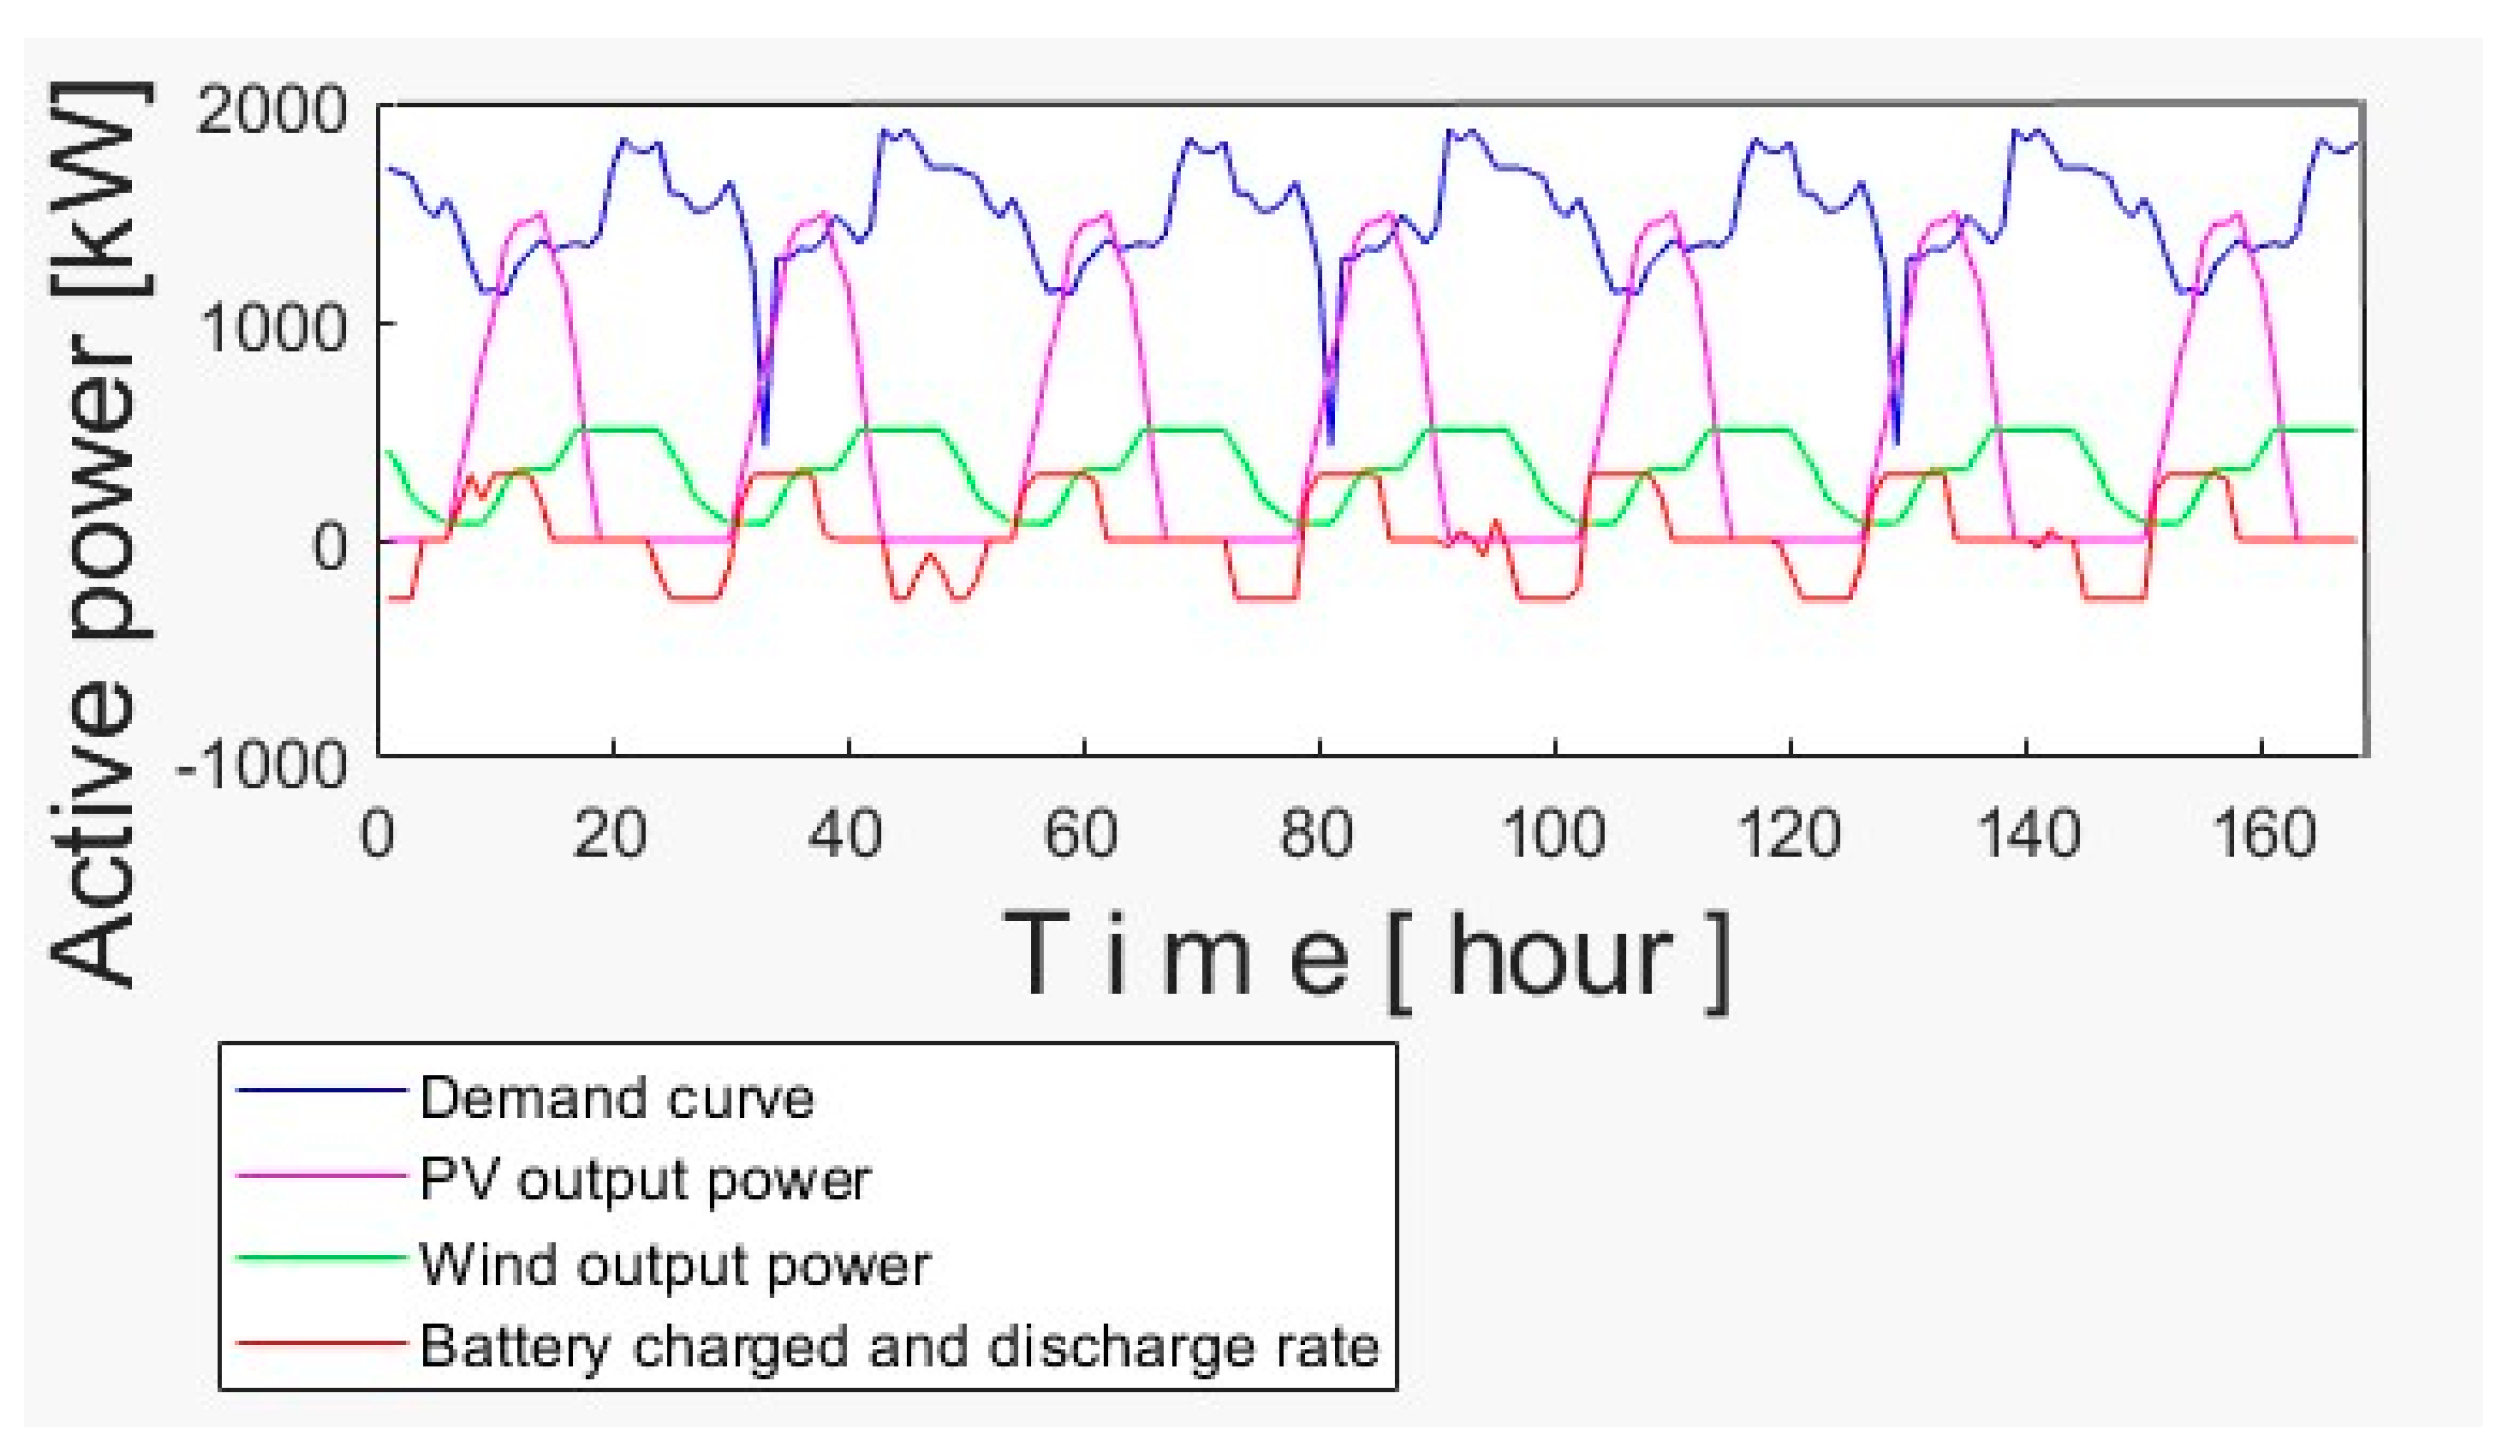
5. Results and Discussion

With the current means of electricity generation through fuel oil thermal plants, Lungi is undergoing a serious electricity crisis. The only quick solution to this problem is the integration of renewable sources into the current mini-grid. In this work, optimization of hybrid PV/wind/diesel and battery was carried out based on PV and wind data collected for the study location. Power generated by PV and wind for a period of one week is shown in Figure 8 and Figure 9, respectively. Although the country enjoys abundant sunshine during the dry season, the technical aspect regarding the uncertainty of these resources has been considered. Data from one week in February were collected and input into the program. Solar radiation during the dry season follows the same pattern. Sunrise is at 7:00 a.m. and sunset is at 7:00 p.m. During those hours, solar power is abundant. From 7:00 p.m. to 7:00 a.m., the region experiences zero power from the solar PV plants. However, from Figure 9, we can see that there is a high amount of wind power from 12:00 p.m. to 2:00 a.m. and moderate wind power from 2:00 a.m. to 11:00 p.m. Due to this variation in these technologies, the system incorporates BESS and DG. In this study, solar and wind data were obtained from the meteorological department and SSL [50,51].
The presented work looked at three cases, the first case being the use of fuel thermal plants as the only means of supplying electricity to the town, as illustrated in Figure 10. Three DGs are coordinated in order to meet the current demand. This is done with the intention of minimizing costs and maximizing revenue. However, this is difficult to achieve due to the high cost of operation and frequent breakdown of the DGs. Operational data for one of the DGs for 2018 are shown in Table 6. Due to the constraints of purchasing fuel, the thermal plants are only operated for between 16 and 18 h instead of 24 h. However, it can be observed from Table 6 that, despite the low consumption of fuel by the DGs from July to December, the O&M cost is higher compared to the previous months. This is due to the increase in fuel prices within the world market. The price trend for both DFO and HFO for the period 2015 to 2021 is shown in Figure 11. From 2015 to 2018, the price of DFO was higher than that of HFO. In this case, the cost of operation of these DGs was much better since the DGs utilized more HFO. However, the cost of operation of these DGs became extremely high when the cost of both DFO and HFO increased from 2019. The second case looked at a hybrid of renewable sources, a battery and DG. In this case, the DG was only active for a very short time when there was a shortfall in any of the renewable sources and to charge the battery when it was at its minimum SOC, as shown in Figure 12. This proposed hybrid setup is expected to meet the current demand in a reliable and sustainable manner at minimum cost and maximize revenue. Whenever generated power exceeds the demand during the day, excess power is used to charge the battery. Moreover, when the generated power cannot meet the demand, then the battery will discharge. As indicated in Figure 12, the battery curve will be positive when it is charging, and it will be negative when it is discharging. The third case is that wherein only renewable sources and BESS are utilized, as indicated in Figure 13. This case is active during the dry season from October to April, when the areas enjoy a high amount of sunshine and high wind speeds. During this period, the DGs serve as standby for any uncertainty that may occur on the RES. Data for the month of February, in which the town experiences enough sunlight and substantial wind speeds, were used in this work.

Optimization Results

The optimal sizing solution obtained is categorized into three sets of configurations, as explained in the previous section. This is shown in Table 7. The use of RES alone could not guarantee reliable and sustainable electricity in the region due to its seasonal variation. However, the introduction of these RES into the current traditional method of generating electricity through fuel oil thermal plants greatly reduces the cost of O&M of these fuel oil plants and the loss of power supply probability, as can be seen in Table 7. Taking a closer look at the table reveals a reduction in the O&M cost in the second and third cases, while the result in the first case significantly exceeds them. From an economic point of view, O&M costs for the second and third cases at 0% LPSP are USD 561,674.06/year and USD 36,000/year, respectively. For the first case, the O&M cost increases significantly to USD 1,050,348.12/year. Currently, the selling price of electricity in Sierra Leone is USD 0.853/kWh, but this is expected to increase within the shortest possible time if the town continues to obtain its electricity supply through DGs. However, with the introduction of RES, the selling price will remain the same or further reduce due to the decrease in O&M cost. For system reliability and sustainability, the third case is not seen as the best solution due to the uncertainty of RES. As a result, the second case is considered to be the most viable option for guaranteeing electricity supply in the study area at the minimum cost and at zero percent LSP.
Due to distribution network constraints, only one diesel generator is utilized at a time. Therefore, the O& M presented in Table 7 represents one diesel generator. Since the current demand for connected areas is approximately 1900 kW, this means that the thermal plants are operated on an alternative basis since they are three in number, with an output capacity of 2000 kW each. This creates approximately 66.6% surplus power taking into consideration all three units. At any point of the day or night wherein the MG experiences a slight reduction in any of the renewable sources, the battery will discharge power to compensate for the deficit. However, the battery has a minimum discharge rate. Upon approaching its minimum discharge rate, the DG will be switched on to recharge the battery and also to supply the remaining power needed to the grid, as indicated in Figure 12. Whenever power produced by renewable sources exceeds demand, the excess power will be used to charge the batteries. Moreover, when renewable sources cannot meet the demand, the batteries discharge, as illustrated in Figure 13. The installed capacities for both PV solar and wind turbine energy are indicated in Table 7. The goal here is to utilize more RES to minimize COE and LPSP. The current load demand for the study area is estimated to be 1900 kW. With the proposed capacity of PV solar and wind turbine energies, the demand is expected to be met. Due to distribution network limitations, the area has many unserved communities. In spite of this, with the high amount of renewable energy in the study area, more solar PV and wind turbines are expected to be installed as more communities are connected to the MG. The current model uses DGs as a backup to ensure that the load is always met, even during periods of low sunshine or low wind speed. Based on the optimization results, as summarized in Table 7, it is realized that PV/wind/DG/battery is the best hybrid system for reliable and sustainable power supply in Lungi. This system has also been proven to be more cost-effective than the DG system.

6. Conclusions

This work presents a techno-economic analysis of HRES for the supply of reliable and sustainable electricity in Lungi, Sierra Leone, under the prevalent solar and wind conditions.
The work designs a hybrid PV/wind/DG/battery system to provide electricity in the study area. A genetic algorithm was used to carry out the optimization process.
Two objective functions are considered, which include the minimization of the cost of energy (COE) and loss of power supply probability (LPSP). The paper proposes three case scenarios to solve the optimization problem. The first case considers the utilization of DGs only, as in the current MG. The second case looks at a hybrid PV/wind/DG/battery system, while the third case considers a hybrid PV/wind/battery system.
Based on the analysis, the O&M cost for case one is USD 1,050,348.12/year. For cases two and three, the O&M cost is USD 561,674.06/year and USD 36,000/year, respectively. Case three, which includes PV/wind/battery, could be an attractive option from an economic standpoint.
As a result of the uncertainty surrounding RES, case two, PV/wind/DG/battery, will provide electricity for the town of Lungi with minimal LPSP and COE. Since the country is blessed with abundant RES (solar, hydro, and wind), this model can be used to electrify other semi-urban and rural communities. Looking at the current constraints in supplying electricity in Lungi through the use of DGs, this work, therefore, recommends a hybrid PV/wind/DG and battery system for future semi-urban and rural electrification projects in Sierra Leone.

Author Contributions

Conceptualization, F.C. and T.S.; methodology, F.C.; software, F.C.; validation, F.C. and T.S.; formal analysis, H.T.; investigation, F.C.; resources, A.M.H.; data curation, A.M.; writing—original draft preparation, F.C.; writing—review and editing, A.M.H., N.K., A.M. and T.S.; visualization, A.M.; supervision, T.S.; project administration, T.S.; funding acquisition, T.S. All authors have read and agreed to the published version of the manuscript.

Funding

This research received no external funding.

Institutional Review Board Statement

Not applicable.

Informed Consent Statement

Not applicable.

Data Availability Statement

Not applicable.

Conflicts of Interest

The authors declare no conflict of interest.

Abbreviations

The following abbreviations are used in this manuscript:
GDPGross Domestic Product
EGTCElectricity Generation and Transmission Company
EDSAElectricity Distribution and Supply Authority
WAPPWest Africa Power Pool
NRECANational Rural Electric Cooperative Association
DFODiesel Fuel Oil
HFOHeavy Fuel Oil
BESSBattery Energy Storage System
MWMega Watts
kVKilo Volts
kWhKilo Watts Hour
BsocBattery State of Charge
BsocminMinimum Battery State of Charge
PVPhotovoltaic
HRESHybrid Renewable Energy Sources
DGsDiesel Generators
CLSGCote d’Ivoire, Liberia, Sierra Leone and Guinea
NRECANational Rural Electric Cooperative Association
MANMaschinenfabrik Augsburg Numberg (German made engines)
O%MOperation and Maintenance
DCDirect Current
ACAlternating Current
GDPGross Domestic Product
UNSDGUnited Nations Sustainable Development Goal
RESRenewable Energy Sources
MGMicro-Grid
No.Number
SSLStatistics Sierra Leone
MPPTMaximum Power Point Tracking

References

  1. Odour, O.D.T.; Bhandari, R.; Adamou, R. Hybrid off-grid renewable power system for sustainable rural electrification in Benin. Renew. Energy 2020, 16, 1266–1279. [Google Scholar] [CrossRef]
  2. Canizares, C.; Nathwani, J.; Kammen, D. Electricity for All: Issues, Challenges, and Solutions for Energy-Disadvantaged Communities. Proc. IEEE 2019, 107, 1775–1779. [Google Scholar] [CrossRef]
  3. Tracking SDG7: The Energy Progress Report (IRENA). Available online: https://www.irena.org/publications/2018/May/TrackingSDG7 (accessed on 1 October 2018).
  4. Africa 2030: Roadmap for a Renewable Energy Future (IRENA). Available online: https://www.irena.org/publications/2015/Oct/Africa203 (accessed on 2 October 2015).
  5. English, J.; Niet, T.; Lyseng, B.; Keller, V.; Palmer-Wilson, K.; Robertson, B.; Wild, P.; Rowe, A. Flexibility requirements and electricity system planning: Assessing inter-regional coordination with large penetrations of variable renewable supplies. Renew. Energy 2019, 145, 2770–2782. [Google Scholar] [CrossRef]
  6. Sinsel, S.R.; Riemke, R.L.; Hoffmann, V.H. Challenges and solution technologies for the integration of variable renewable energy sources-a review. Renew. Energy 2019, 145, 2771–2785. [Google Scholar] [CrossRef]
  7. Yuksel, I. Hydropower for sustainable water and energy development. Renew. Sustain. Energy Rev. 2010, 14, 461–469. [Google Scholar] [CrossRef]
  8. Kaygusuz, K.; Sari, A. Renewable Energy Potential and Utilization in Turkey. Energy Convers. Manag. 2013, 44, 459–478. [Google Scholar] [CrossRef]
  9. Del Río, P.; Burguillo, M. An empirical analysis of the impact of renewable energy deployment on local sustainability. Renew. Sustain. Energy Rev. 2009, 13, 1314–1325. [Google Scholar] [CrossRef]
  10. Kumar, A.; Kumar, K.; Kaushik, N.; Sharma, S.; Mishra, S. Renewable energy in India: Current status and future potentials. Renew. Sustain. Energy Rev. 2010, 14, 2434–2442. [Google Scholar] [CrossRef]
  11. Panwar, N.L.; Kaushik, S.C.; Kothar, S. Role of renewable energy sources in environmental protection: A review. Renew. Sustain. Energy Rev. 2011, 15, 1513–1524. [Google Scholar] [CrossRef]
  12. Farhad, S.; Saffar-Avval, M.; Younessi-SinakirMusical, M. Efficient design of feed water heaters network in steam power plants using pinch technology and energy analysis. Int. J. Energy Res. 2008, 32, 1–14. [Google Scholar] [CrossRef]
  13. Suberu, M.Y.; Mustafa, M.W.; Bashir, N.; Muhamad, N.A.; Mokhtar, A.S. Power sector renewable energy integration for expanding access to electricity in sub-Saharan Africa. Renew. Sustain. Energy Riviews 2013, 25, 630–642. [Google Scholar] [CrossRef]
  14. Khodayar, M.E. Rural electrification and expansion planning of off-grid microgrids. Electr. J. 2017, 30, 68–74. [Google Scholar] [CrossRef]
  15. Gabra, S.; Miles, J.; Scott, S.A. Techno-economic analysis of stand-alone wind micro-grids, compared with PV and diesel in Africa. Renew. Energy 2019, 143, 1928–1934. [Google Scholar] [CrossRef]
  16. Pérez-Arriaga, I.J.; Stoner, R.; Rahnama, R.; Lee, S.J.; Jacquot, G.; Protzer, E.; González-García, A.; Amatya, R.; Brusnahan, M.; Dueñas1, P. A utility approach to accelerate universal electricity access in less developed countries: A regulatory proposal. In Economics of Energy and Environmental Policy; Massachusetts Institute of Technology (MIT): Cambridge, MA, USA; Institute for Research in Technology (IIT), Comillas Pontifical University: Madrid, Spain, 2018; pp. 1–15. [Google Scholar]
  17. Barakat, S.; Ibrahim, H.; Elbaset, A.A. Multi-objective optimization of grid-connected PV-wind hybrid system considering reliability, cost, and environmental Asp. Cities Soc. 2020, 60, 102178. [Google Scholar] [CrossRef]
  18. Moner-Girona, M.; Bódis, K.; Morrissey, J.; Kougias, I.; Hankins, M.; Huld, T.; Szabó, S. Decentralized rural electrification in Kenya: Speeding up universal energy access. Energy Sustain. Dev. 2019, 52, 128–146. [Google Scholar] [CrossRef]
  19. Adaramola, M.S.; Agelin-Chaab, M.; Pau, S.S. Assessment of Wind power generation along the coast of Ghana. Energy Convers. Manag. 2013, 77, 61–69. [Google Scholar] [CrossRef]
  20. Wakiyama, T.; Kuriyama, A. Assessment of renewable energy expansion potential and its implications on reforming Japan’s electricity system. Energy Policy 2018, 115, 302–316. [Google Scholar] [CrossRef]
  21. Krishan, O.; Suhag, S. Techno-economic analysis of a hybrid renewable energy system for an energy poor rural Communityjournal. Energy Storage 2019, 23, 305–319. [Google Scholar] [CrossRef]
  22. Gebrehiwot, K.; Mondal, M.A.H.; Ringler, C.; Getaneh-Gebremeskel, A. Optimization and cost-benefit assessment of hybrid power systems for off-grid rural electrification in Ethiopia. Energy 2019, 177, 234–246. [Google Scholar] [CrossRef]
  23. Ma, T.; Yang, H.; Lu, L. A feasibility study of a stand-alone hybrid solar–wind–battery system for a remote island. Appl. Energy 2014, 121, 149–158. [Google Scholar] [CrossRef]
  24. Borhanazad, H.; Mekhilef, S.; Ganapathy, V.G.; Modiri-Delshad, M.; Mirtaheri, A. Optimization of micro-grid system using MOPSO. Renew. Energy 2014, 71, 295–306. [Google Scholar] [CrossRef]
  25. Sierra Leone Integrated Household Survey Report (Statistics Sierra Leone). Available online: https://www.statistics.sl/index.php/statistical-activities/field-activities/sierra-leone-integrated-household-survey-slihs.html (accessed on 1 October 2019).
  26. Emuzie, K. Renewable Energy as Viable Option to Meet West Africa Power Needs. Available online: https://businessday.ng/energy/power/article/renewable-energy-viable-option-meet-west-africa-power-needs (accessed on 9 May 2018).
  27. Aliyu, A.K.; Modu, B.; Tan, C.W. A review of renewable energy development in Africa: A focus in South Africa, Egypt and Nigeria. Renew. Sustain. Energy Rev. 2018, 81, 2502–2518. [Google Scholar] [CrossRef]
  28. Baruah, D.C.; Enweremadu, C.C. Prospects of decentralized renewable energy to improve energy access: A resourceinventory-based analysis of South Africa. Renew. Sustain. Energy Rev. 2019, 103, 328–341. [Google Scholar] [CrossRef]
  29. NRECA. Preparation of the Electricity Network Investment Plan: Final Design Report; NRECA International Limited, Ministry of Energy: Freetown, Sierra Leone, 2016; pp. 1–456. [Google Scholar]
  30. Karakosta, C.; Pappas, C.; Marinakis, V.; Psarras, J. Renewable energy and nuclear power towards sustainable development:Characteristics and prospects. Renew. Sustain. Energy Rev. 2013, 22, 187–197. [Google Scholar] [CrossRef]
  31. Gyamfi, S.; Derkyi, N.S.A.; Asuamah, E.Y.; Aduako, I.J.A. Renewable Energy and Sustainable Development. Sustainable Hydropower in West Africa. In Sustainable Hydropower in West Africa; Kabo-Bah, A., Diji, C.J., Eds.; Academic Press: Cambridge, MA, USA, 2018; pp. 75–94. [Google Scholar]
  32. Senjyu, T.; Kaneko, T.; Uehara, A.; Yona, A.; Sekine, H.; Kim, C.H. Output power control for large wind power penetration in small power system. Renew. Energy 2009, 34, 2334–2343. [Google Scholar] [CrossRef]
  33. Senjyu, T.; Sakamoto, R.; Urasaki, N.; Funabashi, T.; Fujita, H.; Sekine, H. Output Power Leveling of Wind Turbine Generator for All Operating Regions by Pitch Angle Control. IEEE Trans. Energy Convers. 2006, 21, 467–475. [Google Scholar] [CrossRef]
  34. Lyu, X.; Zhao, J.; Jia, Y.; Xu, Z.; Wong, K.P. Coordinated control strategies of PMSG-based wind turbine for smoothing power fluctuations. IEEE Trans. Power Syst. 2018, 34, 391–401. [Google Scholar] [CrossRef]
  35. Carlin, P.W.; Laxson, A.S.; Muljadi, E.B. The history and state of the art of variable-speed wind turbine technology. Natl. Renew. Energy Lab. 2001, 6, 129–159. [Google Scholar]
  36. Sierra Leone Investment and Export Promotion Agency (Energy Sector Profile). Available online: http://www.energy.gov.sl/EnergyProfil (accessed on 10 March 2009).
  37. National Energy Profile of Sierra Leone (United Nations Development Programe). Available online: https://www.undp.org/content/dam/sierraleone/docs/focusareadocs/undp_sle_energyprofile.pdf (accessed on 1 June 2012).
  38. Jalloh, B. The energy Sector in Sierra Leone(Ministry of Foreign Affairs). Available online: https://www.rvo.nl/sites/default/files/2018/07/sector-scan-the-energy-sector-in-sierra-leone.pdf (accessed on 1 December 2017).
  39. Scaling up Access to Renewable Baseload Power in Sierra Leone. Sierra Leone: Bumbuna Hydro 11. Available online: https://infracoafrica.com/project/bumbuna-hydro-ii/ (accessed on 20 July 2020).
  40. Singh, M.; Santoso, S. Dynamic Models for Wind Turbines and Wind Power Plants; National Renewable Energy Laboratory, The University of Texas: Austin, TX, USA, 2011; pp. 1–115. [Google Scholar]
  41. Soriano, L.A.; Yu, W.; Rubio, J.D.J. Modeling and Control of Wind Turbine. Math. Probl. Eng. 2013, 2013, 982597. [Google Scholar]
  42. Hlal, M.I.; Ramachandaramurthya, V.K.; Padmanaban, S.; Kaboli, H.R.; Pouryekta, A.; Abdullah, T.A.R. NSGA-11 and MOPSO based optimization for sizing of hybrid PV/wind/battery energy storage system. Int. J. Power Electron. Drive Syst. 2019, 10, 463–478. [Google Scholar]
  43. Viana, M.S.; Junior, G.M.; and Udaeta, M.E.M. Analysis of demand response and photovoltaic distributed generation as resources for power utility planning. Appl. Energy 2018, 217, 456–466. [Google Scholar] [CrossRef]
  44. Wanga, Q.; Yaoa, W.; Fanga, J.; Aia, X.; Wena, J.; Yangb, X.; Xieb, H.; Huangb, X. Dynamic modeling and small signal stability analysis of distributed photovoltaic grid-connected system with large scale of panel level DC optimizers. Appl. Energy 2019, 259, 114132. [Google Scholar] [CrossRef]
  45. Qi, J.; Zhang, Y.; Chen, Y. Modeling and maximum power point tracking (MPPT) method for PV array under partial shade conditions. Renew. Energy 2013, 66, 337–345. [Google Scholar] [CrossRef]
  46. Huanga, Z.; Xiea, Z.; Zhanga, C.; Chanb, S.H.; Milewskic, J.; Xiea, Y.; Yanga, Y.; Hua, X. Modeling and multi-objective optimization of a stand-alone PV-hydrogen-retired EV battery hybrid energy system. Energy Convers. Manag. 2018, 181, 80–92. [Google Scholar] [CrossRef]
  47. Elkadeema, M.R.; Wanga, S.; Sharshirb, S.W.; Atiac, E.G. Feasibility analysis and techno-economic design of grid-isolated hybrid renewable energy system for electrification of agriculture and irrigation area: A case study in Dongola, Sudan. Energy Convers. Manag. 2019, 196, 1453–1478. [Google Scholar] [CrossRef]
  48. Abo-Elyousr, F.K.; Nozhy, A.N. Bi-objective Economic Feasibility of Hybrid Micro-Grid Systems with Multiple Fuel Options for Islanded Areas in Egypt. Renew. Energy 2018, 128, 37–56. [Google Scholar] [CrossRef]
  49. Castro, R.M.G.; Ferreira, L.A.F.M. Comparison Between Chronological and Probabilistic Methods to Estimate Wind Power Capacity Credit. IEEE Trans. Power Syst. 2001, 16, 904–909. [Google Scholar] [CrossRef]
  50. Sierra Leone Meteorological Agency. Available online: https://www.slmet.gov.sl/ (accessed on 2 May 2021).
  51. Sunrise, Sunset, Dawn and Dusk Times around the World. Available online: https://www.gaisma.com/en (accessed on 15 January 2018).
Figure 1. Total energy supplied by the various generation plants from 2015 to 2020.
Sustainability 13 11435 g001
Figure 2. The figure above shows the current percentage electrification rate by district.
Sustainability 13 11435 g002
Figure 3. Load demand curve for a period of one week in Lungi.
Sustainability 13 11435 g003
Figure 4. This shows the average monthly solar radiation for the study area.
Sustainability 13 11435 g004
Figure 5. Proposed structure of the MG.
Sustainability 13 11435 g005
Figure 6. The charge and discharge rate of the battery.
Sustainability 13 11435 g006
Figure 7. Operational strategy flow chart of the hybrid renewable energy system.
Sustainability 13 11435 g007
Figure 8. Energy generated from solar PV.
Sustainability 13 11435 g008
Figure 9. Energy generated from wind.
Sustainability 13 11435 g009
Figure 10. Commitment of DGs.
Sustainability 13 11435 g010
Figure 11. The trend of prices of fuel in 2015–2021.
Sustainability 13 11435 g011
Figure 12. Output power by the various technologies.
Sustainability 13 11435 g012
Figure 13. Output power generated by various technologies without DG.
Sustainability 13 11435 g013
Table 1. The projected demand for residential and mining sector.
Base Scenario2020 (MW)2025 (MW)2030 (MW)
Residential140230349
Mines258314382
Total399544731
Low Growth Scenarion2020 (MW)2025 (MW)2030 (MW)
Residential106154225
Mines185215249
Total291369474
Table 2. Places that are currently connected to the MG.
Load ClassLoad CenterLoad Demand (kW)
Schools4 schools10.40
Formal Businesses2 Fuel Stations24
Churches2 Churches13.60
Hotels and Guest Houses3 Hotels640
Hospitals2 Hospitals96
Police Stations and Barracks1 Station and 1 Barracks44
Entertainment Centers2 Entertainment Centers28
Mosques1 Mosque3.20
Airports1 Airport640
DomesticHousehold load595
Table 3. Places that are currently not connected to the MG.
Load ClassLoad CenterLoad Demand (kW)
Schools11 Schools29.60
Formal Businesses4 Formal Businesses39.60
Churches2 Churches12.40
Hotels and Guest Houses2 Hotels252
Hospitals1 Hospital Clinic80
NGO and Government Offices7 NGO and Government Offices206
Entertainment Centers2 Entertainment Centers28
Mosques3 Mosques8.80
DomesticHousehold load700
Table 4. Number of customers connected to the MG and peak demand forecast from 2015 to 2030 for both base and low-growth scenarios for Lungi.
Year20152018202020252030
Population70,70775,92179,60989,632100,917
Elect. customers (base scenario)12481585193451467164
Elect. customers (low-growth scenario)12481316184039125534
Peak demand (base scenario MW)0.400.703.606.6010.10
Peak demand (low-growth scenario MW0.400.402.905.007.40
Table 5. The various components’ costs and their specifications.
TechnologySpecification
PV ModuleCapacity (kW) = 1500
Capital($/kW) = 1380
Replacement cost($/kW) = 1380
O&M cost($/kW-Year) = 10 Lifetime(YR) = 25
Wind PowerCapacity (kW) = 500
Capital($/kW) = 1600
Replacement cost($/kW) = 1600
O&M cost($/kW-Year) = 33 Lifetime(YR) = 25
Diesel EnginesCapacity (kW) = 2000 × 3
Capital($) = 2.5 M/engine
Replacement cost($) = 2.5 M/engine
O&M cost($/Year) = 665,610.62 Lifetime(Year) = 25
BatteryRated capacity = 15,294 Ah
Capital($/kWh) = 325
Replacement cost($/kWh) = 325
O&M cost($/kW-Year) = 10 Lifetime(Year) = 10
InverterCapacity(kW) = 1000
Capital($) = 340,000
Replacement cost($) = 340,000
O&M cost($/kW-Year) = 6000 Lifetime(Year) = 15
Table 6. O&M report for one of the DGs for the study area in 2018.
MonthkWh GeneratedFuel Utilized (Litres)Fuel Cost ($)O&M Cost ($)
January626,384152,51958,833.5762,118.31
February587,268140,75354,534.1254,541.80
March657,932159,22261,385.5465,908.95
April750,156166,74581,259.5386,267.09
May704,836163,95980,140.0582,690.26
June621,016145,67771,303.7973,398.50
July556,864129,67288,962.8790,658.90
August518,540129,65090,914.23103,478.15
September513,568132,89792,758.1194,936.16
October654,676155,423105,968.83110,214.06
November657,448151,709104,305.16108,992.15
December628,056145,56899,399.36102,620.98
TOTAL7,476,7441,773,659989,765.151,035,825.30
Table 7. Optimal sizing for the three cases considered in the study.
Case StudyFirst CaseSecond CaseThird Case
SystemDGPV/Wind/DG/BatteryPV/Wind/Battery
COE ($/kWh)0.850.850.85
LPSP (%)000
O&M ($/Year)1,050,348.12561,674.0636,000
Initial capital ($)2.5 M/engine7,320,0004,820,000
Surplus power (%)66.6653.4820
No. of units (DG)31-
No. of units (PV)-15001500
No. of units (wind turbine)-500500
Unit power DG (kW)60002000-
Unit power PV (kW)-15001500
Unit power wind turbine (kW)-500500
Publisher’s Note: MDPI stays neutral with regard to jurisdictional claims in published maps and institutional affiliations.

